
Abstract
Laboratory automation improves test reproducibility, which is vital to patient care in clinical laboratories. Many small and specialty laboratories are excluded from the benefits of automation due to low sample number, cost, space, and/or lack of automation expertise. The Minimum Viable Option (MVO) automation platform was developed to address these hurdles and fulfill an unmet need. Consumer 3D printing enabled rapid iterative prototyping to allow for a variety of instrumentation and assay setups and procedures. Three MVO versions have been produced. MVOv1.1 successfully performed part of a clinical assay, and results were comparable to those of commercial automation. Raspberry Pi 3 Model B (RPI3) single-board computers with Sense Hardware Attached on Top (HAT) and Raspberry Pi Camera Module V2 hardware were remotely accessed and evaluated for their suitability to qualify the latest MVOv1.2 platform. Sense HAT temperature, barometric pressure, and relative humidity sensors were stable in climate-controlled environments and are useful in identifying appropriate laboratory spaces for automation placement. The RPI3 with camera plus digital dial indicator logged axis travel experiments. RPI3 with camera and Sense HAT as a light source showed promise when used for photometric dispensing tests. Individual well standard curves were necessary for well-to-well light and path length compensations.
Introduction
Manually performed laboratory tests are dependent on many user parameters, including pipetting pace, angle of inclination, immersion depth, waiting period, and tip prewetting procedure. Environmental conditions such as temperature, atmospheric pressure, and humidity affect liquid handling accuracy and precision. 1 Given that 60%–70% of clinical decisions are made based on laboratory results, 2 variable test results are one set of factors that can contribute to medical and diagnostic errors. Medical errors have been estimated to be the third leading cause of death in the United States. 3 Diagnostic errors accounted for 35.2% of U.S. malpractice claims over a 25-year period. 4 In one laboratory, serological assay variability performed by a professional technician was higher and broader (7.9%–22.8%) than that of testing performed by automation (4.9%–6.6%). 5 The use of automation to reduce user variability, thereby increasing assay reproducibility, is well established and frequently discussed as a means to improve clinical assays and patient care. 6
Laboratory automation is available in a wide variety of sizes and functions, to include task-specific or multitask capabilities. Task-targeted automation performs a single task, such as lid decapping. Total laboratory automation systems perform a number of functions and are generally sample in, answer out. Financial justification for task-targeted automation systems requires a minimum of 500 samples per day, and total laboratory automation systems require a minimum of 1000 samples per day. 7 Clinical automation systems can cost from $125,000 to $350,000; fully automated systems can run into the millions of dollars. 8 Selecting a total laboratory automation system requires significant staff and time commitments. One clinical chemistry laboratory assembled a committee of 14 people from 8 different departments, which held bimonthly meetings over 14 months. 9
Many small and specialty clinical laboratories are excluded from automation due to low sample number, cost, space, and/or lack of automation expertise. The Minimum Viable Option (MVO) was developed to overcome these limitations. The platform is a preprogrammed, out-of-the-box system intended to be given or sold to the end user for a nominal fee by reagent manufacturers. The platform has enough functionality and flexibility to accommodate many types of assays. Open-source multiaxis motion control software and hardware combined with higher-quality “hobby”-grade automation components were used for cost containment. Lead screws were used for linear motions on all axes to achieve at least 0.1 mm accuracy and precision. Iterative design and prototyping was enhanced with a combination of 3D printing and traditional machining. Internet of Things (IoT) software and hardware were used to evaluate the instrument performance.
Materials and Methods
MVO Automation Iterative Design and Prototyping
Open-source components were used when available, including a four-axis Smoothieboard v1.1 microcontroller with Smoothieware software (www.smoothieware.org), OpenBuilds hardware (openbuildspartstore.com), Raspberry Pi 3 Model B (RPI3), a Raspberry Pi 7-inch touchscreen display (www.raspberrypi.org), and Kivy-smoothie-host software (https://github.com/wolfmanjm/kivy-smoothie-host/tree/add/image). Computer-aided design was performed in Rhinoceros software (Robert McNeel & Associates, Seattle, WA). Custom parts were 3D printed by fused filament fabrication (FFF) on a Trinus 3D printer (Kodama, Inc., San Francisco, CA) with Polymax PLA or PC-Plus (Polymaker, Shanghai, China). Custom-machined parts were made from 6061 aluminum. Bipolar motors were used for X, Y, Z, and pipet motions (OMC Corporation Limited, Nanjung City, China). Other electrical and hardware components were purchased from various manufacturers. Four 300 µL LiteTouch System pipet plungers (Mettler-Toledo Rainin, LLC, San Francisco, CA) were incorporated in the design. All motions were programmed with G codes.
Clinical Assay Proof of Concept
TruSight HLA V1 (Illumina, San Diego, CA) is a clinical next-generation sequencing (NGS) assay used for human leukocyte antigen (HLA) genetic testing prior to bone marrow transplantation. This assay requires a PCR gene amplification step, followed by a post-PCR bead-based purification procedure. Three DNA samples and no DNA (negative) controls were amplified with 8 reactions encompassing 11 different HLA genes. Post-PCR purification procedures were performed on the MVOv1.1 and Microlab NIMBUS workstation (Hamilton Robotics, Reno, NV) and compared. Post-PCR purified products were analyzed for correct size, purity, and quantity using ethidium bromide staining after agarose gel electrophoresis.
IoT Remote Access
Multiple RPI3 units were used for sensor and image data collection and processing. Each unit was remotely controlled by a virtual private network (VPN) over Wi-Fi using VNC Viewer software (RealVNC Ltd., Cambridge, UK).
Environmental Measurements
Temperature, barometric pressure, and relative humidity were measured and logged every second using an RPI3 and Sense Hardware Attached on Top (HAT) (www.raspberrypi.org). The Sense HAT was attached by a 40-pin ribbon cable to the RPI3 to minimize heat effects from the central processing unit (CPU). Temperatures were collected from both the barometric pressure sensor and relative humidity sensor. Temperatures were compared with data collected using a USB-TC01 with J-type thermocouple (National Instruments, Austin, TX). The USB-TC01 was referenced against a certified thermometer and found to read 0.1 °C higher at 20.8 °C.
Environmental measurements were collected and compared in two locations over 8 h. Location 1 was a basement laboratory with no windows. Location 2 was the adjacent basement room in front of a window, which received varying amounts of sunlight during the day.
X-, Y-, and Z-Axis Accuracy and Precision
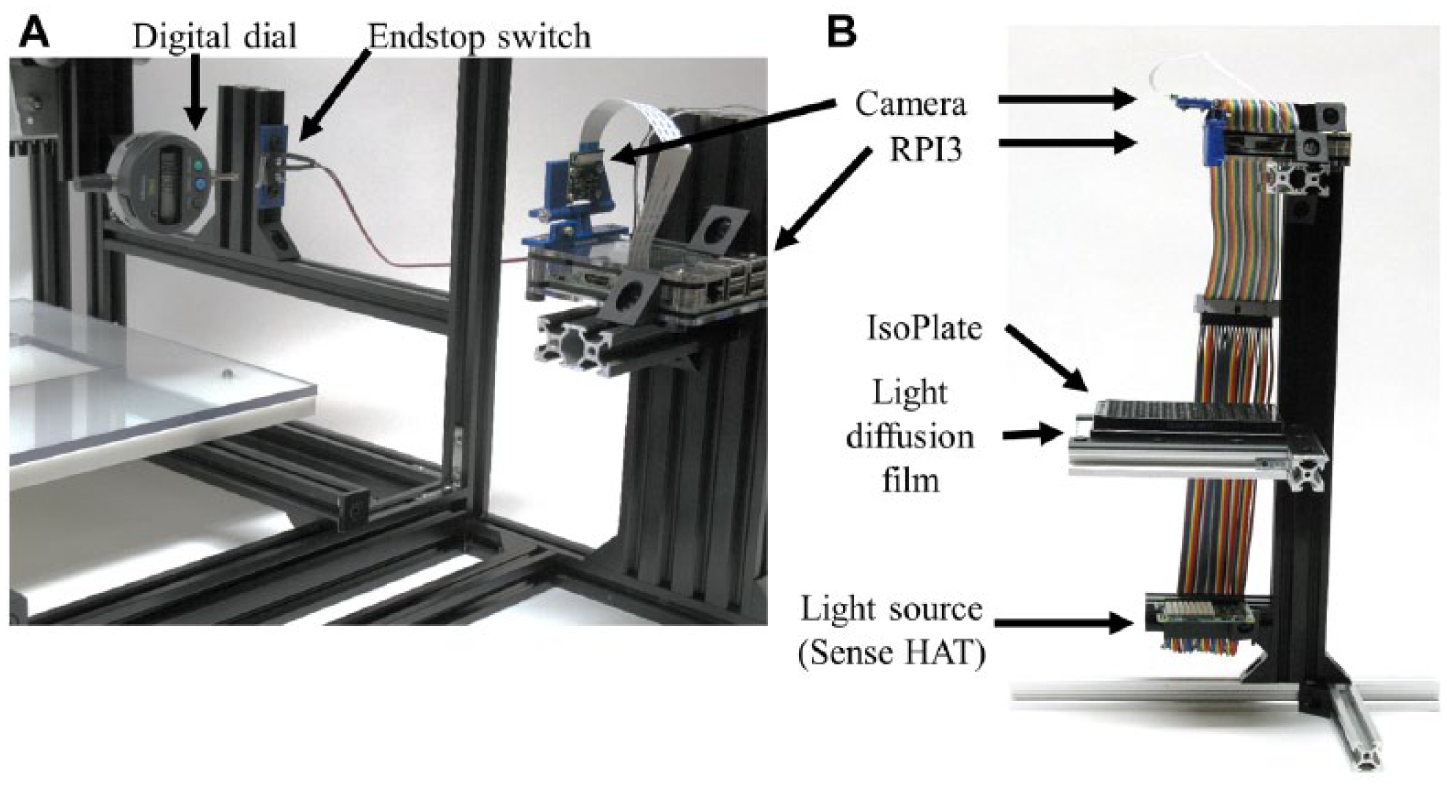
A digital dial indicator (Part 543-793, Mitutoyo, Kanagawa, Japan) with 0.003 mm accuracy was used to calculate the accuracy, backlash, and precision of the X, Y, and Z axes. The indicator was attached to the axis of interest and incremented multiple times by +0.1 mm and then –0.1 mm with a pause between movements. A Pi Camera Module V2 (www.raspberrypi.org) was attached to the RPI3 case by a custom FFF printed holder (https://www.thingiverse.com/thing:2814623). The camera lens was adjusted from factory specifications to focus close images. A video was taken of the dial indicator during all movements. Accuracy and backlash for each axis were calculated. In a second set of experiments, a mechanical end-stop switch was attached to the instrument frame and wired to the general-purpose input/output (GPIO) pins on an RPI3 ( Fig. 1A ). A picture of the dial indicator was taken upon depression of the end-stop switch. Twenty repeat movements from home to a final position (355, 220, and 100 mm for X, Y, and Z axes, respectively) and 20 repeat measurements from an axis point (178, 150, and 39 mm for X, Y, and Z axes, respectively) to a final position were tested for each axis. Precision was calculated for each axis.
(
Pipet Performance
The MVOv1.2 was used to dispense yellow food coloring (McCormick & Company, Inc., Sparks, MD) solutions at 5 µL (3.5 µL food coloring:100 µL H2O stock solution) and 50 µL (0.35 µL food coloring:100 µL H2O stock solution) into manually dispensed water for a final volume of 300 µL. Low-retention 300 µL pipet tips (Mettler-Toledo Rainin, LLC, San Francisco, CA) were changed after each aspirate/dispense cycle. All testing was performed in clear-bottom, black-frame, 96-well isoplates (Product 6005020, PerkinElmer, Waltham, MA). The plate layout included columns 2–5 corresponding to tips 1–4, respectively, for 5 µL testing. Columns 6 and 7 included manually dispensed volumes of 2–8 µL, blank and 35, 40, 45, 50, 55, 60, and 65 µL, blank, respectively, for 5 and 50 µL standard curve measurements. Columns 8–11 corresponded to tips 1–4, respectively, for 50 µL testing. Additional standard curves for each well were generated using 3, 5, and 7 µL for the 5 µL dispensing and 45, 50, and 55 µL for the 50 µL dispensing in separate isoplates. Environmental conditions during testing were room temperature at 19.6 °C, relative humidity at 51.0%, and barometric pressure at 1021.5 hPa.
Photometric measurements of the yellow dye were performed with two systems. System 1 used an ELx800 absorbance microplate reader (BioTek, Winooski, VT) at 405 nm. System 2 used the RPI3 with Pi Camera Module V2 with Sense HAT blue light-emitting diodes (LEDs) and two sheets of light-diffusing film (Part 23114-05, Inventables, Chicago, IL) ( Fig. 1B ). External light sources were excluded during image acquisition with a box enclosure. Camera settings were standardized to eliminate run-to-run variability: resolution = (1920, 1080), contrast = 50, brightness = 50, awb_gains = (Fraction [400, 256], Fraction [200, 256]), iso = 500, and shutter_speed = 33205.
A standard curve with background correction was used for the microplate 405 nm results. Images from system 2 were analyzed in Python3 with OpenCV (https://opencv.org/) on the RPI3. Hough circle transforms were used to determine the central pixel of each well. The blue channel signals from the central and eight surrounding pixels were trimmed mean averaged as the region of interest (ROI). Empty-well ROI trimmed mean averaged blue channel signals per well were used for background correction.
Mean dispensed volume and percent coefficient of variation (%CV) for all the wells and for each column (tip) per volume were calculated as described in the International Organization for Standardization International Workshop Agreement 15. 10
Results
MVO Builds
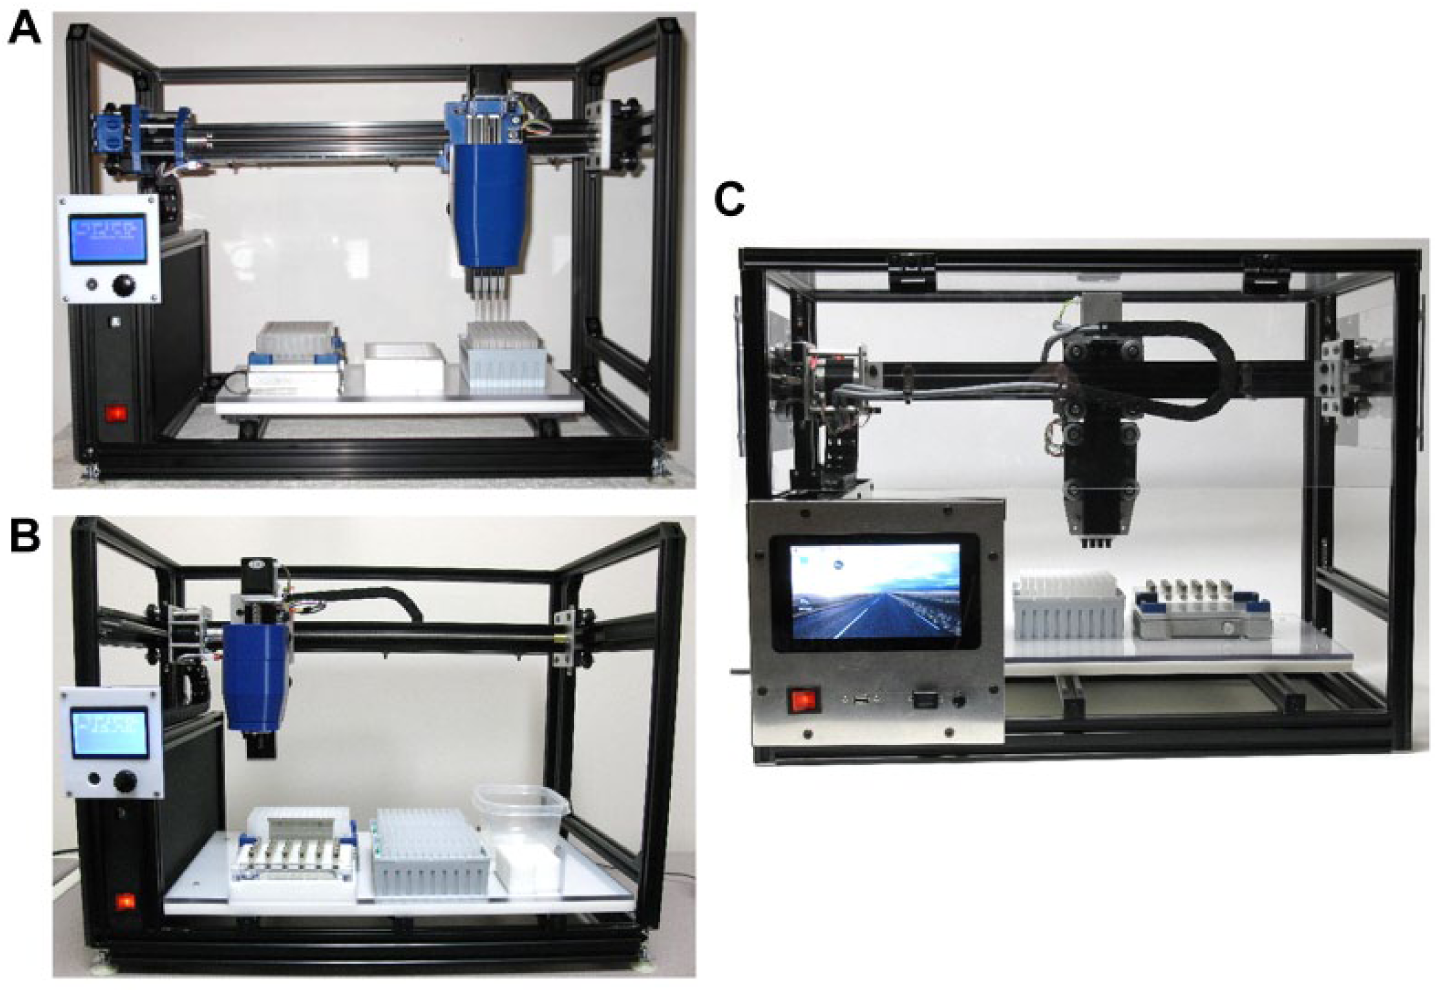
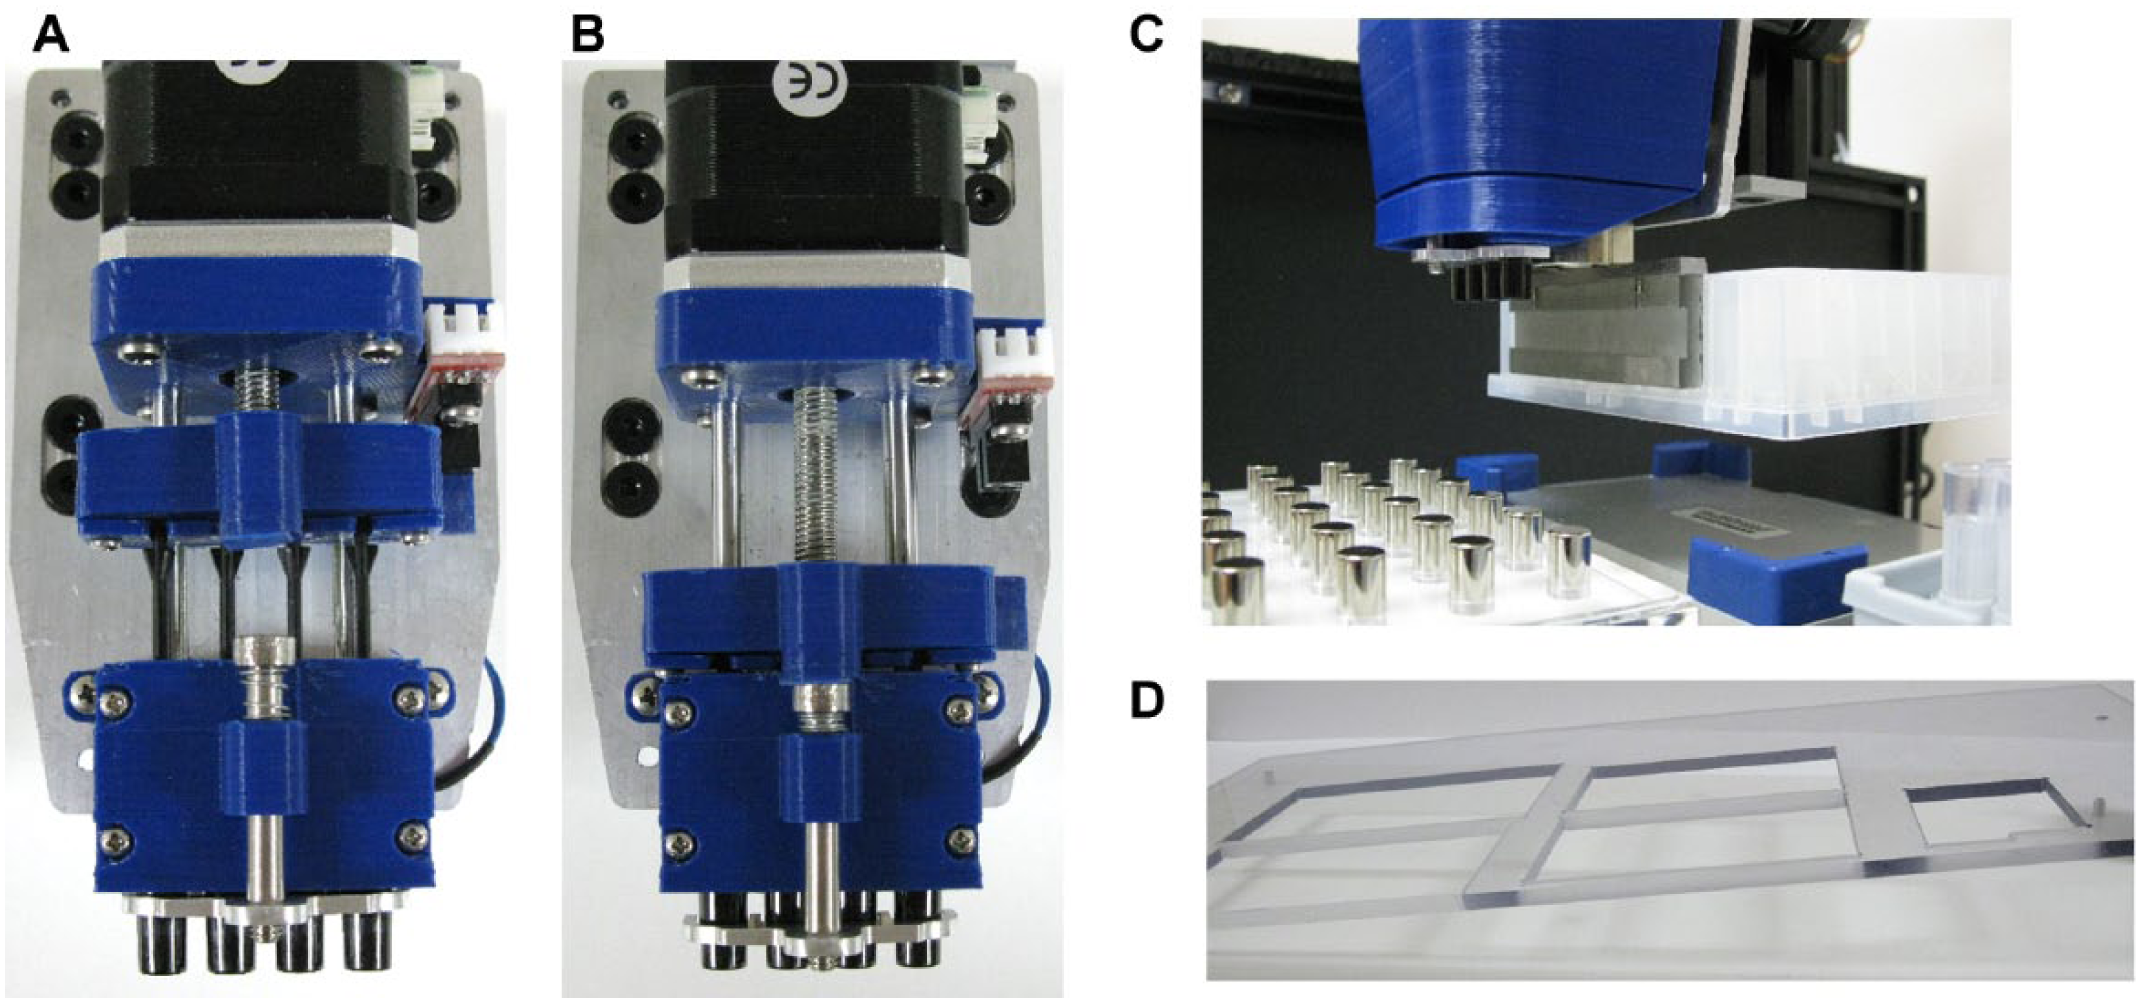
Three iterative MVO versions were built. MVOv1.0 contained multiple 3D printed parts ( Fig. 2A ). Features included an LCD interface, software-controlled commercial shaker (on/off), buzzer control, and removable deck configuration. A combined pipet control and tip dispenser were used to minimize the system complexity ( Fig. 3A , B ). Axis travel speeds were limited to 1200 mm/min. X, Y, and Z 3D printed parts were replaced with aluminum machined parts on MVOv1.1 ( Fig. 2B ). An electromagnet system for moving plates, on-deck magnets, and a larger application-specific deck frame were added ( Fig. 3C , D ). Maximum axis travel speeds were increased to 3000 mm/min. MVOv1.2 added a touchscreen interface and safety shielding ( Fig. 2C ). The Z axis was reversed to face away from the front of the instrument. The reversal moves the pipet components away from the user for additional safety and prevents accidental collision with the touchscreen.
(
The mechanical pipet axis provides a dual purpose for (
Assay Proof of Concept
The MVOv1.1 shaker on/off functions, plate movements, tip pickup/ejection, incubations, audio notifications, and aspirate/dispense commands functioned as expected during the TruSight HLA V1 NGS post-PCR cleanup procedure. Primer dimer and excess PCR components were removed, and the correct PCR fragments were enriched when using the MVOv1.1. Results were comparable to those of the commercial automated system when size, purity, and quantity of PCR fragments were examined ( Fig. 4 ).
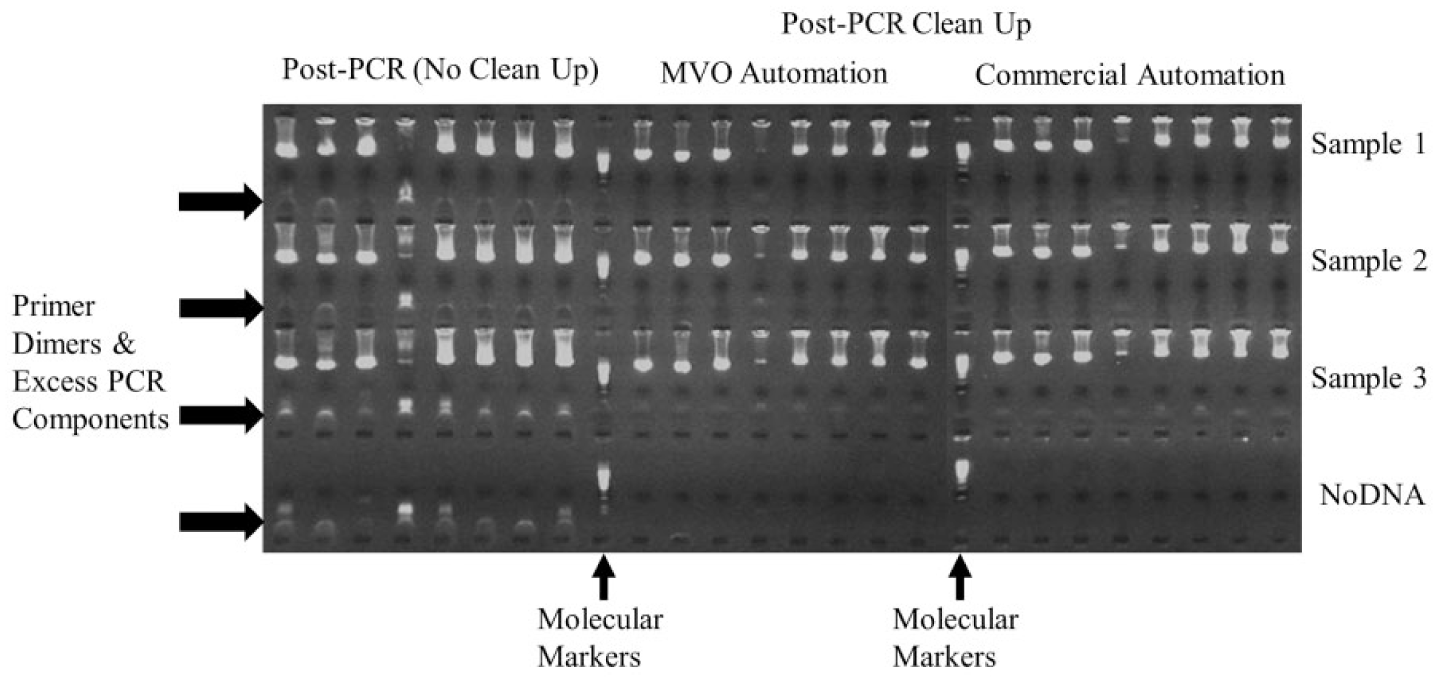
Agarose gel electrophoresis stained with ethidium bromide. DNA from three samples and no DNA (negative control) were amplified by 8 PCRs encompassing 11 HLA loci. Primer dimer and excess PCR components were removed by a bead-based hybridization, washes, and elution procedure. Results between the MVO and the commercial automation system were identical.
Location-Dependent Environmental Measurements
The RPI3 failed to log one reading, on average, every 100 s. Data analysis was corrected between the USB-TC01 and Sense HAT for time correlation. All temperature readings in the no-window room were steady over 8 h. The temperatures from the USB-TC01, Sense HAT humidity sensor, and Sense HAT pressure sensor averaged 18.9, 19.1, and 19.5 °C respectively ( Fig. 5A–C ). USB-TC01 and the Sense HAT humidity sensor differed at most by 0.3 °C. USB-TC01 and the Sense HAT pressure sensor differed at most by 0.7 °C.
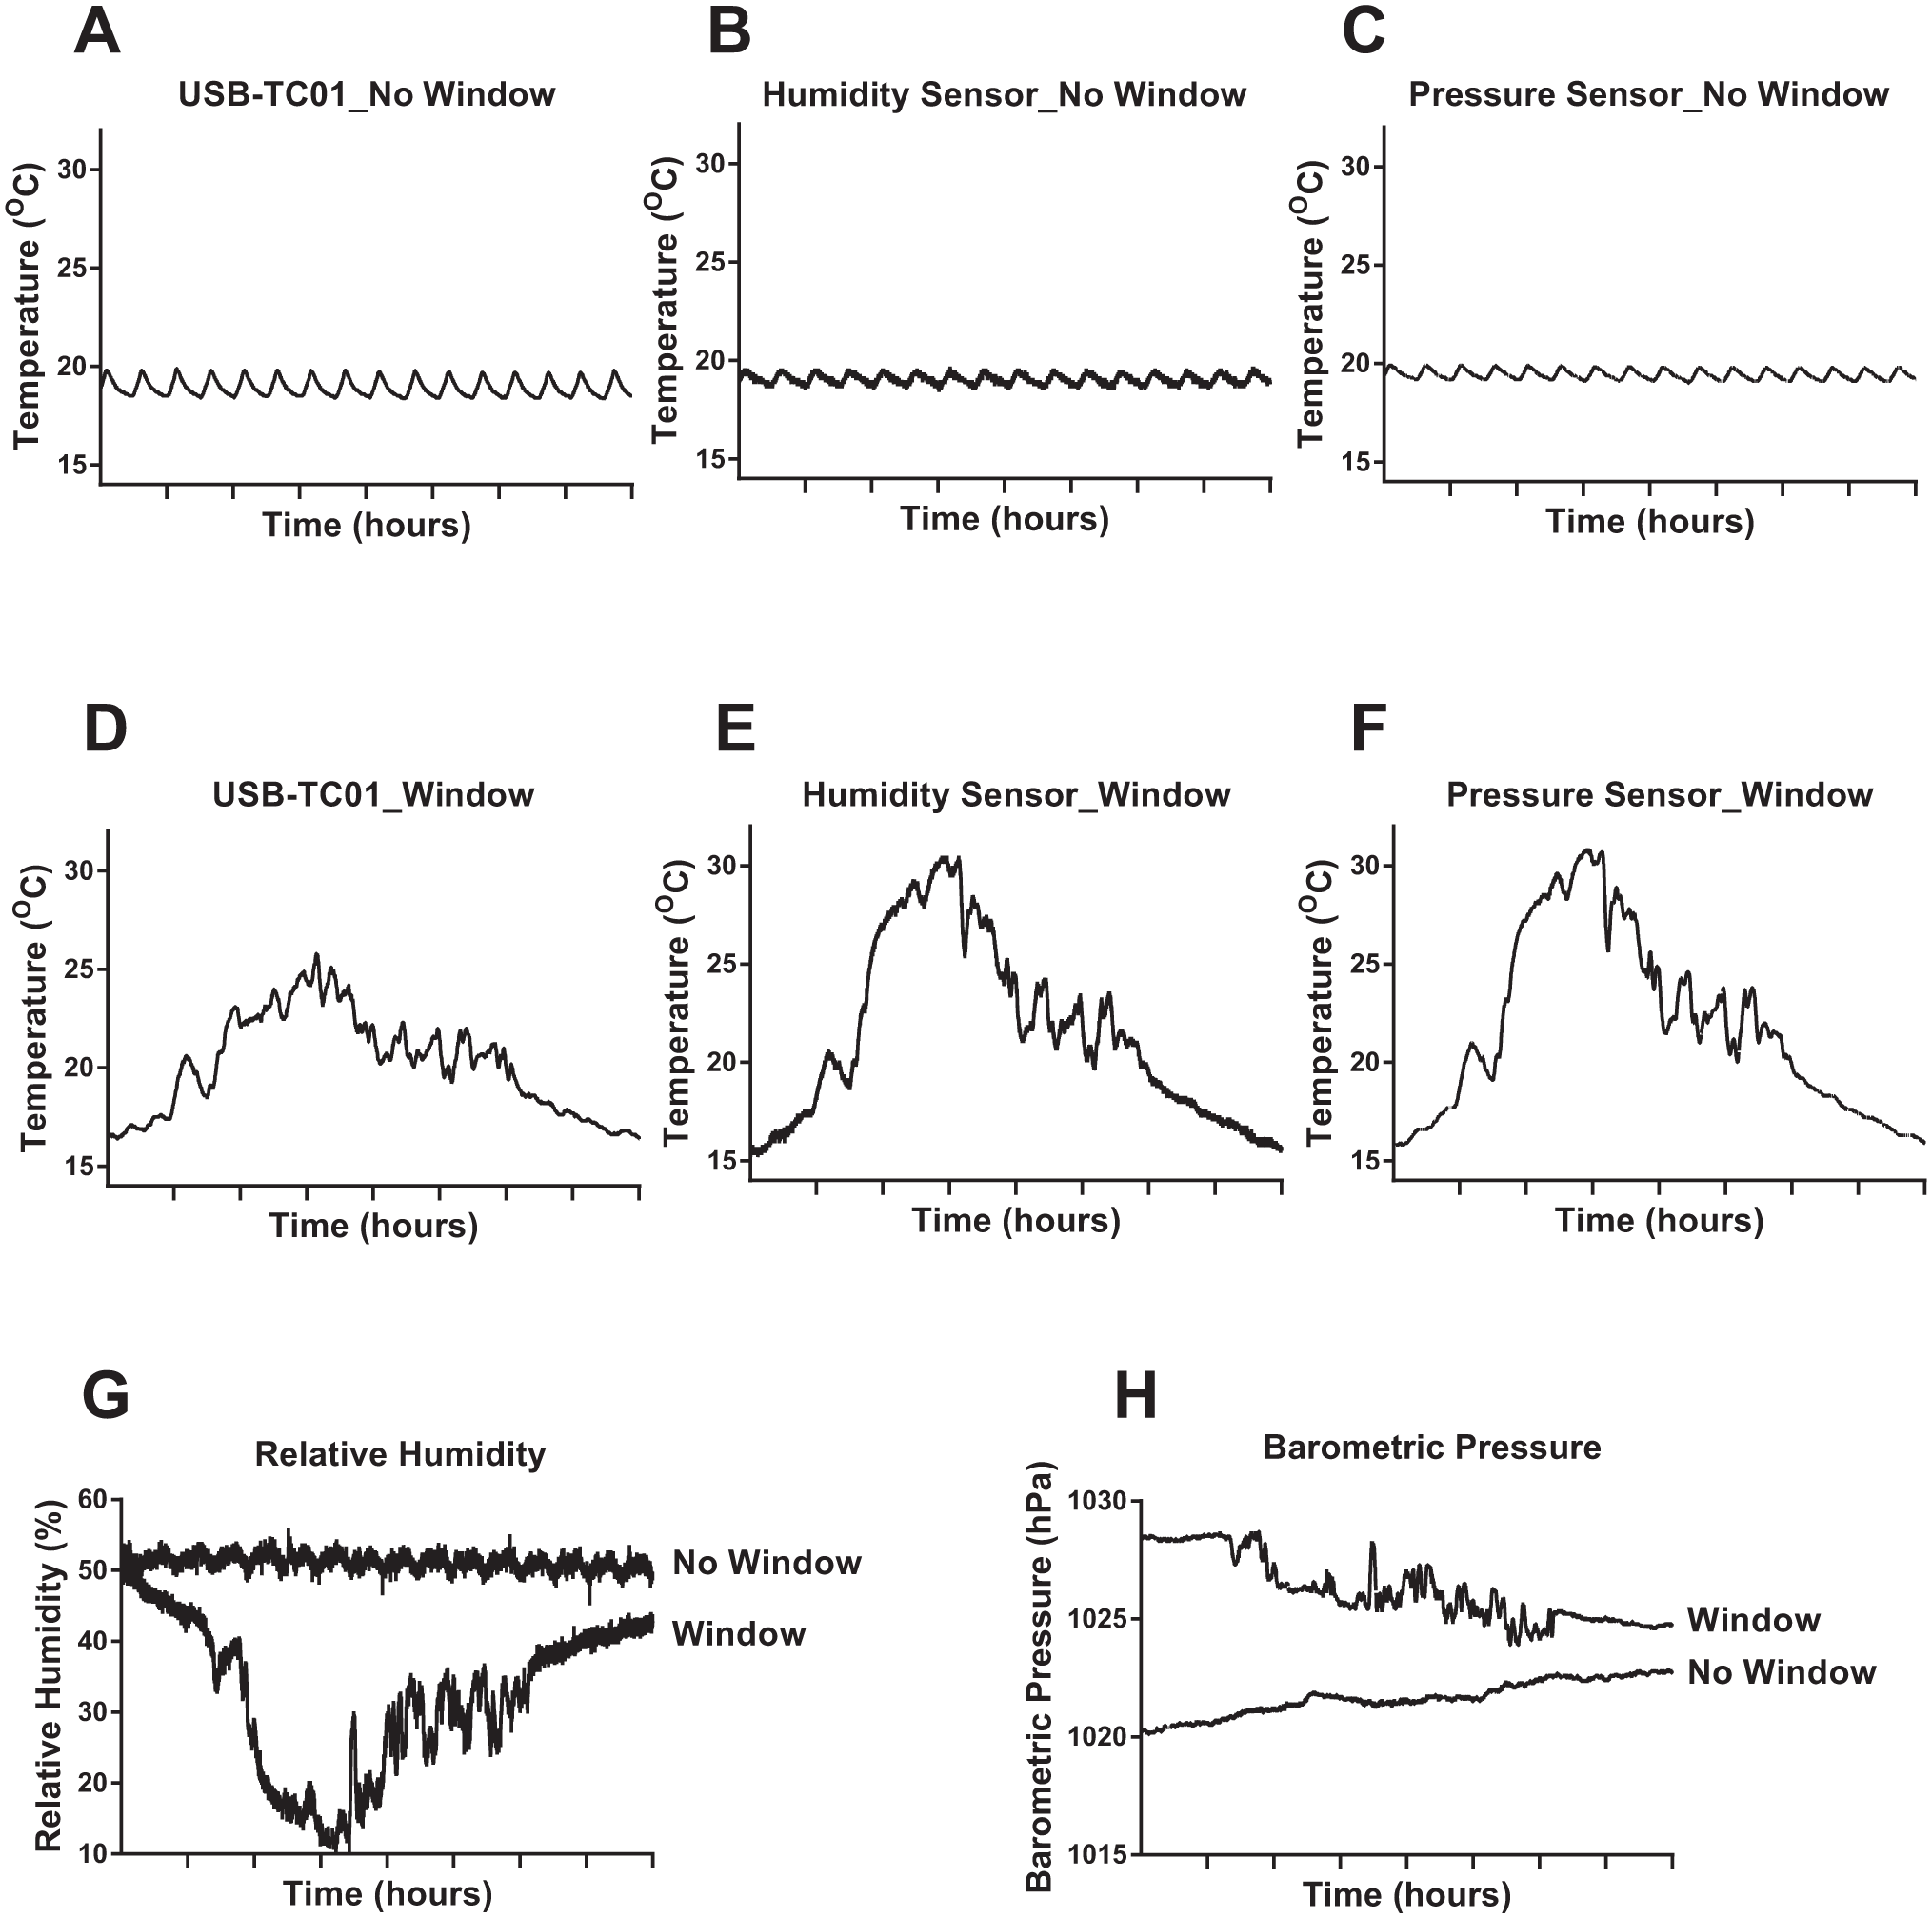
Temperature readings from three sensors were taken over an 8 h time period. (
Temperatures in the windowed room varied with the sunlight intensity over the day. The temperatures between the USB-TC01 to Sense HAT humidity sensor and USB-TC01 to Sense HAT pressure sensor varied by as much as 5 °C, with greater variances in the Sense HAT sensors ( Fig. 5D–F ). Referenced relative humidity and barometric pressure measurement devices were not available. However, the Sense HAT relative humidity and Sense HAT barometric pressure readings were consistent in the no-window room but fluctuated significantly in the window room ( Fig. 5G , H ).
X-, Y-, and Z-Axis Accuracy and Precision
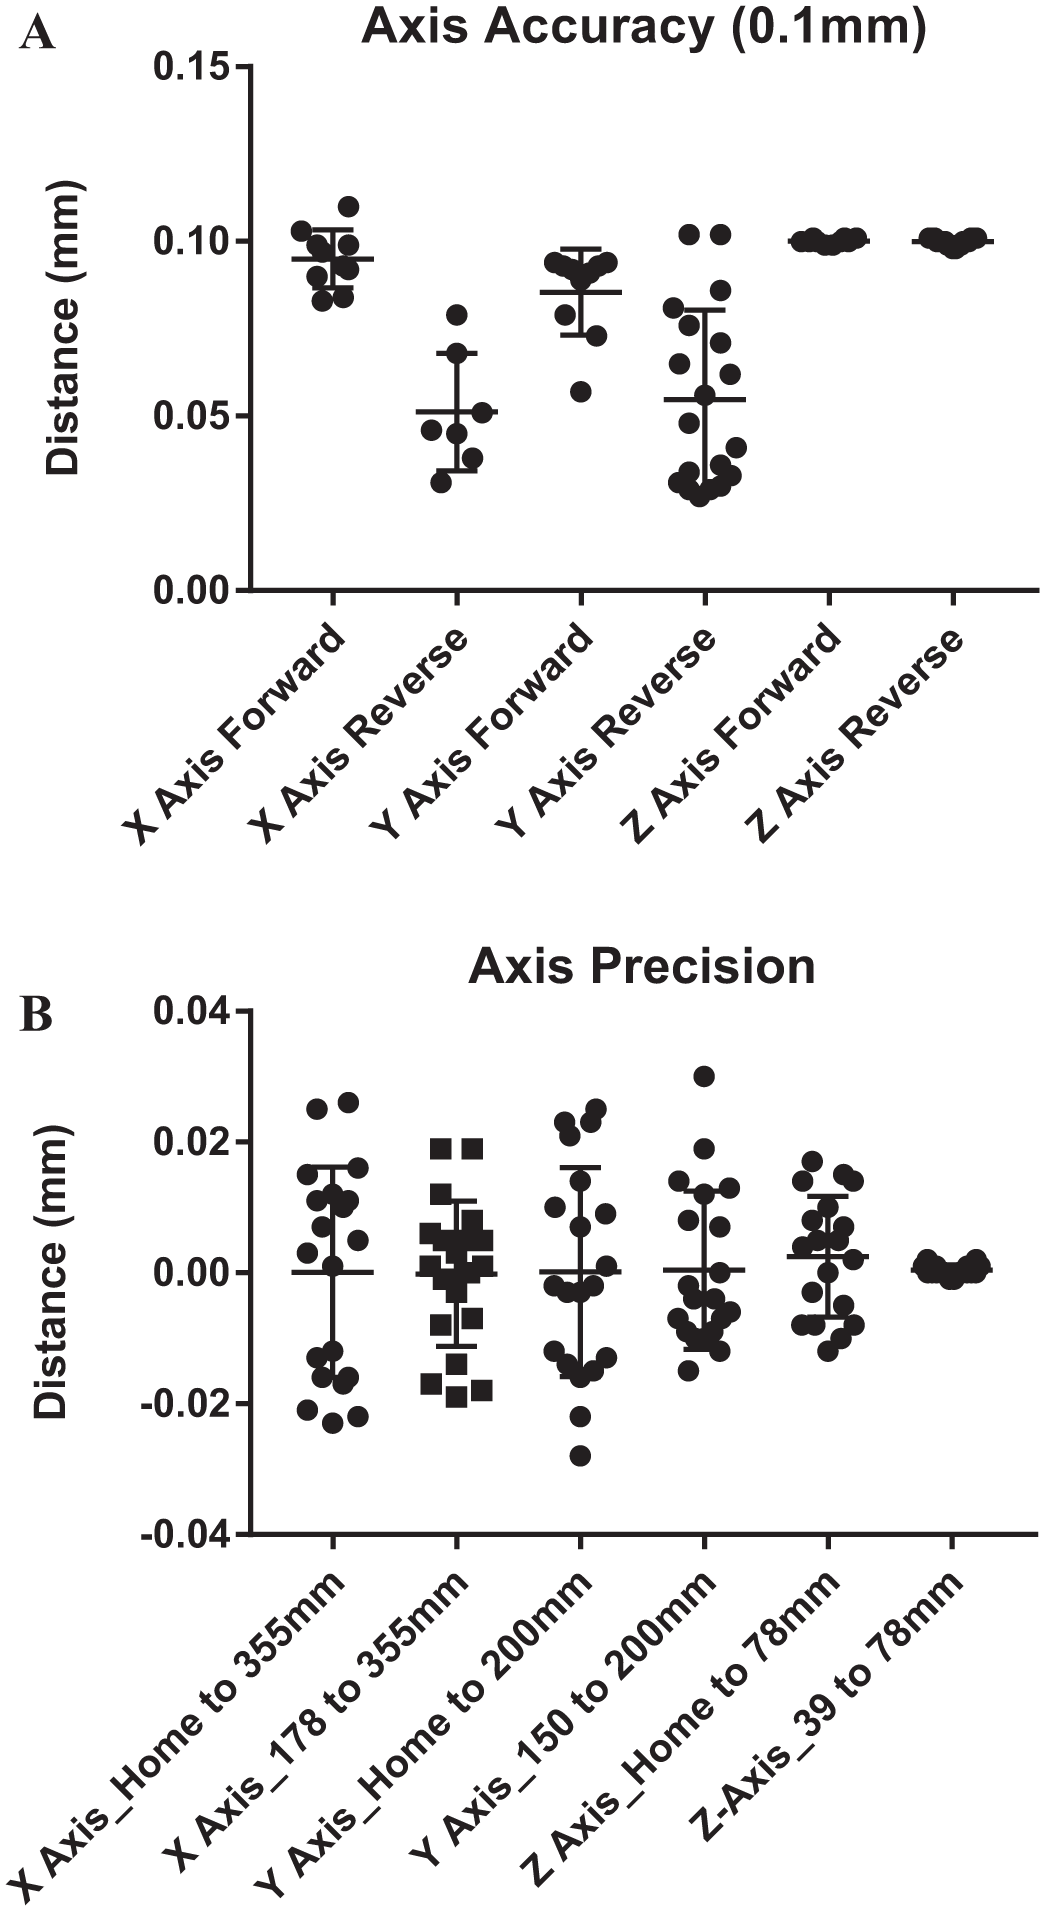
The 0.1 mm accuracy measurements were analyzed for forward and reverse movements. The forward mean movements were 0.095, 0.086, and 0.100 mm, and the reverse mean movements were 0.051, 0.055, and 0.100 mm for the X, Y, and Z axes, respectively ( Fig. 6A ). Backlash was 0.070, 0.070, and 0.006 mm for the X, Y, and Z axes, respectively. X-axis precision was ±0.025 and ±0.019 mm; Y-axis precision, ±0.027 and ±0.023 mm; and Z-axis precision, ±0.015 and ±0.002 mm from home and axis point to final positions, respectively ( Fig. 6B ). The digital dial indicator reading did not require any settling time when used vertically for the Z-axis testing. However, several seconds of settling time was required for the horizontal X- and Y-axis measurements.
(
Photometry Systems Comparison
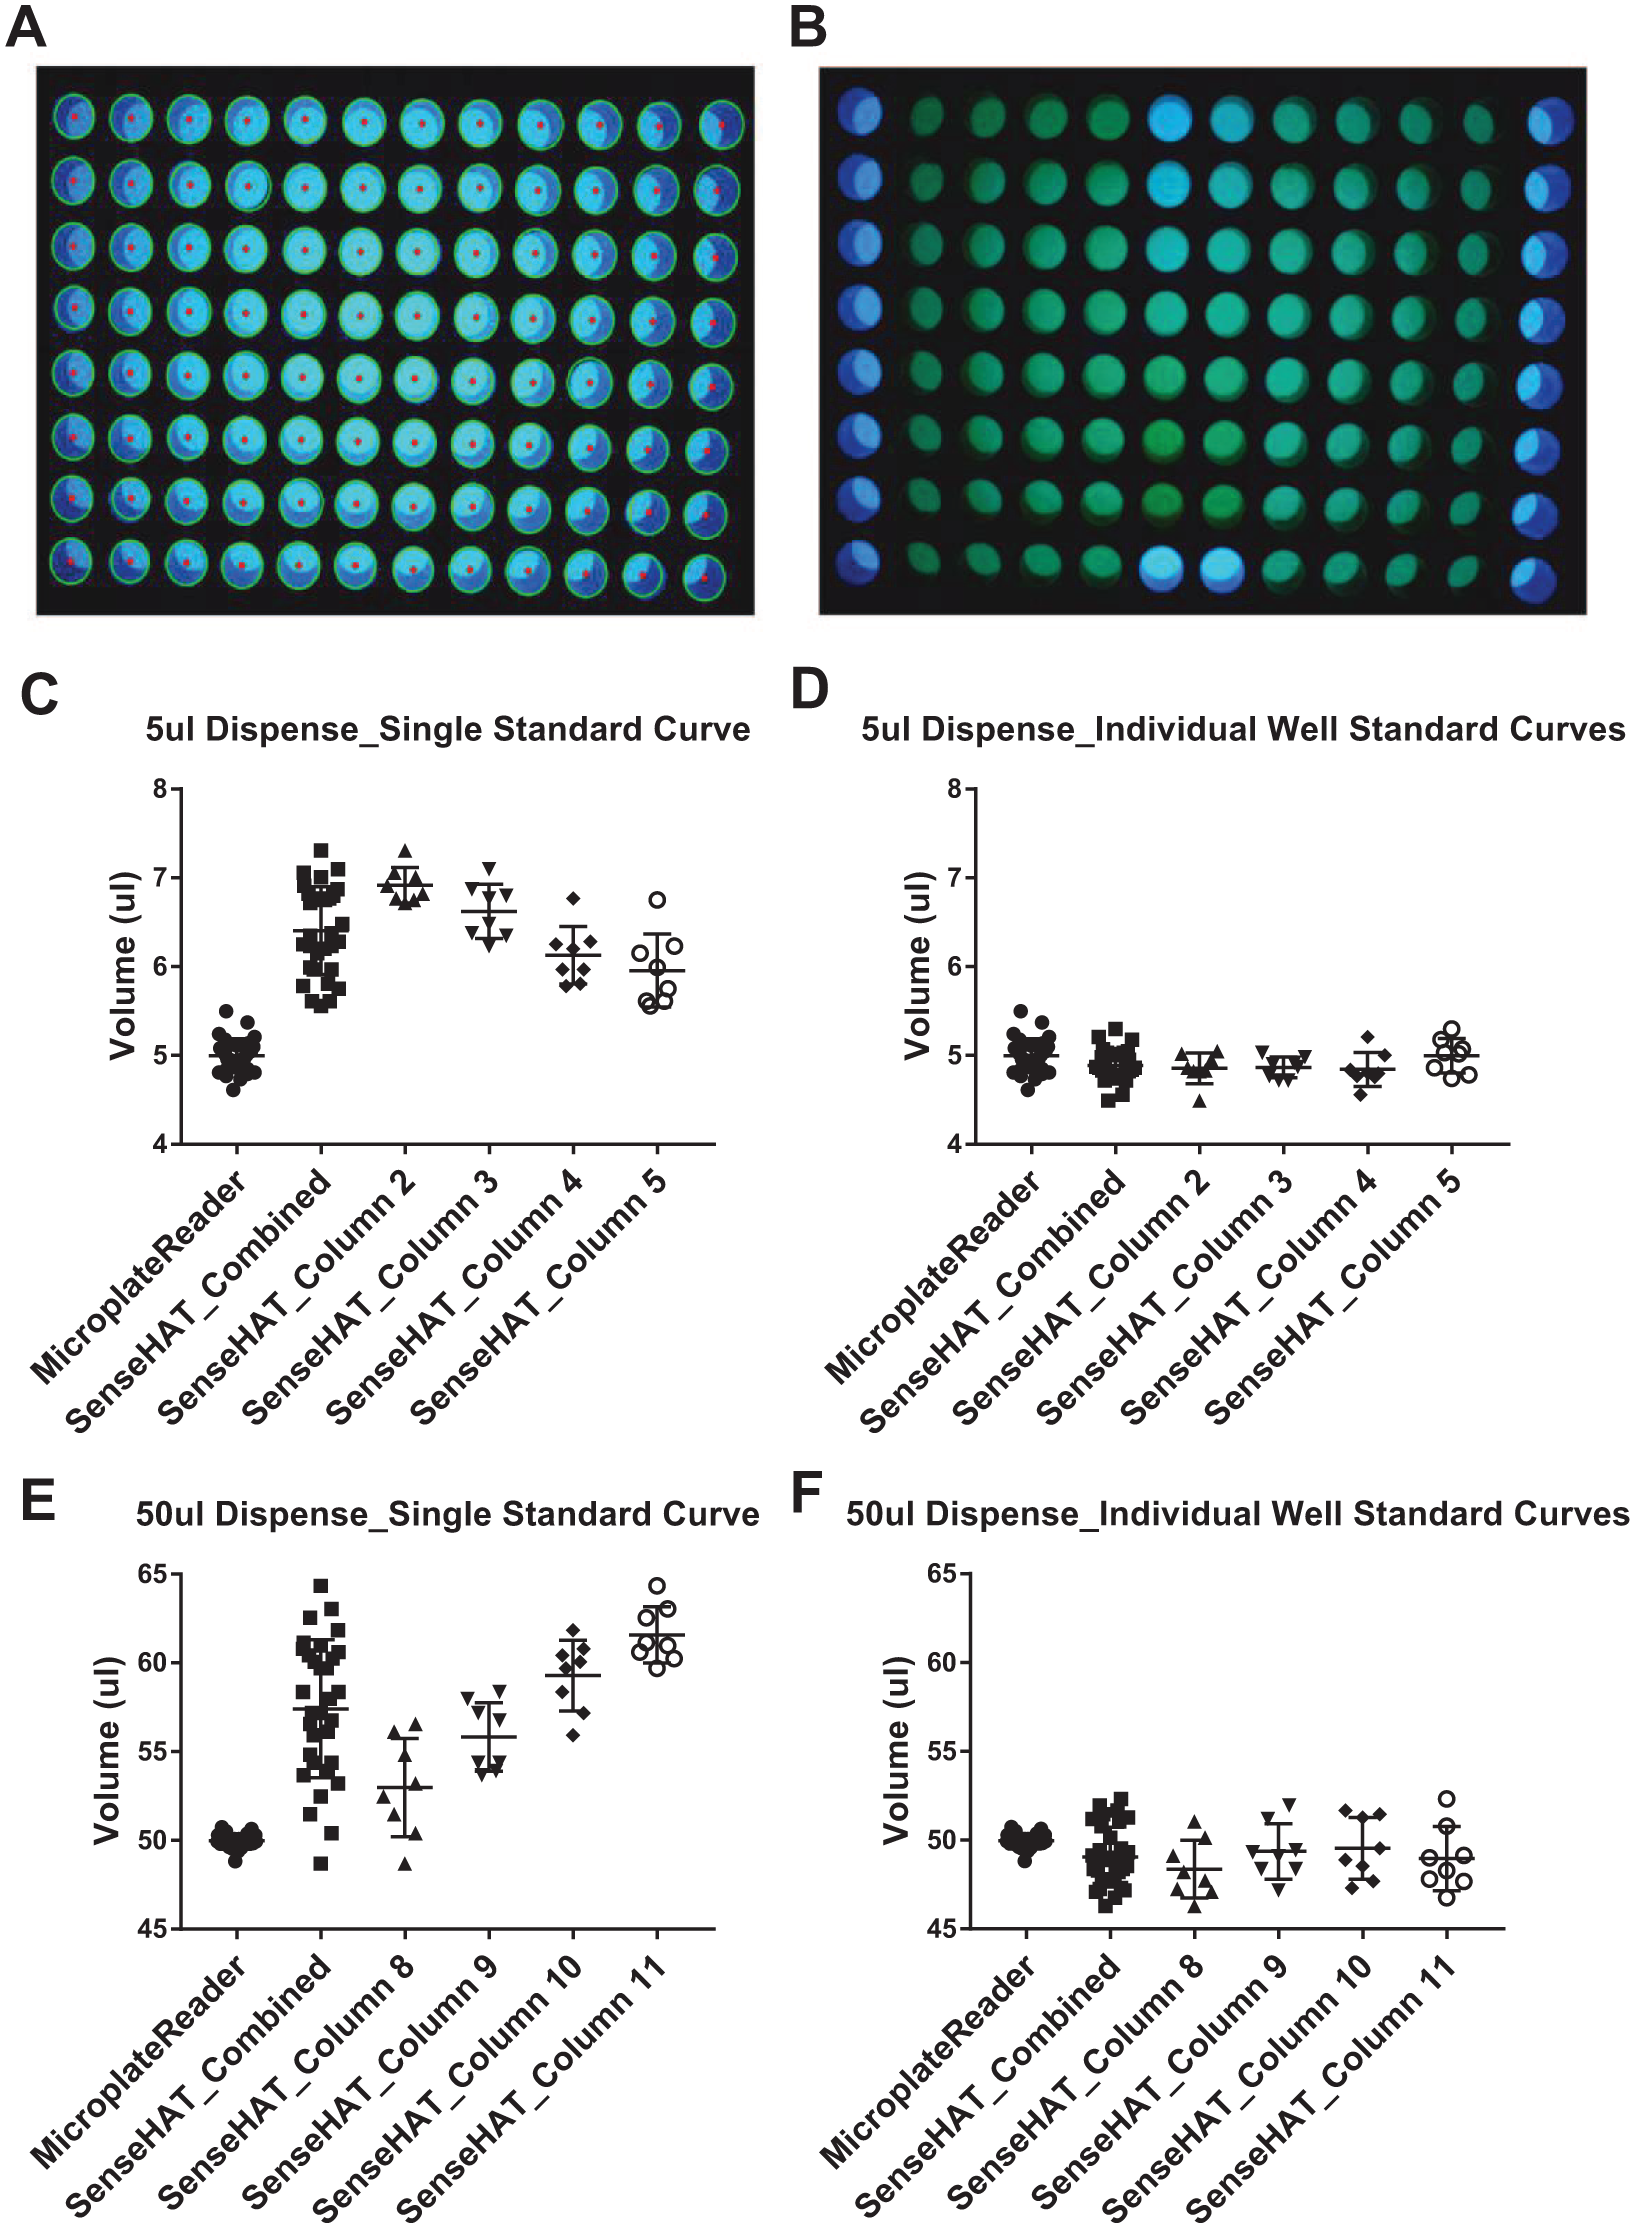
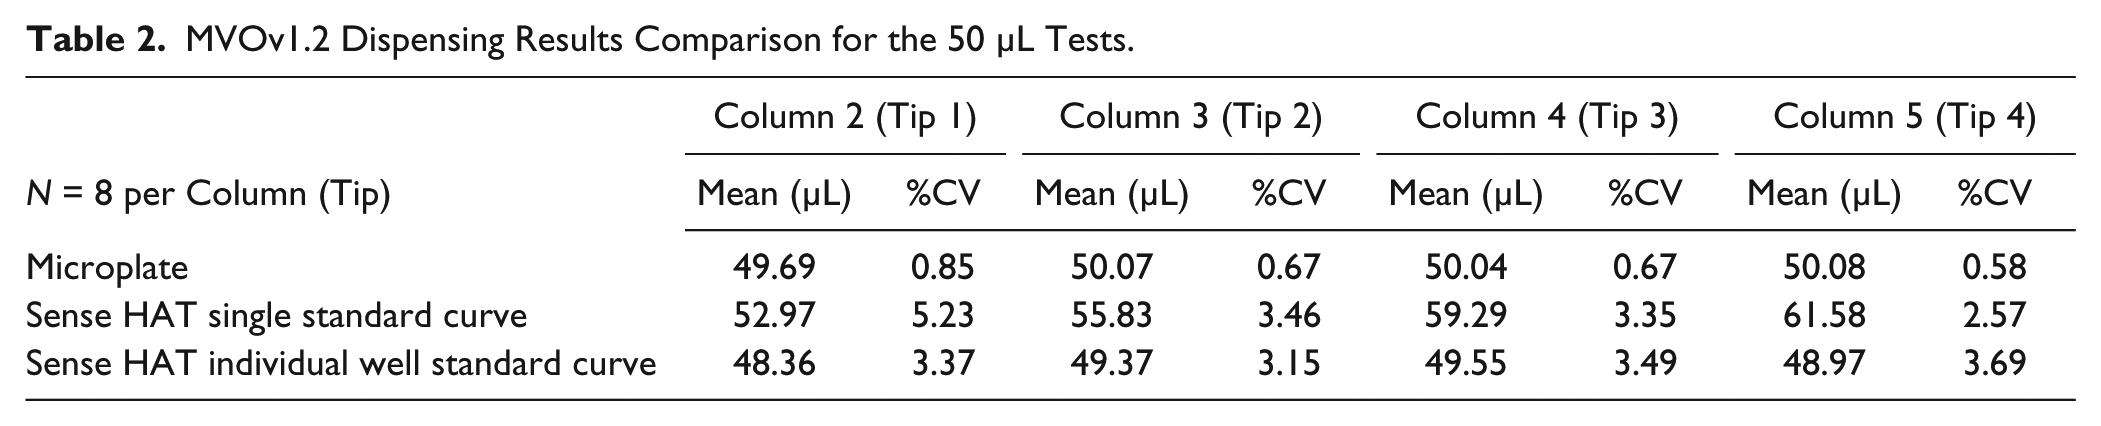
MVOv1.2 pipetting accuracy and precision were determined using photometric detection with yellow food coloring solutions by two methods. A certified microplate reader was used as the first method given the high degree of accuracy and precision for absorbance measurements. The 5 µL dispensing tests over 32 wells yielded a mean of 4.99 µL with 3.8% CV. The 50 µL dispensing tests over 32 wells yielded a mean of 49.97 µL with 0.74% CV.
The RPI3 camera and Sense HAT system was used as a second method for photometric determination. ROI circle and central point detection were analyzed to account for well-to-well light intensity and path length differences (
Fig. 7A
,
B
). The array of Sense HAT LEDs was centered under the manually dispensed standards in columns 6 and 7. Significant variations were seen as the distance from the Sense HAT LEDs increased. Importantly, this effect was observed for both 5 and 50 µL tests (
Fig 7C
,
E
). Three-point reference standards performed in each well further compensated for the light and path length differences (
Fig 7D
,
F
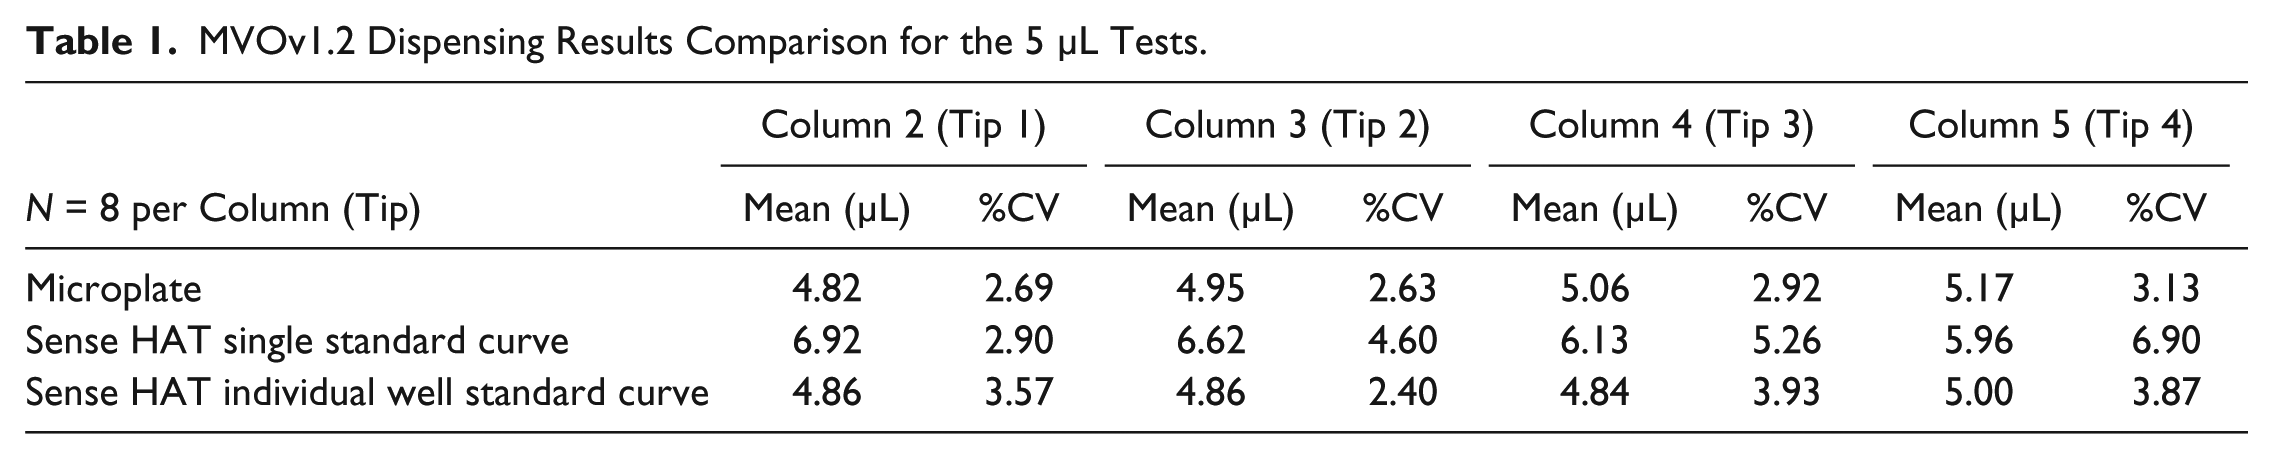
). The compensated mean values were usually lower with higher %CV values than the microplate readings per tip (
(
MVOv1.2 Dispensing Results Comparison for the 5 µL Tests.
MVOv1.2 Dispensing Results Comparison for the 50 µL Tests.
Discussion
The external world can change environmental conditions in localized laboratory spaces, as demonstrated by data obtained in adjacent rooms with and without windows. Intralaboratory environmental conditions can have localized variations due to the facility design, such as relative locations of vents and temperature probes. Seasonal changes can also vary laboratory environments. In the U.S. Mid-Atlantic regions, the humidity dramatically increases in the summer months. The utility of using an RPI3 with Sense HAT to determine proper automation placement within a laboratory is shown in Figure 5 . Moreover, because clinical laboratories require the documentation of environmental parameters that impact assay accuracy and reproducibility, this system could provide logged measurements for regulatory compliance. The Sense HAT could be integrated on the MVO with liquid handling parameters adjusted in real time to account for laboratory-to-laboratory and environmental differences.
The Sense HAT was developed using Raspberry Pi B+. The Raspberry Pi 2 and 3 CPUs produce more heat and can interfere with the accuracy of the temperature sensors. 11 Attempts have been made to utilize a correction factor. However, the amount of heat produced by the CPU is dependent on computing utilization. A better option is to move the Sense HAT away from the CPU.
3D printing was used for rapid design and prototyping iterations of MVO parts and IoT test setups. The MVOv1.0 included many 3D printed parts but had limited travel speed due to the inability to generate accurate 90° angles on the Z motor mount. The 3D printed parts are still utilized on the pipet plunger mechanisms. These parts have complex features but are small and less susceptible to deformation during printing. Testing accessories were easily made, such as a custom camera holder with screw adjustment to ensure proper camera positioning during testing.
The image dispensing analysis from the RPI3 camera with Sense HAT data could be improved by additional optimization. Multiple images by varying camera parameters, such as shutter speed, could compensate for uneven light intensities across the plate. Alternatively, additional dyes could be used for compensation as the Sense HAT has blue, green, and red LEDs and the camera detects the blue, green, and red channels. A similar process is used for well-to-well normalization in real-time thermocyclers that do not have columnar light by spiking each well with a known dye standard. A US$100 RPI3 camera with Sense HAT will never be as accurate and precise as a US$25,000 microplate reader. However, an all-in-one environmental monitoring and volume verification system could be used for daily or prerun qualifications to detect significant errors. The accuracy and precision of the measurement system has to fit the intended use.
IoT devices are easy to use at a residential level. However, the need for data security in hospitals and commercial entities creates added complexity to setting up remote access and is a significant barrier to IoT implementation. Medical organizations are required to protect patient information under the Health Insurance Portability and Accountability Act, commonly known as HIPAA. Significant fines and prison terms can be imposed for violations. In 2013 and 2014, the U.S. Department of Health and Human Services Office of Civil Rights imposed $11,681,000 in fines from 11 institutions for HIPAA violations. 12 IoT devices may need to be on a separate information technology system to ensure HIPAA compliance. Unintentional security violations can occur as remotely transmitted information is often stored by a third-party service provider. Even if IoT data do not contain protected health information, the IoT system could be an access portal to sensitive databases or systems.
The MVO was designed with open-source components for cost containment while being flexible enough for many applications. The MVO is not an open-source project. However, software functions developed for this project were integrated into open-source initiatives. This platform uses an out-of-the-box application ready concept to ensure minimal end-user setup. The MVO is intended to remove the automation barriers and fulfill an unmet need for small or specialty clinical laboratories, thereby increasing the quality of patient care. The 0.1 mm accuracy requirement has been fulfilled for the Z axis. The X- and Y-axis accuracy appears to be more variable but may be an artifact of the horizontal digital dial indictor system. The 0.1 mm precision requirement has been fulfilled for all axes. New developments are being pursued for the next iterative design and build.
Footnotes
Acknowledgements
Special thanks to Annette Jackson and Maria Bettinotti for their support and guidance in this endeavor.
Declaration of Conflicting Interests
The author declared no potential conflicts of interest with respect to the research, authorship, and/or publication of this article.
Funding
The author received no financial support for the research, authorship, and/or publication of this article.