
Abstract
Critical to maintaining quality control in high-throughput screening is the need for constant monitoring of liquid-dispensing fidelity. Traditional methods involve operator intervention with gravimetric analysis to monitor the gross accuracy of full plate dispenses, visual verification of contents, or dedicated weigh stations on screening platforms that introduce potential bottlenecks and increase the plate-processing cycle time. We present a unique solution using open-source hardware, software, and 3D printing to automate dispenser accuracy determination by providing real-time dispense weight measurements via a network-connected precision balance. This system uses an Arduino microcontroller to connect a precision balance to a local network. By integrating the precision balance as an Internet of Things (IoT) device, it gains the ability to provide real-time gravimetric summaries of dispensing, generate timely alerts when problems are detected, and capture historical dispensing data for future analysis. All collected data can then be accessed via a web interface for reviewing alerts and dispensing information in real time or remotely for timely intervention of dispense errors. The development of this system also leveraged 3D printing to rapidly prototype sensor brackets, mounting solutions, and component enclosures.
Introduction
Modern high-throughput screening (HTS) makes use of pressurized-bottle solenoid valve dispensers to rapidly transfer small volumes of liquid into microtiter plates of varying densities. 1 These devices provide accurate liquid-handling capabilities and serve as one of the foundations of HTS. These devices are not infallible, though, and equipment issues can occur. Valves and tips used on these HTS dispensers are considered consumable items intended for periodic replacement when they fail. The primary modes of failure include blocked dispense tips and failed dispense valves, which lead to incorrect volumes being dispensed. Undetected, these errors can lead to significant losses in time or reagents during screening. Therefore, there is a desire for real-time quality control (QC) of these processes as they occur.2–5
One QC solution to this challenge is manual operator intervention. A human operator can pause the robotic system temporarily to remove the microtiter plate in question and transport it to an analytical balance. Once at the balance, the operator is able to take weight measurements before and after dispenses to ensure their accuracy. This method has the disadvantage, however, of slowing down throughput and potentially introducing human error. A second approach to this problem involves robotically integrating inline process-monitoring systems to verify the quality of dispenses.6,7 This method involves the use of designated weigh stations installed in the HTS robotic environment. These stations allow the robot to weigh plates before and after reagent dispenses to ensure the correct volume of reagent is being added at each step. This means that for each individual dispense step, the plate must be moved to a stand-alone weigh station twice, once prior to dispensing and then once again after dispensing. The downside of this method is that these movements to and from discrete weigh stations take additional time and potentially create bottlenecks in the HTS system.
The automated weighing system presented here, referred to internally as Just Another Monitoring System (JAMS), represents an Internet of Things (IoT)-based solution to address these problems. This system leverages open-source software and electronics, alongside 3D printing, to implement a novel automated dispense-weighing system without the requirement of discrete robot-accessible weigh stations. Open science solutions have proven to be an area of interest, with many investigators in the field discovering opportunities to solve problems that previously required expensive proprietary solutions.8–16
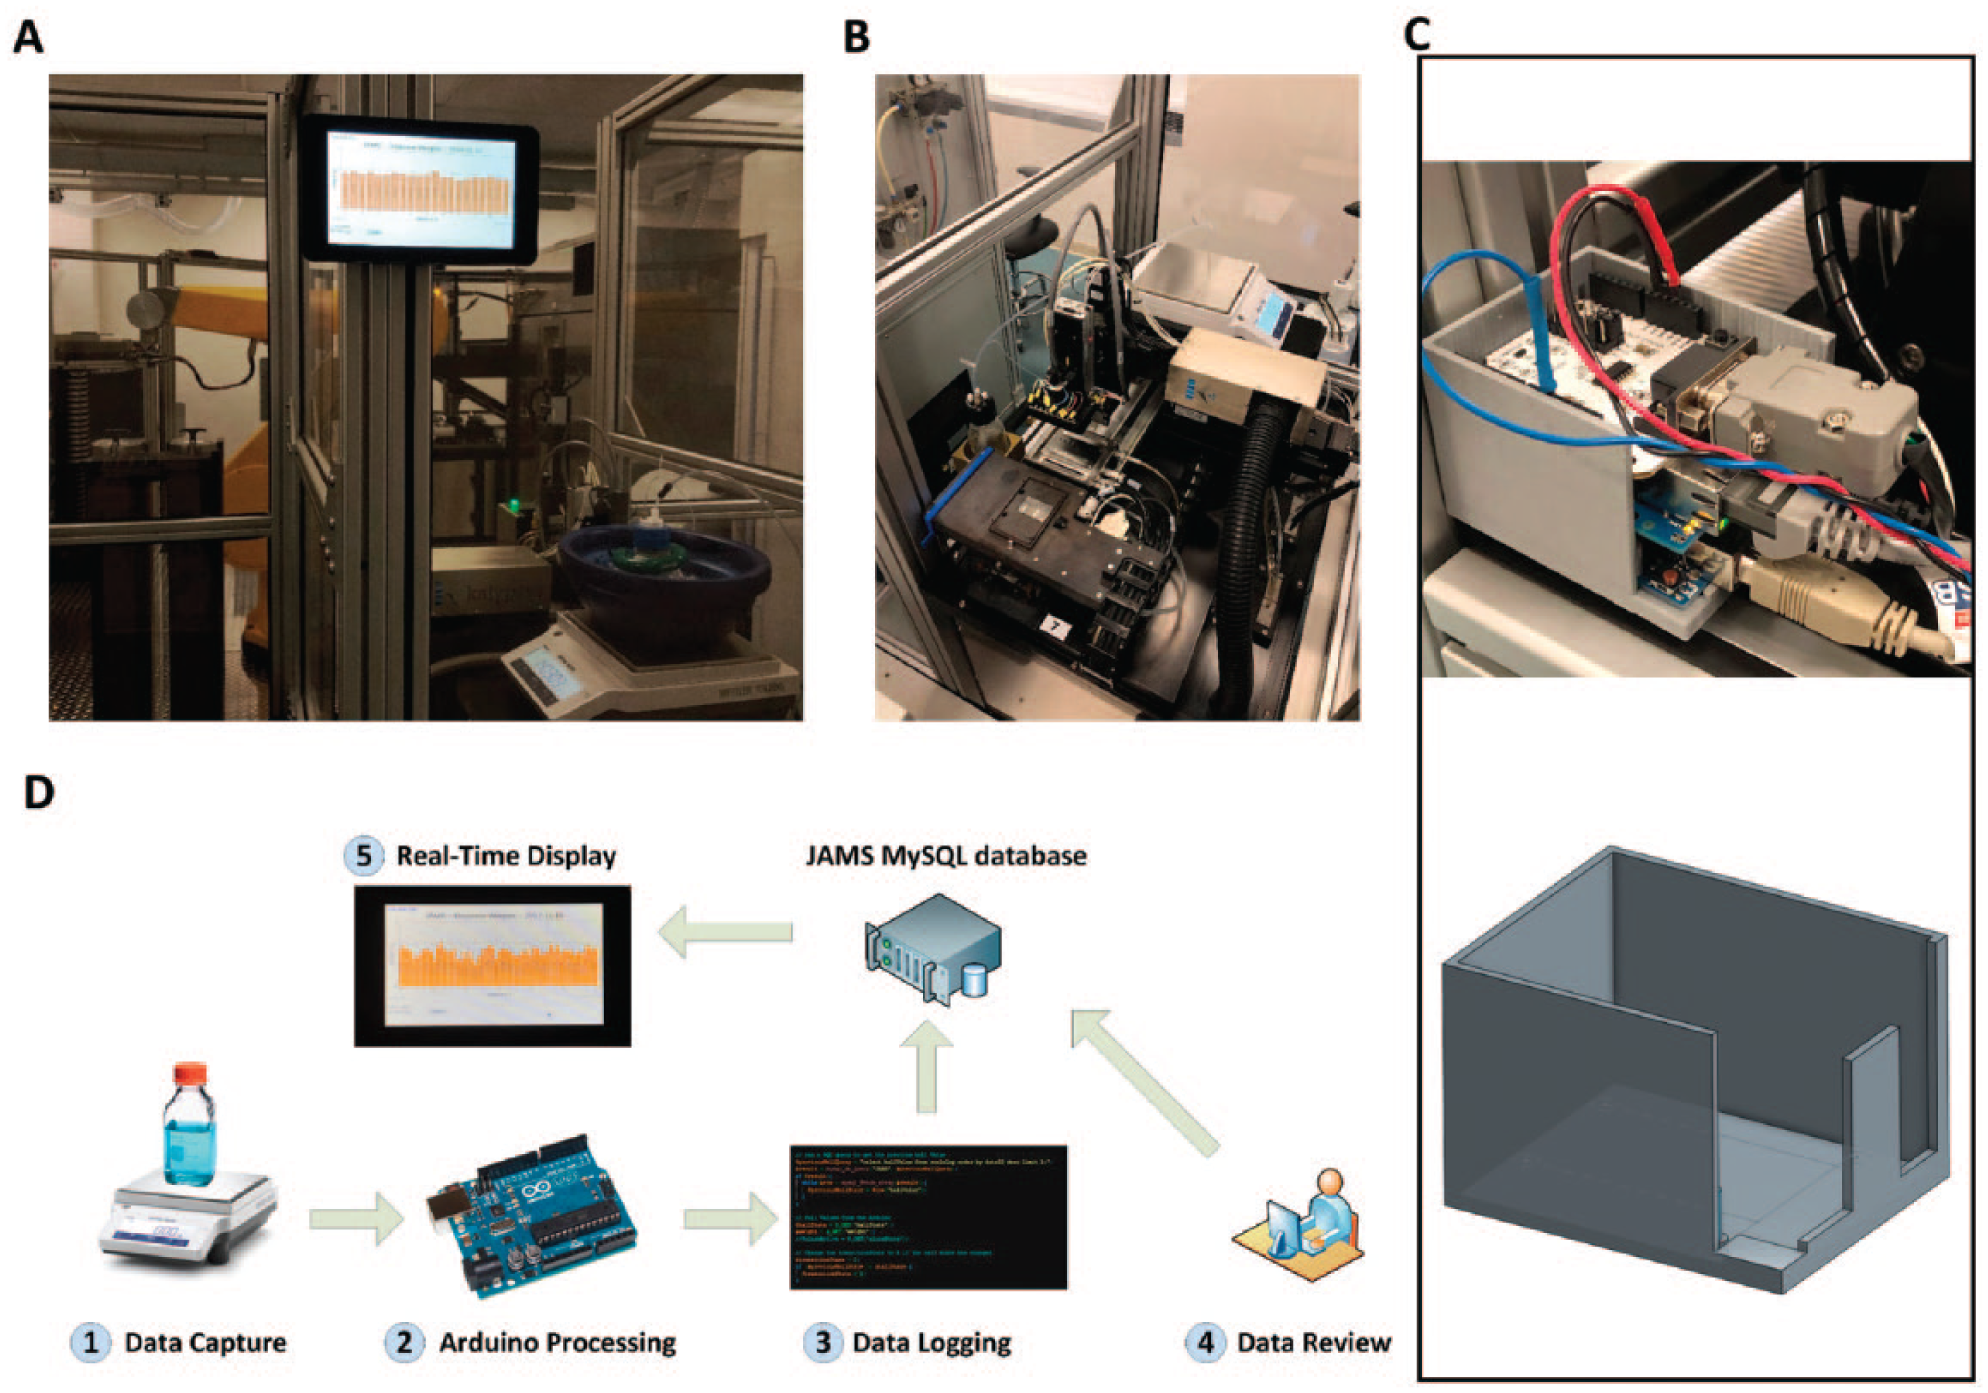
The JAMS platform, an overview of which is seen in Figure 1 , accomplishes the goal of dispense QC by integrating the weighing process directly with the reagent bottles, which are mounted on a precision balance. A sensor is mounted to the dispenser platform to detect when dispenses occur, and the data from the balance is continuously output and stored by an Arduino 17 into a database. After a dispense operation is finished, the database is queried, and the weight before and after is compared to gravimetrically obtain the amount of liquid dispensed. The key advantage of this system is it does not disrupt the HTS process. No additional automated steps are needed to measure the dispense volume. Because the weight is processed immediately after the dispense finishes, any errors in the measurement can be detected in real time, and error notifications can be sent to relevant personnel. Finally, the system offers an easy method of data review. A web-based interface allows easy access to interact with and monitor the system over any local computer or mobile device that is connected to the Scripps Network. With all the balance data stored in a database, the data can be viewed at a later time to review dispenser function throughout the course of an assay.
(
Materials and Methods
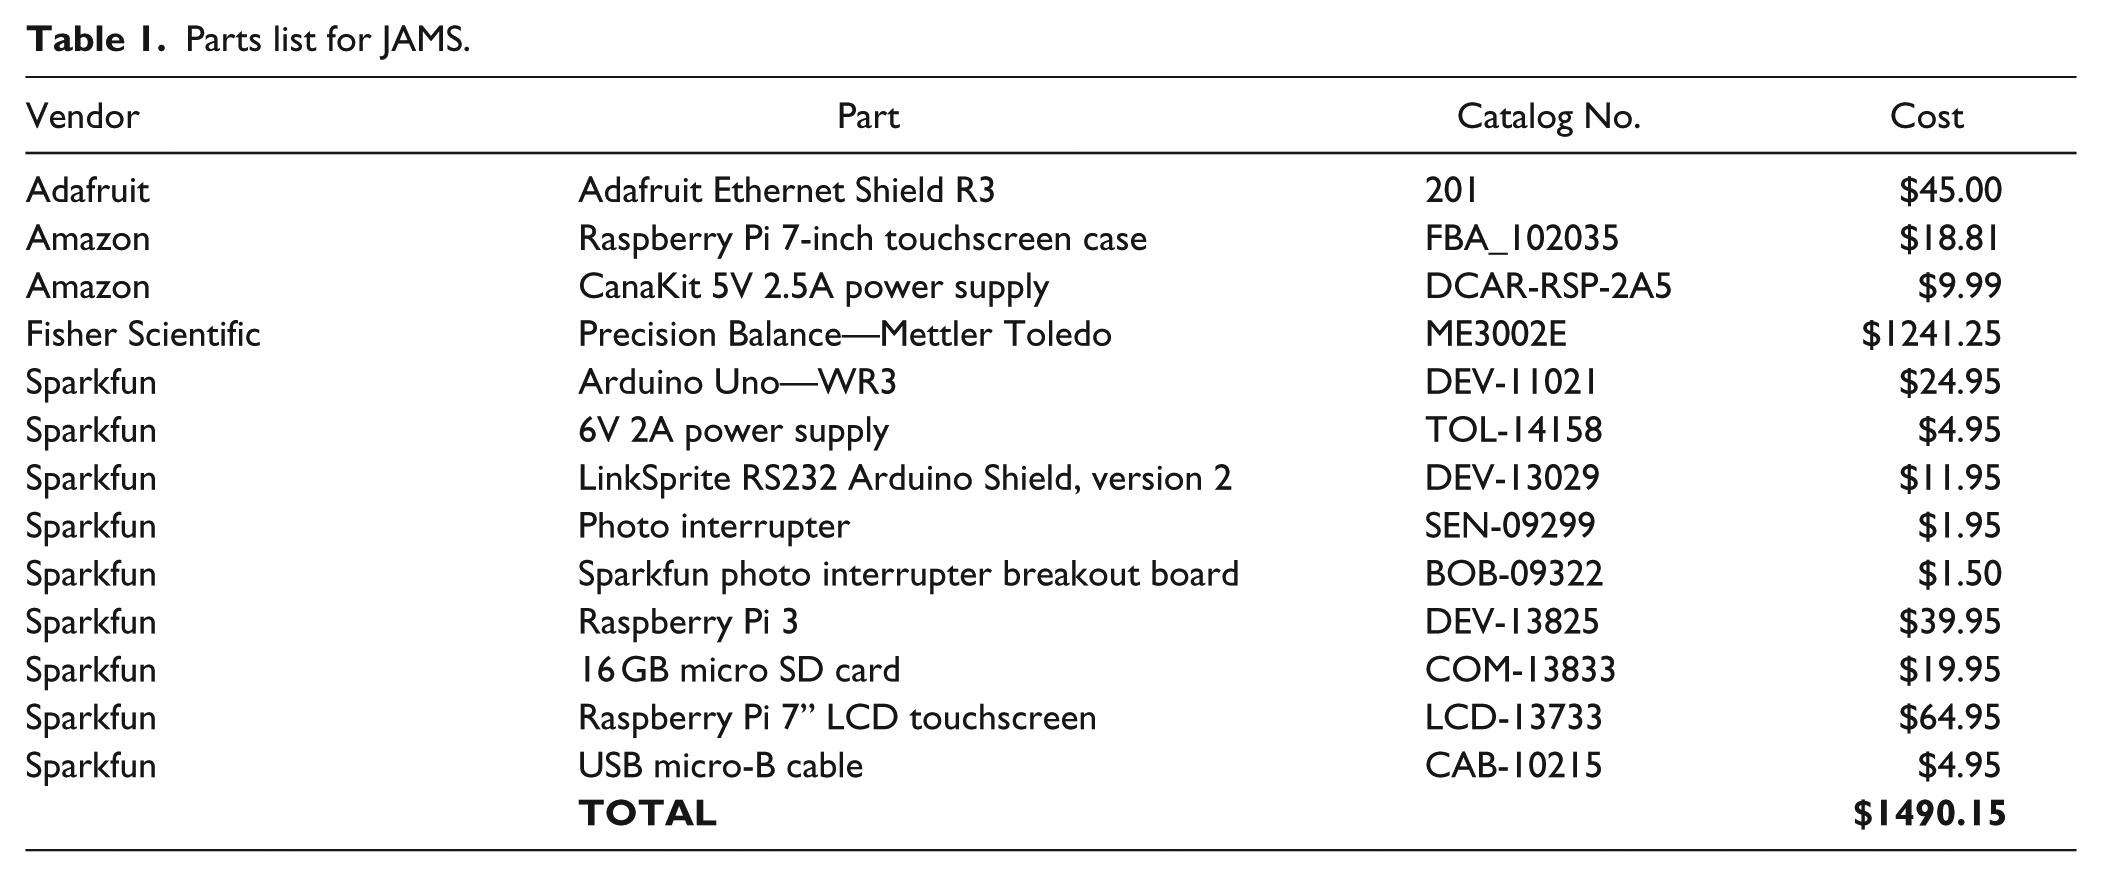
The JAMS QC system was built using off-the-shelf open-source hardware listed in Table 1 . Detailed information on how each of these technologies was integrated with the GNF Washer/Dispensers used on the Scripps Florida HTS platform can be found in the subsequent sections below.
Parts list for JAMS.
Hardware
The balance used in our implementation is a Mettler Toledo ME3002E, which has been set up to output its weight measurement through the onboard RS232 serial connector. Data from the balance is read by an Arduino Uno microcontroller every second via a LinkSprite RS232 Arduino Shield, which is connected to the RS232 port of the balance. The data stream from the balance contains the numerical value of the weight measured, the measurement units, the sign of the measurement, and the stability of the measurement.
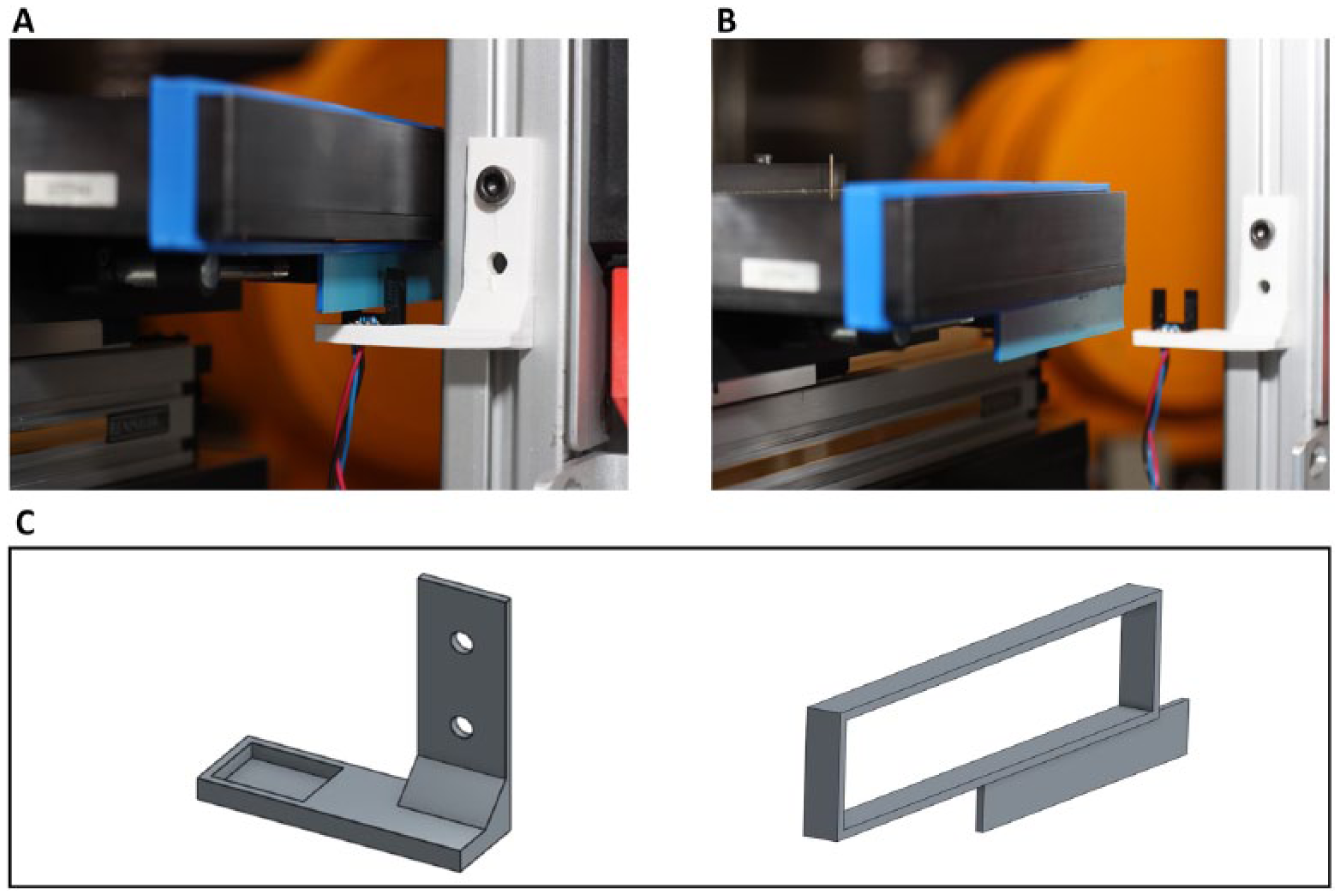
A method was needed to allow the software to determine when a dispense operation starts and finishes. On the GNF dispenser, the platform that holds the microtiter plate during dispensing travels back and forth along a y-axis. By placing an infrared (IR) photo interrupter sensor in a 3D-printed mount at one end of the y-axis and attaching a 3D-printed flag to the dispenser platform ( Fig. 2 ), we are able to tell when the dispenser is at an idle position versus when the plate stage has moved and is actively dispensing. The 3D-printed flag protrudes down in a manner that blocks the sensor when the dispenser is in its idle state and leaves the sensor unobstructed during dispensing. With this information, the software knows which time points from the balance dataset correspond to the start and end of a dispense operation, enabling the calculation of a gravimetric comparison between the two.
(
Customization of 3D-printed parts was accomplished using the Onshape CAD modeling tools.
18
The Arduino Uno, Ethernet Shield, and RS232 Shield are all stacked together and housed in a 3D-printed enclosure inspired by a user design found on Thingiverse.
19
All 3D-printed components of the JAMS platform can be seen in
After collecting the necessary information from the balance and the IR sensor, the Arduino transmits the data to a PHP 20 webpage via an Adafruit Ethernet Shield, which connects the balance to the Scripps Florida intranet. The PHP webpage then takes the data, deposits it into a MySQL 21 database, and determines if any alerts should be generated due to dispense errors. Alerts are currently sent via email and contain specific information regarding the target dispense weight versus the measured weight. This data allows for a clear picture of when dispenses have started, when they are in progress, and when they have finished ( Fig. 3 ).
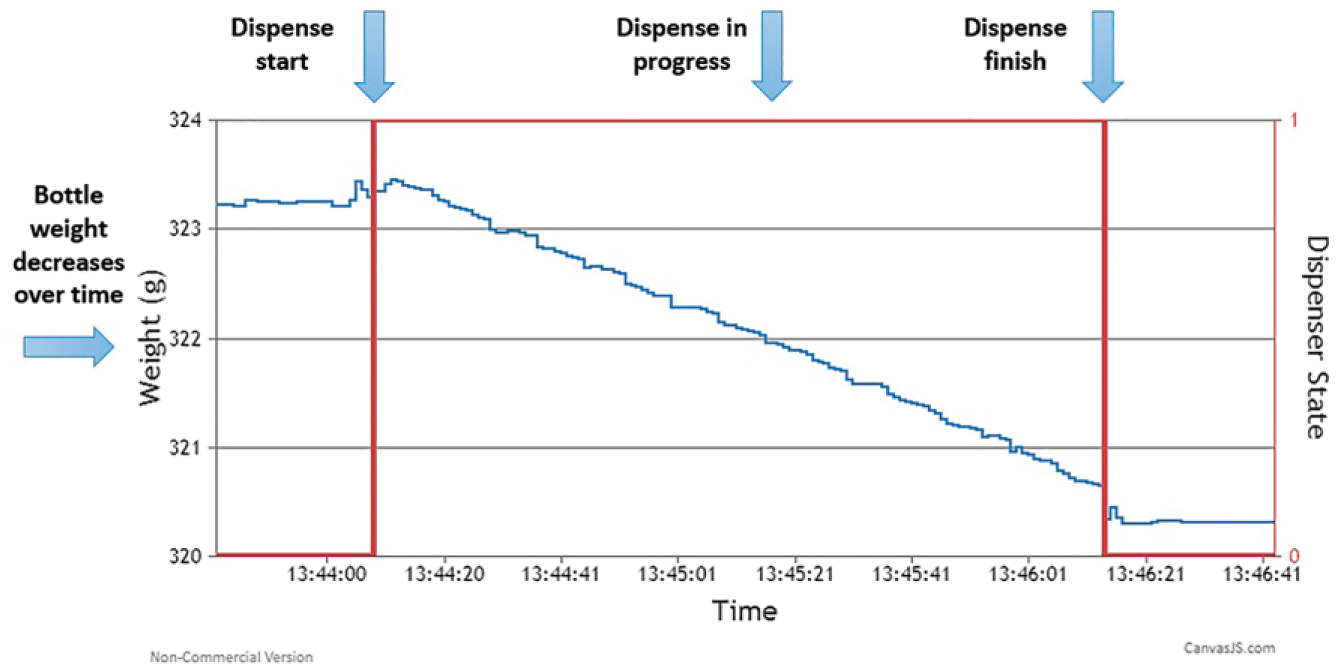
Graph of decreasing weight readout from the balance and sensor state throughout the course of a dispense, corresponding to volume of reagent dispensed into plate.
To further improve the real-time monitoring aspect of the dispenser QC system, a Raspberry Pi 22 and 7-inch touchscreen were mounted directly above the dispenser ( Fig. 1A ). The Raspberry Pi automatically loads the plate-by-plate dispense QC summary webpage on system initialization. This allows for a visualization of the data coming off the balance to be viewed directly at the dispenser itself, rather than at a separate computer. Because the Raspberry Pi is dedicated to this specific function, it always has the relevant information open and updated for the current dispense task on hand.
Software
Three PHP programs handle the data storage, retrieval, and visualization tasks of the JAMS system. The first of these three, Data Logger, is responsible for accepting data from the Arduino and storing it into the MySQL database. Data Logger also performs limit checks to see if dispenses are within set parameters and generates appropriate user notifications if they are not. The other two programs, Data Display and Data Review, are used by end users to review data. All three programs interact with a MySQL database that acts as a repository for dispense QC information.
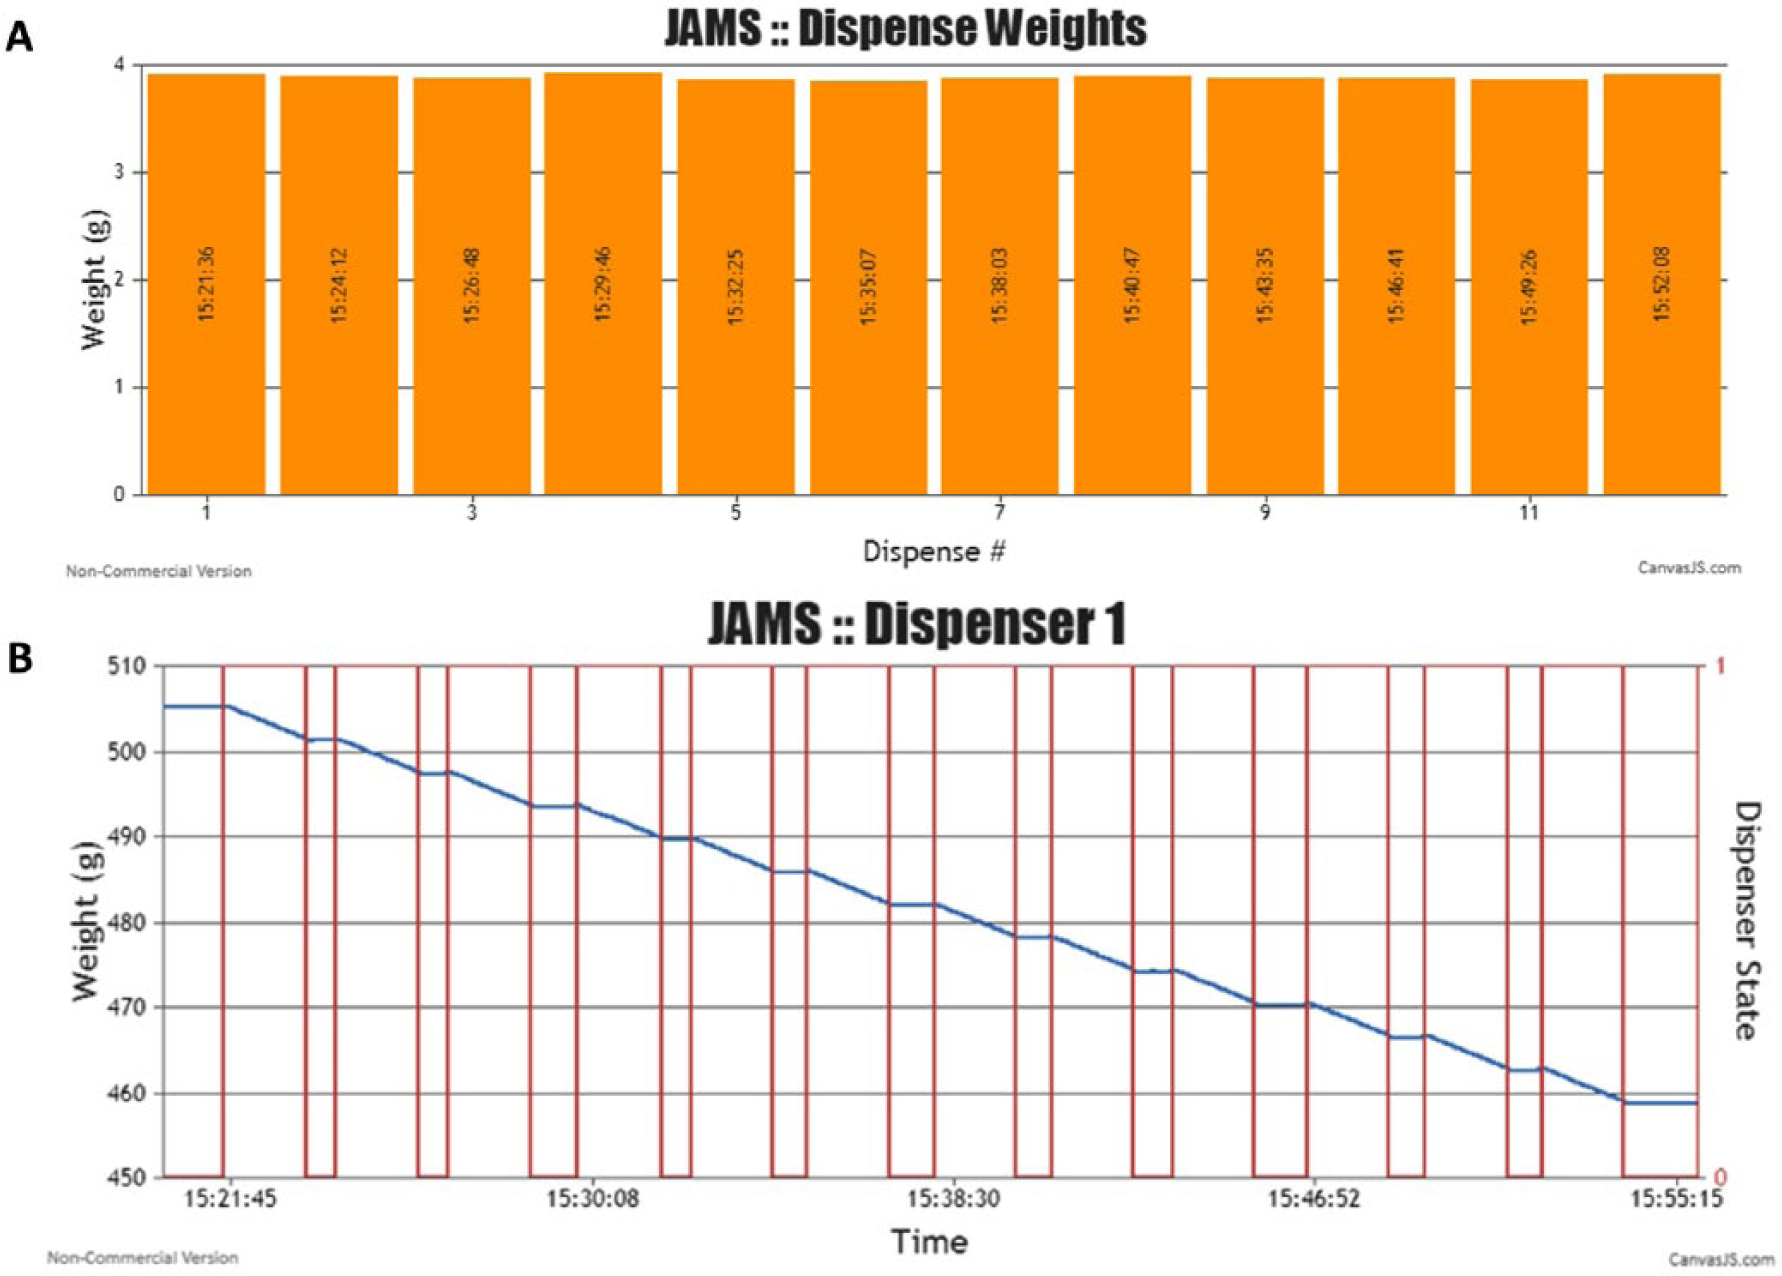
Data Display and Data Review are two visualization JAMS webpages that can be used to analyze the QC data. These different visualizations reflect different goals, with Data Display providing a direct visualization of the raw data from the precision balance, and Data Review providing a per-plate weight change visualization. Both webpages use a JavaScript graphing system called CanvasJS 23 to generate the dynamic charts used in the JAMS visualizations.
The Data Display page, seen at the bottom of Figure 4 , is created as a visualization of the real-time raw data from the balance and the IR photo interrupter sensor. The data is displayed as a step line graph with dual axes for the weight and the sensor value. The weight axis is automatically scaled to the relevant data. The sensor data is scaled between 0 and 1 because these are the only two discrete states that the sensor can take.
(
The Data Review page, seen at the top of Figure 4 , is a representation of the QC data in relative plate-by-plate format. Dispenses shown on the Data Review page record both the number of dispenses and their mass transfers. The data is represented as a bar graph, with each bar giving the weight of that dispense. Within each bar, the start time of the dispense is displayed.
Results
To demonstrate the capability of JAMS to provide real-time error detection and reporting of dispense issues, a series of experiments was performed. These experiments included dispense operations as part of a standard HTS campaign and a separate simulation of a dispense failure.
The first method of verification for JAMS was a series of pilot tests emulating standard HTS campaigns. In this configuration, the Scripps HTS platform was run as normal without any modifications, apart from the addition of the JAMS platform installed alongside the GNF dispenser. Sample data captured from this phase of testing can be seen in Figure 4 . At the top of this figure, dispense data from a series of 12 plates is visualized in a relative plate-by-plate dispense weight format. At the bottom of this figure, the raw data from the balance and IR sensor is seen. This dataset represents a series of sequential plate reagent dispenses occurring without any failure. Furthermore, the dataset shows a small plate-to-plate weight coefficient of variation (CV) of less than 5%, which falls within acceptable HTS dispense limits.
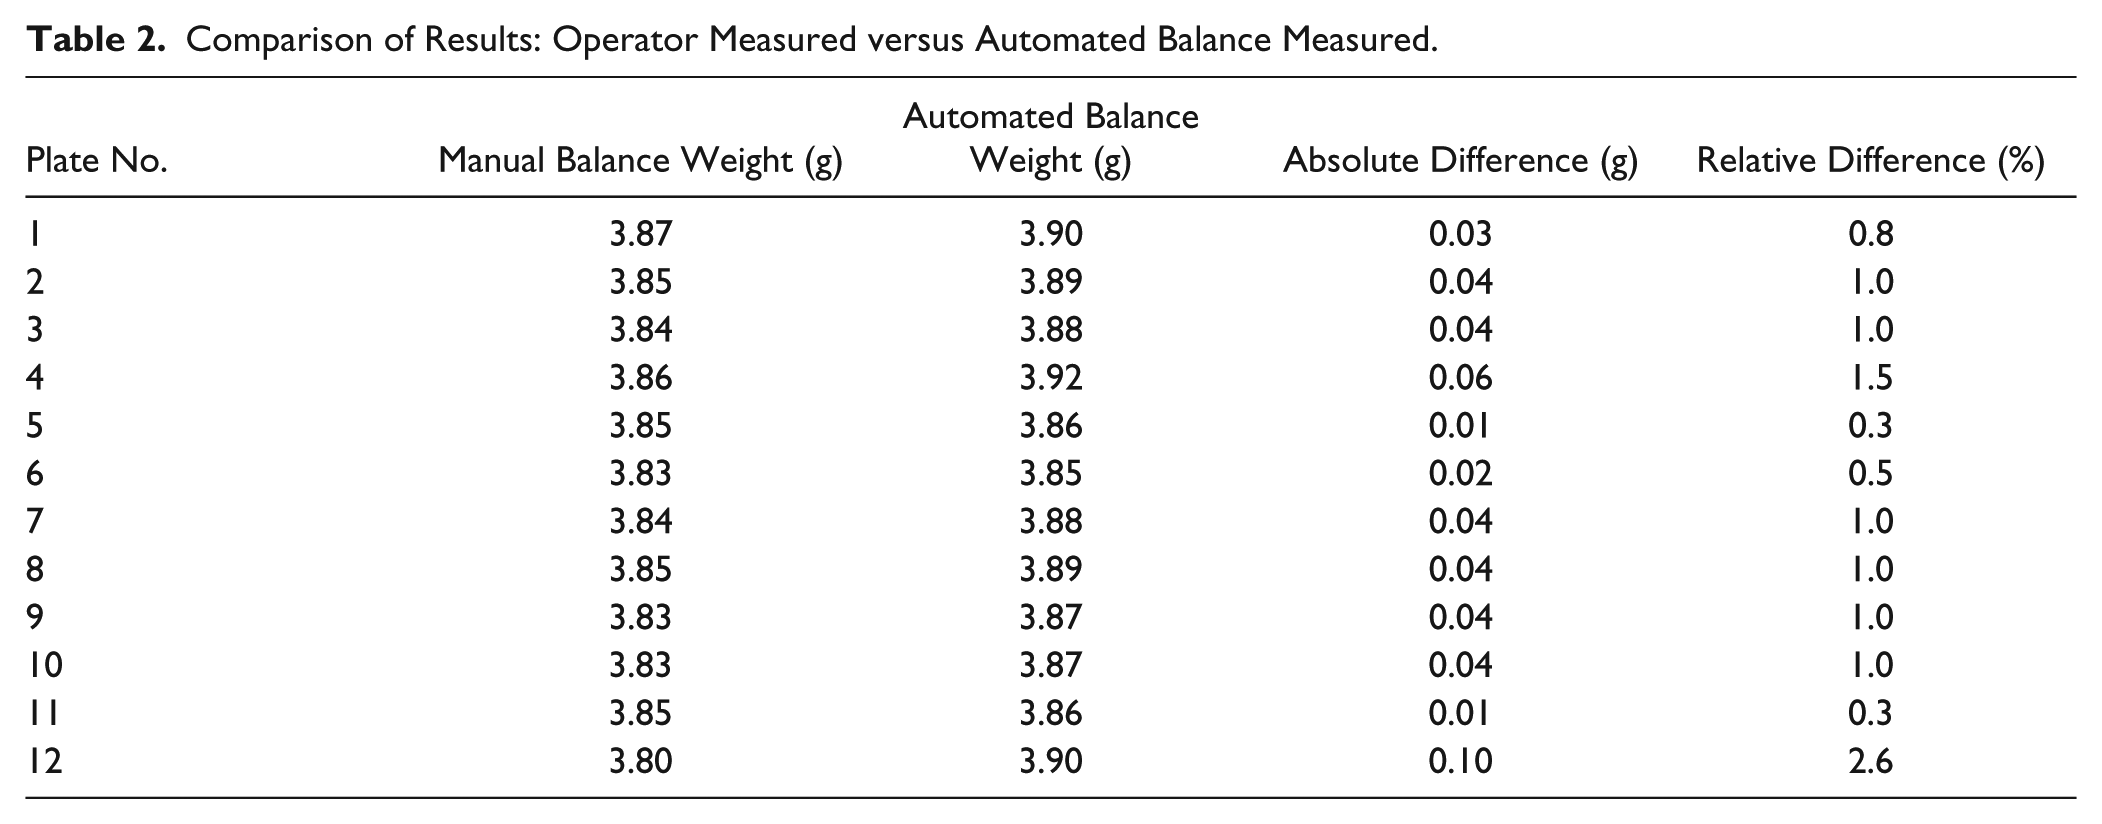
During the pilot run, results from the JAMS platform were also compared against a traditional method of QC in which the operator periodically suspended the HTS platform to retrieve plates before and after dispense for weighing on an offline analytical balance. Results from this comparison for a subset of plates are seen in Table 2 . The difference between the weights measured by the JAMS platform and the manual operator weighing varied by 1.0% on average, with the largest difference between the two measurements being 2.6%. Data obtained from each balance was also consistent: the %CV of the measurements from the operator weighing was 0.47%, and the automated JAMS weighing was 0.52%. This data shows that the JAMS platform is accurately and consistently measuring the dispense weight as compared to the traditional operator QC.
Comparison of Results: Operator Measured versus Automated Balance Measured.
The next round of testing involved a series of dispense operations followed by a valve failure. The valve failure was simulated by disconnecting the power supply from the valve electronics connector. In Figure 5 , the data visualization shows two nominal dispenses, seen as linearly decreasing weights between the dispense start and dispense stop signals. Following these first two dispenses, the simulated failure is observed when the measured weight of the plate decreases in the plate-by-plate visualization and the raw weight from the balance in the raw data visualization no longer decreases at the same rate it had in the previous two dispenses. This is denoted by the circled data in Figure 5 . The simulated dispense error triggered an email alert that immediately notified relevant personnel that a dispense error had occurred.
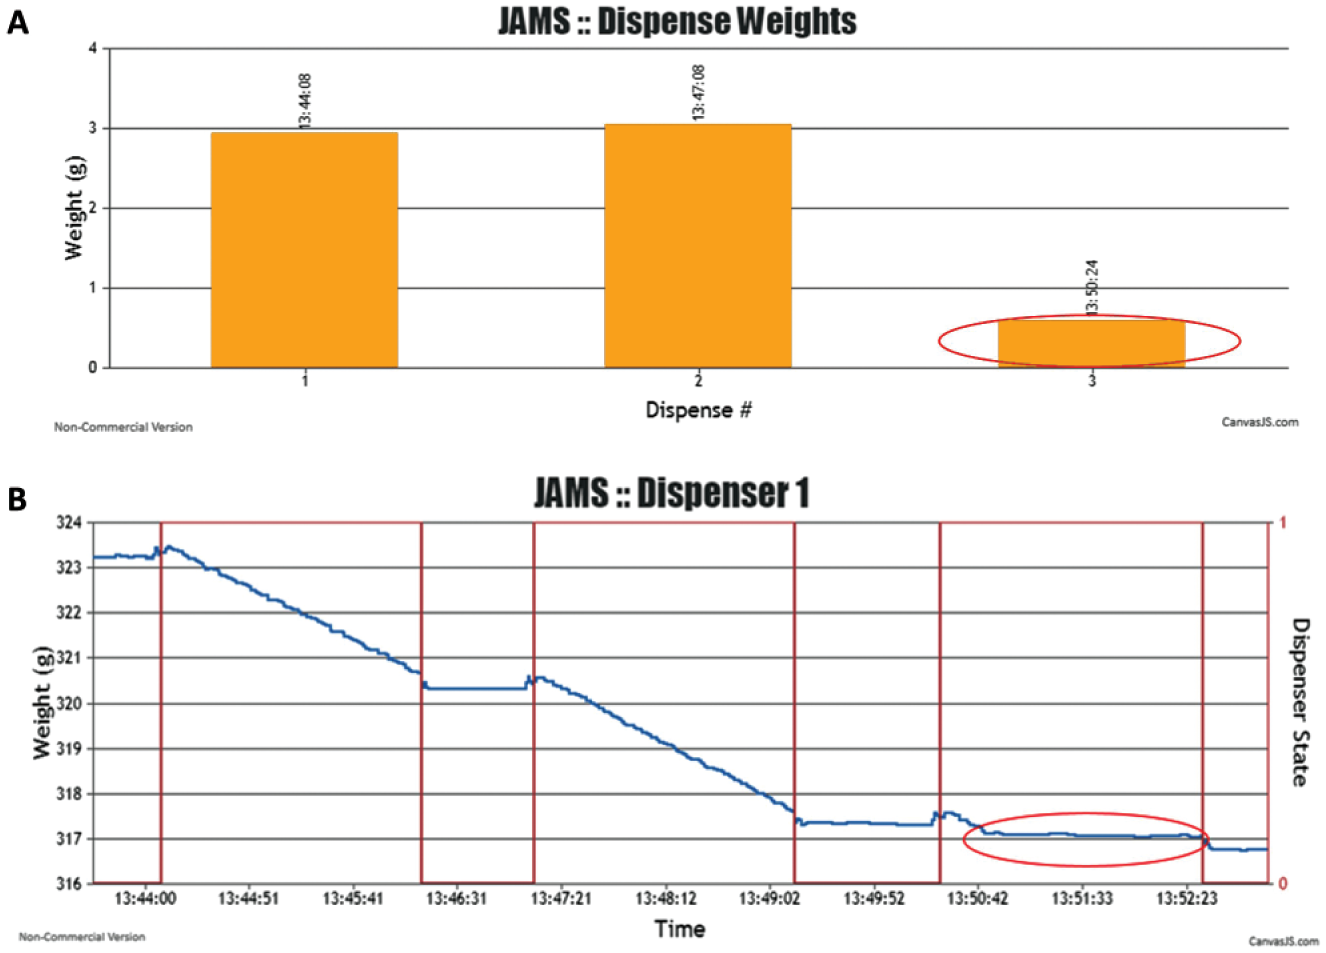
(
Discussion
The JAMS platform represents a robust, automated, and inexpensive dispense QC monitoring system for HTS dispensing. This was accomplished by combining low-cost microcontrollers (including an Arduino and Raspberry Pi), a web-based PHP–MySQL interface, an inexpensive IR photo interrupter sensor, 3D-printed parts, and a precision balance into a paradigm-changing IoT device. The total cost of the platform, including the precision balance, was less than $1500.
Pilot testing has shown that the JAMS platform provides automated dispenser QC without any interference to the throughput of the robotic platform. In fact, it operates entirely outside of any of the platform’s software or hardware utilities, which makes it easily adoptable to other platforms. Data from pilot testing also confirmed that the system was functioning as intended and successfully characterized dispenser performance throughout time. After the completion of an HTS campaign, any discrepancies seen in the experimental results can be cross-referenced with the historical records of the dispensing for that assay. Access to this type of historical information may reveal trends about dispense inconsistencies that can be used to address dispenser performance. Prior to the implementation of JAMS, historical data for dispensing operations at Scripps Florida was available for only a small percentage of HTS plates that had been manually retrieved and weighed by an operator using an offline balance. In addition, the real-time alerts generated by the JAMS platform allow HTS operators to address errors as they occur, potentially saving precious reagents, time, and other consumables. The end benefit of these factors is that HTS operations are more efficient and robust.
There are a variety of avenues for potential future development of the JAMS platform. These include increasing the number of precision balances connected to the IoT platform to support a greater number of dispensers in parallel. The current system uses one balance with one dispenser for monitoring liquid dispensing. Additional balances could allow for monitoring of multiple dispensers simultaneously, or multiple reagents dispensing from the same dispenser simultaneously. The existing informatics infrastructure can support this upgrade with minimal changes.
The sophistication of the JAMS informatics processing could also be increased by adding algorithms to evaluate the dispense rate from start to finish. Currently, the algorithm relies on endpoint measurements from the start and end of a dispense to determine the whole plate dispense weight. In theory, the data from a properly functioning dispense operation will have a constant, decreasing slope when tracking the weight. A slope that changes during the course of a single dispense could be automatically detected, identifying nonuniform dispense patterns.
A tighter integration between the JAMS platform and the HTS software, including the scheduler and dispenser application, would allow for easier determination of expected dispense weights without separate operator-defined parameters. This could be accomplished via a software application programming interface (API) provided by the HTS robotics vendor, or the system could be adapted to monitor HTS robotics network traffic to determine what protocol is being run. Moreover, either the protocols themselves could then be read, or a list of protocols could be stored in a database table that could be queried to determine if the resulting dispense volume is acceptable relative to the targeted dispense volume. Another potential advantage of tighter integration would be the ability to make automatic corrections in real time to adjust for any errors in the dispense weight. This system would incorporate feedback control, and it would alter the parameters of the dispense method on the fly to bring the dispense weight of future dispense operations closer to the target weight.
Introducing network connectivity to previously offline devices transforms them into IoT-enabled systems, improving the overall functionality of these devices and enabling users to have greater control over their operation. Logging the results from such systems allows for both real-time analysis and postassay review of the data. Trends in dispense performance can be tracked throughout extended periods of time. As a practical matter, the implementation of the JAMS platform demonstrates this by adding fully automated data logging and alert generation to a system that previously relied on intermittent and manual processing performed by the robotic operator. The end effect of this systematic change is an overall increase in efficiency of laboratory function.
Footnotes
Declaration of Conflicting Interests
The authors declared no potential conflicts of interest with respect to the research, authorship, and/or publication of this article.
Funding
The authors received no financial support for the research, authorship, and/or publication of this article.