
Abstract
A four-channel electrochemical impedance spectroscopy (EIS) analyzer module has been demonstrated on flexible chemi-impedance sensors fabricated with gold electrodes for wearable applications. The module can perform time division multiplexed (TDM) impedance measurements on four sensors at 1 kHz. In this work, we characterize the system for the detection of cortisol in an ultralow volume (1–3 µL) of perspired human sweat, sensor performance, and effects during continuous cortisol dosing and with pH and temperature variations expected on the surface of the skin that would be representative of use conditions as seen by a wearable device. Detection of cortisol was shown for concentrations of 1 pg/mL to 200 ng/mL in both synthetic and perspired human sweat, and output response reported as a change in impedance with varying cortisol concentrations. Continuous dose testing was performed to demonstrate the stability of the sensors over prolonged periods of operation for cortisol concentrations within the physiologically relevant range of 10–200 ng/mL reported in human sweat. Temperature and pH effects testing was performed for pH range 4–8 and in a temperature chamber for the clinical range reported on the surface of human skin: 25–40 °C. The cortisol sensor demonstrated stability of operation with 7.58% variability under these conditions.
Keywords
Introduction
Wearable healthcare devices are envisioned to be the modern technology that will disrupt methods of diagnosis and significantly enhance human health. 1 These will enable patients to monitor their health themselves, without the need for blood-based diagnostic procedures; take responsibility for their own health; and be better informed about dynamic changes to their health. 2 One important dynamic biomarker expressed in perspired human sweat is cortisol. Adrenal glands produce cortisol, a glucocorticoid, from cholesterol. It is released in response to events and circumstances, such as waking up in the morning, exercising, and acute stress. Cortisol’s far-reaching, systemic effects play many roles in the body’s effort to carry out its processes and ensure homeostasis. Cortisol secretion of individuals depends on circadian cycle and field environment. Thus, the level of cortisol in the human body is not the same throughout the day. Moreover, cortisol is secreted only in response to physical activity or stressful situations. Laboratory testing techniques would need a daylong study or to take blood/saliva samples several times throughout the day. This testing method may or may not incorporate response to stressful events. Hence, cortisol detection at point of care is deemed essential to provide personalized healthcare. 3 Efforts are underway to develop wearable detection analytical devices to quantify stress and related abnormalities in environmental condition to gain useful information for appropriate diagnosis and treatment. Studies have linked cortisol levels with human stress, and hence cortisol has recently become a highly relevant biomarker for the detection of physiological stress. As a result, analytical techniques to detect and quantify cortisol levels are of significant value. It is in this space that there are many innovative technologies under development.
Saliva has been identified to be the most promising body fluid enabling dynamic testing of cortisol; blood-based cortisol testing identified one time point in the diurnal cycle for determining physiological outcomes based on cortisol levels. 4 Most recently, sweat has started to become an attractive body fluid for supporting the dynamic testing of cortisol levels. In sweat, cortisol concentrations range from 141.7 ng/mL (daytime) to 8.16 ng/mL (nighttime). A strong correlation between cortisol levels in sweat and hair is hypothesized due to the path that cortisol traverses from serum to hair. 5 Various perspired sweat cortisol patches are under development.6,7 The major constraints to date have been the requirement of large volumes of sweat (> 20 µL) and the inability to report cortisol levels with varying changes to the sweat microenvironment.
Bioelectronics platforms for detecting biomarkers in portable small-volume formats have typically used current/amperometric-based measurement methods. Most notable among these is the flexible electronics platform used for the detection of electrolytes, lactate, and glucose. The challenge in using an amperometric system is the need for a redox-based probing system, which in turn modulates the target biomarker under study.8,9 While bioelectronics platforms using amperometric detection are easy to design and implement as portable, low-power DC systems, they lack the selectivity/specificity offered by AC systems.10,11 In 2015, our research group showed the development of an ultra-low-volume flexible biosensor for sweat cortisol determination using AC-based electrochemical impedance spectroscopy (EIS). We have effectively demonstrated sensitivity, specificity, and ultra-low-volume detection (1–3 µL) with this biosensor. 11 In this work, we show the bioelectronic feasibility of integrating the sweat patch with a low-power reporting platform toward proving the feasibility of developing a wearable bioelectronics device for cortisol testing from perspired human sweat using EIS as the measurement method. EIS-based biosensors take advantage of the intrinsic impedance changes in the system in response to probe–analyte binding and hence can perform label-free detection. Like other electrochemical biosensors, these can be easily integrated into standard electronic integrated circuits (ICs).10,12 They give a vast amount of information at specific frequency points, making it possible to study the effect of molecular interactions and diffusion mechanisms occurring at various distances from the electrode surface.
EIS is highly sensitive to molecular interactions happening close to the electrode surface. It relies on the inherent properties of molecules, which makes EIS-based sensing suitable for the detection of specific molecules, such as proteins, hormones, nucleic acids, and metabolites. EIS allows for real-time detection using the interface impedance with biomolecular interactions as a function of time. Real-time detection allows us to better understand reaction mechanisms and helps us to better estimate the analyte concentration. 13 The possibility of creating integrated EIS biosensors that use ICs for detection makes EIS an attractive candidate for building portable, cost-effective wearable platforms.14,15 In this work, a flexible chemi-impedance sensor is proposed for sensing cortisol concentrations in 3 µL of synthetic as well as human sweat samples within the clinical range of 10–200 ng/mL using EIS. Moreover, a four-channel EIS module is proposed for implementing a low-voltage, AC-based impedance measurement system. This work also discusses continuous dosing effects and temperature-dependent characteristics of the wearable biosensor.
Materials and Methods
Chemi-Impedance Sensor Fabrication
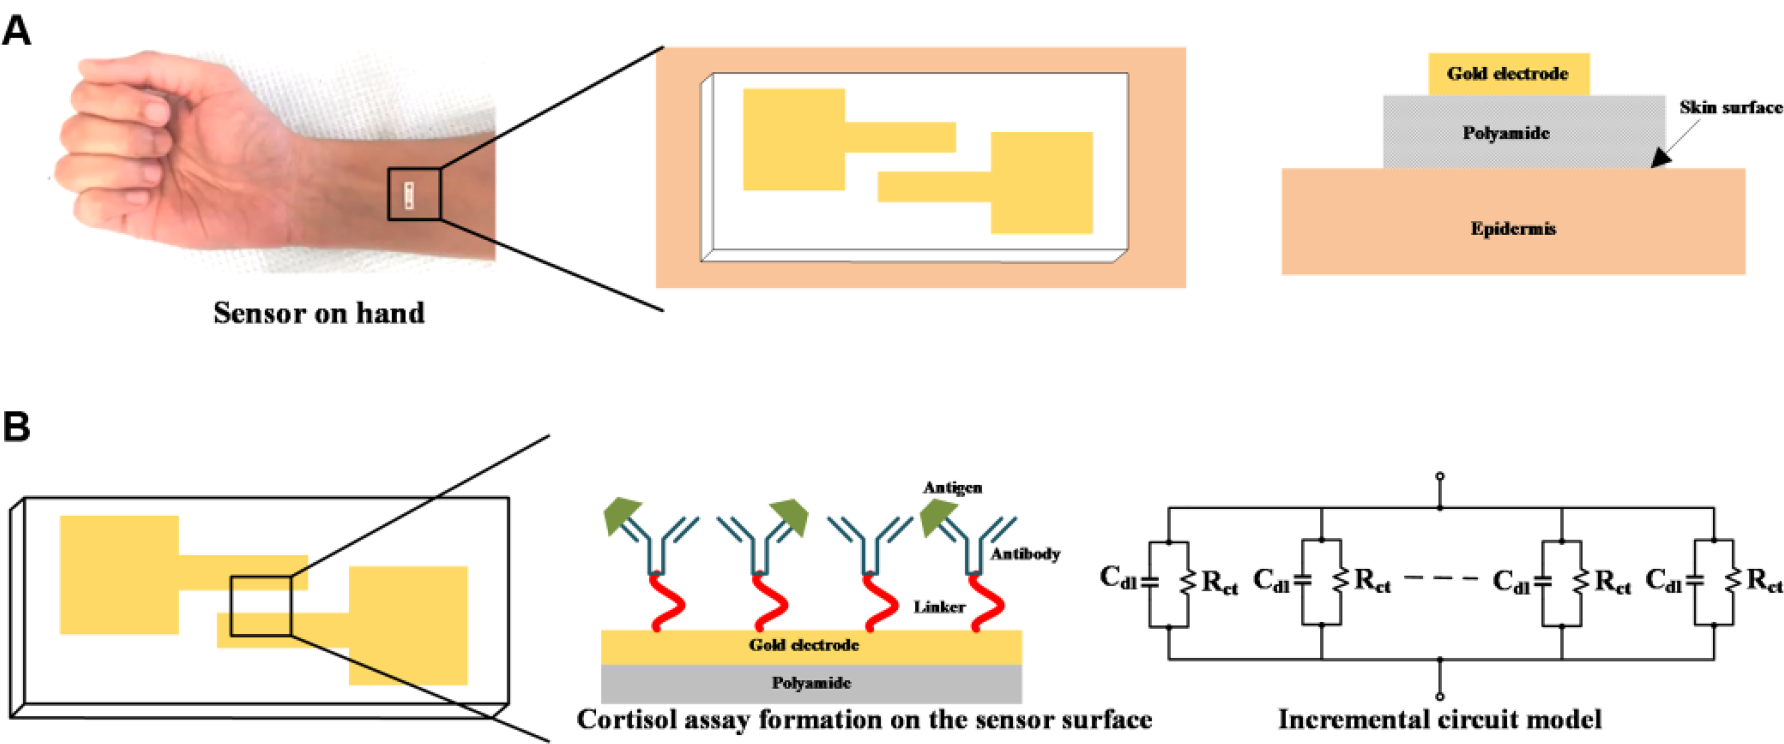
Figure 1 shows the cross-sectional view of the chemi-impedance biosensor and the formation of the immunoassay on the functionalized surface. The biosensor substrate is a 100 µm thick, flexible nanoporous polyamide substrate (GE Lifesciences, Piscataway, NJ). Gold electrodes were patterned using a shadow mask and deposited using an e-beam cryo-evaporator. 10
(
Materials for Implementing Cortisol Assay
Dithiobis(succinimidyl propionate) (DSP) and its solvent DMSO (Thermo Fisher Scientific Inc., Waltham, MA) were prepared at 10 mM volumetric dilution and the sensor surface was incubated with this cross-linker for a period of 3 h. The monoclonal α-cortisol was ordered from Abcam (Cambridge, MA). Cortisol (hydrocortisone) was obtained from Thermo Fisher Scientific. The antibody was diluted in 1× phosphate-buffered saline (PBS; Thermo Fisher Scientific). The cortisol hormone was diluted using synthetic sweat. Synthetic sweat was prepared as per the recipe stated in Table 2 of M. T. Mathew et al. 16 The pH range was varied by varying the concentration of the components. Human sweat was obtained from Lee BioSolutions Inc. (St. Louis, MO), where it was collected from a single human donor with pH ~6. No preservatives were added to this product, and it was stored unfiltered at below −20 °C.
Cortisol Sensor Experimental Protocol
A gold surface was functionalized with 3 μL of 10 mmol DSP linker after incubation for 2 h. The PBS wash was carried out followed by a 15 min incubation of 3 μL of 10 μg/mL α-cortisol antibody. Serial dilutions of cortisol in synthetic sweat were prepared to range from 1 pg/mL to 200 ng/mL, which were dispensed after antibody incubation. Each cortisol concentration was incubated for 15 min on the sensor surface prior to measurement. The sensor calibration response was obtained in human sweat with increased cortisol concentration doses from 1 pg/mL to 200 ng/mL with n = 4 replicates of chips. Two test sample chips with 10 and 200 ng/mL cortisol concentration doses on each were also measured. The average readings were then compared with the values obtained from the calibration dose response in human sweat. These EIS measurements were performed by recording the current flow using ADuCM350 after applying 10 mV of AC voltage with a frequency of 1 kHz.
Selection of Measurement Hardware
EIS measurements can be performed using a potentiostat; however, the method of measuring impedance can be based on the Lissajous pattern or discrete Fourier transform (DFT). In the case of the Lissajous pattern, two waveforms are divided, and their phase difference is calculated using XY plotting. This is a processor-intensive operation and can take a few seconds to yield results. Moreover, this will only allow one sensor to be connected to the potentiostat unless a multiplexer is used. To show larger throughput and least hardware requirement, a DFT-based time division multiplexed (TDM) sensor module has been used, wherein the measurement time was fixed to 13 ms and impedance measurement was performed on four sensors in quick succession.
Operation of the Sensor Module
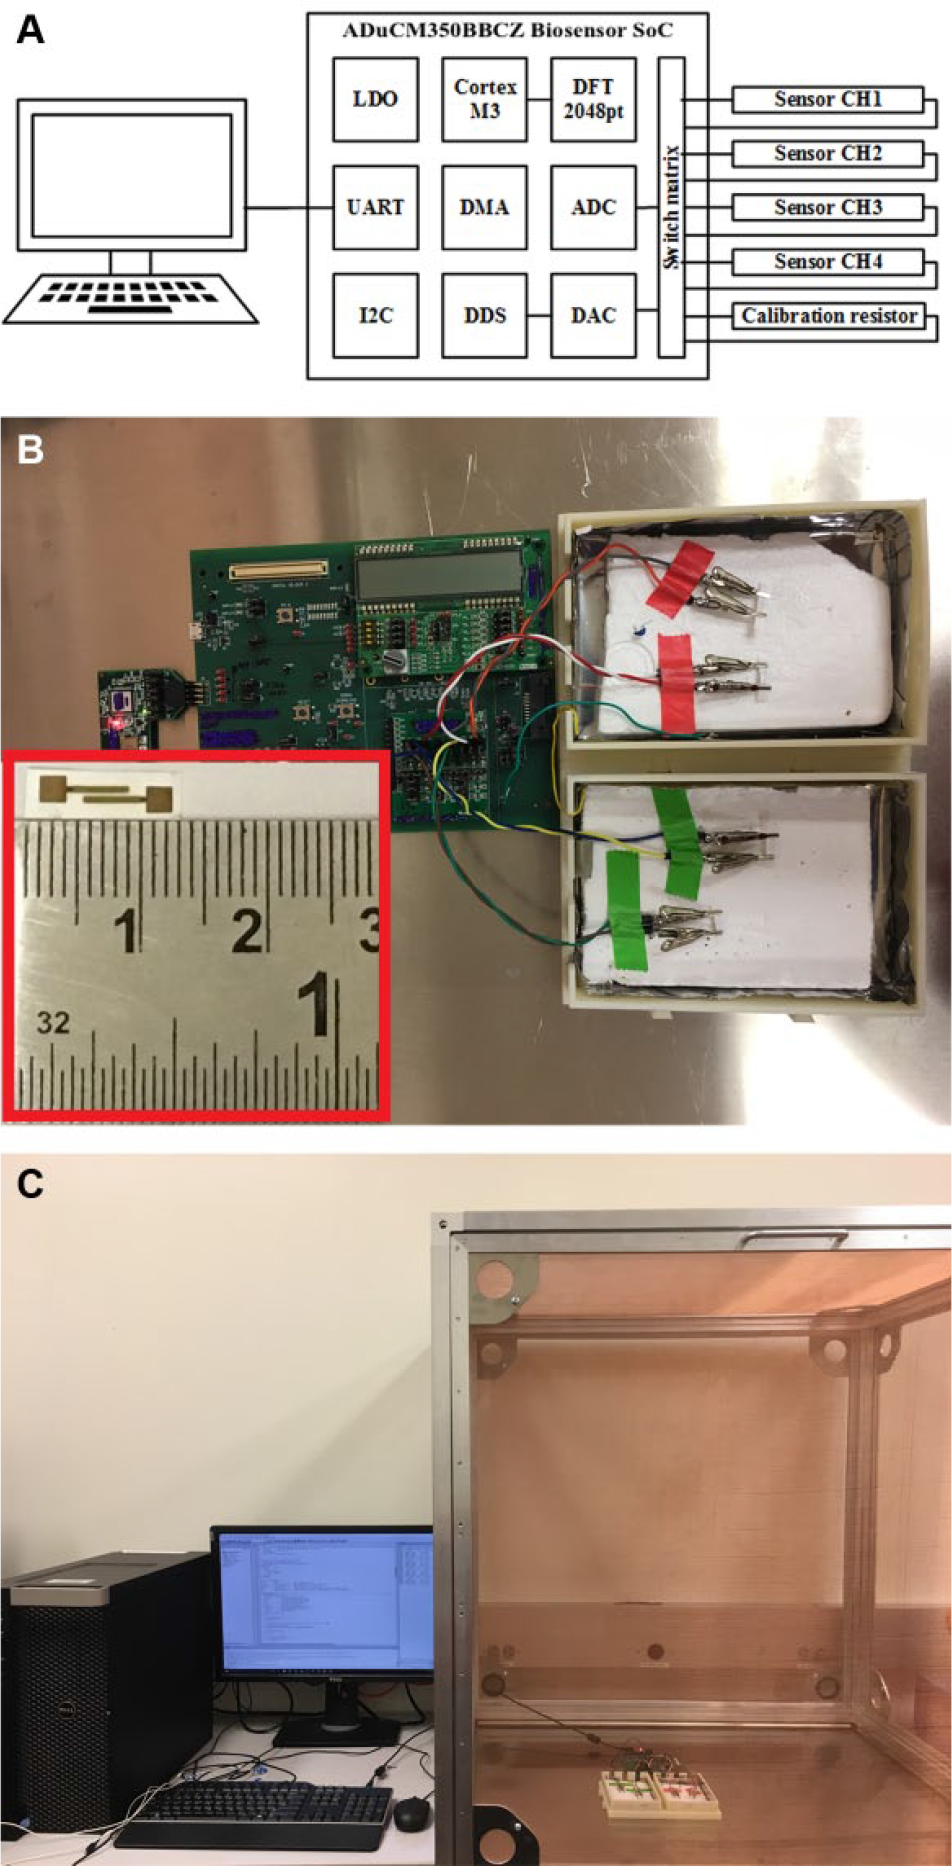
The ADuCM350 (Analog Devices Inc., Norwood, MA) system-on-chip (SoC) is at the heart of the measurement setup. The system-level block diagram is shown in Figure 1 . The SoC consists of a configurable analog front end (AFE), which consists of a wave generator, a switch matrix, and a 2048-point discrete Fourier transform–based impedance analyzer. The amplitude and frequency of the wave generator are fixed using digital words. The AFE is operated using a binary sequence, which controls wave generation, switching sensor channels, and evaluation impedance. The switch matrix enables time division multiplexing of sensors with the instrumentation loop to perform measurement on each sensor. The process of TDM frequency measurement is as follows. The sequence of the instructions is sent to the AFE first-in-first-out (FIFO) buffer using a direct memory access. This helps in achieving low power consumption, as the core processor is not turned on. The wave generator amplitude and frequency are set using respective binary words. Now, the switch matrix connects to a calibration resistor channel to measure the resistance of a precision resistor and uses it as a reference for subsequent measurements. The impedance analyzer block is formed by an I-V converter, analog-to-digital converter (ADC), and DFT engine. The current sensed is converted to a proportional voltage and a 2048-point DFT is performed on it. The real and imaginary parts of the data are converted to magnitude and phase. Two analog pins are selected, from which one acts as a generator and the other as a sink. These pins are in turn connected to one of the sensors due to the switching action of the switch matrix. After a 13 ms DFT cycle on one sensor, the AFE switches to the next sensor channel. Thus, impedance measurement is performed on all four sensors in a combinatorial sequence.
Experimental Setup for Characterizing the Sensor Module
Figure 2B shows the sensor module connected to four biosensors, and the inset shows the flexible biosensor. Twisted-pair wires are used to connect the biosensors to prevent any effects of low noise during the measurement process. Additionally, the sensor module is placed in a Faraday cage (Thorlabs Inc., Newton, NJ) for further noise isolation. All measurements are obtained using a serial connection to the PC, as shown in Figure 2C . The sample rate for this arrangement is one sample per minute, and all four sensors are measured for impedance magnitude and phase in rapid succession.
(
Experimental Setup for Temperature Stability
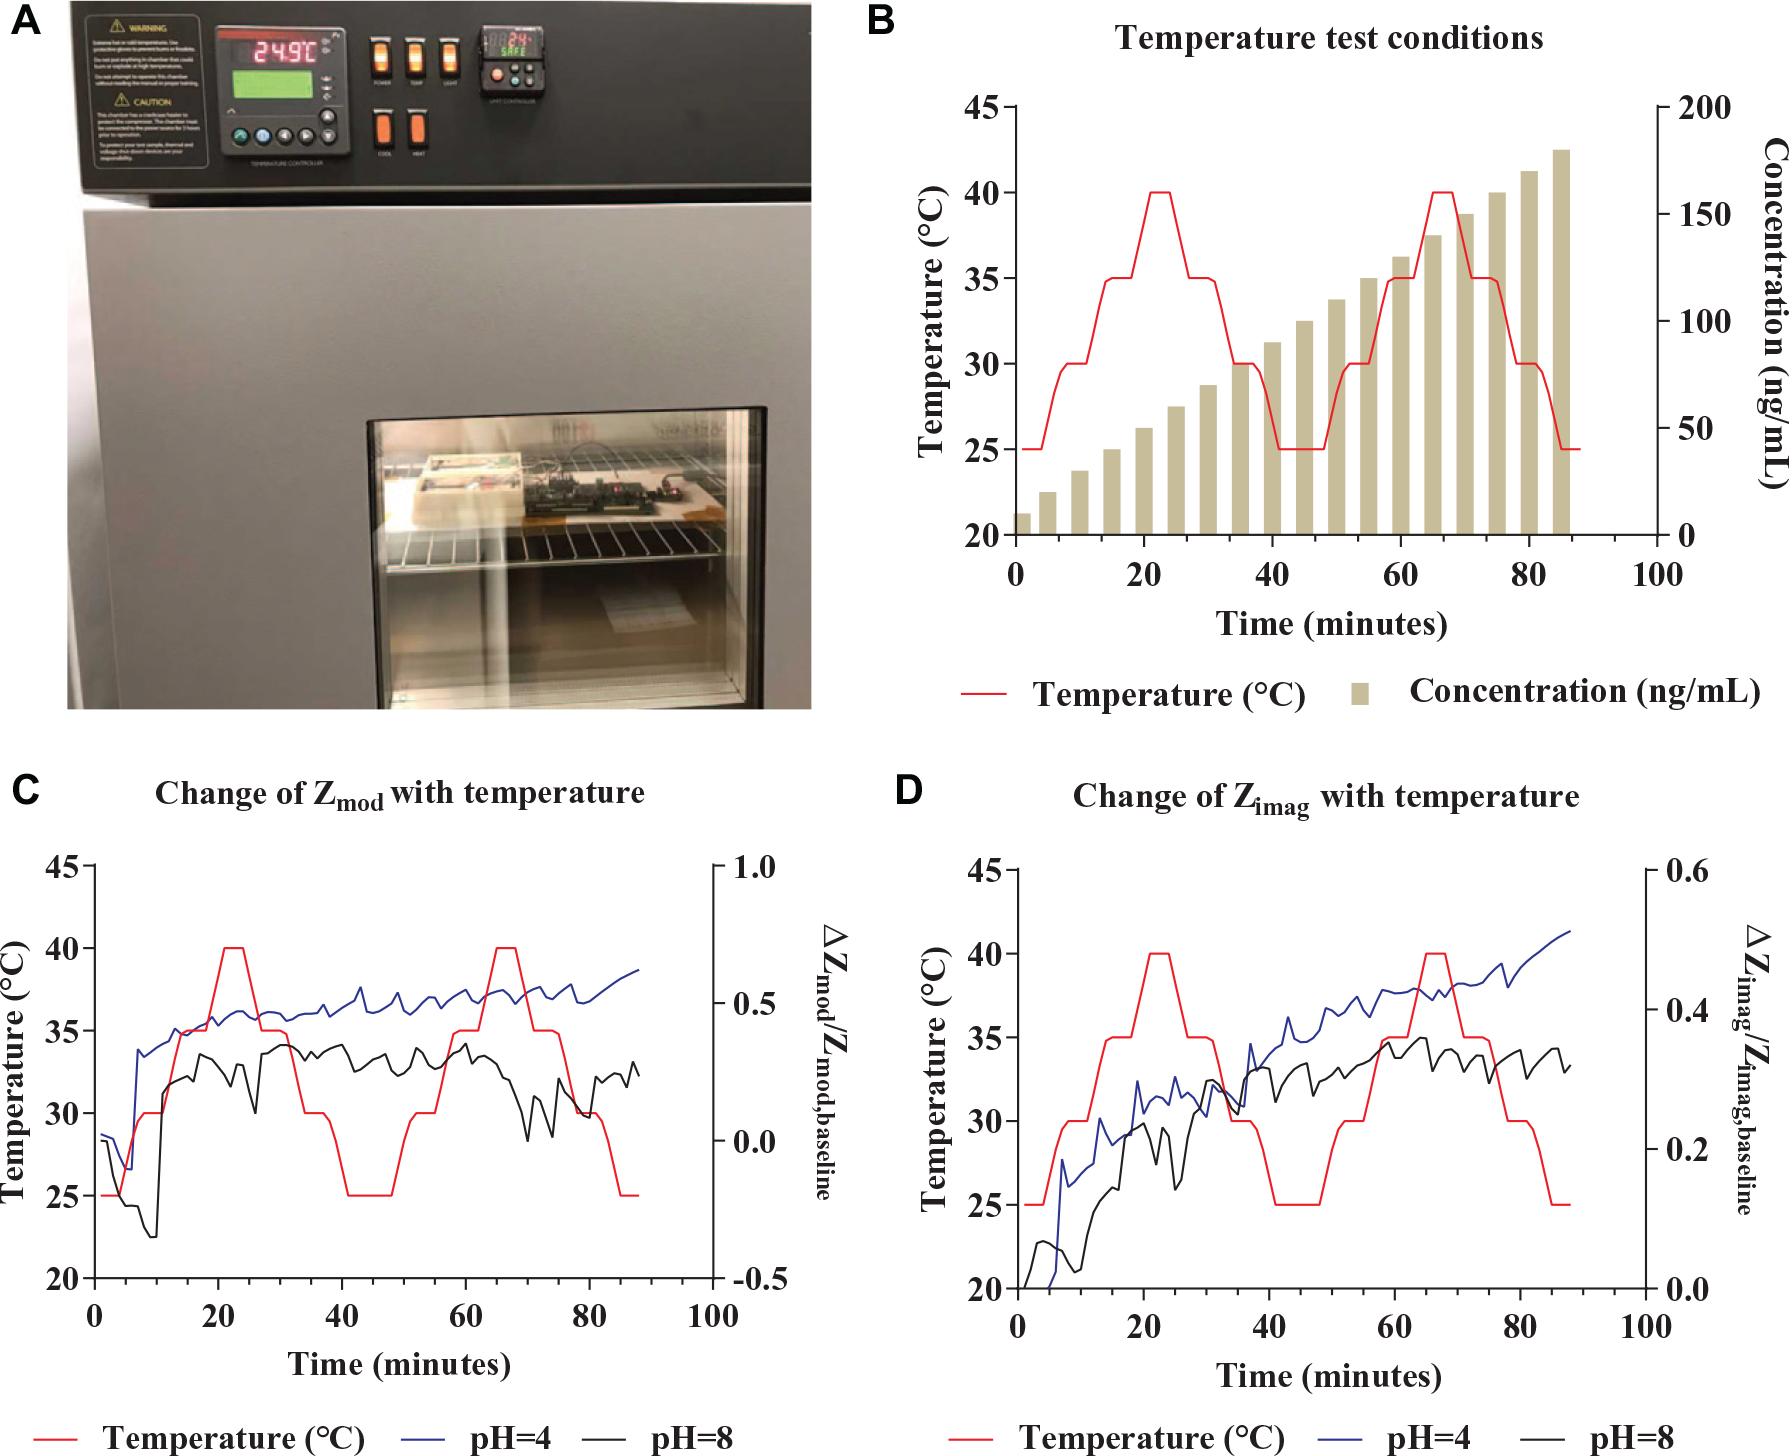
To demonstrate the stability of sensor impedance over varying temperatures, a temperature chamber (TestEquity LLC, Moorpark, CA) was used to emulate a temperature profile from 25 to 40 °C. Figure 9A shows the experimental arrangement for temperature testing, where both the sensor module and the sensors were placed on an insulated surface. A temperature profile ranging from 25 to 40 °C and back to 25 °C was applied twice to the sensor as well as the sensor module. Concurrently, at an interval of 5 min, dose concentrations starting from 10 to 200 ng/mL were dispensed in increments of 10 ng/mL.
Results and Discussion
Calibration of Sensor Module Using Lumped Elements
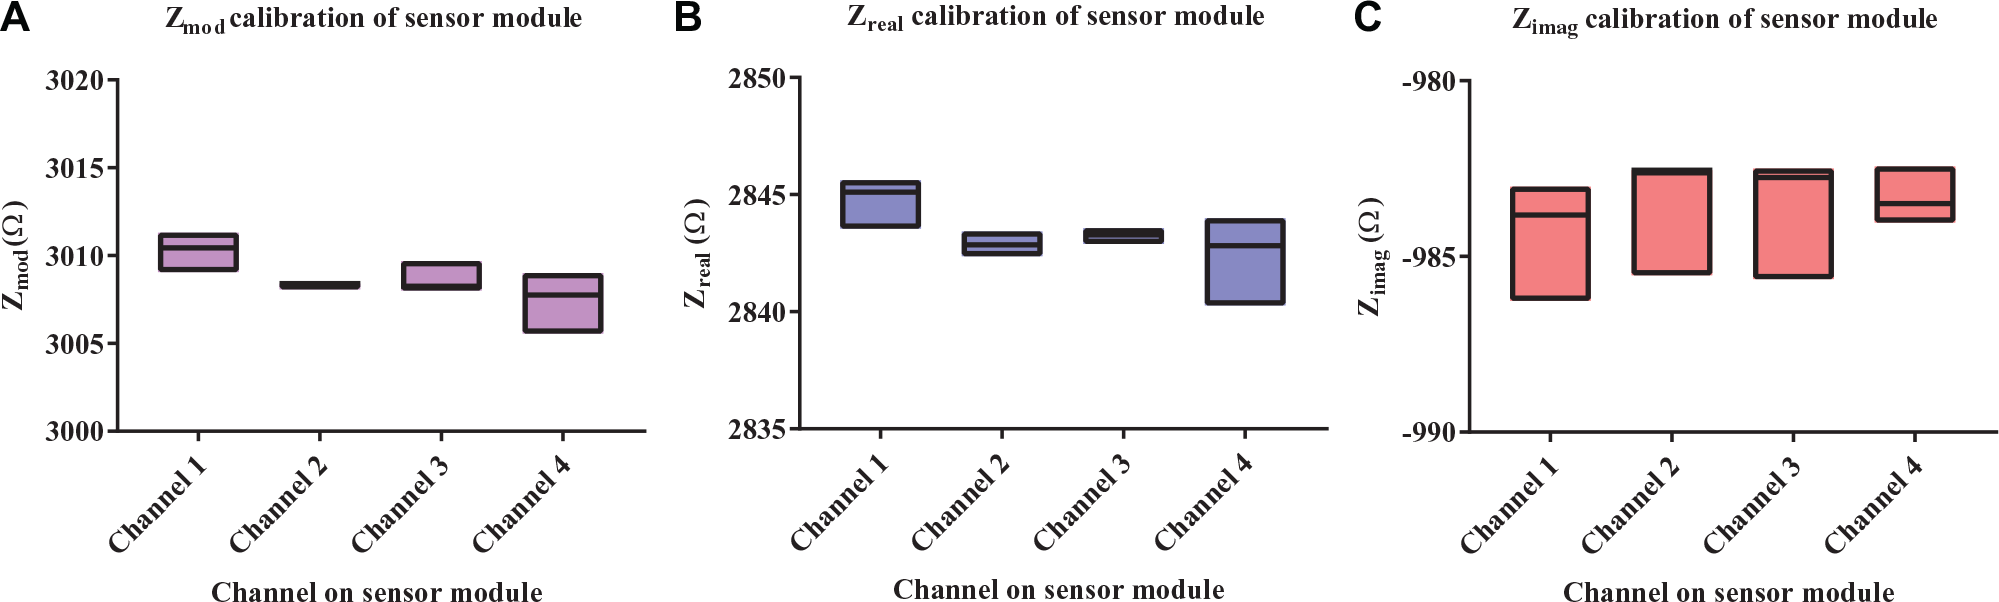
The sensing module was tested for individual channel offset on the calibration channel of a universal dummy cell (Gamry Instruments, Warminster, PA). Since ADuCM350 is an integrated measurement solution, the channel offset seen is minimum due to manufacturing control. Measured data were collected on a PC using a serial port. Figure 3A–C shows the impedance magnitude Zmod, real part Zreal, and imaginary part Zimag, respectively, for the dummy cell over a period of 15 min for a sampling rate of one sample per minute. The median of measured Zmod from Figure3A for the four channels was ~3008 Ω, with a variation of ~3 Ω among all medians. Figure 3B , C was calculated based on the measured impedance magnitude and phase. The medians for Zreal and Zimag were approximately 2843 and −987 Ω, respectively, with a variation of ~5 Ω. The spread of points was within ±10 Ω for each of the given plots. This constituted a 0.33% offset in measurement with respect to the Zmod median value; thus, the offset of each channel was considered negligible.
Spread of measured parameters obtained while calibrating individual channels of the sensor module using a dummy cell. (
Error Contribution in Measured Impedance
The spread of measurement obtained from Figure 3A–C shows the error contribution from the sensor module, which was taken as approximately ±10 Ω over four channels. This proves good precision of the sensor module. Thus, the analyzer module’s error contribution can be subtracted from the total error contribution to find the biosensor’s error contribution. The dose calibration response is shown in Figure 4A–C . This can be expressed as shown in equation 1 and holds true, as the sensor module and sensor can be modeled as uncorrelated noise sources.17–19 This expression holds for all measurements performed thereafter as well.

By using subtractive correction on the dose calibration response, the impact on the accuracy of measured impedance is discussed in all subsequent results sections.
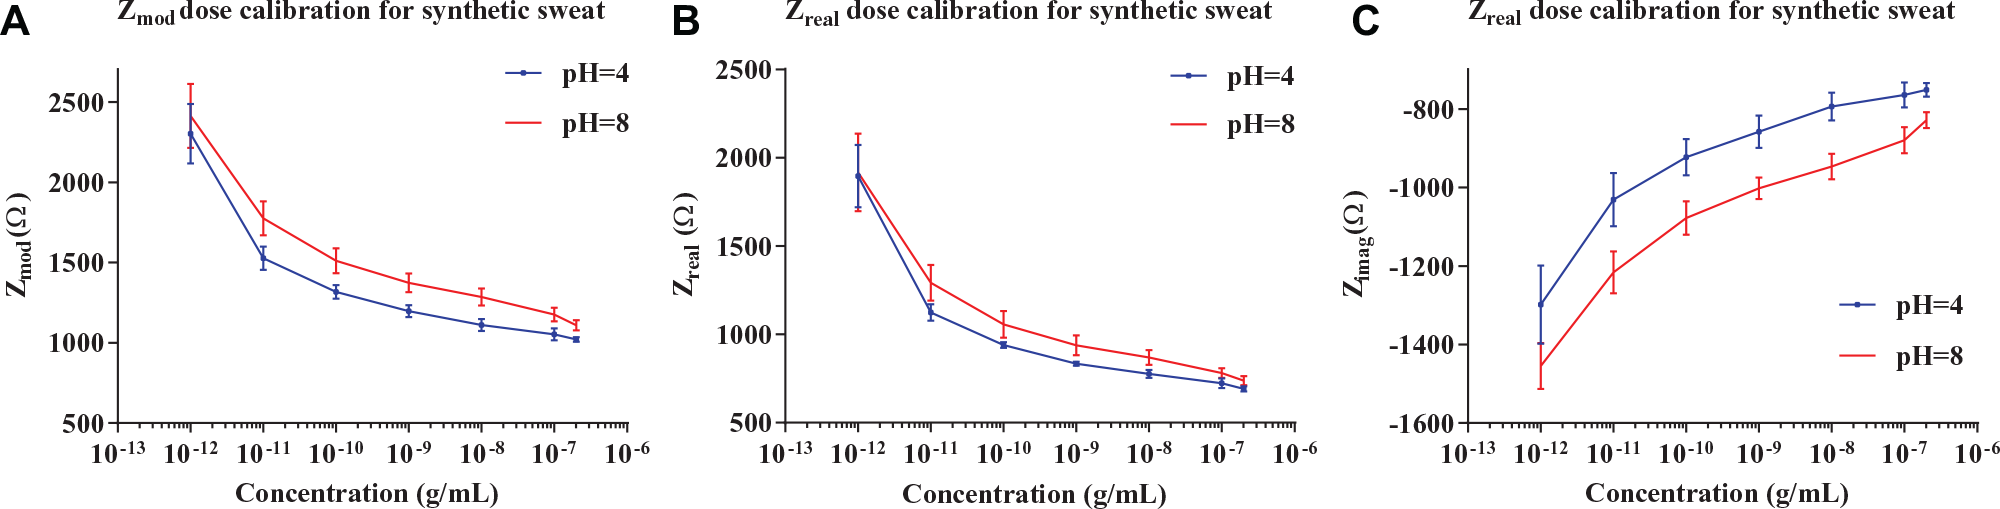
Average of measured impedance for dose calibration of the sensor module for synthetic sweat buffer of pH 4 and 8. (
Calibration of Sensor Module Using Synthetic Sweat
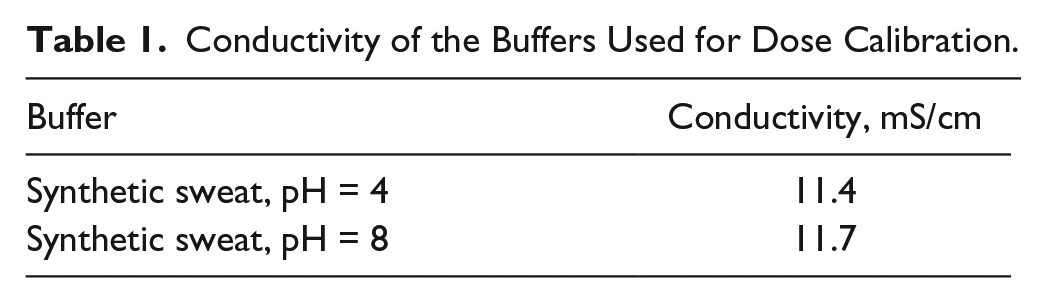
Nonfaradaic EIS measurements showed binding between cortisol and its antibody based on the change in the double-layer capacitance. For calibration of the sensor module, cortisol concentrations from 1 pg/mL to 200 ng/mL in synthetic sweat buffer for pH 4 and 8 corresponding to the low and high pH values typical of human sweat ( Table 1 ). All experiments were performed in the dark at room temperature. The hardware setup was programmed to measure impedance from four sensors using a 10 mV RMS sine wave at a frequency of 1 kHz. Allowing for greater than 10 times the Nyquist sampling rate for good accuracy of the AFE output, and correlated with previous work from our lab using an ultrasensitive benchtop potentiostat system (Gamry Reference 600, Gamry Instruments), we have established that 1 kHz is an optimal frequency for detecting cortisol using the EIS system. 10 Figure 4A–C depicts measured Zmod, Zreal, and Zimag, respectively, for cortisol concentrations, averaged over four replicates, each connected to one channel of the sensor module. Polynomial quadratic fit was performed for average Zmod and Zimag for concentrations from 10 ng/mL to 200 ng/mL, as shown in Table 2 . The function of Zmod ranging from 1 pg/mL to 1 ng/mL showed measured impedance ranging from 2500 to 1300 Ω. For Zimag measurements in synthetic sweat buffer of pH 8, the concentrations in 1 pg/mL to 1 ng/mL showed a quadratic function from 1450 to 1050 Ω. The function is linear for 10 to 200 ng/mL, showing impedance from 800 to 750 Ω. Since Zmod is a function of Zreal and Zimag, and the percentage change of impedance is similar to Zmod and Zimag, it can be proved that cortisol concentration modulates Zimag. Here, a linear correlation was shown from 10 to 200 ng/mL for measured Zimag, thus establishing a linear dynamic range of response for the physiological range of cortisol.
Conductivity of the Buffers Used for Dose Calibration.
Summary of Polynomial Fit Performed on Zmod and Zimag for Synthetic Sweat Buffer for pH 4 and 8 at Room and Elevated Temperatures and Human Sweat at Room Temperature.
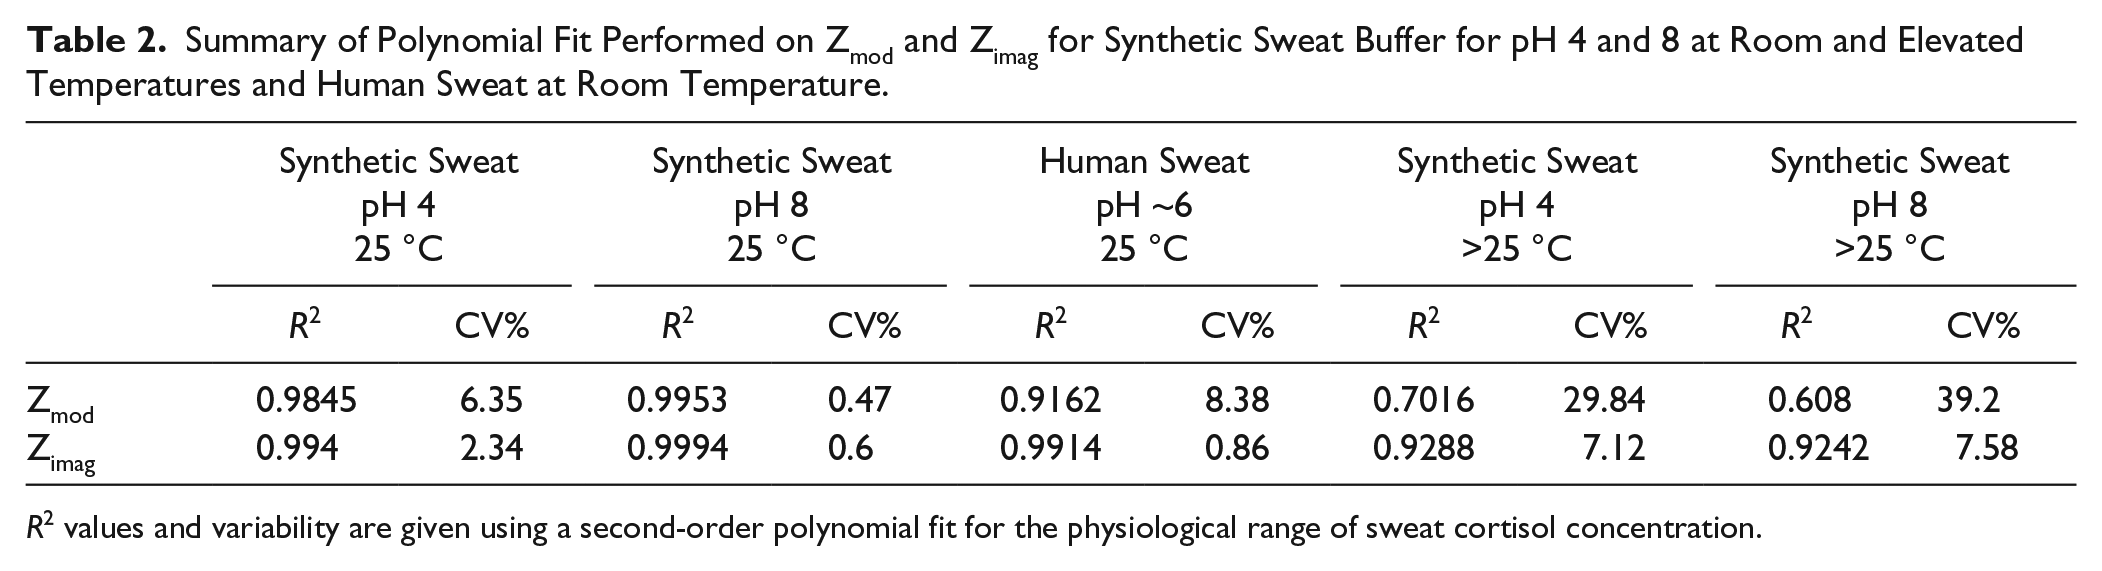
R2 values and variability are given using a second-order polynomial fit for the physiological range of sweat cortisol concentration.
Calibration of Sensor Module Using Human Sweat
EIS measurements were performed for cortisol concentrations from 1 pg/mL to 200 ng/mL in human sweat. Figure 5A , B shows measured Zmod and Zimag averaged over four replicates. Polynomial quadratic fit was performed for average Zmod and Zimag for concentrations from 10 to 200 ng/mL, as shown in Table 2 . For concentrations ranging from 1 pg/mL to 1 ng/mL, Zimag varies from approximately −1800 to −1050 Ω. For 10 to 200 ng/mL, the variation of Zimag is approximately −1050 to −1030 Ω. The clinically established cortisol concentration in human sweat has been reported to be in the range of 8–140 ng/mL. 3 Thus, sensitivity to variation in cortisol concentration is established for the biosensor using the EIS analyzer module. Comparing Figures 4C and 5C , the slope is less prominent in human sweat due to the presence of a multitude of ions and other metabolites. 20
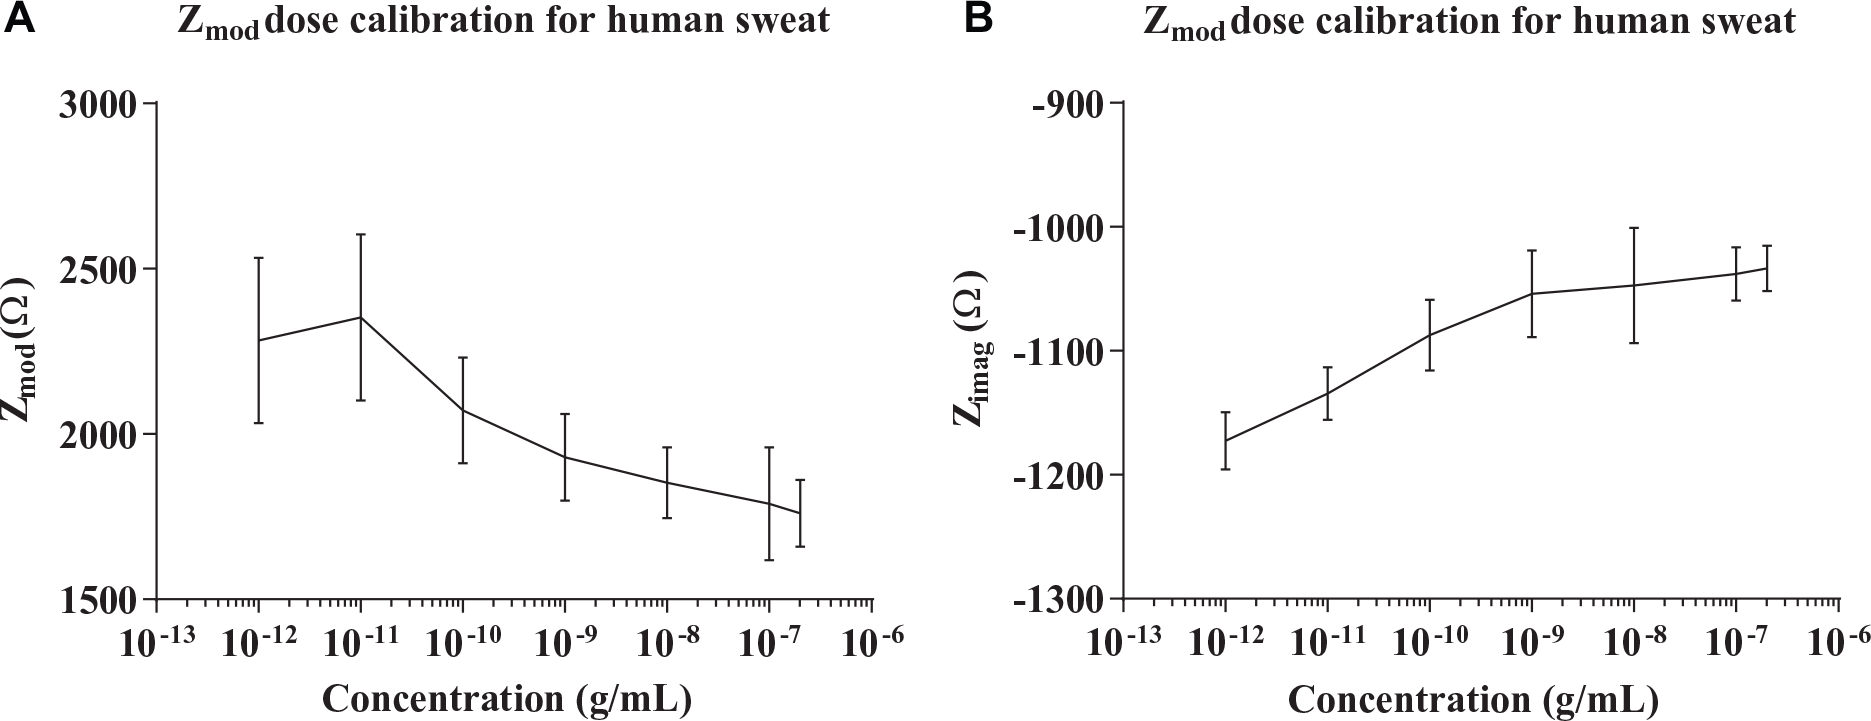
Average of measured impedance for dose calibration of the sensor module for human sweat buffer at pH 6. (
Continuous Dose Testing for Chemi-Impedance Sensor
The robustness of the sensor module to function as a sweat patch for continuous measurements was studied by continuous dosing of the sensor over a period of 60 min using the EIS analyzer module. EIS measurements were taken at the rate of one measurement per minute. This measured impedance of each sensor was normalized over the baseline impedance Zbaseline, which is defined as the impedance of the functionalized assay at time t = 0. The test results were averaged over four sensors, where one sensor was connected to each channel. Thus, the normalized change in impedance was calculated as given in equation 2:

This expression was used to evaluate average changes in Zmod and Zimag. Figure 6A , B shows the fractional change in Zmod and Zimag, respectively, for four dose concentrations in synthetic sweat buffer at pH 4, while Figure 6C , D shows the fractional change for pH 8 over a period of 60 min. For each dose concentration shown, the dose was introduced at intervals t = 0, 15, 30, and 45 min, respectively. Since the antigen–antibody binding interaction produces a smaller change to the electrical double layer for lower concentrations, the conductivity of the assay decreased. At zero continuous dosing, due to no desirable interaction, the drying of the chip shows a large decrease in fractional change of Zmod and Zimag. The measured fractional Zimag change of the biosensor for a 10 ng/mL cortisol concentration at pH 4 is ~35%. With higher concentrations of 100 and 200 ng/mL, due to more binding interaction, the capacitive behavior of the biosensor becomes less prominent; thus, a fractional change of 25% and 23% was observed.
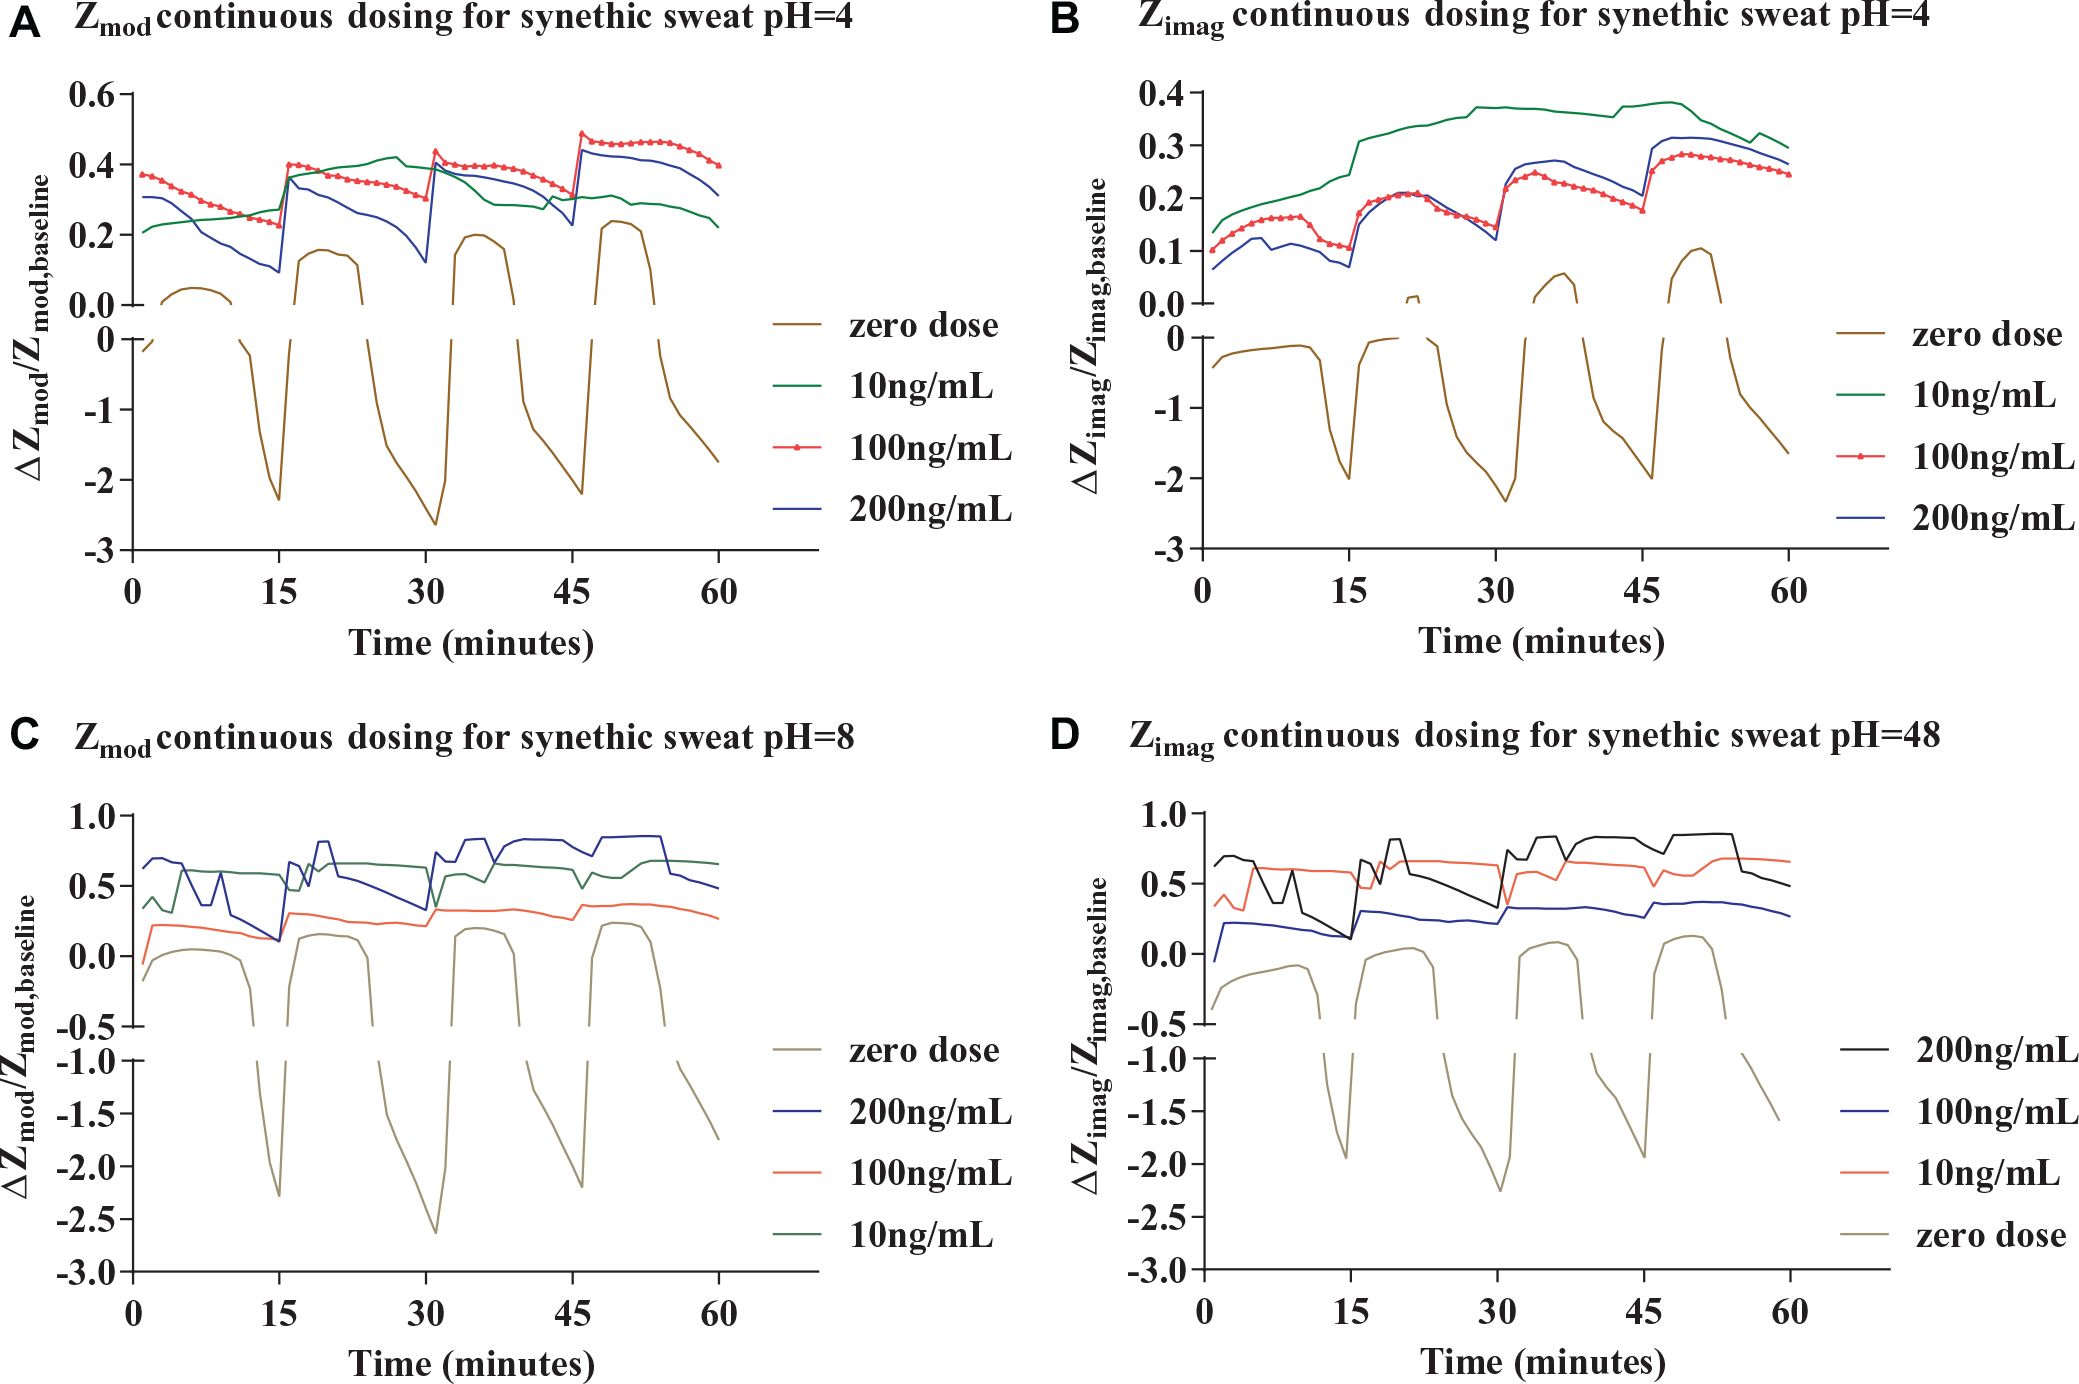
Fractional change in average measured impedance for continuous dose testing in synthetic sweat buffer. The dose was dispensed at an interval of 15 min for the sensors under test. Fractional change of Zmod (
The measured impedance for pH 4 translated to an equivalent RC circuit combination and is depicted in Figure 7A , B , which shows that the change in Zimag is more prominent for the proposed biosensor due to changes in double-layer capacitance. The spread of the measured impedance values is shown in Figure 8A , B for pH 4 and Figure 8C , D for pH 8. The interquartile regions depict impedance over a period of 60 min and show that the sensor module can differentiate different dose concentrations. It can be seen that for 10 ng/mL, the spread of the measured Zimag is 150 Ω due to lower binding interaction. With a higher binding interaction at 100 and 200 ng/mL, the spread reduces to 50 and 100 Ω. Thus, the spread of measured points depicts the ability of the sensor module to differentiate between the presence and absence of cortisol.
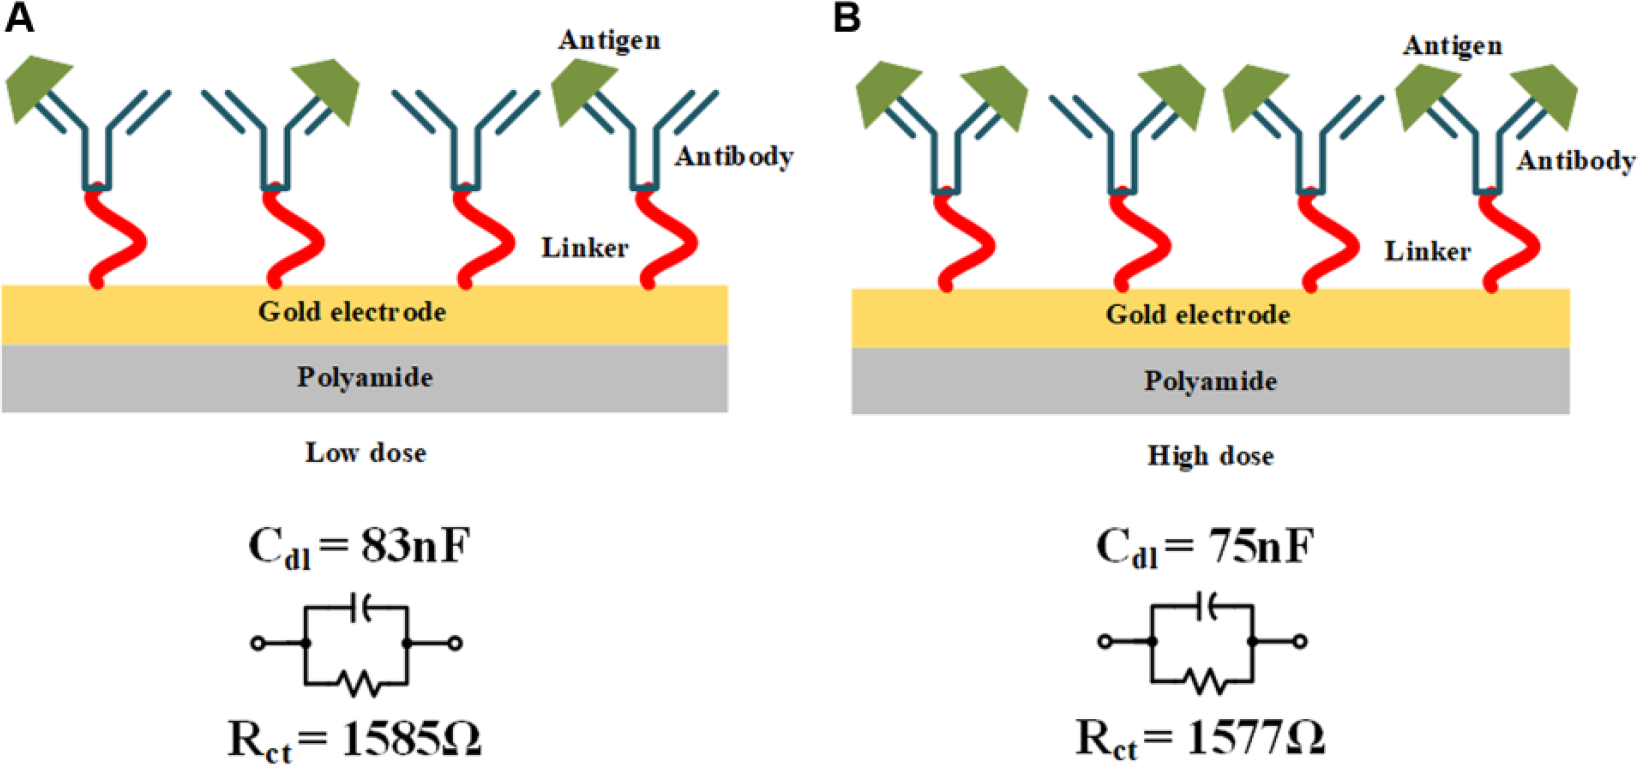
Visual representation of antigen–antibody binding at the sensor interface during low-dose and high-dose concentrations. Averaged PSPICE model for the biosensor under continuous dose testing for synthetic sweat buffer at pH 4 for (
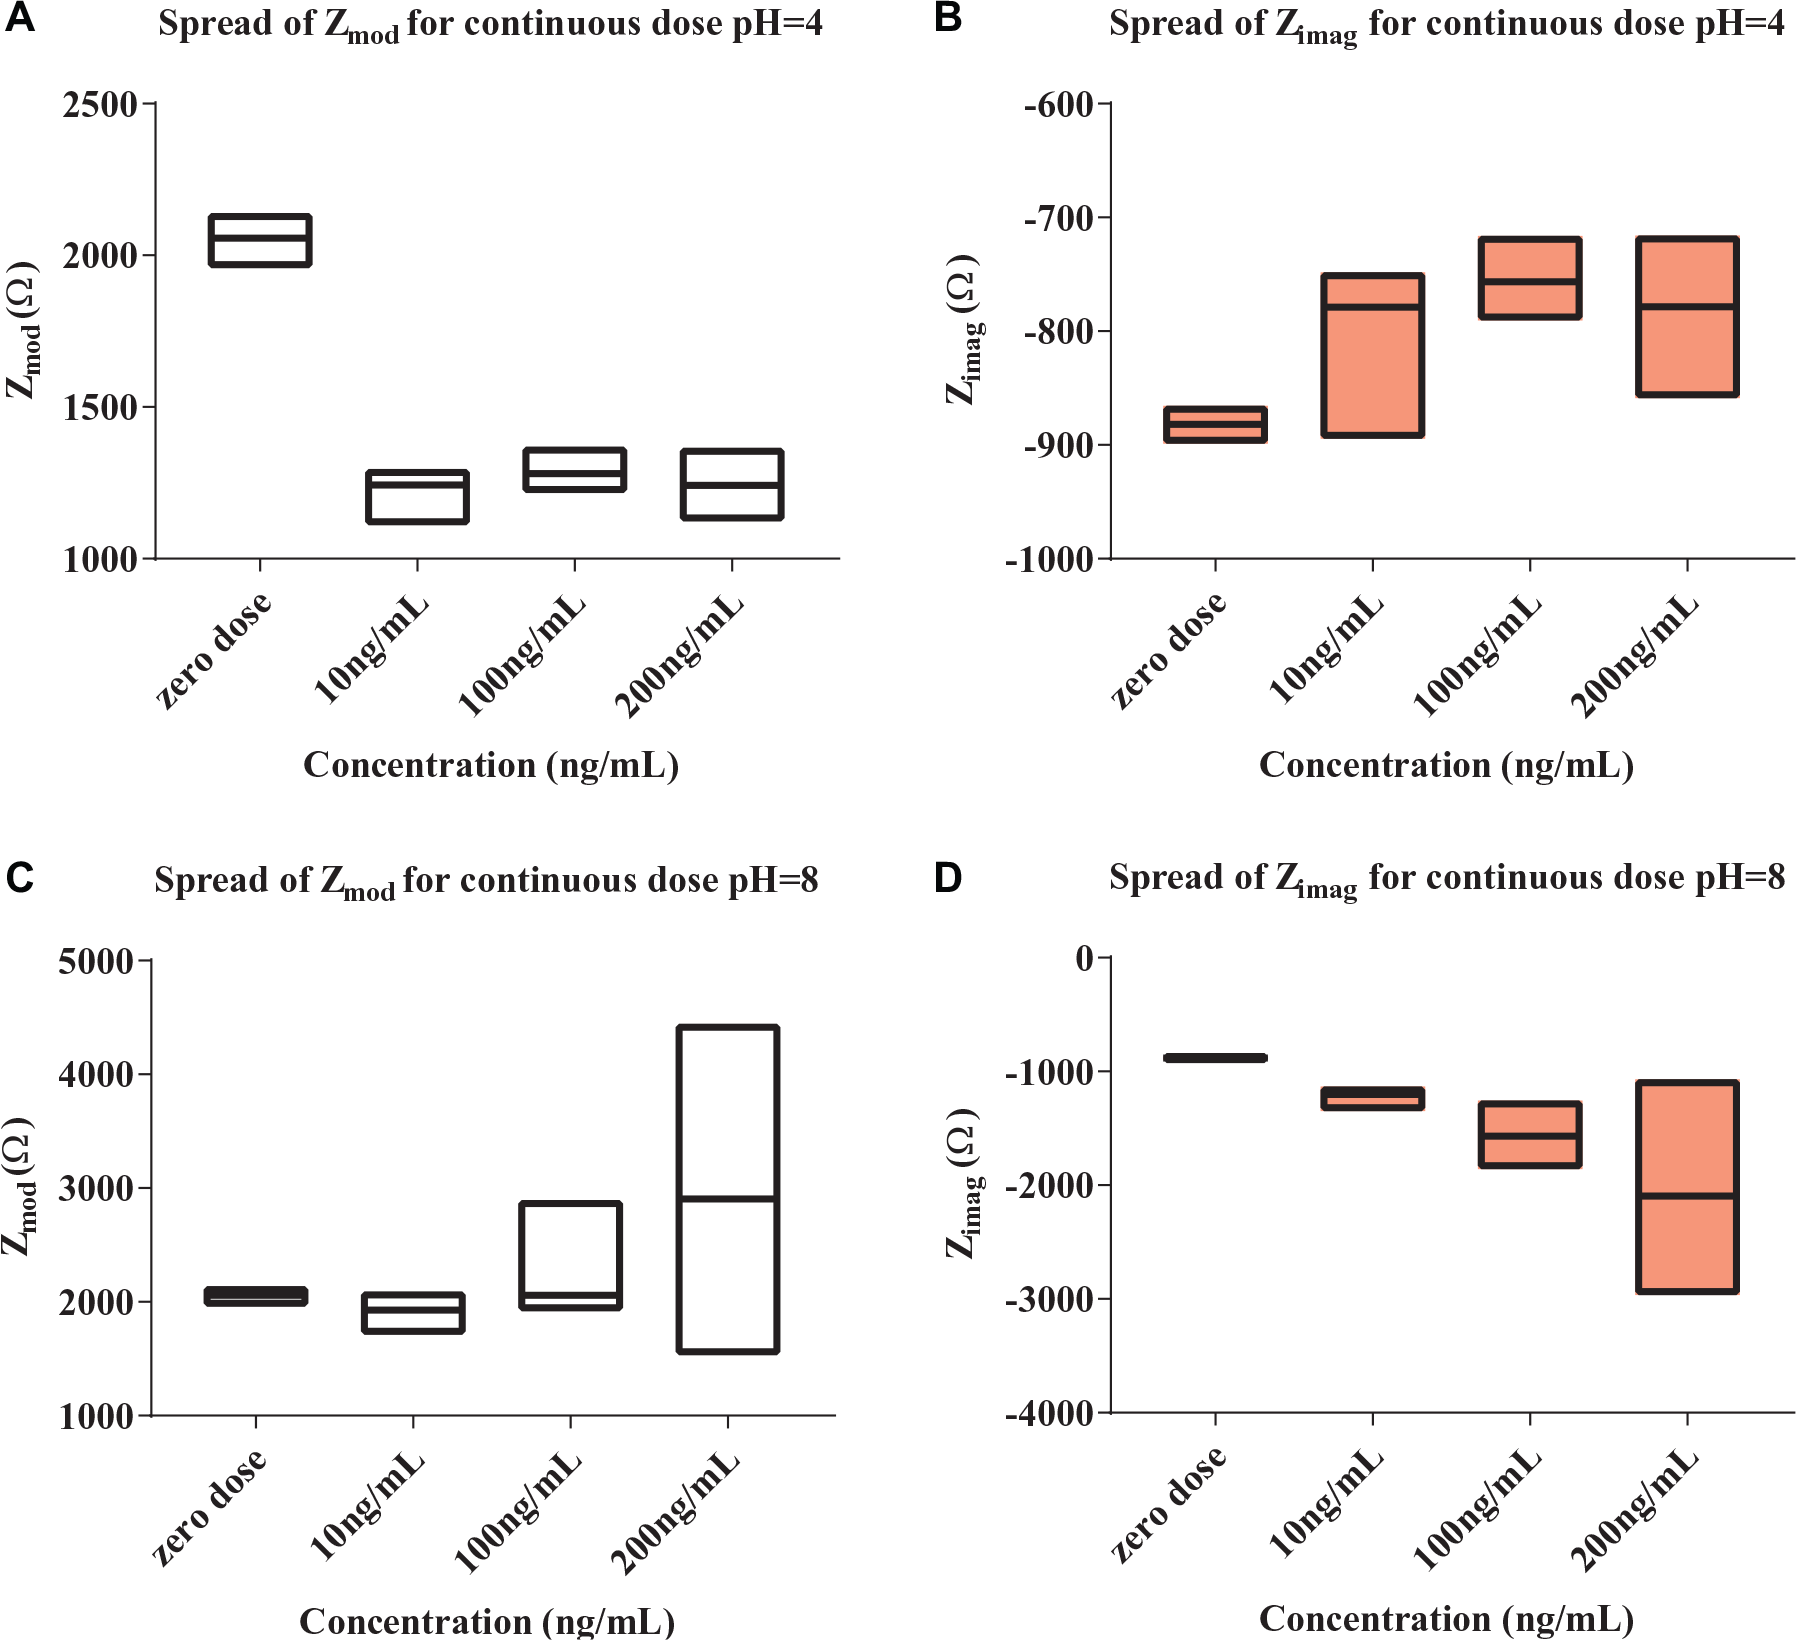
Spread of measured parameters for continuous dose testing. (
Temperature Stability of Chemi-Impedance Sensor
The goal of the sensor is to function as a wearable device; hence, assessing its performance over a wide range of temperatures from room temperature to elevated body temperature is important. Figure 9B shows the test conditions set for the temperature study, in which a temperature profile ranging from 25 to 40 °C and back to 25 °C was applied twice to the sensor as well as the sensor module. Concurrently, at an interval of 5 min, dose concentrations starting from 10 to 200 ng/mL were dispensed in increments of 10 ng/mL. Figure 9C , D shows measured fractional change in Zmod and Zimag for synthetic sweat buffer for pH 4 and 8. The measured change of Zimag was fit to a second-order polynomial with R2 of ~0.92. Table 2 shows the R2 and the variability of the fractional change function of Zimag measured over a period of 90 min. Based on this R2 value, a variability of ~7.6% from the ideal second-order polynomial fit was shown for a temperature range of 25–40 °C for repetitive temperature cycles.
(
Conclusions
Wearable lancet-free and label-free biosensors based on human sweat are novel devices that can detect various disorders in the human body; one such important biomarker is cortisol. Various amperometry techniques, such as chronoamperometry and cyclic voltammetry, employ a large potential difference to measure the change in impedance corresponding to the biomarker of interest with a high signal-to-noise ratio. Due to a transient in voltage, the measurement device will experience a large transient, causing instability and errors in measurement. Moreover, due to the larger settling time of the current, density gradients cause undesirable convective disruption of the diffusion layer. 21 This in turn disrupts the diffusion layer, leading to a larger drawing of current as per Cottrell’s equation. However, to develop a bioelectronics interface that captures the dynamic changes to cortisol in human sweat, there is a need to develop a method of measuring impedance changes from arrays of sensors enabling larger throughput. EIS enables measurement of the nonfaradaic impedance modulations occurring at the electrode–electrolyte interface in a dynamic manner without disruption of the affinity capture probes, hence offering a robust sensor platform suitable for continuous monitoring of dynamic changes to cortisol levels.
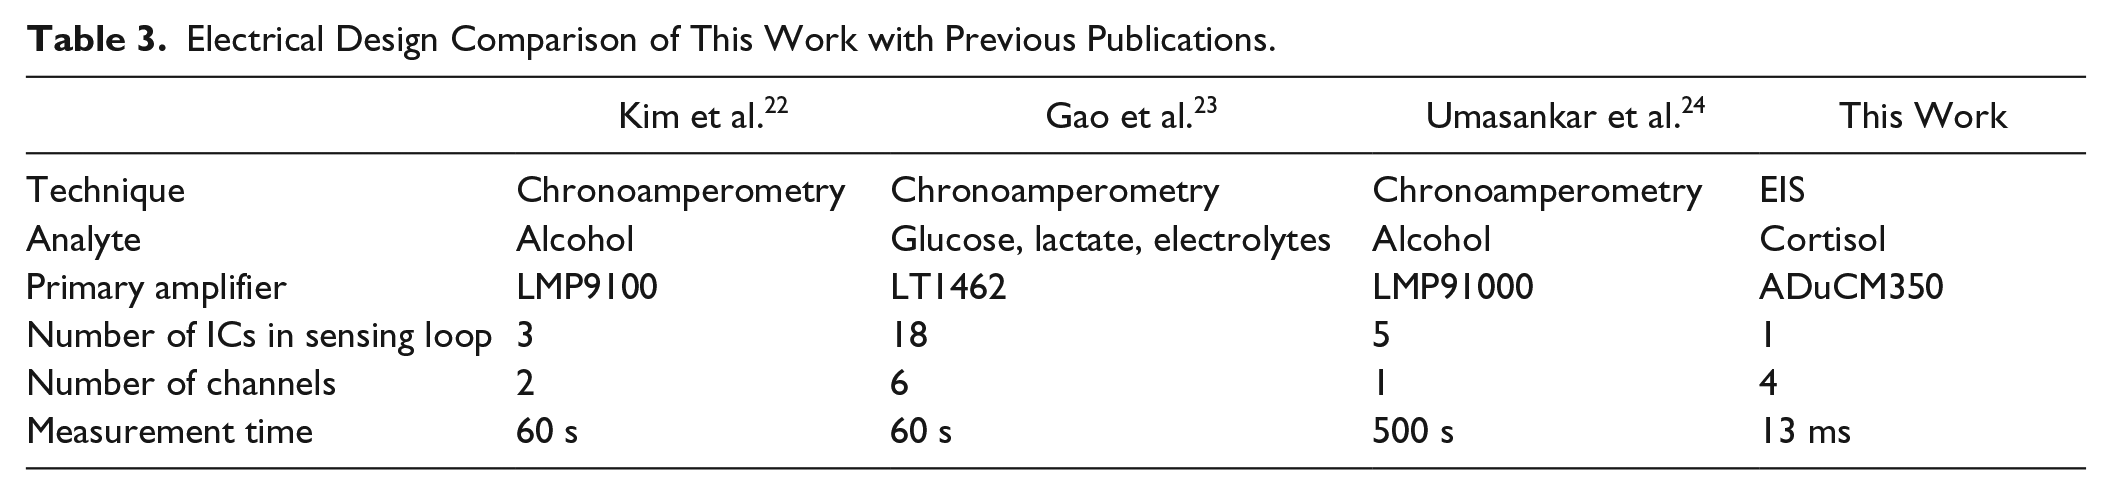
The four-channel EIS sensor analyzer module that has been presented in this work is capable of sensing cortisol concentrations in both synthetic and human sweat using gold-based flexible, wearable biosensors. Table 3 shows an electrical comparison of this design with preview publications. It is evident that the proposed sensor platform design is more efficient in terms of implemented active silicon and is capable of being further miniaturized. Moreover, a 13 ms measurement time per channel makes it the fastest measurement device reported to date. We believe that this is the first multiplexed EIS platform capable of translation to a wearable device reported in the literature. The accuracy of the biosensor module was established using dose calibration response in synthetic sweat for pH 4 and 8, as well as for human sweat at pH ~6. Moreover, correction of measured impedance from the sensor module was proposed using the inherent error contribution of the sensor module. Furthermore, sensing of the presence or absence of cortisol for continuous dosing of the biosensor was confirmed using synthetic sweat for pH 4 and 8. In addition, temperature cycle testing was performed to show stability of the sensor for variation of temperature cycles for a range of 25–40 °C with ~7.6% variability on a second-order polynomial fit.
Electrical Design Comparison of This Work with Previous Publications.
Footnotes
Acknowledgements
The authors acknowledge David Kinnamon for technical support in sensor fabrication and Badrinath Jagannath, Ashlesha Bhide, and Roshan Manuel for technical support in experimental preparation.
Declaration of Conflicting Interests
The authors declared the following potential conflicts of interest with respect to the research, authorship, and/or publication of this article: Drs. Shalini Prasad and Sriram Muthukumar have a significant interest in EnLiSense LLC, a company that may have a commercial interest in the results of this research and technology. The potential individual conflict of interest has been reviewed and managed by the University of Texas at Dallas and played no role in the study design; in the collection, analysis, and interpretation of data; in the writing of the report, or in the decision to submit the report for publication.
Funding
The authors received no financial support for the research, authorship, and/or publication of this article.