
Abstract
The electrochemistry reduction of coenzyme Q10 (CoQ10) on silver electrodes has been investigated in mixed solvent containing 95 vol. % ethanol and 5 vol. % water. A combination of cyclic voltammetry (CV) and electrochemical impedance spectroscopy (EIS) is employed to explore the mechanism of redox processes of CoQ10 in the presence and absence of oxygen, respectively. It has been proved that the redox reaction of CoQ10 is highly dependent on the oxygen in the solution compared with that of CoQ0, which may be attributed to the isoprenoid side chain effect of CoQ10. Moreover, the effects of experimental variables such as electrolyte component, pH, temperature, and sonication time on the amperometric and potentiometric responses of CoQ10 are presented. The differential pulse voltammetry method has been developed for the quantification of the CoQ10 in the complex samples. Under the optimum conditions, the method is linear over the concentration range of 1.00 × 10⁻⁷ to 1.00 × 10⁻³ mol/L (8.63 × 10⁻² to 8.63 × 10² mg/kg). The limit of detection (3σ/k) is 3.33 × 10⁻⁸ mol/L (2.88 × 10⁻² mg/kg). The recoveries of the spiked samples are between 91% and 108%. The presented method can be applied to the analysis of CoQ10 in real samples without any pretreatment.
Keywords
Introduction
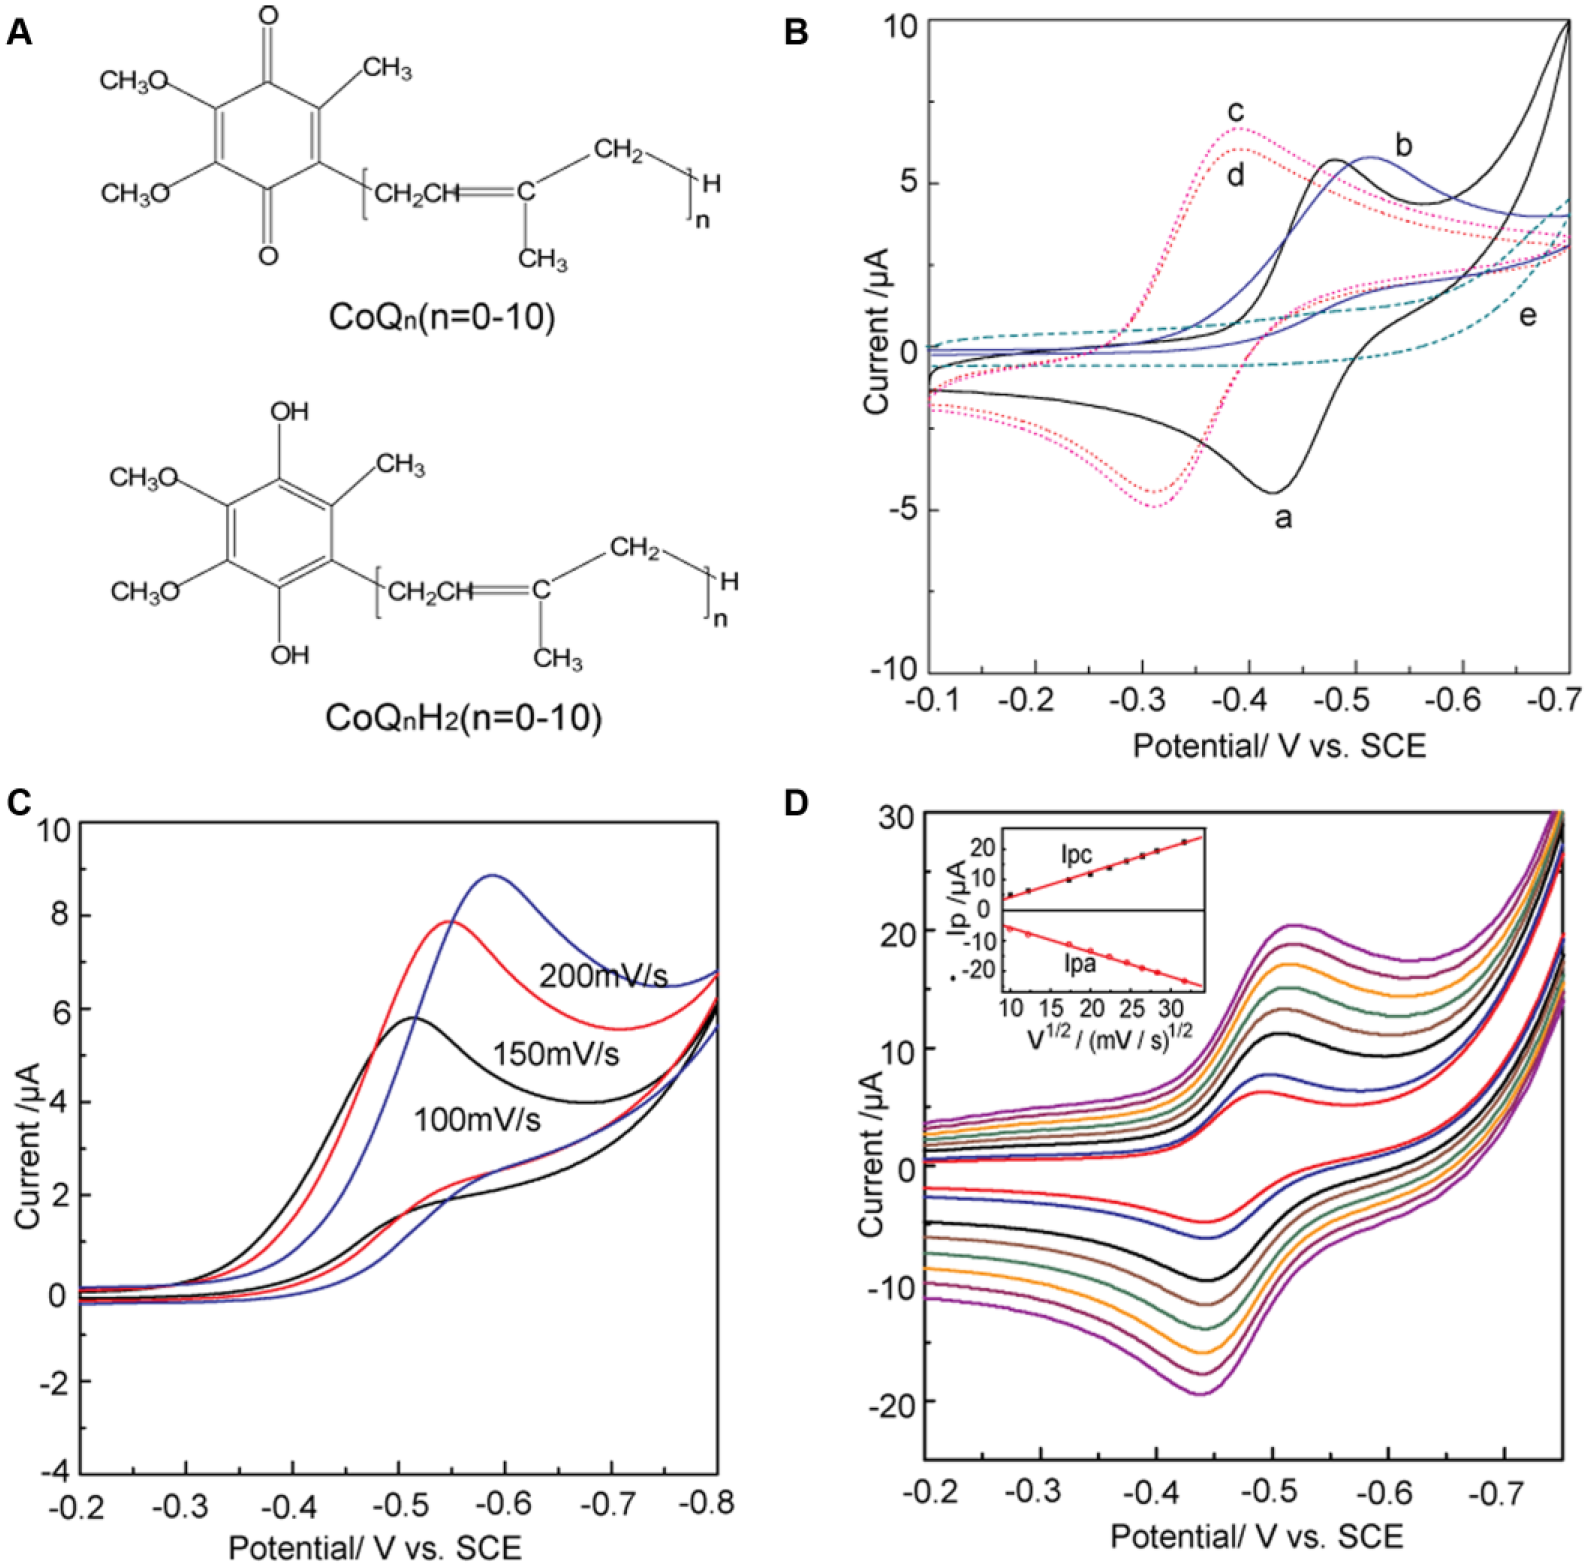
Coenzyme Q10 (ubiquinone-10, 2,3-dimethoxy-5-methyl-6-decaprenyl-1, 4-benzoquinone, CoQ10), an endogenous enzyme cofactor produced in all living cells in humans and distributed in cellular membranes, is an essential component of the mitochondrial respiratory chain.1–4 CoQ10 is the most common coenzyme Q in animals and coexists with its reduced form (CoQ10H2 or ubiquinol-10) that is the predominant form in the tissues of living beings ( Fig. 1A ).5,6 Coenzyme Q0 (CoQ0), a naturally occurring analogue of the main member of the mitochondria respiratory chain (CoQ10), is indeed recognized by the enzyme as a substrate ( Fig. 1A ). The electrochemical properties of CoQ10 has attracted attention because CoQ10 participates in a variety of antioxidant reaction. The overall redox process of CoQ10 can be regarded as consisting of a series of consecutive electron-transfers and chemical steps.7,8

(
It is noteworthy that the pH values have significant effect on the mechanism of the cathodic reduction of CoQ10.9,10 Moreover, the present redox process that occurs in two one-electron, one-proton stages is irreversible. 11 However, the detailed electrochemical mechanism of CoQ10 has remained elusive due to the different electrodes and complicated medium. It is known to us that the metal electrodes can be used to explore the mechanism of biological redox cycling of bioactive molecules.9–11Although the redox characteristics of quinone compounds on the gold or platinum surface have been studied extensively, the quinone compounds are physisorbed on the surface of the Au or Pt electrode.12,13 As a biomimetic membrane system, the Ag electrode facilitates adsorption kinetics of quinone compounds and provides a versatile platform to investigate redox properties of CoQ10 at the interface, thus providing insights into the electron transfer process of CoQ10 in biological systems. 14 In addition, the effect of oxygen on the electron transfer function of CoQ10 has rarely been investigated by electrochemistry.15,16 Therefore, it is imperative to study the effect of oxygen on the redox mechanism of CoQ10 in a protonic aqueous solution, which is similar to the condition existing in the organism.
In this article, we investigated the electrochemical properties of CoQ10 in ethanol/water (95:5, v/v) on a silver electrode before and after being degassed with nitrogen by using cyclic voltammetry (CV). Interestingly, the cathodic reduction of CoQ10 on a silver electrode has proved to be a one-electron, one-proton reversible redox reaction. Furthermore, the electrochemical behavior of CoQ10 on the silver surface is confirmed by electrochemical impedance spectroscopy (EIS). An interesting property of the CoQ10 is its ability to form stable semiquinone radicals (CoQ10H•) in an oxygen-free ethanol aqueous (see below). The tendency to form semiquinone radicals is responsible for the antioxidant properties of many biologically active compounds. 17 Moreover, the antioxidants can be used to scavenge the reactive oxygen species or lipid radicals, thus protecting cells against peroxidative damage. 18 The result provides insights into the effect of oxygen on the electrochemical properties of CoQ10 in the aqueous solution, which benefits the study of the distribution and function of CoQ10 in lipid bilayers. Furthermore, this electrochemical system could be useful as a platform to examine several biologically relevant electroactive molecules in lipid bilayer membranes. 19 To our knowledge, this is the first time the effect of oxygen on the electrochemical behaviors of CoQ10 on silver electrodes by CV and EIS has been studied.
Since CoQ10 is of great importance, it is necessary to investigate CoQ10 in real samples. This species has been determined mainly by high-performance liquid chromatography (HPLC) with different methods of detection: diode-array UV-Vis detection (DAD), electrochemical detection (ECD), or mass spectrometry (MS).20–22 The HPLC methods showed clear advantages over other techniques due to their separation ability and specify. Thus, they are regarded as suitable for the quantification of CoQ10 at low concentrations in a complicated matrix. However, these methods promote the preconcentration of sample analytes by multisolvent extraction procedures and solid-phase extraction, which are complex and time-consuming. Thus, it is desirable to develop operationally simple, robust, sensitive, and accurate methods to analyze CoQ10 in several samples. Compared with other analytical techniques, the differential pulse voltammetry (DPV) technique possesses the advantages of simplicity, rapidity, and sensitivity, thus having significant potential utility in emergency and rapid response detection. The main objective of our study was to develop a DPV method for the direct determination of CoQ10 in the complex samples. This developed method was fully validated and applied to the real samples of CoQ10. The results obtained by the developed methods were compared with the HPLC method in the literature.23–25 It is anticipated that the proposed method will be developed into a fast and sensitive technique widely used in the determination of CoQ10 in real samples and in the assessment of biochemical properties of CoQ10 in living cells.
Materials and Methods
Chemicals
Coenzyme Q10 (CoQ10) and coenzyme Q0 (CoQ0) were purchased from Sigma Chemical Co. (St. Louis, MO) without further purification. Analytical-grade NaClO4 was purified by recrystallization. Other chemicals were analytical-grade reagents (>99%). All solutions used in the experiments were prepared with Milli-Q water (Millipore, Billerica, MA) with a conductivity of 18 MΩ·cm. Buffer solutions of various pH values were prepared using the following mixtures: sodium acetate–acetic acid buffer (0.1M NaAc-HAc, pH 4.0–5.0), phosphate-buffered saline (PBS) buffer (KH2PO4/K2HPO4, 0.10 M NaCl, pH 6.0–8.0), and Tris buffer (Tris [hydroxylmethyl] aminomethane + HCl, pH 7.5–9.0).
Stock solutions of 10.00 mmol/L CoQ10 and CoQ0 were obtained by directly dissolving CoQ10 and CoQ0 in 25.00 mL ethanol/water (95:5, v/v) solution degassed with nitrogen, respectively. Then the prepared solution was sonicated for 2 min and stored at 0 °C to 5 °C for later use. Test solutions were diluted from a stock solution with PBS at pH 6.5.
Fish, Animal tissues, and Vegetable Extraction and Purification
Six commercial samples, including fish, animal tissues, and vegetable, were purchased at random from supermarkets in Shanghai. All the samples were kept frozen and stored at −80 °C before analysis.
The fish, animal tissues, and vegetable were homogenized in ethanol/water (95:5, v/v) on an Ultra-Turrax Disperser (Ika, Staufen, Germany) to obtain a homogeneous solution. All extractions were performed at room temperature (20 °C ± 3 °C) and wrapped in aluminum foil to minimize light-induced isomerization. Typically, frozen samples (~50 mg) were put in a 20-mL centrifugal tube and mixed with 10 mL nitrogen-saturated ethanol/water (95:5, v/v) PBS solution (pH 6.5). Then the mixture was stirred for 5 min by using the TissueLyser LT (Qiagen, Hilden, Germany). Afterward, the samples were centrifuged under 6000 rpm for 5 min, and the supernatant was transferred to a new centrifugal tube. The remaining precipitation experienced the same extraction process twice again with 10 mL and 5 mL of the extract solvent, respectively. The final supernatant was combined and kept in the refrigerator at −40 °C for 2 h. After being frozen, the precipitated protein was removed from the supernatant by centrifugation at 10,000 rpm for 15 min.
Subsequently, the extractions were incubated in boiling water with the cap open to concentrate the analytes under nitrogen. After the extractions were evaporated into a volume of around 0.5 mL and further diluted to 2 mL with ethanol/water (95:5, v/v) PBS solution (pH 6.5). Finally, the extractions were filtrated and prepared for electrochemical measurement and HPLC analysis.
Electrochemical Measurement
CV, EIS, and DPV studies were performed by using a CHI660C system (Shanghai, Chenhua Co., Ltd., Shanghai, China). The classical three-electrode system was used—namely, the silver disc (2 mm diameter; Shanghai Chenhua Co., Ltd.) was used as a working electrode (WE), and a platinum column electrode and a saturated calomel electrode (SCE) served as the counter electrode and reference electrode, respectively. The WE surface was mechanically polished with 0.05 µm gamma alumina slurry supported on a micro-cloth polishing pad (Shanghai Chenhua Co., Ltd.), followed by 5 min of sonication in deionized water to remove alumina particles, and dried under nitrogen atmosphere. Prior to the experiment, the buffer was bubbled thoroughly with high-purity nitrogen for 5 min. Then a stream of nitrogen was blown gently across the surface of the buffer solution to maintain the solution anaerobic in the experiment. For CV scanning, the potential scanning range was from −0.10 V to −0.80 V, and the scanning rate was 0.10 V·s−1. For DPV, the initial potential was −0.01V, the final potential was −0.80 V, and amplitude was 0.05 V. The impedance analysis was performed in the frequency range between 100 mHz and 100 kHz. All electrochemical measurements were carried in a Faraday cage at room temperature (20 ± 1 °C).
HPLC Measurement
The HPLC measurements were performed on a system composed of a Dionex LC-10AD pump (Thermo, USA), a Dionex model 232 Bio sample injector (Thermo, USA), a 25 × 0.46–cm YMC (Schermbeck, Germany) C30 analytical column including a C30 guard column (5.0 µm, 1 × 0.4 cm ID), and Jasco UV 970 detector at 274 nm (Japan).
The extraction of a 10-µL aliquot of CoQ10 was eluted with a mixture of methanol and ethanol (60:40) at room temperature, at a solvent flow rate of 1.0 mL/min. The concentrations of CoQ10 were calculated from the peak area at 274 nm (the absorption maxima for CoQ10).
Results and Discussion
CV
Figure 1B shows cyclic voltammetric curves obtained at a silver electrode in the ethanol/water (95:5, v/v) deoxygenated with high-purity nitrogen. A pair of redox peaks of CoQ10 was observed at −0.482 V and −0.421 V (curve a in Fig. 1B ), respectively. The formal potential (E0ox/red = −(0.482 + 0.421)/2 V = −0.447 V) of the pair CoQ10H•/CoQ10 at pH 6.5 is −0.447 V (vs. SCE). It is clear that the redox potential difference △Ep (△Ep = Epa − Epc = (0.482–0.421) V = 0.061 mV, 25 °C) of CoQ10 is closer to 59 mV than that of CoQ0 (△Ep = 0.074 V), which proves that the electrochemical reaction of CoQ10 is closer to a one-electron process. Interestingly, the curve showed an inconspicuous anodic peak for CoQ10 (curve b in Fig. 1B ) when CoQ10 was under the ambient condition in the presence of oxygen. A similar study was also carried out for CoQ0, where the insignificant change was found (curves c and d in Fig. 1B ). This may be attributed to much more influence of dissociative oxygen on the redox reaction of CoQ10 than that of CoQ0 (see below). Moreover, the anodic peak of CoQ10 ( Fig. 1C ) shifted toward a negative direction with increasing scan rates, which proved to be an irreversible reaction on the surface of the electrode. Therefore, the anodic peak in Figure 1C can be attributed to the effect of dissolved oxygen, which can quench the radical anions or induce successive chemical reaction. 26 Voltammograms presented in Figure 1C correspond to the case that the existence of oxygen could quench the semiquinone radicals (CoQ10H•). 27 The results indicate that the CoQ10H• can be observed in the one-electron redox process in anaerobic media.
Moreover, the ratio of the cathodic peak current (ipc) and the anodic peak current (ipa) is about 1 (i.e., ipc/ipa ≈ 1) (inset of Fig. 1D ), which implies that the products of electrochemical reaction are stable in anaerobic media and the redox reaction is reversible. In addition, on the basis of the linear relationship between the anodic peak currents and square root of potential sweep rates, the diffusion coefficient (D) of CoQ10 can be determined using the Randle-Sevick equation 28 :

where n, A, D, and v are the number of electrons transferred, the apparent surface area of the electrode, the proton diffusion coefficient, and the scan rate, respectively. C denotes the initial concentration of the CoQ10. From equation (2), a value of D = 2.24 × 10⁻⁷cm2/s for CoQ10, which was 0.17 times that of CoQ0 (1.3 × 10⁻⁶ cm2/s). The main reason for the difference in diffusion coefficient (D) between CoQ10 and CoQ0 can be attributed to the effect of the isoprenoid side chains of CoQ10 on the electron transfer process. 14
It can be concluded that the redox process of the CoQ10 absence of oxygen turns out to be a reversible one-electron reduction and gives stable CoQ10H• as primary products ( Fig. 1 ). However, the CoQ10H• will be quenched by oxygen when located in an environment full of oxygen, which also proves that reduced ubiquinone is able to scavenge the oxygen radical due to its antioxidation function. 29
EIS
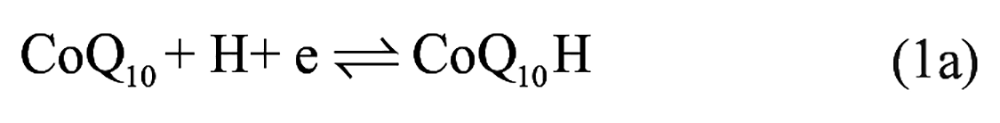
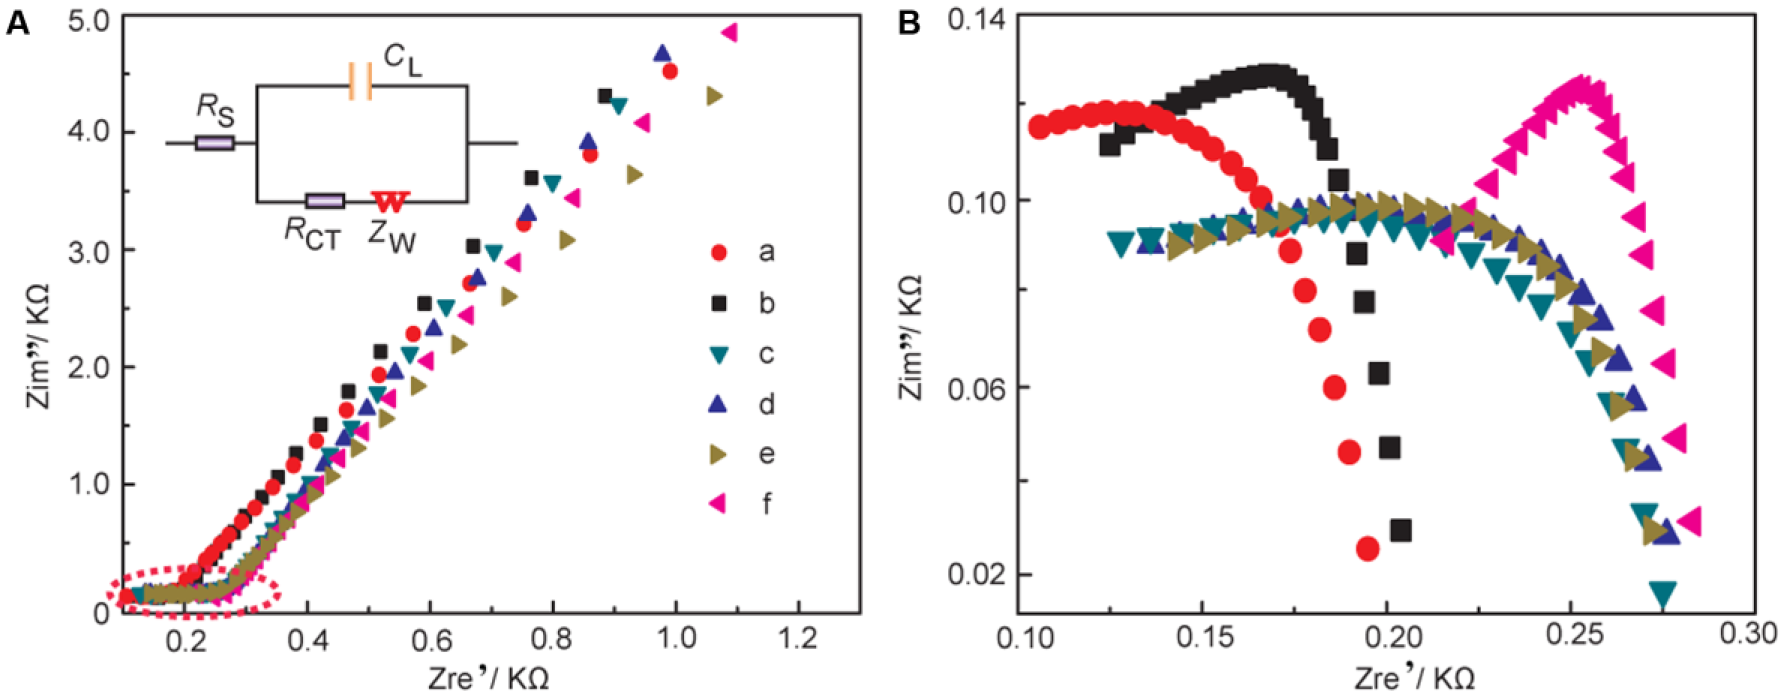
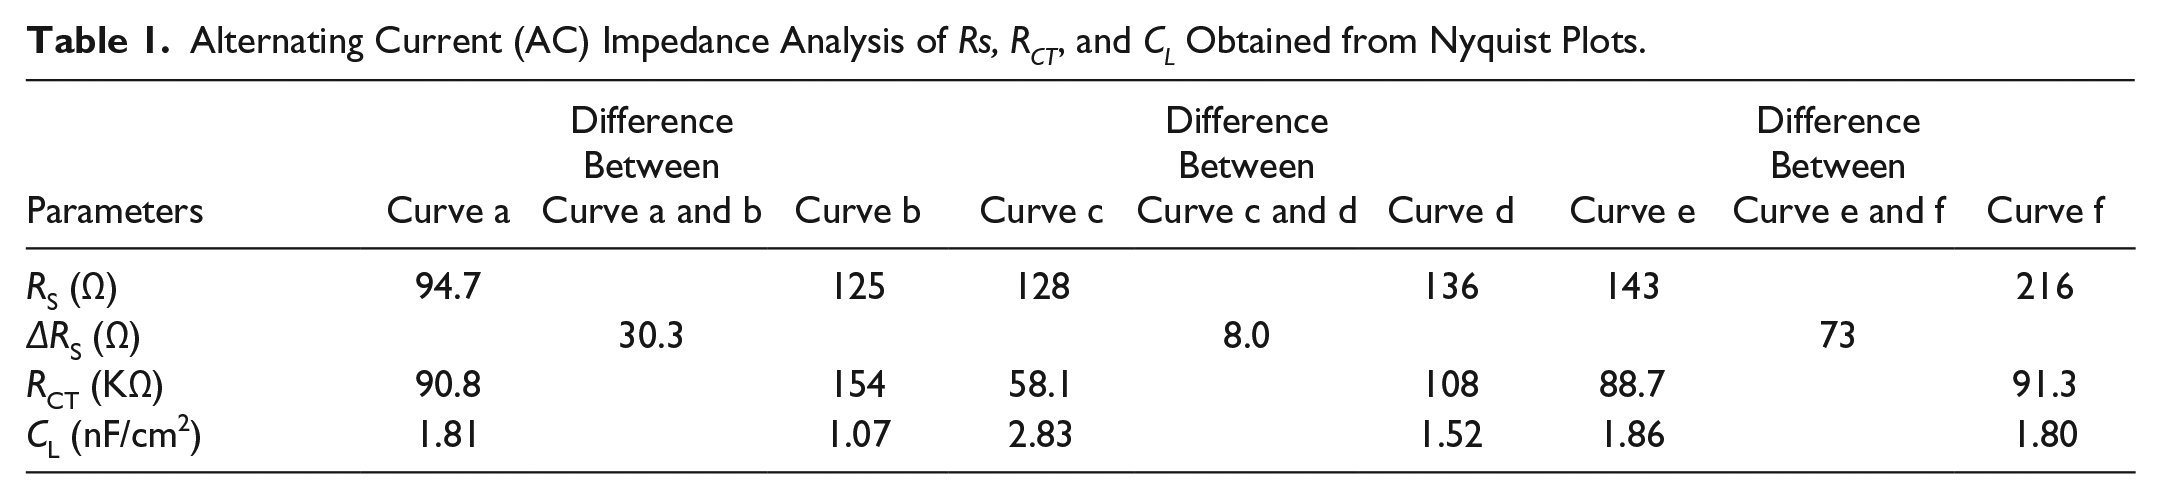
To further investigate the electrochemical reaction at the electrode-electrolyte interface, the alternating current (AC) EIS technique has been conducted due to its high sensitivity at the electrode-electrolyte interface. 30 The impedance experimental data are often plotted in a complex plane known as a Nyquist plot ( Fig. 2A ), and a modified Randles equivalent circuit (inset of Fig. 2A ) was chosen to fit the measured results. Figure 2B shows the enlarged AC impedance spectra in Figure 2A . From Figure 2B , the RS, RCT, and CL values of six systems are listed in Table 1 . It can be seen that a lower interfacial RCT resistance can be obtained after being degassed with nitrogen compared with that of the initial solution, which indicates that the oxygen can serve as an insulator for the transmitting electron. Interestingly, the △Rs (△Rs = Rs(before) – Rs(after)) of CoQ10 shows distinct change compared with CoQ0 and the supporting electrolyte alone, which may be attributed to more of an effect of dissociative oxygen on the electrochemistry of CoQ10 than that of CoQ0. The exact cause of the difference of △Rs between CoQ0 and CoQ10 is uncertain, which may be ascribed to the isoprenoid side chain effect of CoQ10. 31 Considering the results presented above, an one-electron, one-proton process of CoQ10 can be obtained under an oxygen-free environment, which was shown in equation (1a), but when it comes to the medium full of oxygen, an irreversible electrochemical reaction may occur as follows:


(
Alternating Current (AC) Impedance Analysis of Rs, RCT, and CL Obtained from Nyquist Plots.
It is clearly seen that oxygen can disrupt the balance of electron transfer functions of CoQ10H•, which impair the antioxidative balance of CoQ10H2 and increase pro-oxidative pathways of CoQ10. 32 Moreover, CoQ10H• has been monitored as a one-electron, one-proton electrochemical process of CoQ10 by spectroelectrochemistry. 14
Therefore, it can be concluded that oxygen has much more effect on CoQ10 than that of CoQ0. Simultaneously, this effective method will open up a new way to control the electrochemical reduction of CoQ10 by modulating the external oxygen.
Optimization of the Reaction Conditions
As shown in Figure 1 and Figure 2 , the peak currents can be seriously influenced by the reaction condition. Therefore, the optimal experimental variables should be chosen for studying the redox response of CoQ10. Therefore, a series of tests was performed to obtain the optimum conditions for the determination of CoQ10.
The effect of solvent composition on the peak current of CoQ10 is shown in Figure 3 . Ethanol/water (95:5), ethanol, hexane/ethanol (1:4), acetic acid/acetonitrile (4:1), and isopropanol were used as the test solution at the same pH 6.5. It could be seen that the ethanol/water (95:5) solution induces the maximum current signal of CoQ10. Due to the formation of CoQ10H• in the proton and electron transfer process in the presence of a suitable proton donor, it is reasonable that the aqueous solution can give a much more amperometric response than that of aprotic solvent or a weak protic solvent such as isopropanol. 33 However, the weak amperometric responses can be obtained in a hard acidic environment such as acetic acid/acetonitrile (4:1). The reason can be attributed to the impact of the hydrogen-bonding interaction on the semiquinone radicals (CoQ10H•). 34 In addition, the optimal ratio of electrolyte solution is examined by varying the volume ratio of the ethanol/water from 50:50 to 99:1 at pH 6.5 ( Fig. 4A ). It is shown that the solvent system has a significant effect on the potentiometric and amperometric responses of CoQ10. The peak current hit a climax when the ratio of ethanol/water was 95:5 and then decreased with increasing volume of ethanol. Therefore, the solution containing 95 vol. % ethanol and 5 vol. % water was selected as the electrolyte solution in this study.
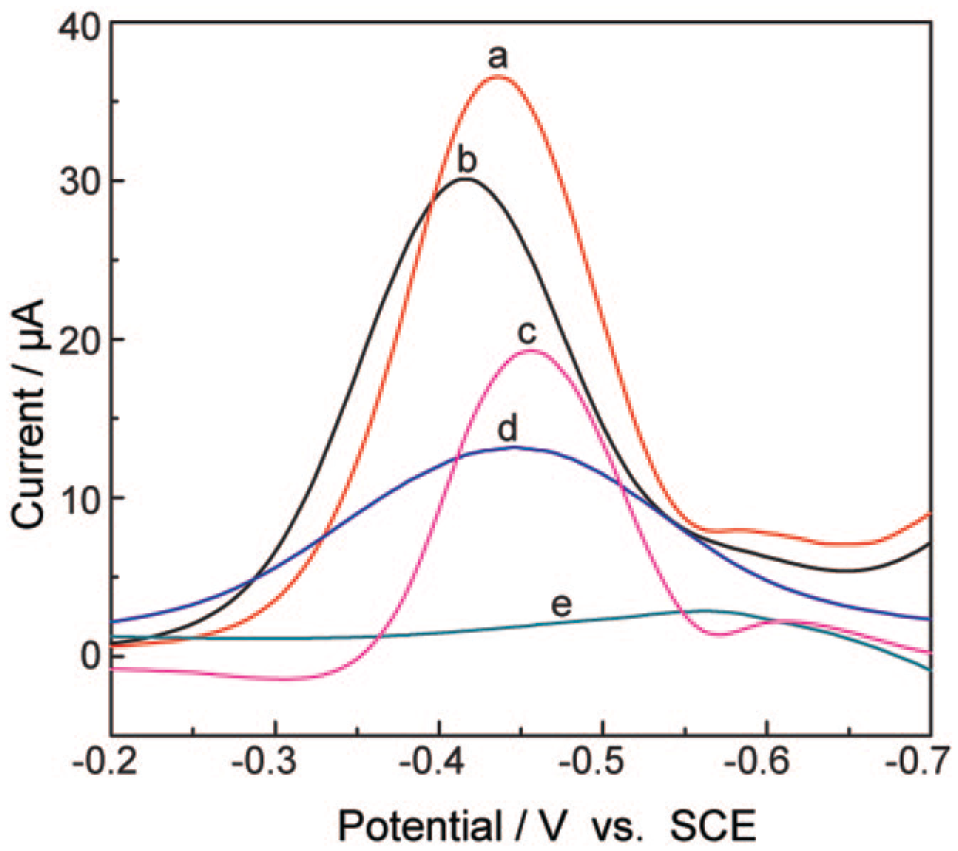
Differential pulse voltammograms for CoQ10 recorded in solutions of (a) ethanol/water (95:5, v/v), (b) ethanol, (c) hexane/ethanol (1:4, v/v), (d) acetic acid/acetonitrile (4:1, v/v), and (e) isopropanol. SCE, saturated calomel electrode.
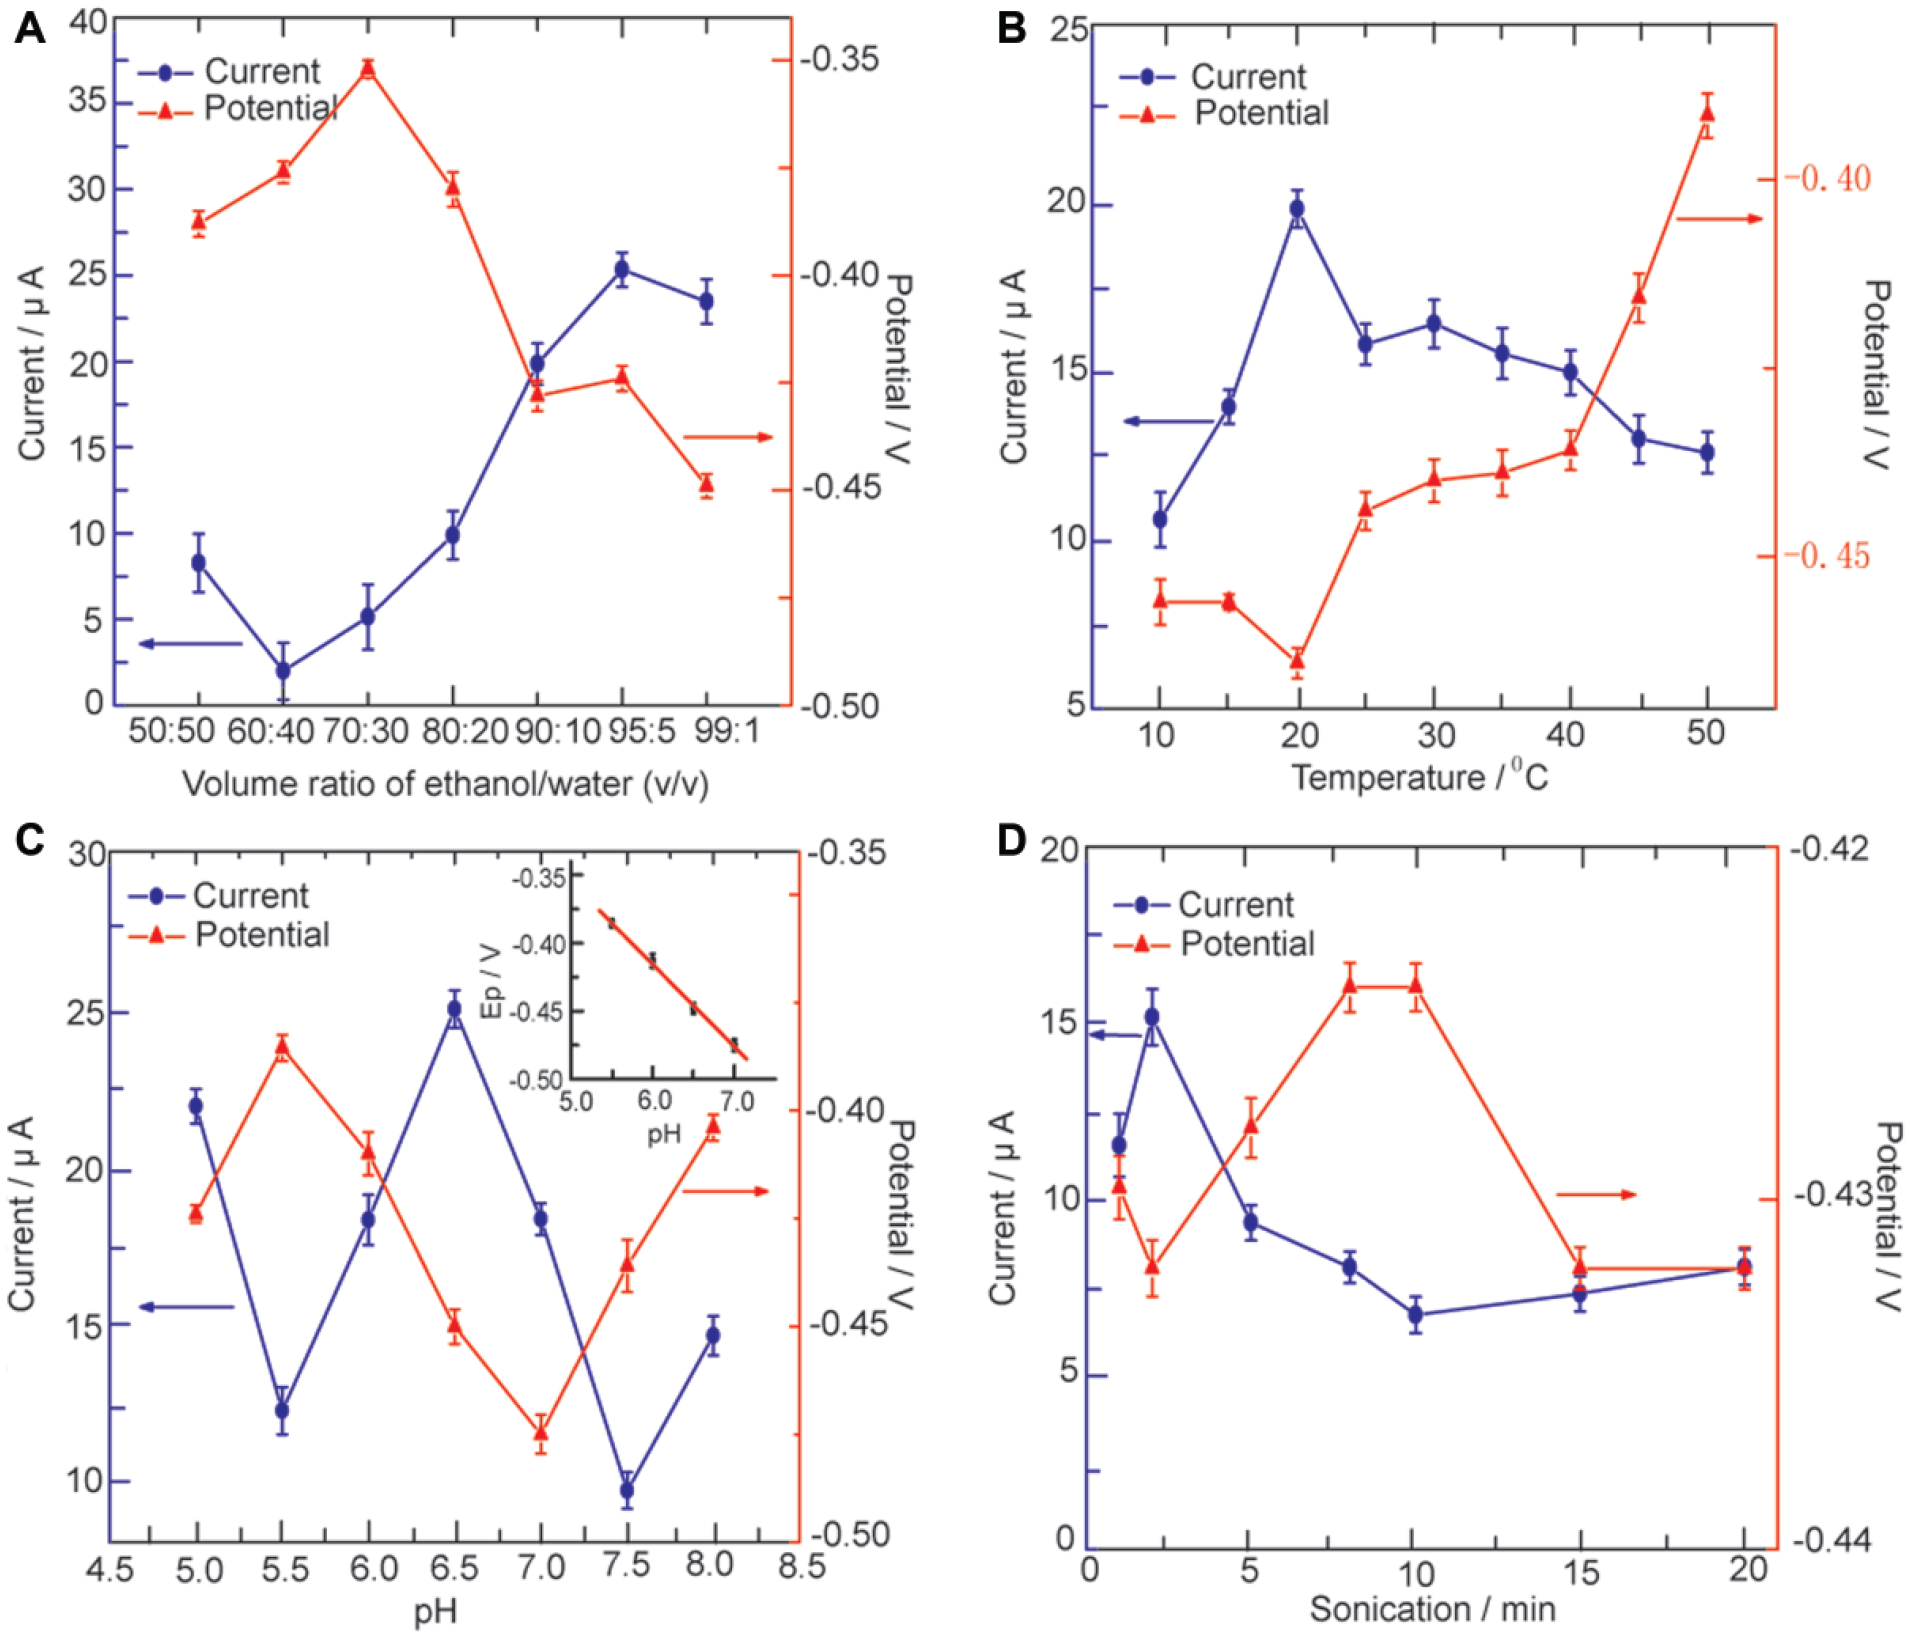
Effect of experimental parameters on the amperometric and potentiometric responses of CoQ10: (
The temperature has a significant effect on the potentiometric and amperometric response of CoQ10 ( Fig. 4B ). It is shown that the cathodic potential of CoQ10 decreases with increasing temperature up to 20 °C and increases when the temperature shifts from 20 °C to 50 °C. However, the trend in amperometric response is opposite to the trends observed in potentiometric response. The reason can be attributed to the thermodynamic processes in the redox reaction of CoQ10 (see below). Moreover, irreversible agglomeration of CoQ10 (such as enhancing the hydrophobility) is observed with temperatures up to 40 °C. Therefore, the temperature of 20 °C is selected as an optimization.
The effect of pH on the amperometric and potentiometric response of CoQ10 was also studied between 5.0 and 8.0. As shown in Figure 4C , the amperometric responses of CoQ10 decreased distinctly with increasing pH value from 5.0 to 5.5 and then increased as the pH increased from 5.5 to 6.5. The experimental results show that the maximum response was observed at physiological pH 6.5. Therefore, PBS (pH 6.5) was used as the medium for the determination of CoQ10. Moreover, the cathodic peak potentials shifted negatively with increasing pH values from 5.5 to 7.0 (inset of Fig. 4C ). The linear relationship between cathodic peak potentials and pH can be described with the following equation: Ep = −0.0522 − 0.061 pH (R = −0.9991). A slope of 61 mV/pH suggests that the number of electron transfers is equal to that of hydrogen ions taking part in the electrode reaction, which proved that CoQ10 underwent a one-electron, one-proton reduction under the present condition. 35
The effect of the sonication time on the amperometric and potentiometric response signals was also investigated. The amperometric response decreased with increasing sonication time from 2 min to 10 min ( Fig. 4D ). This can be attributed to the thermal effects of ultrasonic irradiation, which can disrupt the equilibrium of CoQ10 by increasing the sonication time. This result is also a coincidence with the trend shown in Figure 4B . Therefore, the sonication time of 2 min is applied for the CoQ10.
The reason for the effect of temperature and sonication time can be partially explained by quantum chemical study. Based on the geometry optimization from density functional theory (DFT) and Gaussian 09 software, 36 the corresponding structure of CoQ10 is shown in Figure 5 . The calculated cross-diameter of the benzene ring and length of isoprenyl units are 2.54 Å and 43.54 Å, respectively. It is reasonable that the long side chain of CoQ10 can encompass the benzene ring, thus inducing the inconspicuous redox response. However, the electrochemistry active sites will be exposed when the CoQ10 is heated and sonicated. Moreover, the long side chain (isoprenyl units) will increase the hydrophobility of CoQ10, which leads to an inconspicuous redox response in the ethanol aqueous solution. Therefore, the stable CoQ10H• can only be observed under optimal conditions.
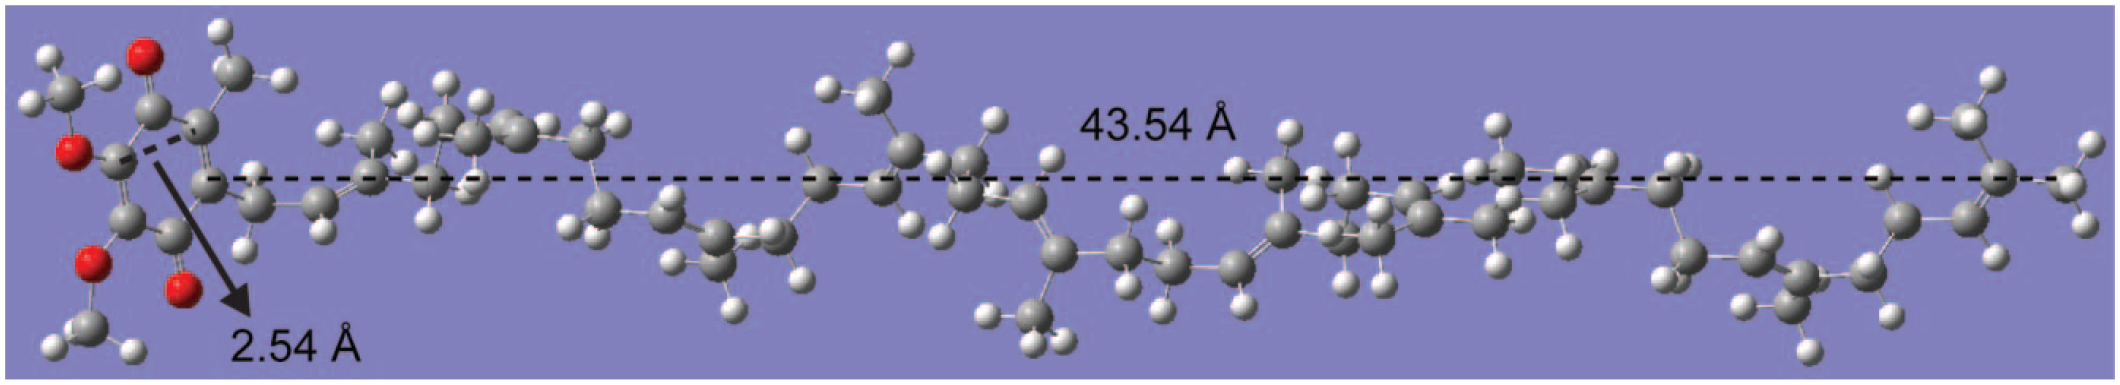
The 3D atomistic simulation of CoQ10 by Gaussian.
Determination of CoQ10 at the Silver Electrode by DPV
To assess the feasibility of the DPV method, determinations were carried out for a series of measurements of CoQ10 under optimal conditions ( Fig. 6 ). The proportional correlation of peak current with the concentration of CoQ10 is in the range of 8.63 × 10⁻² to 8.63 × 10² mg/kg (1.00 × 10⁻⁷ to 1.00 × 10⁻³ mol/L). The linear regression equation is shown as follows: Ip = 1.1 + 2.1 log [CoQ10] (nmol/L) (R = 0.998), with a detection limit (signal to noise [S/N] = 3) of 2.88 × 10⁻² mg/kg (3.33 × 10⁻⁸ mol/L). Therefore, we believe that the DPV method can be applied to the assay of CoQ10 in complex samples.26,37
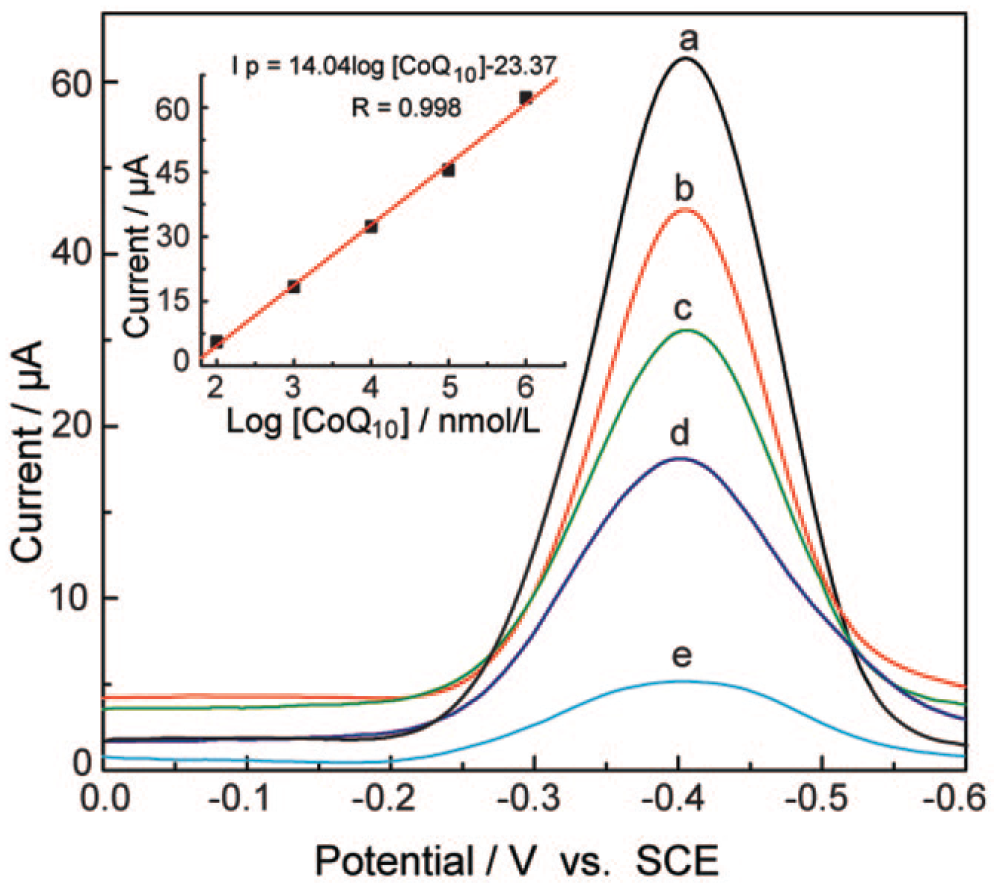
Differential pulse voltammetry (DPV) curves of CoQ10 recorded at the silver disc electrode (2 mm in diameter) in mixed solvent containing 95 vol. % ethanol and 5 vol. % water with 0.50 mol/L NaClO4 by DPV at different concentrations of CoQ10: (a) 106, (b) 105, (c) 104, (d) 103, and (e) 102 nM. Inset: calibration plot for CoQ10 obtained by the DPV technique. SCE, saturated calomel electrode.
Effect of Foreign Substances
To evaluate the selectivity of the DPV determination of CoQ10 in complex samples, the interference from some mental ions and some excipients was tested in the chosen condition. Figure 7 indicates that the tolerant concentrations of these excipients are much larger than those in the as-prepared sample solution. The result demonstrates that the DPV method facilitates highly selective and sensitive detection of CoQ10.
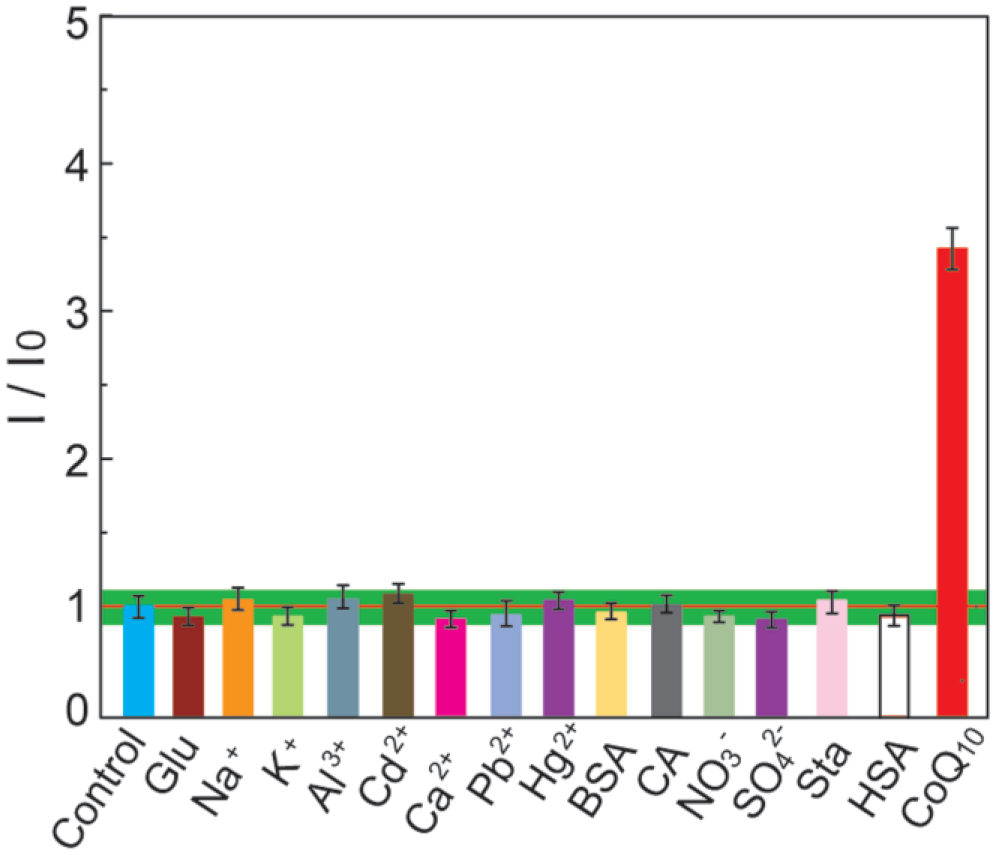
Effect of potential interfering substances on the amperometric responses I/I0 of differential pulse voltammetry (DPV) toward CoQ10 (1 µM) in the ethanol/water (v/v = 95:5) solution. I and I0 are the amperometric signals with and without interfering substances, respectively. Each concentration of analytes is 1 mM. Each point is an average of three successive measurements. The red line represents the amperometric responses I/I0 of DPV without potential interfering substances; ± 10% amperometric responses variation is marked with the green zones. Glu, glucose; BSA, bovine serum albumin; CA, citric acid; Sta, starch; HSA, human serum albumin.
To further confirm the accuracy and stability of the proposed method, a comparison experiment between the proposed DPV method and standard HPLC method was conducted. As shown in
Furthermore, the precision and accuracy of the DPV method were investigated by the intraday and interday determinations of spiked samples at different addition levels. The intraday accuracy and precision were evaluated by the analysis of six samples with six determinations per sample on the same day, and the interday studies were estimated by determination of one of the six spiked samples in six days over 2 weeks (degassed with nitrogen and stored in a refrigerator at 4 °C after 1, 4, 7, 10, and 14 days). The results obtained for intraday and interday precision and accuracy are presented in
Application of the DPV Method for Determination of CoQ10 in the Complex Samples
To further confirm the accuracy and stability of the DPV method, a comparison experiment between the proposed DPV method and HPLC method was conducted. 38 The applicability of the proposed method for the assay of CoQ10 in real samples was further evaluated. For comparison, the samples with different concentrations of CoQ10 were detected using HPLC with spectrophotometric detection at 274 nm. 38 The results are statistically examined in the same way as for DPV determinations and are presented in Table 2 . It should be stressed that the results obtained using the DPV method are in good accordance with those obtained by the HPLC method, indicating the feasibility of the DPV method for determination of CoQ10 in complex samples.
Results of the CoQ10 Determination in Fish, Animal Tissues, and Vegetable by Differential Pulse Voltammetry and a Reference HPLC Method (n = 6).
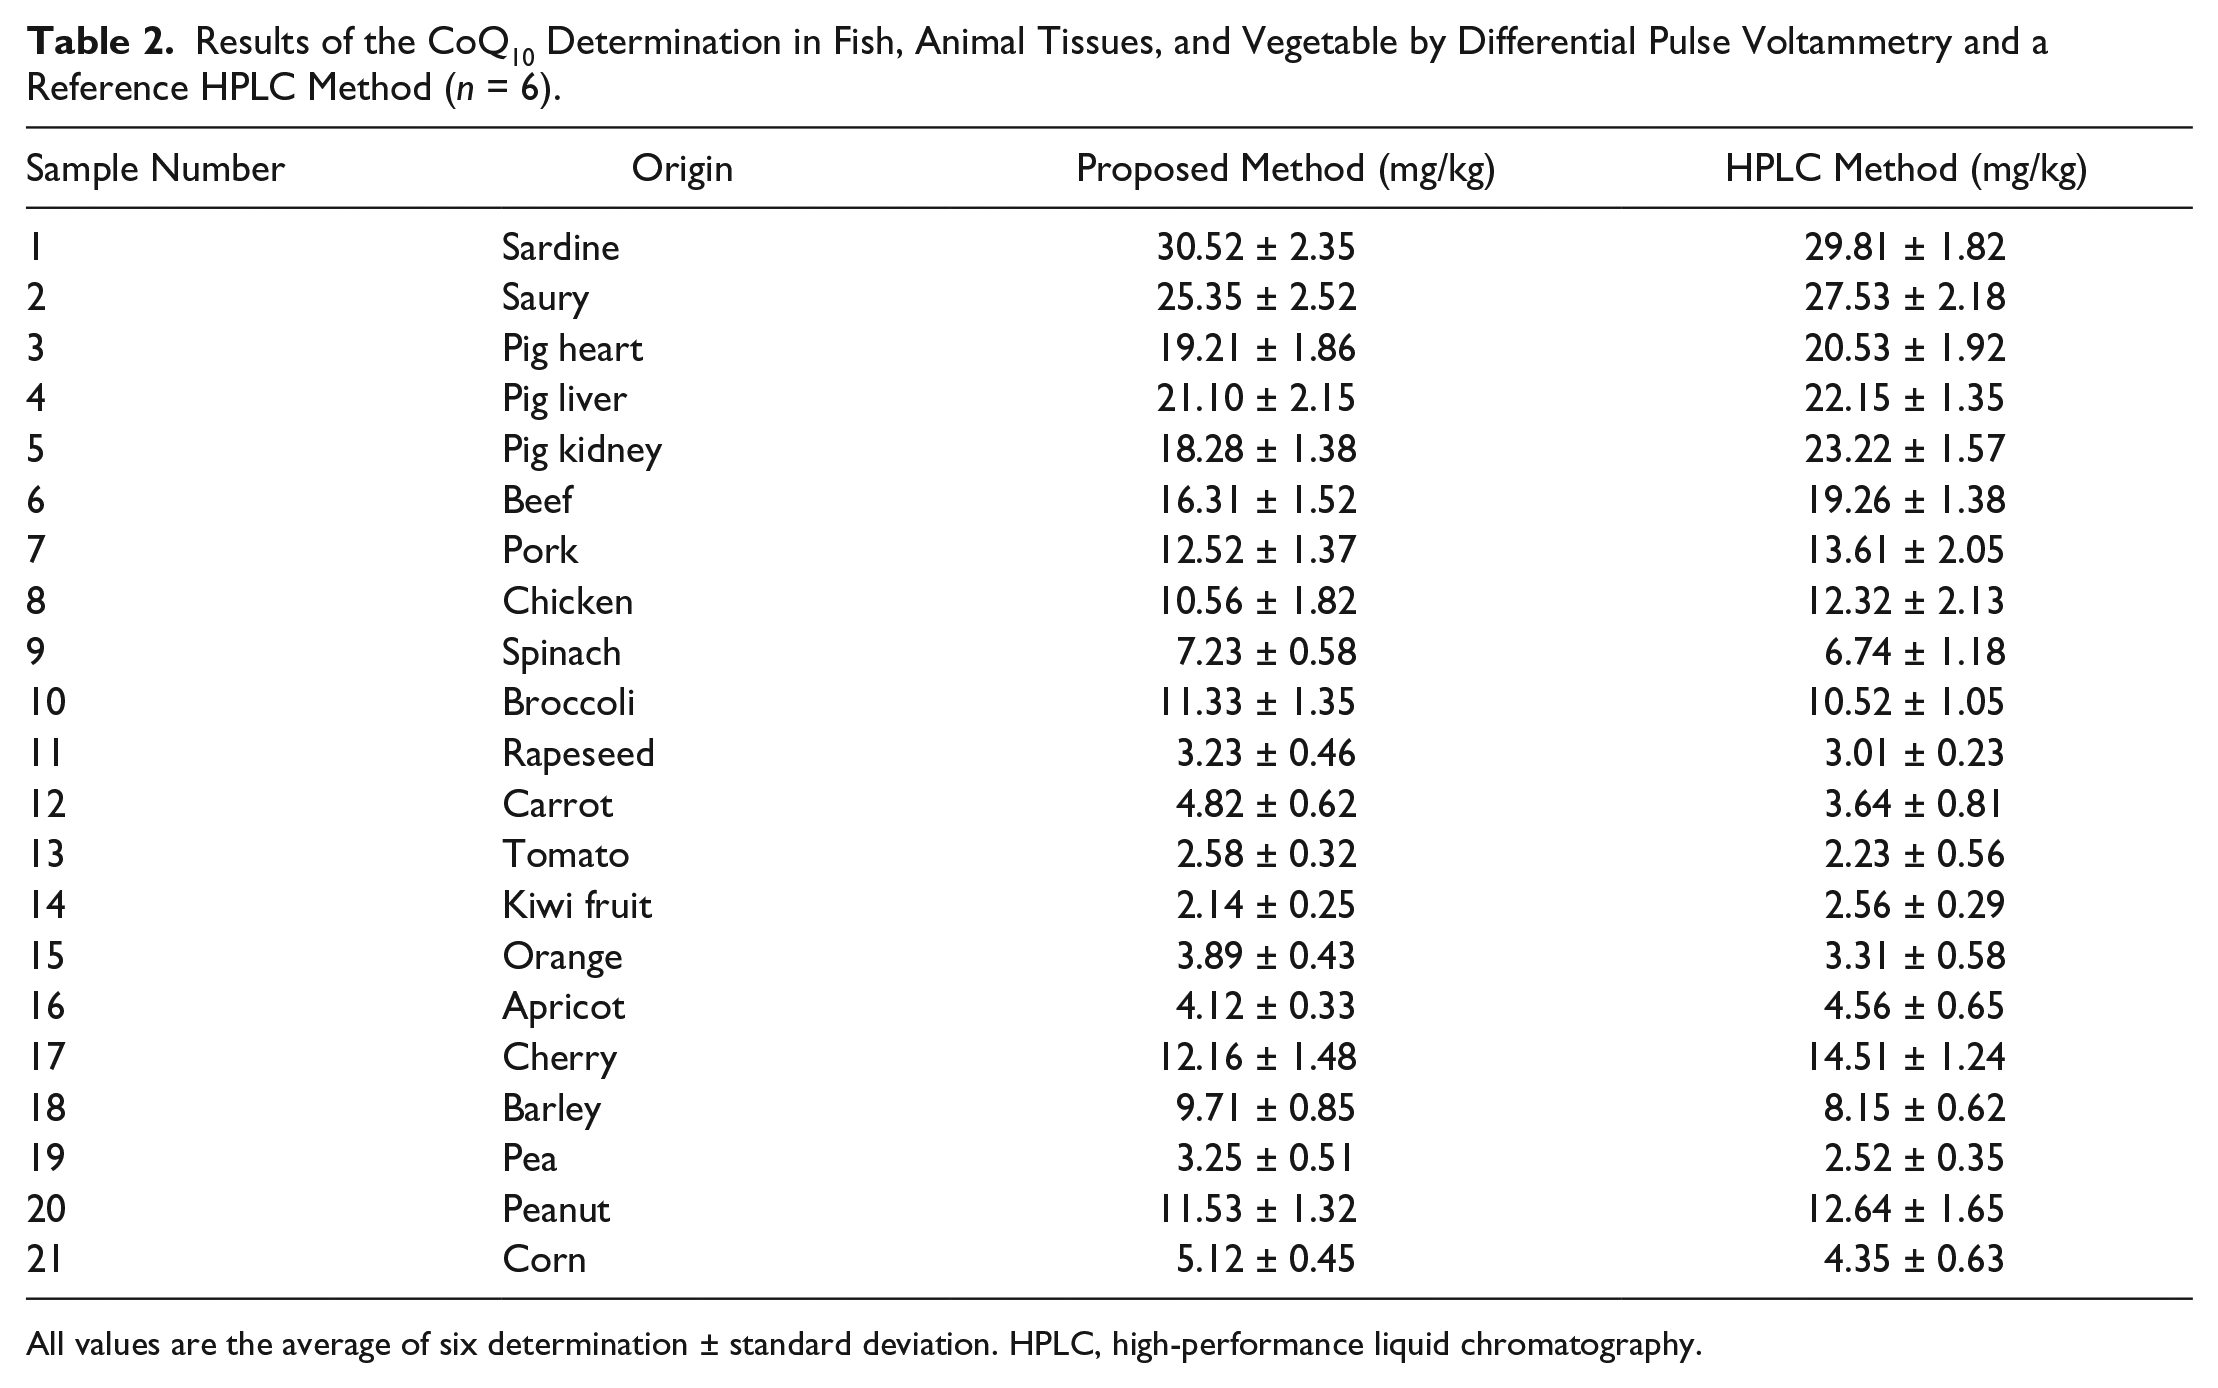
All values are the average of six determination ± standard deviation. HPLC, high-performance liquid chromatography.
In summary, we have demonstrated a convenient reaction condition for studying the electrochemical behavior of CoQ10. The results validate that the cathodic process of coenzyme Q10 on a silver electrode in an oxygen-free ethanol aqueous buffer is a one-electron, one-proton reduction and gives stable semiubiquinone radicals (CoQ10H
Under the optimum conditions, DPV can be used as a high-selective and high-sensitive method for determination of CoQ10. Compared with the previous methods (
Footnotes
Acknowledgements
We acknowledge the assistance of Yong Wang in conducting the high-performance liquid chromatography experiments.
Declaration of Conflicting Interests
The authors declared no potential conflicts of interest with respect to the research, authorship, and/or publication of this article.
Funding
The authors disclosed receipt of the following financial support for the research, authorship, and/or publication of this article: This research is supported by the Natural Science Foundation of China (No. 21507089), the Shanghai Young Teacher Training Program (No. ZZyy15095), the Scientific Research Foundation for the Introduction of Talent of Shanghai Institute of Technology (No. YJ2015-6), and Shanghai Municipal Education Commission (Plateau Discipline Construction Program).
References
Supplementary Material
Please find the following supplemental material available below.
For Open Access articles published under a Creative Commons License, all supplemental material carries the same license as the article it is associated with.
For non-Open Access articles published, all supplemental material carries a non-exclusive license, and permission requests for re-use of supplemental material or any part of supplemental material shall be sent directly to the copyright owner as specified in the copyright notice associated with the article.