
Abstract
Chronic alcohol consumption is a significant financial and physical burden in the United States each year. Alcohol consumption monitors focus on establishing a state of intoxication, not assessing a user’s health risks as a function of consumed alcohol. This work demonstrates a biosensor for a chronic alcohol consumption monitor through the electrochemical detection of ethyl glucuronide (EtG) in human sweat using square-wave voltammetry (SWV). A novel affinity assay was demonstrated in which monoclonal antibodies were chemically coabsorbed onto a gold electrode surface in parallel with thiolated charge transfer molecule. Concentration-dependent EtG binding was detected by measuring a reduction in the charge transfer of the sensor, manifesting as a current response during SWV measurement. A companion compact electronic reader was constructed, demonstrating comparable sensitivity to a conventional lab instrument. Both tools demonstrated a limit of detection of 0.1 µg/L and a linear dynamic range of 0.1–100 µg/L corresponding to the physiologically relevant range of EtG expression in human sweat. This device can address the need for a chronic alcohol consumption monitor toward establishing a user’s long-term consumption habits to assess the risk of developing specific diseases and conditions associated with regular alcohol consumption, through integration with existing technologies.
Keywords
Introduction
Chronic alcohol consumption and alcohol-related diseases, in the United States, are responsible for an economic burden of more than ~$220 billion, while more than ~360,000 hospitalizations (~1%) per year are attributable to excessive drinking. In 2014, there were more than 30,000 alcohol-induced deaths, excluding accidents and violent crime.1,2 Chronic alcohol consumption has been linked to pancreatitis, liver disease (especially in women), gastrointestinal disorders, multiple types of cancers, an immunocompromised state, and impaired brain development. These conditions have a greater impact on younger populations (under 25), who are more likely to engage in regular binge drinking (defined as 5+ standard alcoholic beverages for men and 4+ for women).3 –6 Thus, there is a need for portable analytic devices capable of tracking and quantifying a user’s alcohol consumption habits, in a noninvasive manner, utilizing perspired human sweat. This can in turn facilitate an understanding of the user’s risk of developing the host of conditions listed above. This would be particularly helpful for college students, who regularly engage in binge drinking, without fully understanding its long-term health consequences.7,8
Current transdermal alcohol consumption monitoring devices, such as SCRAM, Giner WrisTAS, and BACtrack Skyn, have been used as a means of assessing personal alcohol intake, whether as a metric for establishing an inebriated state or to establish abstinence in probation cases.9 –11 These devices detect ethanol levels in ambient sweat to report consumption levels. This methodology is good for detecting specific episodes of alcohol consumption, and can report these episodes over a period of multiple days when constantly worn. However, these sensors have minimal functionality to monitor or report chronic alcohol consumption, as sweat/transdermal alcohol sensors have a short window of detection due to the volatile nature of the biomarker, namely, transdermal alcohol. Hence, in this article we present proof-of-concept technology that will help bridge the current technological gap in the noninvasive portable monitoring of alcohol consumption lifestyle that requires the device to be worn for any level of reporting. 12
Metabolites of ethanol, such as ethyl glucuronide (EtG), provide a means for long-term, specific, and highly sensitive monitoring of alcohol consumption. EtG is produced from glucuronidation of alcohol in the liver and represents a relatively small (0.1%) total ethanol disposition. EtG can be specifically captured through a monoclonal antibody, and can be detected in sweat for more than 24 h after light drinking, and up to 4 days after heavier consumption.13,14 In a human volunteer study, EtG was reported in the range of 1.7–103.0 µg/L in human sweat when 38.0–154.6 g of alcohol was consumed, and was not detected at any concentration in users who did not consume any ethanol. A standard U.S. drink contains 14.0 g of alcohol, allowing for the correlation of EtG expression to consumed alcohol.15,16 An EtG sensor would allow for the opportunity to capture the expression of EtG up to multiple days after initial consumption, whether the device was worn at the time or not, and can demonstrate greater sensitivity to low levels of alcohol consumption. In this way, a perspired sweat EtG biosensor would have great value in the development of a personal alcohol consumption monitor. The added benefits of an EtG biosensor, when combined with existing and well-defined ethanol-based devices, would pose an exciting avenue toward the creation of devices capable of establishing a user’s long-term consumption habits and quantifying the risk of developing alcohol-related disease. As ethanol-based sensors are well established, the scope of this work is the creation and testing of a perspired sweat EtG biosensor.
In this work, a scheme for the electrochemical affinity-based detection of EtG in ultra-low volumes of ambient perspired human sweat is presented. A compact electronic reporting system was also developed to demonstrate the translatability of this scheme into a portable and wearable platform. Our group has previously demonstrated the ability to accomplish affinity-based detection of EtG using electrochemical impedance spectroscopy (EIS) in human sweat, 17 as well as for a host of other proteins and small molecules.18 –20 However, as an alternating current (AC) system, EIS can be nontrivial in its implementation in portable and wearable form factors. Additionally, the use of EIS requires the molecule of interest to be able to modulate the dielectric properties of the electrode–electrolyte interface, which is challenging to accurately transduce, as well as differentiate signal from noise, when trying to implement it on a cost-effective portable/wearable platform. This can temper the enthusiasm to develop an EIS companion reader for a portable and wearable electronics platform for biosensing. A direct current (DC)–based system can be advantageous due to its simplicity in implementation as a discrete on-demand operating system that can more seamlessly be integrated with existing biosensing/wearable technology. DC systems are also conducive to a faradaic-based transduction mechanism, which is leveraged in this work.
Here, we propose a novel DC-based mechanism of detection that utilizes a charge transfer molecule to facilitate signal transduction. By introducing a charge transfer molecule into the system, DC techniques, such as cyclic voltammetry (CV) and square-wave voltammetry (SWV), can be leveraged for biosensing. Here, SWV is used as a transduction method for the detection of EtG. SWV offers multiple benefits over CV. SWV can operate at high frequencies, resulting in quicker measurement times, and as a differential technique is only sensitive to faradaic currents, removing the influence of charging currents. 21 Many biosensors that typically leverage the use of a charge transfer mediator require the analyte of interest to engage in the transfer of charge in order to observe a change in output response.22 –25 This is undesirable, as it can limit the applications to species that are inherently faradaic in nature.
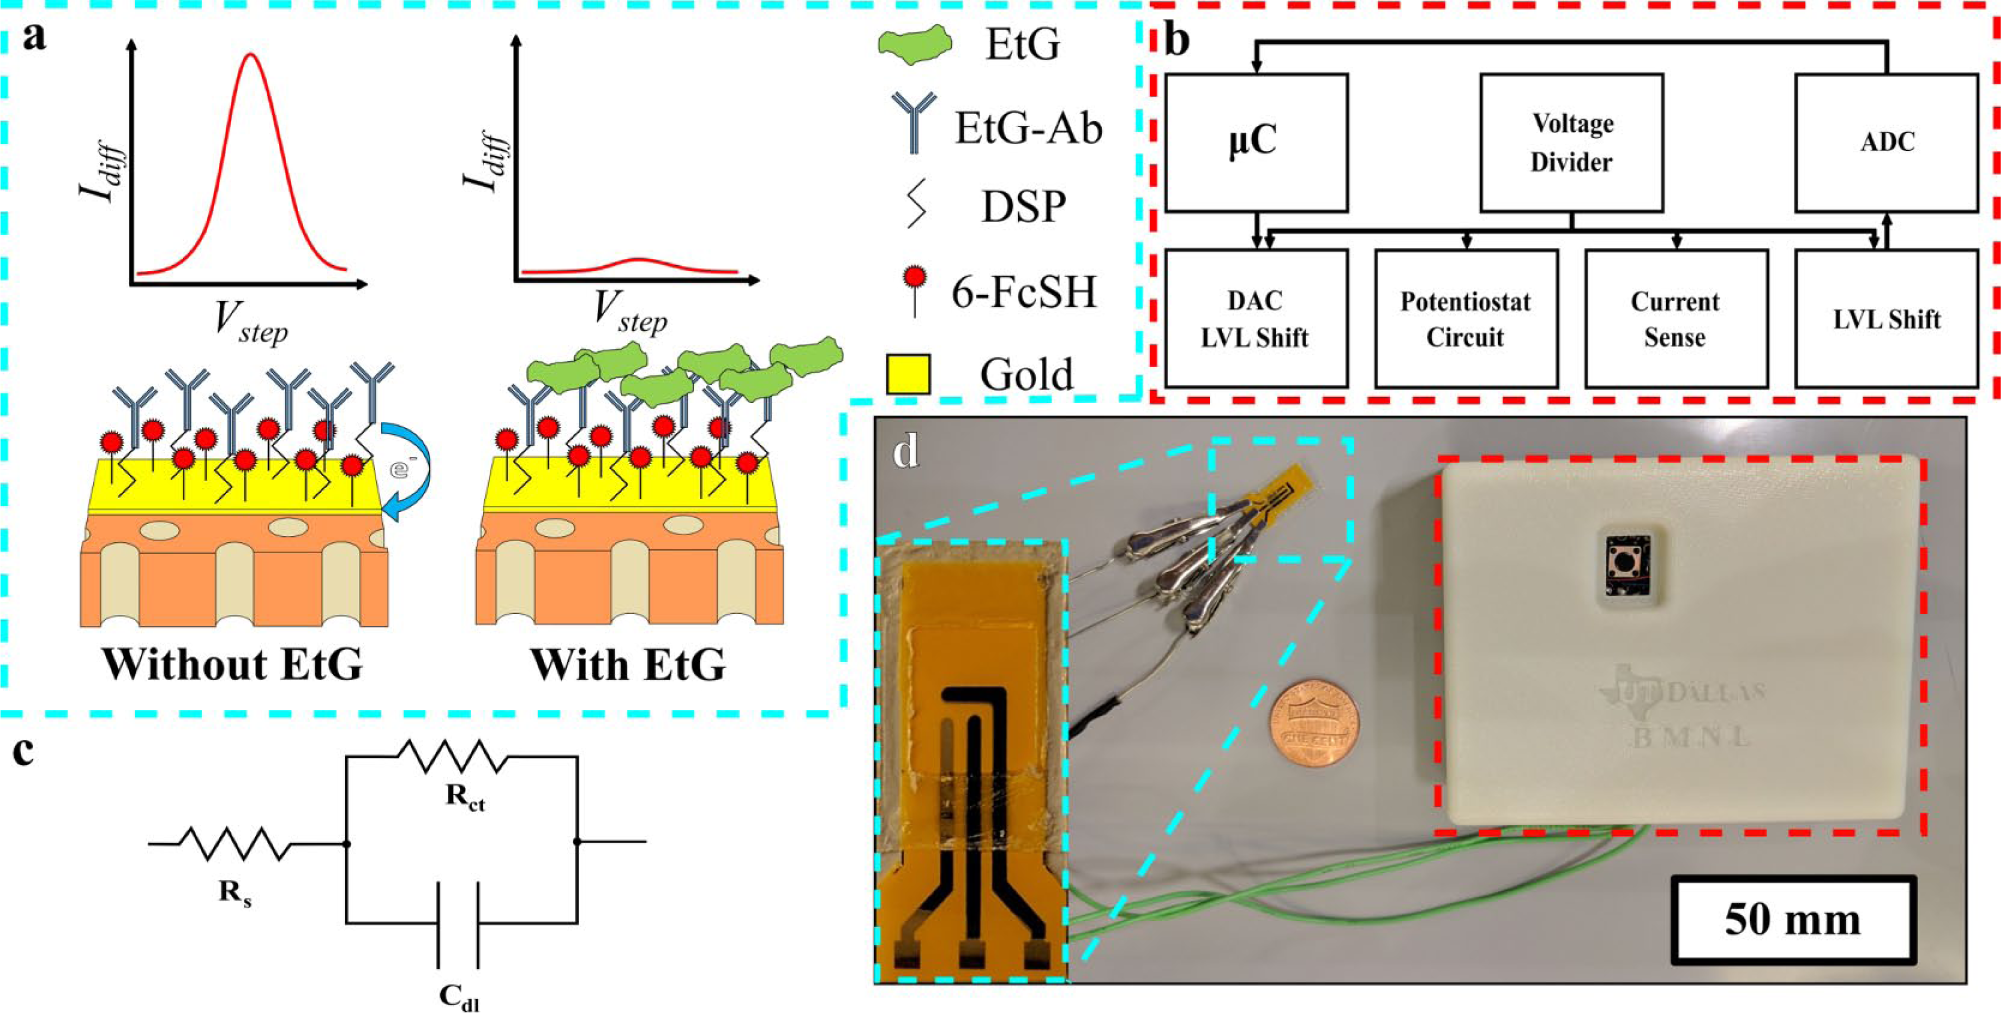
In this work, a novel mechanism of detection for EtG is presented in which the molecule of interest does not have to participate in the charge transfer process, and is indirectly quantified by inhibiting charge transfer of a bound redox mediator to an electrode surface. The proposed mechanism of detection, transduced through SWV, is presented schematically in Figure 1a . To implement this detection mechanism, dithiobis(succinimidyl proprionate) (DSP) and charge transfer molecule 6-ferrocenyl-1-hexanethiol (6-FcSH) were chemically coabsorbed to the gold working electrode of the sensor seen in Figure 1d . EtG specific monoclonal antibody can then be bound to the DSP crosslinker, creating a single-capture affinity assay for EtG with a chemically coabsorbed charge transfer molecule at the electrode surface through gold–thiol interaction. When no EtG is present, it is predicted that the 6-FcSH will undergo charge transfer uninhibited, resulting in a stronger current response. When EtG is present, crowding of the bound EtG should reduce the efficiency at which the 6-FcSH can undergo charge transfer, manifesting as a smaller current response during SWV. This contrast is highlighted by the left and right sides of Figure 1a .
(
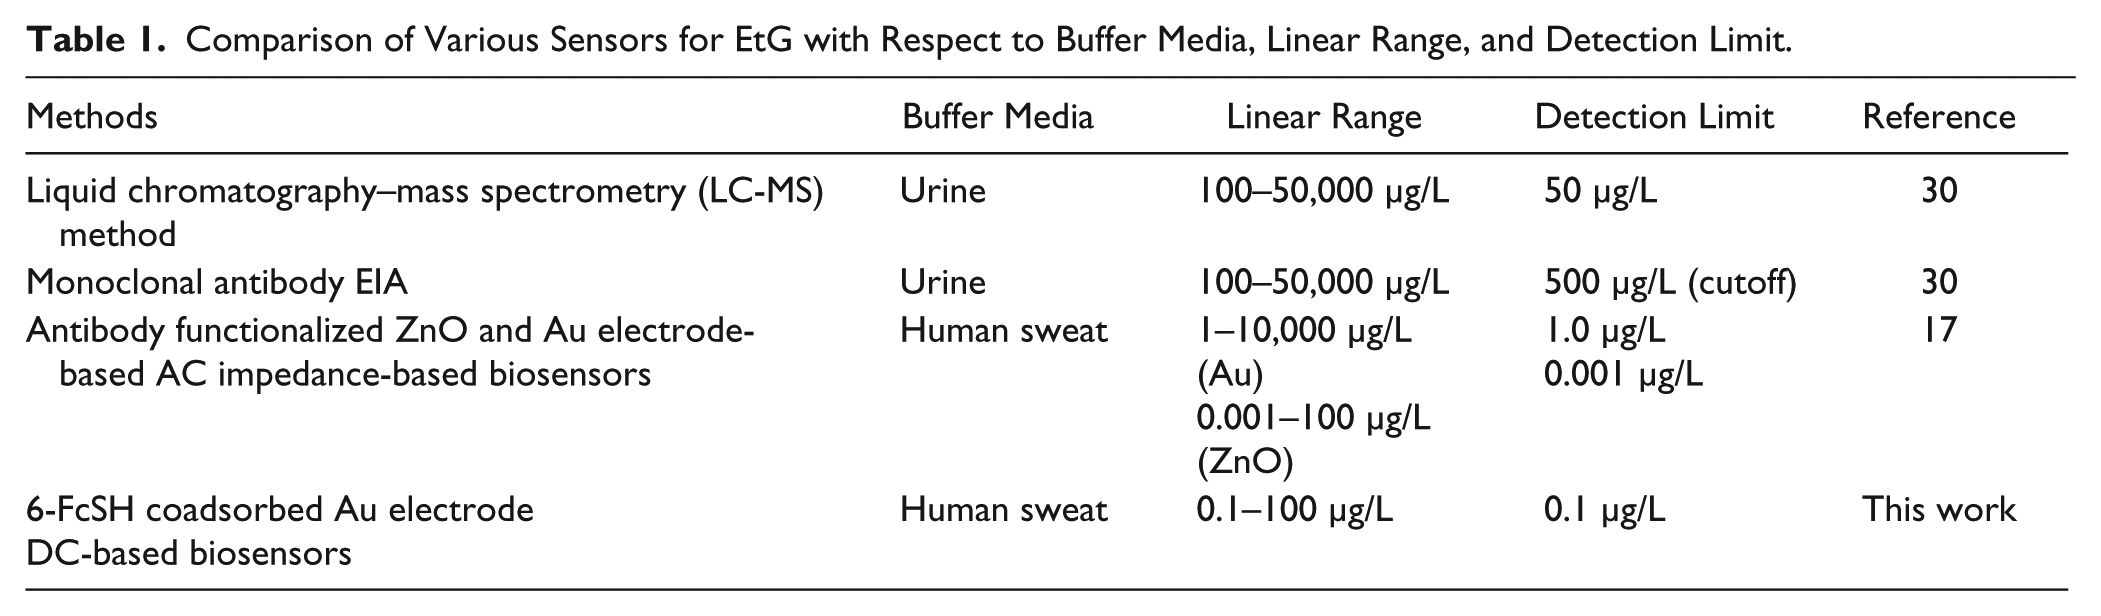
To facilitate portable, ultra-low-volume biosensing, the sensor was constructed on flexible nanoporous polyimide membranes. The flexibility and hydrophilicity of the substrate allow for conformation of the sensor to the user’s skin, as well as for ambient sweat to sufficiently cover the sensor. Polyimide, a material long used in the flexible printed circuit board industry, also demonstrates excellent dielectric, thermal, and structural properties, making it an ideal candidate for the construction of a flexible electrochemical biosensor. 26 Gold was selected as the working electrode material to build the affinity assay on, as it is widely used for electrochemical biosensors due to its stability in physiological media, and for its ability to form a stable gold–thiol interaction at its surface. An electronic research prototype was developed and tested to demonstrate the translatability of the EtG biosensor to a portable form factor device. Detection of EtG was characterized on both a conventional laboratory potentiostat and the developed electronic platform in parallel to demonstrate the comparable performance of the two devices. The sensor demonstrated a limit of detection (LOD) correlating to the physiologically relevant range of EtG expression in human sweat on both the lab instrument and the developed electronic reader, translating to alcohol consumption from 0 to ~11 standard U.S. drinks.15,16 Table 1 shows the current state of EtG biosensors in the literature. The 500 µg/L for the enzyme immunoassay (EIA) method was proposed by the authors based on the lack of sensitivity of the assay below that concentration. This work and our previous work in EtG biosensing are the only examples that demonstrate electrochemical detection of EtG in the range of low-level consumption in human sweat. To our knowledge, this is the first demonstration of an affinity EtG biosensor leveraging a DC transduction mechanism through the chemical coabsorption of a charge transfer molecule.
Comparison of Various Sensors for EtG with Respect to Buffer Media, Linear Range, and Detection Limit.
Materials and Methods
Materials and Reagents
Phosphate-buffered saline (PBS) (0.15 M 1×), potassium ferricyanide, 6-FcSH, and 0.20 M 10× tris-buffered saline (TRIS) were purchased from Sigma Aldrich (St. Louis, MO). DSP (Pierce Biotechnologies, Waltham, MA), DMSO, 70% isopropyl alcohol, acetonitrile, methanol, and potassium chloride were purchased from Thermo Fisher (Waltham, MA). EtG monoclonal antibody and EtG molecule were purchased from EastCoast Bio (North Berwick, ME). Cortisol hormone (hydrocortisone) was ordered from Abcam (Cambridge, MA). Pooled human sweat was purchased from Lee Biosolutions (Maryland Heights, MO). Samples were aliquoted to prevent multiple freeze–thaw cycles.
Fabrication of Flex Sensor
Electrodes were deposited on flexible nanoporous track-etched polyimide membranes (AR Brown-US, Pittsburgh, PA) using cryo-evaporation thin-film deposition. Electrode patterns were laser cut into nonporous Kapton sheets using a Spirit laser (Spectra Physics, Santa Clara, CA). A two-step deposition through the utilization of complementary patterned stencils allowed for electrodes of differing materials to be created in the same sensing array. Alignment marks were implemented in the mask design to ensure proper electrode alignment during the second step of deposition. Here, 150 nm gold was used as a working electrode, while 200 nm platinum was used for the counter- and reference electrodes. Chromium (20 nm) was used as an adhesion layer. Platinum was selected as it demonstrates suitable pseudoreference electrode properties with greater ease of fabrication on flexible substrates than conventional reference materials.27,28 Postdeposition, electrodes were outfitted with a laser-cut thermally activated polyethylene terephthalate passivation layer to expose only the sensing region to applied fluids, ensuring that the sample coverage and surface area were constant from chip to chip. The lab and portable instruments interfaced with the sensor by making electrical contact with the sensor’s electrode pads using toothless alligator clips.
Affinity Assay Construction and Measurement Parameters
All volumes used were 15 µL unless otherwise noted. A fluid aspiration and low-pressure nitrogen gas drying step followed any wash step. All fluid applications, including doses, were applied directly to the sensing region window observed in Figure 1d using a micropipette. First, assembled sensors were incubated for 48 h in a solution of 0.02 mM 6-FcSH in acetonitrile through dip immersion in a nitrogen environment on a rocker to allow for uniform binding of 6-FcSH molecule to the gold electrode. Postincubation, the sensors were washed three times with acetonitrile, and then three times with PBS. The sensors were then incubated with 10 mM DSP crosslinker in DMSO for 120 min in dark. Post-DSP incubation, the sensors were washed with DMSO and subsequently with PBS. The sensors were then incubated with 10 µg/mL EtG monoclonal antibody in PBS for 30 min. Postincubation, SuperBlock was used to seal off unbound linker sites to prevent nonspecific binding onto the N-Hydroxysuccinimide (NHS) of DSP. After blocking, the sensors were washed with PBS three times. EtG doses prepared in human sweat were then serially added to the sensor, increasing logarithmically in concentration from 0.1 to 1000 µg/mL. Triplicate experiments (n = 3) indicate three individually constructed and tested sensors performed on different days with different sample aliquots prepared from the same stocks. Doses were incubated for 15 min before electrochemical measurements were taken. The sensing region was aspirated of fluid before each subsequent dose was added. All doses for each calibration dose response replicate were conducted on the same sensor. Cross-reactivity was conducted with cortisol hormone. The same protocol as above was followed for the cross-reactivity study, but replacing the doses of EtG with doses of cortisol. All electrochemical measurements were conducted on a Gamry Reference 600 Potentiostat (Gamry Instruments, Warminster, PA) and the developed portable electronics in parallel. EIS measurements were conducted with a 10 mVrms sinusoidal waveform from 1 Hz to 1 MHz at 0 Vdc bias. SWV measurements were conducted from −0.4 to 0.5 V at a 25 Hz frequency and 2 mV step voltage for an effective 50 mV/s scan rate at a pulse height of 25 mV. A 5 s equilibrium time was used before each measurement. Results are represented as current density (current/unit area). The area of the working electrode exposed to the sample was 0.01 cm2.
ATR-FTIR Spectroscopy
Attenuated total reflectance Fourier transform infrared (ATR-FTIR) spectrograms were obtained establishing the coabsorption of 6-FcSH and DSP to a gold sensing surface. The tool was equipped with a deuterated triglycine sulfate (DTGS) detector and KBr window. A Harrick VariGATR sampling stage with a 65° germanium ATR crystal was used in this study. Measurements were taken in the range of 4000–600 cm−1 with 4 cm−1 resolution. Represented data are the average of 512 scans. ATR-FTIR samples were prepared as follows: Cleaned microscope slides were patterned with a chromium and gold layer analogous to the working electrode of the sensor and CV conditioned at an applied voltage of −0.5 to 0.5 V at 50 mV/s in 100 mM solution of KCl until a stable response was observed. Slides were heavily rinsed with deionized water and dried with nitrogen gas before a 48 h incubation in 0.02 mM 6-FcSH in acetonitrile through dip immersion in a nitrogen environment on a rocker. Postincubation, slides were rinsed with acetonitrile, followed by a rinse with PBS. After another nitrogen dry, the slides were incubated with 10 mM DSP in DMSO for 2 h. The slides were then rinsed with DMSO before ATR-FTIR measurements.
Implementation of Compact Electronic Reader
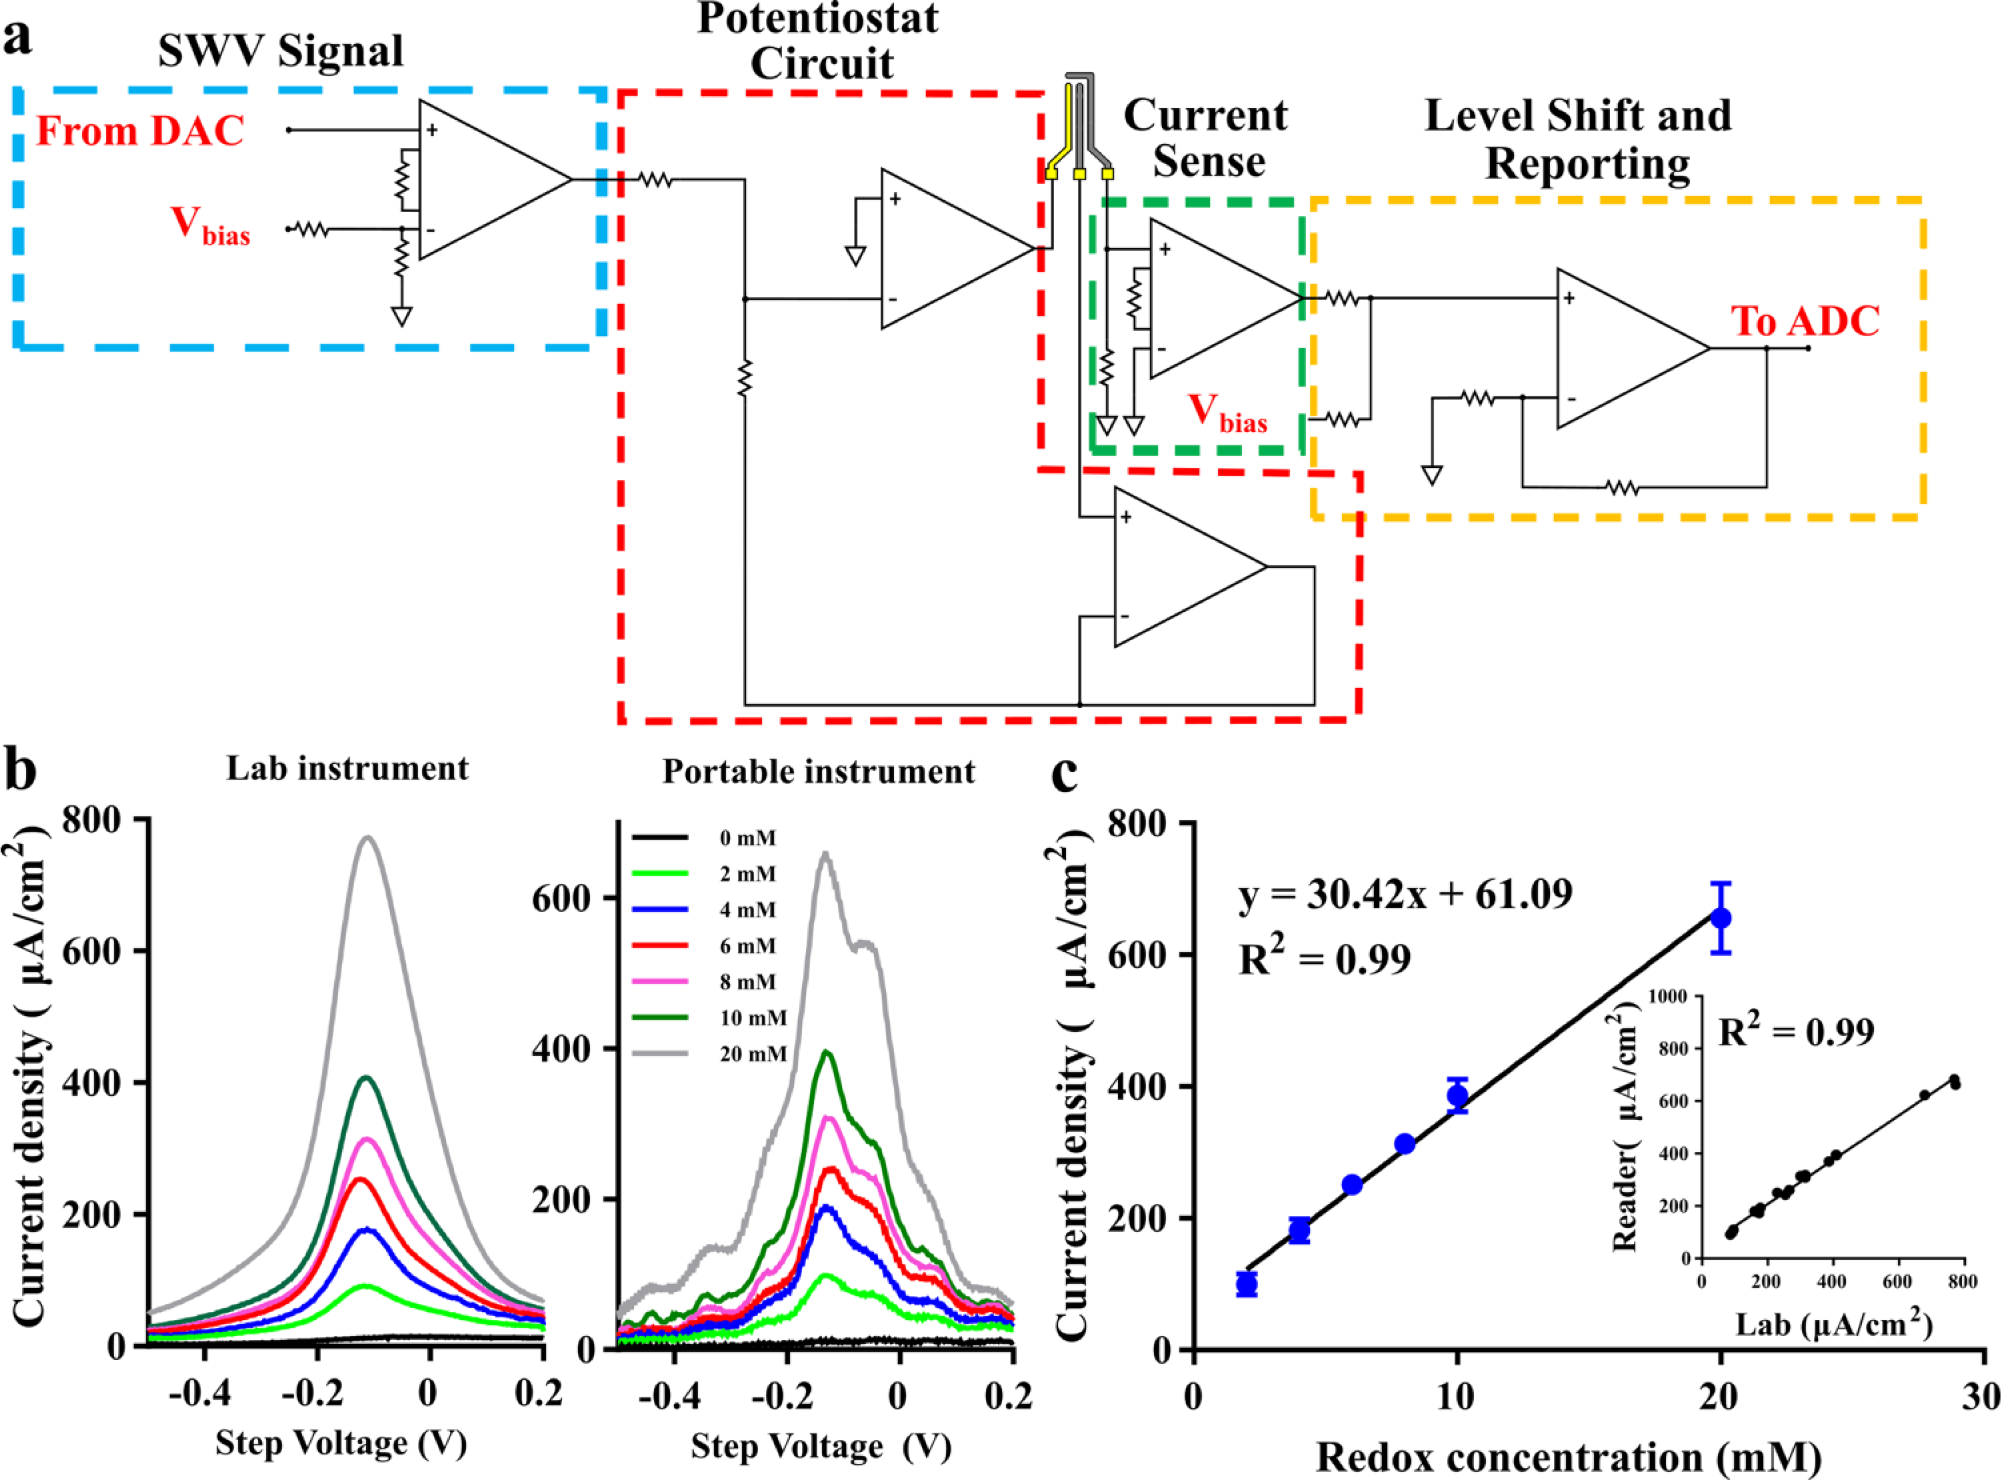
The developed device used in this work is shown in Figure 1d . A block diagram detailing the major aspects of the device is shown in Figure 1b . A detailed circuit drawing of the device is found in Figure 3a . The device is composed of an Arduino Uno R3 microcontroller unit, which was used to control and power the circuit, as well as acquire and store data. A TL7660 voltage converter was used to create a negative voltage rail for the device, as the microcontroller cannot inherently handle the negative voltages needed for this biosensing application. A MCP4725 digital-to-analog converter in conjunction with a level shifter, using an INA121 instrumentation amplifier, was used to generate the SWV excitation signal. Parameters were first optimized on the lab instrument before reproducing the parameters on the device. The device parameters used in this work were −0.4 to 0.5 V step voltage sweep, with 25 mV pulse height at 25 Hz and 2 mV step voltage for an effective 50 mV/s scan rate. All parameters were tested for accuracy using an Agilent Technologies DC Power Analyzer (Santa Clara, CA) and were determined to be within <2% of the expected value. However, any difference was consistent across all measurements. The excitation signal feeds into the potentiostat circuit, which was constructed using a pair of ADA4661 amplifiers. The resulting current response from the working electrode was fed to the current sense amplifier (INA121). The current sense circuit is reconfigurable to adapt to multiple current response ranges based on application. The output of the current sense circuit is level shifted again into a positive range before being fed into a 12-bit ADS1015 analog-to-digital converter, which can be read by the microcontroller for storage. For this first-generation device, analysis was done off-board post data acquisition.
Results and Discussion
Characterization of Affinity Assay
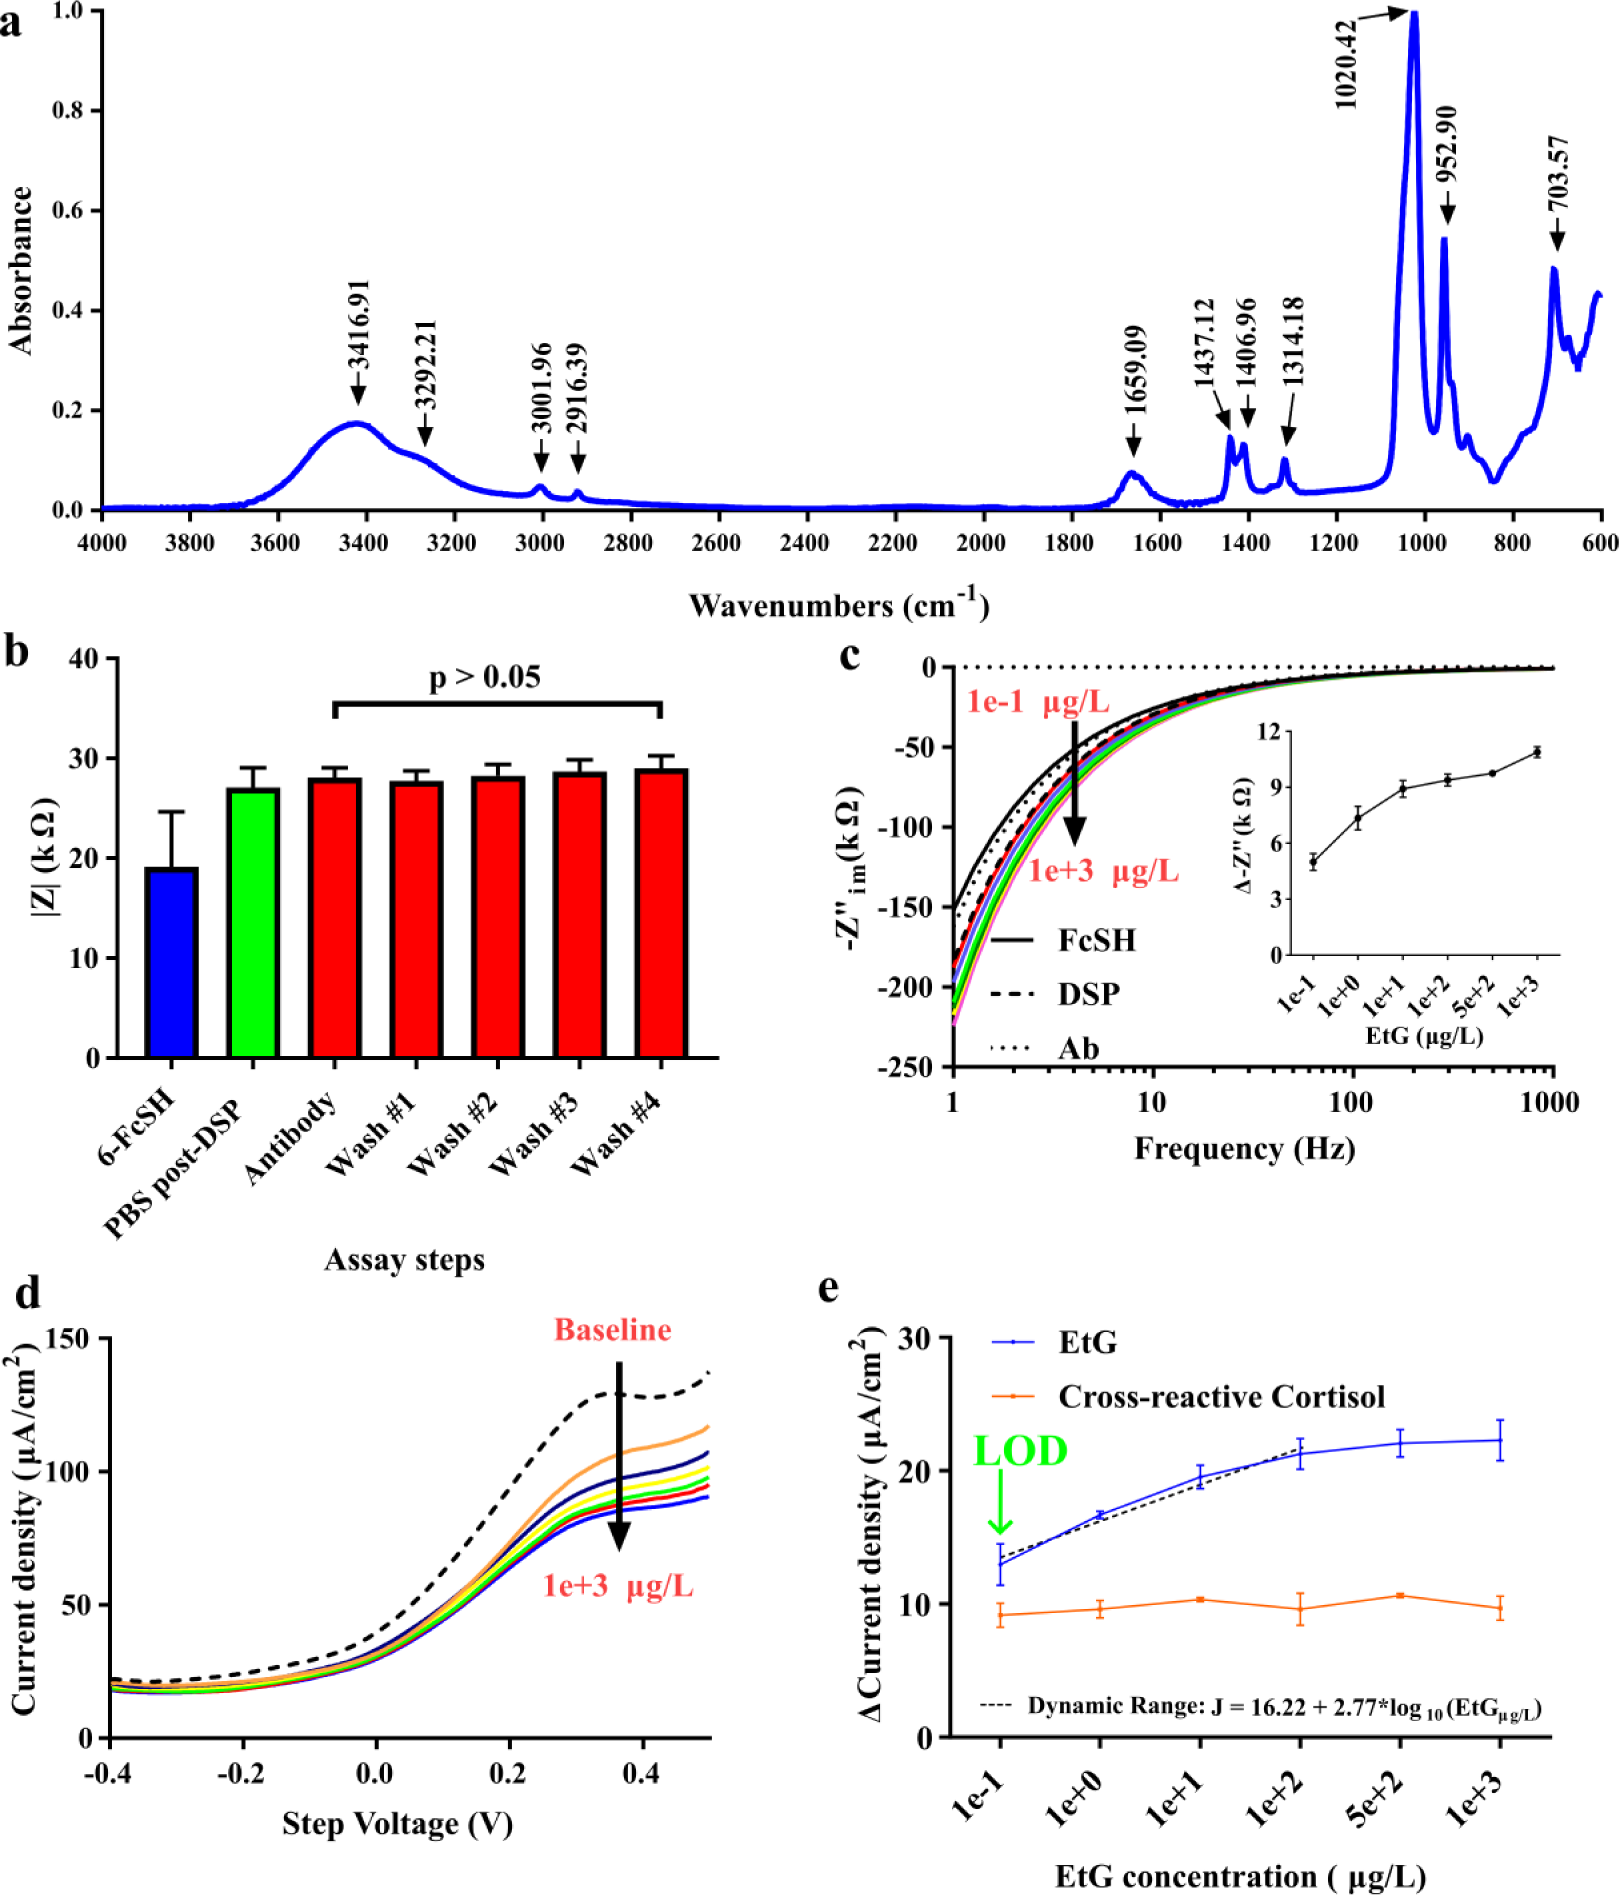
ATR-FTIR spectra were collected to confirm the coabsorption of 6-FcSH and DSP to the surface of the gold electrode. Figure 2a shows the peaks that correspond to the presence of DSP and 6-FcSH measured between 4000 and 600 cm−1. The peaks seen at 3001.96 and 2916.39 cm−1 correspond to asymmetrical νa(CH2) and symmetrical νs(CH2), respectively, which are expected to appear in both DSP and 6-FcSH. The peak observed at 1659.09 cm−1 is characteristic of the carbonyl stretch in the primary amide ν(C=O) of DSP. Also, specific to DSP are the peaks observed at 1020.42 and 1314.18 cm−1, which can be attributed to the stretching vibrations of ν(C–O) and ν(N–O), respectively. The bands seen at 1406.96 and 1437.12 cm−1 correspond to the methylene scissor deformation of DSP bound to gold. For 6-FcSH, the peaks at 952.90 and 703.5 cm−1 are characteristic of the meta di-substituted aromatic ring and mono-substituted aromatic ring, respectively, that are joined by the Fe2+ in the 6-FcSH forming the end group of the molecule. The signature for Fe2+ is the stretching vibration for ν(CH–Fe) that can be seen at the peak 3292.21 cm−1. The existence of peaks for both DSP and 6-FcSH after sequential incubation of the molecules validates successful coabsorption of both molecules onto the gold surface through gold–thiol interactions.
(
EIS was used to probe the stability of the constructed assay and to ensure that the EtG affinity assay demonstrated sensitivity to concentrations of EtG in human sweat in the presence of coabsorbed 6-FcSH. The impedance response of the sensor functionalization can be seen in Figure 2b . For this study, the sensor baseline was taken as the measurement post–48 h incubation of 0.02 mM 6-FcSH and subsequent washes. The increase in impedance from 19.2 to 27.1 kΩ after DSP incubation and PBS is indicative of the resistive nature of the DSP crosslinker binding to the electrode surface. Typically, a decrease in impedance would be seen after the binding of antibody to the DSP crosslinker due to the presence of more charge-conducting molecules at the electrode surface, but due to the presence of charge-conducting 6-FcSH already on the surface, this change was not observed. After a PBS wash to remove unbound antibody, four subsequent washes and impedance measurements were taken to probe the stability of the bound antibody. Less than 1 kΩ or ~3% change was observed from the antibody step to the final wash. Any change in impedance postwash was not found to be statistically significant after use of a t test (p-value threshold was set at 0.05 for analyzing statistical differences). The stability of the increase in impedance when compared with the 6-FcSH baseline combined with the ATR-FTIR results confirms the stable construction of the EtG affinity assay.
Figure 2c shows the impedance dose response of EtG with change in impedance at 10 Hz in the inset. A modified Randles equivalent circuit ( Fig. 1c ) was used to study the impedance response of the sensor. A maximal phase shift (~70°) was shown at 10 Hz, indicating that impedance was dominated by the double-layer capacitance (Cdl), which is in alignment with our previous work on EtG 17 . Doses of 0.1, 1, 10, 100, 500, and 1000 µg/L of EtG in pooled human sweat were serially incubated for 15 min on the functionalized sensors. Changes in impedance were taken against a PBS baseline postfunctionalization. The sensor responded to changes in EtG dose concentration by producing changes in the impedance response. The sensor demonstrates a linear dynamic range following the equation (ΔkΩ) = 7.086 + 1.957*log10(EtGμg/L), with an R2 correlation of 0.99 from 0.1 to 10 µg/L before saturating at 100 µg/L. The EIS response of the sensor established that the constructed assay was electrochemically sensitive to EtG in human sweat in the presence of coabsorbed 6-FcSH. While EIS aids in transducing changes in the electrical double layer (EDL), voltammetric techniques rely primarily on redox reactions occurring at the electrode–electrolyte interface to generate a signal. CV was performed to establish the translatability of the assay to a voltammetric technique. The results of the CV response can be found in Suppl. Figure S1 . CV established an EtG concentration-dependent current response, but the faradaic currents did not dominate the signal, supporting the use of the more faradaic-sensitive SWV for transduction.
Detection of EtG Using SWV
The SWV response from the EtG sensor can be seen in Figure 2d . As expected, as the concentration of EtG increased, the resulting current response of the sensor decreased. This supported the hypothesis that the bound 6-FcSH was able to participate in charge transfer during SWV more easily when the electrode surface is free of bound EtG. As more EtG bound to the electrode surface, the overall efficiency of the 6-FcSH molecule to undergo charge transfer was inhibited, resulting in the observed reduction in the measured current density. To analyze the impact of EtG binding on the resulting SWV in a manner that is both quantitative and translatable to a portable platform, changes in the current density response of the signal were analyzed at a specific step voltage of the square-wave voltammogram. Here, the step voltage of 132 mV was selected. To determine this fixed voltage, a range of step voltages that demonstrated sensitivity to the dose response across the multiple replicates were evaluated. The lowest step voltage that also demonstrated a suitably low coefficient of variation (<0.10 for all EtG doses at 132 mV step voltage) through all measured doses was selected. A low voltage minimizes the measurement time, increases the duration of device charge, and reduces user exposure to higher currents when translating this technology to a wearable form factor, making 132 mV both a suitable and desirable point of analysis. Figure 2e shows the EtG dose response at 132 mV. The sensor demonstrated a dynamic response between 12.9 and 22.3 μA/cm2. The sensor achieved a LOD of 0.1 μg/L, and demonstrated a linear dynamic range of 0.1–100 μg/L before saturating at 500 μg/L and above. The curve for the linear dynamic range has an R2 value of 0.98 and can be represented by the equation J (ΔμA/cm2) = 16.22 + 2.77*log10(EtGμg/L). The dynamic range covers the physiological relevant range of EtG expression in human sweat and can detect levels of EtG that correlate to ~4 g of pure ethanol, or ~0.29 standard U.S. drinks. This is ideal for the proposed application of chronic alcohol consumption monitoring, as it will be able to register levels of EtG in sweat days after consumption in cases where it takes the body longer to process the consumed alcohol, or if the level of consumption is minimal.
To ensure that the constructed assay is specific to only EtG, and to ensure that the decrease in signal response is a function of EtG binding and not the 6-FcSH being stripped or biofouling of the electrode, a cross-reactivity study was conducted. The sensors were prepared and tested in the same way as with the EtG dose response, but replacing the doses of EtG with equivalent doses of cortisol, a naturally occurring stress hormone in sweat. Chronic consumption of alcohol increases the body’s expression of cortisol stress hormone, which is expressed in a similar concentration as EtG in perspired sweat, making it a suitable candidate for cross-reactivity study. 29 Figure 2e shows the cross-reactive dose response. The response behaved as expected, resulting in a current density increase of less than ~5% from the first dose to the last, and did not overlap with the response associated with the EtG doses. These results help to validate the hypothesis that the observed dose response is a function of bound EtG impairing the coabsorbed 6-FcSH’s ability to undergo charge transfer, and is not a function of nonspecific interactions from human sweat. Another factor that can contribute to the noise of the sensor is the variability in sample volume that can occur when using ambient perspired sweat as an analyte. To investigate the impact of volume, three redox-activated sensors were dosed with volumes of PBS (5, 10, and 15 μL) and SWV measurements were conducted (n = 3). Using an unpaired t test with p = 0.05 set as the threshold of significance, the current response of each volume was compared against the others. All comparisons yielded a p value of 0.37 or greater, meaning that the results are not statistically significant from one another, helping to confirm that variation in volume plays little role in the change in current response.
Compact Electronic Reader Characterization
Figure 3a shows a detailed breakdown of the circuit design implemented in the compact reader seen in Figure 1 . The simplicity of the circuit design allows for low overall power consumption of the device. Due to the speed of an SWV measurement, the device can remain idle ~99% of the time. The sensor consumes a maximum of 5 µA during any given portion of a current measurement, which will allow for future iterations to have a low average power consumption, allowing for an extended longevity of charge, which is desired in wearable application spaces. The compact device was initially tested with potassium ferricyanide to characterize and validate the reader vis-à-vis the lab instrument. Figure 3b shows the SWV response of the device (right) compared with the lab instrument (left) when tested against various concentrations of potassium ferricyanide between 0 and 20 mM in 150 mM PBS. Compared with the lab instrument, the compact electronic reader demonstrated comparable performance in measuring the SWV current response of a redox active species, as evidenced by the R2 correlation of 0.99 when mapping the peak current response of the reader with the lab instrument ( Fig. 3c , inset). The device’s peak current response when analyzed at −110 mV step voltage is seen in Figure 3 , showing linearity with respect to the potassium ferricyanide dose, demonstrating an R2 value of 0.99 defined by J (current density) = 30.42x + 61.09, where x is the concentration of potassium ferricyanide in millimoles (mM).
(
EtG Dose Response with Compact Electronic Reader
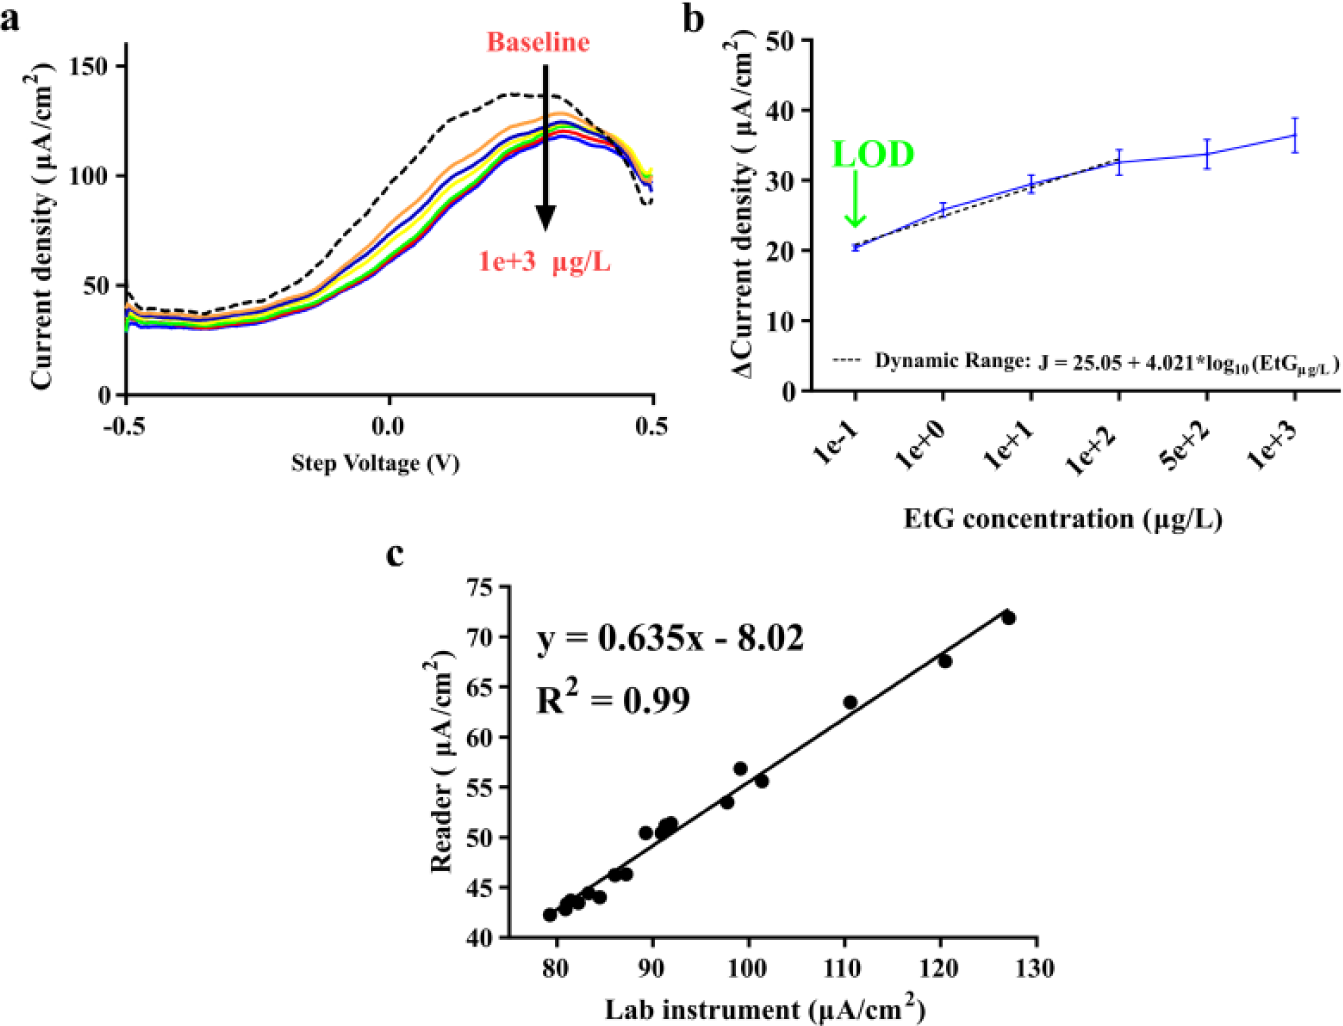
The compact electronic reader demonstrated sensitivity in current response to EtG that was comparable to that of the lab instrument. The same 132 mV step voltage used for the dose response analysis of the lab instrument, was used for analysis of the EtG dose response for the reader. The reader was able to demonstrate the same dose discrimination and current density response as seen on the lab instrument ( Fig. 2d ). There is a slight observable offset, due to the component selection and integration, when comparing the SWV responses of the lab instrument and the reader, but this did not influence the ability of the device to detect changes in the current density with respect to the changing concentrations of EtG. This is supported by the 0.99 R2 correlation value observed between the current density responses of the lab instrument and reader at 132 mV step voltage, shown in Figure 4c . The EtG dose response at 132 mV is shown in Figure 4b . The device shows the same LOD of 0.1 μg/L and linear dynamic range of 0.1–100 μg/L. The fitted curve for this range has an R2 value of 0.98 and can be represented by the equation J (ΔμA/cm2) = 25.05 + 4.021*log10(EtGμg/L). The LOD and linear dynamic range demonstrated by the compact reader are the same as shown by the lab instrument and are within the physiologically relevant range of EtG expression in perspired human sweat.
(
Conclusion
With the prevalence of chronic alcohol consumption, there are a host of long-term and detrimental conditions that can occur in frequent drinkers. As a result, there is a need for a method of monitoring a user’s alcohol consumption lifestyle to assess their risk of developing one of these serious conditions. Ethanol metabolites, such as EtG, pose themselves as candidates for long-term monitoring of alcohol intake that would better establish a user’s risk. This work demonstrated the creation of an electrochemical EtG biosensor, and a companion compact electronic reader for the monitoring of chronic alcohol consumption through the DC transduction technique of SWV in noninvasive ambient human sweat. This sensor can be integrated with existing ethanol-based monitors toward the development of more robust chronic alcohol consumption monitors for establishing a user’s risk of developing alcohol-related disease. The compact electronic reader demonstrated the same LOD and linear dynamic range as a standard lab instrument, while being sensitive in the range of very moderate alcohol consumption to binge drinking, demonstrating this technology’s ability to bring laboratory-grade detection of EtG to a portable and eventually wearable form factor. This proof-of-concept work is meant to demonstrate the feasibility of the proposed perspired sweat DC-SWV EtG biosensor, and was not meant to be an exhaustive study of environmental, physiological, and practical factors that could impact the sensor’s response in a broader implementation of the device. It was quite promising that the device performed well in complex human sweat samples, and showed minimal cross-reactivity in the presence of nonspecific cortisol. However, factors such as sample variability, increased concentrations of other cross-reactive molecules, sensor longevity, and impact of user tampering would all need to be considered before commercial implementation, and are outside the scope of this study. That said, this novel and exciting work is the first demonstration of a portable EtG monitoring device through the use of DC-SWV transduction, and it poses a promising avenue for future study.
Footnotes
Acknowledgements
We thank the Cecil and Ida Green endowment in Systems Biology at the University of Texas at Dallas for their financial support in this work. We would also like to thank Amanda Bacon for her assistance in running some of the control studies for this work.
Supplementary material is available online with this article.
Declaration of Conflicting Interests
The authors declared the following potential conflicts of interest with respect to the research, authorship, and/or publication of this article: Drs. Shalini Prasad and Sriram Muthukumar have a significant interest in Enlisense LLC, a company that may have a commercial interest in the results of this research and technology. The potential individual conflict of interest has been reviewed and managed by the University of Texas at Dallas, and played no role in the study design; in the collection, analysis, and interpretation of data; in the writing of the report, or in the decision to submit the report for publication.
Funding
The authors received no financial support for the research, authorship, and/or publication of this article.
References
Supplementary Material
Please find the following supplemental material available below.
For Open Access articles published under a Creative Commons License, all supplemental material carries the same license as the article it is associated with.
For non-Open Access articles published, all supplemental material carries a non-exclusive license, and permission requests for re-use of supplemental material or any part of supplemental material shall be sent directly to the copyright owner as specified in the copyright notice associated with the article.