
Abstract
Emerging cell therapies have created new demands for instruments that will increase processing efficiency. Purification of lymphocytes prior to downstream steps of gene transfer currently relies on centrifugal separation, which has drawbacks in output sample purity and process automation. Here, we present an alternative approach to blood cell purification using acoustic forces in plastic microchannels. We provide details regarding the system’s ability to purify lymphocytes relative to other blood cell types while maintaining a high overall recovery, testing performance starting from leukapheresis product, buffy coat, and whole blood. Depending on settings, the device achieves for lymphocytes up to 97% purity and up to 68% recovery, and depletes 98% of monocytes while also reducing red cells and platelets. We expect that future scale-up of our system for increased throughput will enable its incorporation in the cell therapy workflow, and that it could ultimately reduce costs and expand access for patients.
Introduction
Background
Current advances in cell therapy have sparked widespread excitement and commercial investment. New treatments for fatal diseases are now on the verge of regulatory approval, and many more therapies are expected to follow.1,2 Some of the most dramatic successes have come in adoptive cell therapy, where autologous immune cells or hematopoietic stem cells (HSCs) are collected from peripheral blood, selected and reprogrammed by gene transfer, and then infused as “living drugs” back into the patient.
New technical demands accompany the novelty of these breakthrough therapies. 3 The complex protocols involve dedicated equipment and intensive labor, and the resulting lengthy duration and high costs are driving the search for new methods to make the process more efficient. Peripheral blood contains populations of cells ranging from well over 109/mL for erythrocytes to less than 105/mL for basophils and dendritic cells. 4 Frequencies of HSCs are still lower, and even when boosted by mobilization may be in the 105/mL range. Because of this large dynamic range coupled with patient variability, and because many cells are sensitive to aging and physical insult in processing, the purification steps alone present significant technology challenges.
In the current state of the art, blood collection and purification usually begins at the bedside by centrifugal leukapheresis. The resulting leukapheresis product is enriched in leukocytes by an order of magnitude, while the red blood cell (RBC) frequency is also reduced by an order of magnitude (in units of cell concentration). This product is transferred from point of care to processing facility. Despite the initial enrichment, further purification is often needed prior to downstream steps of immunomagnetic selection and/or controlled activation by antigen reagents. 5 Residual platelets (PLTs), monocytes, granulocytes, and other components are reported to interfere with the efficiency and reproducibility of these steps, and also may interfere with the healthy in vitro proliferation (expansion) of the therapeutic cells. 6
Hence, several technologies are in use for secondary purification of mononuclear cells (MNCs) or HSCs. All of these are variations on centrifugation, and each has advantages and drawbacks. Conventional centrifugation in vials with density gradient mediums, such as Ficoll-Paque, allows lymphocyte (LYM) separation from RBCs and granulocytes, but generally does not deplete monocytes. 7 A more automated and closed form of centrifugation is available in GE Biosafe Sepax and Sefia (GE Healthcare, Pittsburgh, PA) devices or similar cell washers. 8 Despite the efficiency improvements, they remain limited by the fundamental mechanism of centrifugation. Counterflow elutriation is built around apheresis technology with the addition of a buffer counterflow, which enables further discrimination by cell size and can fractionate leukapheresis product into volumes separately enriched in LYMs, monocytes, and granulocytes.9,10 However, elutriation adds complexity to the operation and requires that each batch volume fall within a specified range. These technologies have provided an effective means of purification so far, but further solutions are needed, as processing throughput will grow and cost pressures will increase.
In this article, we present an alternative approach to blood cell purification using acoustic forces in plastic microchannels. Microfluidic cell separation by acoustic methods has been described in the research literature for more than a decade, 11 but it has only recently reached the degree of maturity that it could be envisioned for clinical bioprocessing. 12 As we show here, acoustic separation has advantages because (1) it depletes monocytes and neutrophils more effectively than centrifugation; (2) the microchannel format results in very low internal volume, such that sample loss is negligible; and (3) it is a continuous-flow method, which can be adjusted to sample volume, and in the future could be coupled directly to other flow-through modules in an end-to-end processing system. If these advantages can be translated into a manufacturable and reliable instrument, acoustic separation could replace current methods to purify blood products and offer a high degree of automation, scalability, and output purity, which could improve process control and efficiency in cell therapy.
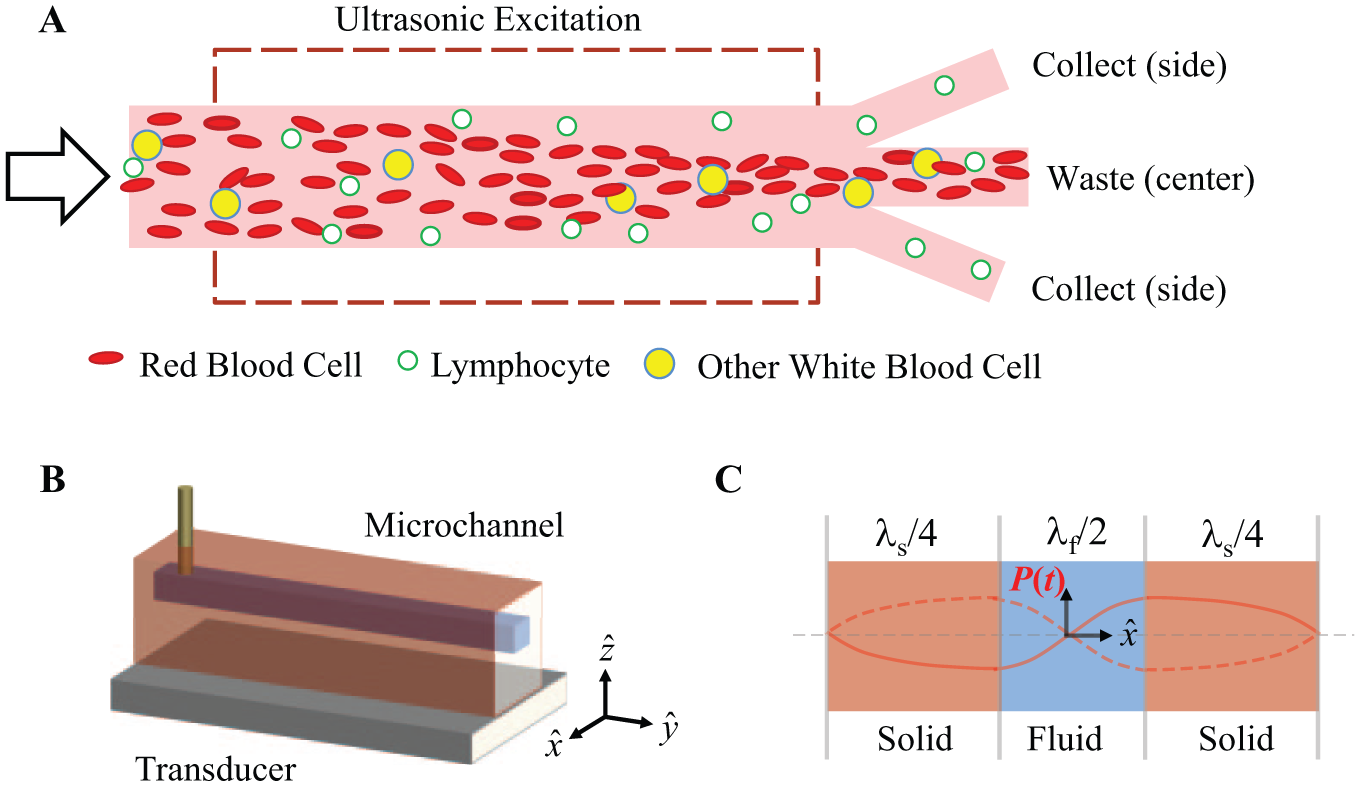
The basic principle is that the microchannel is sized with its cross section on the scale of the acoustic wavelength in the fluid, and cells experience an acoustic radiation force, or acoustophoretic force, that pushes them toward a pressure minimum along the axis of the channel ( Fig. 1A ). The force is greater on larger and denser cells and those with lower compressibility; therefore, the most susceptible cells are driven toward the axial streams, while less susceptible cells remain in the lateral streams. In practice for cell therapy applications, this means that blood, buffy coat, or leukapheresis product can be pumped through the system and RBCs, monocytes, and neutrophils will migrate, or focus, toward the center outlet of a branched outlet channel, while LYMs are collected in side branches of the outlet.
(
In the sections that follow, we review the principles of acoustophoresis and its previous development, describe the fabrication of the microchannel components and operation of the separation system, present experimental results showing purification of LYMs under varying experimental conditions, and discuss future developments needed to bring the technology into the workflow.
Principles of Operation
In contrast to large-scale cell separators, microfluidic devices take advantage of phenomena that dominate as the device scale decreases. Cells will generally flow along laminar flow streamlines and can be divided into branched outlets, as illustrated in Figure 1A . Various effects are exploited to perturb a population of cells so that they migrate across streamlines while other populations do not, such that a desired fraction of the solution exits at one or another of the outlet branches. Microscale devices have achieved this lateral migration of cells by active means, including the acoustic forces described here, electrostatic (dielectrophoresis) means, and magnetic means, or by passive means arising from shear or particle–particle interactions near channel walls, inertial effects in curved or abruptly enlarging channels, interactions with obstacles such as arrays of posts (deterministic lateral displacement), or flow constrictions (e.g., pinched flow). These approaches have been thoroughly reviewed in several publications.13,14
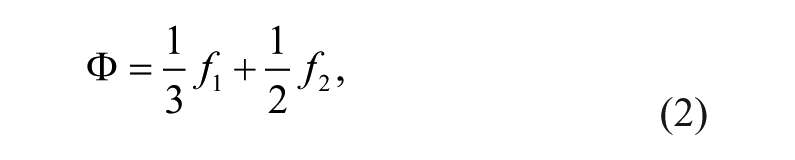
Acoustic separation as applied in this work and elsewhere uses a microchannel scaled such that its cross section acts as a resonant cavity when excited at ultrasonic frequency (~0.5–5 MHz). The resonance provides an oscillatory mode (i.e., a standing wave) which has a pressure node along the axis of the fluid channel and a pressure maximum at the fluid–wall boundary. Specifically, in a one-dimensional analysis assuming rigid channel walls, Barnkob and Bruus 15 have shown that the most efficient energy density occurs where the width of the fluid channel comprises a half wavelength and the width of the channel walls comprises a quarter wavelength ( Fig. 1C ). This analysis provides a valuable conceptual tool for optimizing the relative dimensions of the microchannel and walls and for predicting the optimum driving frequency; however, in practice three-dimensional interactions in the microchannel, as well as coupling to an external acoustic transducer, make its predictions only approximate.16,17 Moreover, in the plastic devices used here, the rigid wall approximation is insufficient, and device design and selection of operating frequency remain partially empirical. 18
The acoustic force (primary radiation force) on a small particle, with particular emphasis on the microfluidic domain, has been developed in detail. 19 In the simplified case that applies to the standing wave geometry, 20 for a particle of radius a in an acoustic field with wavenumber k, the force is given by
where
For acoustic cell separation in aqueous solutions, the most important relationships are that the force is proportional to the diameter cubed (i.e., volume); the force is proportional to the acoustic energy density, which is in turn proportional to the square of the pressure amplitude; and the force is proportional to a number named the contrast factor, Φ, which incorporates the density and compressibility of the cell relative to the density and compressibility of the suspending fluid. The contrast factors of blood cell types were recently calculated from measurements of speed of sound in neutrally buoyant solutions. 21 These were reported as 0.109 and 0.051 for RBCs and white blood cells (WBCs), respectively, although WBC subtypes were not isolated. Under constant conditions of excitation and flow, the larger, denser, and less compressible cells (higher contrast factor) will experience the greatest acoustophoretic force. Furthermore, it is possible to adjust the density of the fluid to change the contrast factor, and therefore the mobility of the cells.
An additional parameter is the relative collection among branched outlets. To separate cells that have small differences in acoustophoretic mobility, the tuning of the cells’ trajectory is critical: low flow rate, high acoustic power, and longer channels together increase the lateral migration. In a trifurcated device as shown in Figure 1A , more migration leads to increased cell capture in the center outlet, but could also result in reduced recovery of desired cells. Likewise, a larger fraction of fluid collected at the center outlet relative to the side outlets increases cell capture at the center outlet. Thus, the outlet flow ratio is an additional parameter that may be optimized for a desired separation result.
Acoustic cell separators have evolved to a high level of development. Hawkes et al. showed early examples of acoustophoresis of synthetic particles and large cells in microscale channels. 22 Nilsson et al. introduced the precision of silicon micromachining for improved laminar flow and outlet fabrication and demonstrated RBC separation. 23 Further refinements enabled close agreement with theory and the ability to separate particles and cells differing by only a few microns in size.11,20 More recently, for separation of MNCs Grenvall et al. used multiple outlets to fractionate LYMs, monocytes, and granulocytes, although the sample was prepurified and cells were fixed. 24 Augustsson et al. added a density medium to the suspending fluid to not only modulate the contrast factor, but also provide terminal lateral positions so that the different leukocyte subtypes end up in distinct streamlines regardless of residence time, although at reduced throughput. 25 Other configurations use acoustic standing waves in the vertical (zˆ direction) and have shown high-throughput RBC separation 26 or the ability to selectively deflect or trap cells toward the upper boundary.27,28 Other approaches, such as surface acoustic waves or trapping of cells by acoustically oscillated microstructures, are reviewed elsewhere; 29 these techniques offer unique advantages, but in general, the throughput is greatly reduced.
This article differs from the previous work in two ways that are significant to applications in cell therapy. The references cited above all incorporate rigid materials into the devices, such as silicon, glass, or metal. These materials offer excellent acoustic properties, but make them costly to manufacture and scale up. In contrast, our microchannels are fabricated entirely from conventional polystyrene (PS), enabling future manufacture of disposable components. We previously showed acoustophoresis in plastic for the focusing of RBCs 30 and isolation of bacteria from RBCs, 18 and here we extend the application of the plastic system to LYM purification. Additionally, previous examples of acoustic leukocyte fractionation use dilute samples and cells that have been washed, fixed, or prepurified by RBC lysis. Instead, we present here acoustic separation from standard fresh blood products that have been only moderately diluted, two to four times, with no further alteration.
Materials and Methods
Experimental Setup
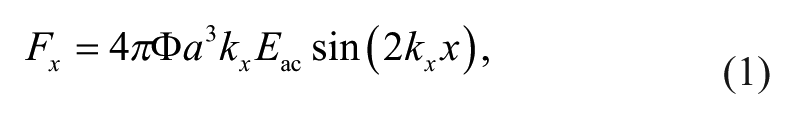
Our device consists of a polymer microchannel mounted on a piezoelectric transducer and a custom-built temperature-controlled aluminum stage, similar to others reported in the literature. 20 A function generator produces a sinusoidally varying voltage, which is amplified by a radio frequency (RF) amplifier and used to drive the transducer. The frequency of the sinusoid is chosen such that a stable standing pressure wave is generated across the width of the channel (transverse to the fluid flow direction). A stereomicroscope is used to observe the acoustophoretic focusing within the fluid cavity, and an oscilloscope measures the instantaneous voltage and current delivered to the transducer. Figure 2 depicts a block diagram of the major system components.
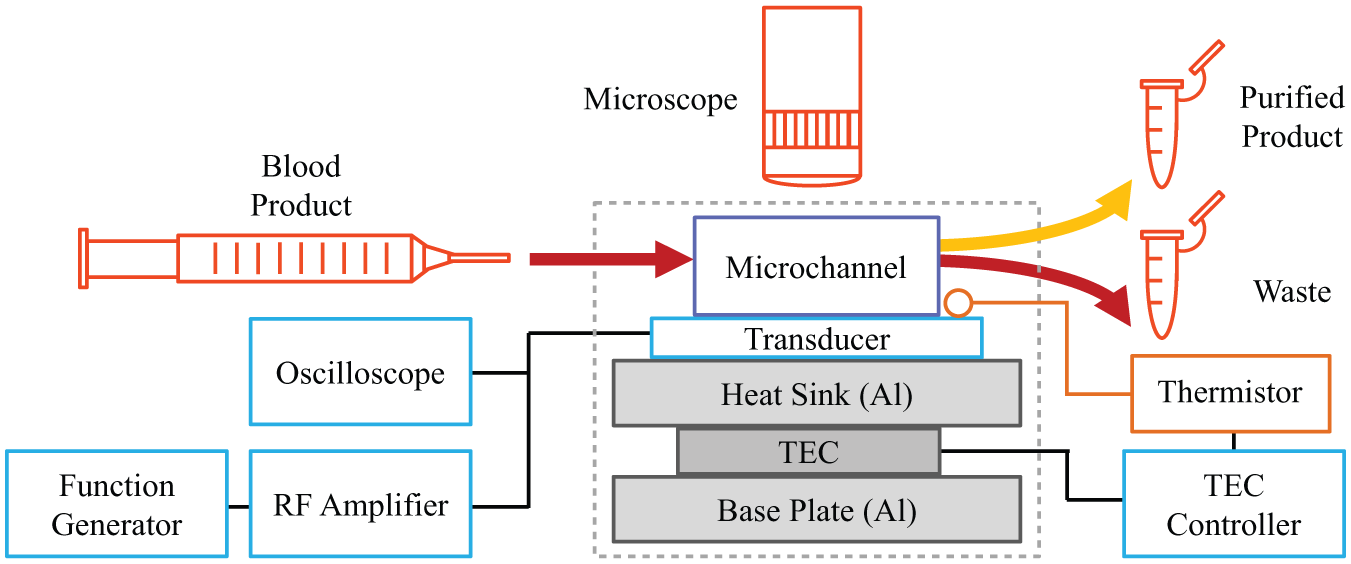
Block diagram of the acoustophoretic blood separation system and control electronics. A PS microchannel sits atop a piezoelectric transducer and an aluminum stage with closed-loop temperature control. A function generator produces a sinusoidally varying voltage, which is amplified by an RF amplifier and used to drive the transducer. The entire apparatus sits on a microscope stage for real-time optical analysis.
The microchannel and transducer are mounted on an aluminum plate that serves as a heat sink. Beneath the plate sits a thermoelectric cooler (TEC) element and an additional aluminum base plate heat exchanger. A thermistor is held with heat sink compound to the top surface of the transducer, near the interface with the microchannel. The thermistor and the TEC are connected to an off-the-shelf TEC controller to provide closed-loop temperature control of the system. Blood separations were performed at 26 °C.
Microfluidic Chip Design and Manufacturing
The plastic microchannel is composed of a straight region of rectangular cross section with a trifurcating outlet, as we have described previously. 30 The trifurcation allows for the separation of focused particles in the flow from those that are more weakly focused ( Fig. 1 ), as described above. The microchannel is fabricated using precision conventional machining with the following main channel dimensions: height hc = 200 µm, width wc = 430 µm, sidewall width ws = 1055 µm, and length 3 cm. The flow channel, inlet ports, and outlets ports are cut from a 0.95 mm thick piece of PS, and a second flat sheet is cut from another 0.95 mm thick sheet to form the underside of the channel. The PS is conventional sheet stock purchased from a distributor at a cost of $0.16 per 10 × 10 cm coupon. The two pieces are bonded by thermal diffusion bonding using a custom pneumatic laminator for 50 min at a temperature of 95 °C and an estimated pressure of 1.28 MPa. PS was chosen for its relatively high acoustic impedance and low attenuation at ~105–106 Hz, compared with those of other polymers. 31 These properties are desirable to support the efficient propagation of an acoustic standing wave in the polymer–fluid cavity system. PS is also attractive due to its optical clarity, low cost, and ease of machinability. After the microchannel is fabricated, short inlet and outlet port connectors of polyether ether ketone (PEEK) tubing are inserted and bonded in place with a two-part adhesive. Vinyl tubing is then fit over the PEEK stubs for connecting to a pump at the inlet and collection vessels at the outlets.
Transducer
The microchannel is mounted on a lead zirconate titanate (PZT) transducer element, as illustrated in Figure 1B , using cyanoacrylate adhesive. The transducer’s motion in the zˆ direction couples to the PS microchannel and excites the acoustic standing wave within the channel along the xˆ direction. For the fundamental focusing mode (single pressure node in the fluid), the operating frequency is typically in the range 900 < f < 990 kHz for our particular channel geometry and material. The transducer’s thickness is chosen such that its resonance frequency (fundamental thickness mode) is higher (greater than 20%) than the operating frequency. The ideal system efficiency is achieved if these frequencies are matched; however, slight variations in transducer resonance and acoustic resonance from one device to the next and the narrow bandwidth of these spectral peaks make accurate matching a challenging prospect. The subresonant drive of the piezo is a more consistent and still effective alternative that can be achieved with low-cost components and does not require sophisticated phase-locked control circuitry, but it does require increased drive voltage amplitude.
Sample Handling and Preparation
Experiments were performed using three blood products: whole blood, unpurified buffy coat, and leukapheresis product. All blood products were purchased from vendors. The vendors collected from healthy donors, screened for infectious disease, and de-identified the samples. The samples were anticoagulated according to conventional protocols at the collection site using either ethylenediaminetetraacetic acid (EDTA) or acid citrate dextrose (ACD). The vendor obtained buffy coat from whole blood using a plasma extractor. All samples were handled according to BSL-2 precautions and were processed within 48 h of draw.
A commercial hematology analyzer was used to quantitatively assess the cell counts of each blood sample. Samples were diluted with phosphate-buffered saline (PBS) to achieve desired hematocrit (HCT) values: whole blood was diluted to 10% HCT, buffy coat was diluted to 5% HCT, and leukapheresis product was either undiluted or diluted 1:1 (HCT ~ 2%–4%). For leukapheresis product and buffy coat, the diluent also included density medium (Histopaque) to adjust the density of the fluid to a calculated density of 1.06 g/cm3, to reduce the contrast factor (
Run Procedure and Data Collection
A syringe pump was used to drive constant flow through the acoustophoretic separation system with samples loaded into 10 mL plastic syringes for dispensing. No surface preparation of the microchannels was performed other than flushing with 10% bleach solution and/or PBS between experiments. A microscope was used to observe acoustic focusing, and a CCD camera obtained images for quantitative analysis. The drive frequency was adjusted to obtain optimal acoustic focusing, as determined by visual inspection of the focusing of RBCs to the centerline of the flow. The side (purified product) and center (waste) output streams of the microchannel were collected in Eppendorf tubes and weighed to determine the total volume flow and the flow ratio between side and center outlets. The length of the outlet tubing was adjusted to modify the relative fluid resistance, and thus the flow ratio between the side and center streams.
Each collected fraction was then analyzed using a hematology analyzer and, in some cases, where noted, by flow cytometry. The hematology analyzer provided counts of the concentration of each cell type (LYM, WBC, RBC, and PLT) in each sample, and total cell counts were determined by multiplying the concentrations by the sample volume. Throughout the results below, recovery (yield) is defined as the number of cells in the collected fraction divided by the total number of that cell type processed (collected fraction + waste fraction). The LYM purity is defined as the number of LYMs in a sample divided by the total number of all WBCs in that same sample. All data points presented are single measurements that represent the system’s performance from multiple experiments. Operating parameters (transducer voltage, outlet flow ratio, and/or flow rate) were varied to observe the settings that provide the best enrichment, and occasional outliers were ignored. Measurements were not averaged due to variability in starting blood composition between donors.
Results
Here, we demonstrate the performance of the acoustic separation system and its capability to purify LYMs from various blood products. First, we characterize acoustophoresis in the system by acoustically focusing dilute whole blood and conducting image analysis on microscope images of the focused stream. Next, we turn to the enrichment of LYMs from whole blood, buffy coat, and leukapheresis product while paying particular attention to the recovery and purity of the final product. Finally, we demonstrate the potential for compounding enrichment performance by passing the sample through the system multiple times. These results are selected to demonstrate the versatility of the system to meet the needs of various applications.
RBC Focusing
The optical transparency of the PS microchannel allows for optical monitoring of acoustic focusing performance throughout the course of an experiment. We optimize our initial system parameters (drive frequency, amplitude, and relative flow fraction) in an empirical process in which we observe the focusing of RBCs as they pass through the microchannel. Microscope images of the device as viewed near the downstream end of the channel are shown in Figure 3B for five transducer drive amplitudes at constant frequency. The optical pixel intensity across the width of the channel (along the xˆ direction) is shown in Figure 3A for each of the images. For this analysis, the images are inverted so that the brightest (largest-intensity) areas correspond to the areas of greatest concentration of RBCs and data are taken as an average across the entire field of view of the microscope.
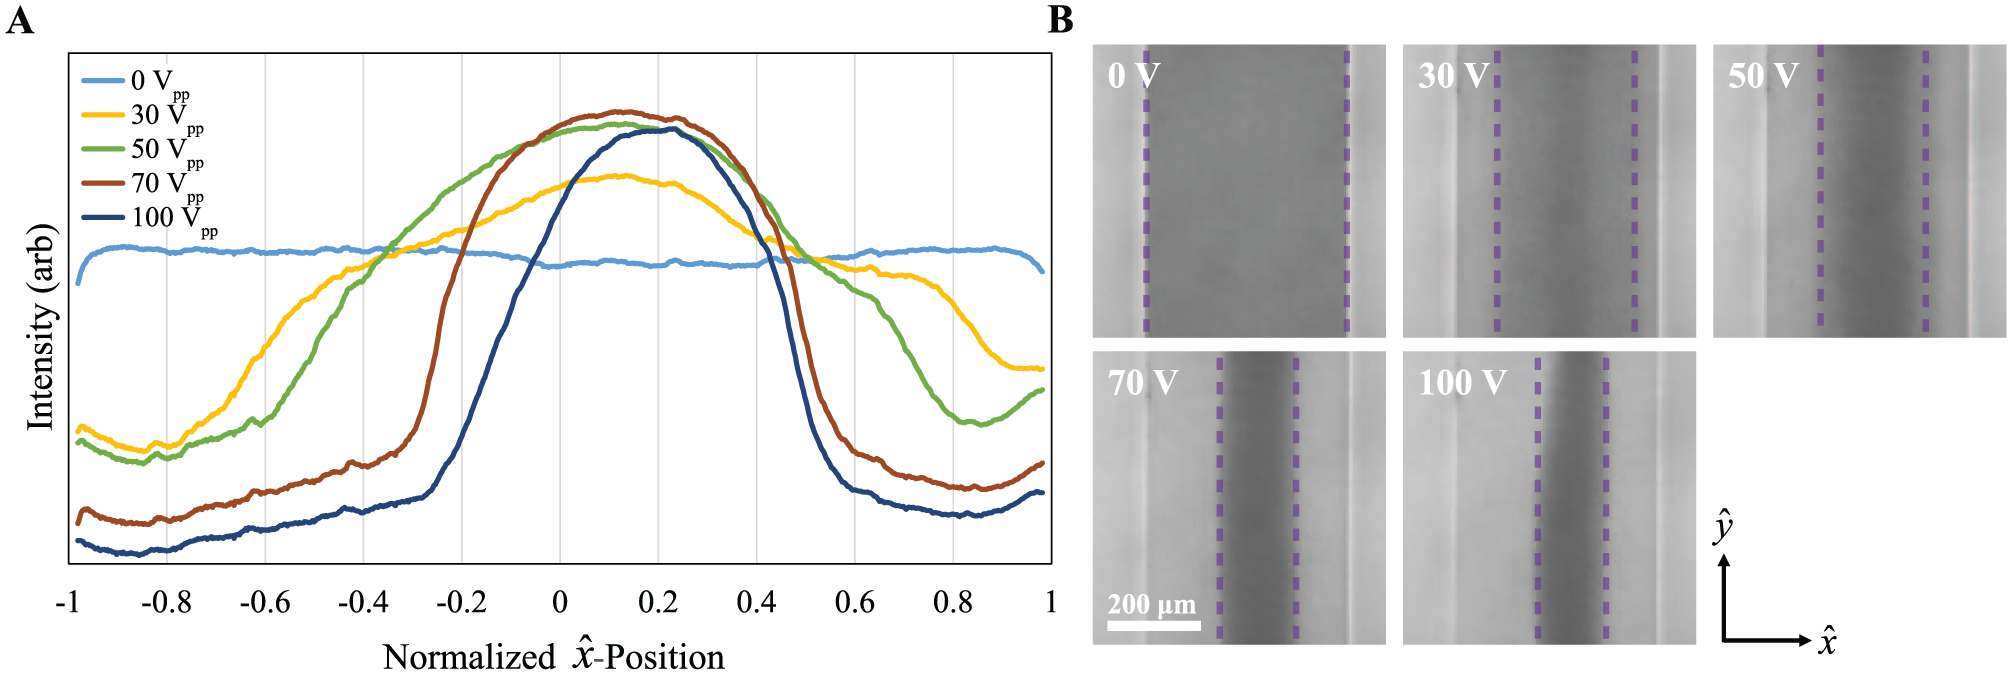
Optical image analysis of a focused stream of RBCs in the microchannel. Sample is whole blood diluted to 10% HCT in PBS and flow rate Q = 25 µL/min. (
In the case of no acoustic energy, V = 0, the optical intensity, and thus the RBC distribution, is uniform across the width of the channel. When the transducer is driven at a frequency that matches the system’s acoustic resonance, the RBCs are more tightly focused as the drive amplitude is increased. At the highest drive amplitude tested, 100 Vpp, the RBCs are focused in a tight band with a full width at half maximum that is less than 30% of the width of the microfluidic channel. The asymmetry of the distribution can be attributed to imperfections in the alignment of the microfluidic chip during the assembly process and nonuniformities in the initial distribution of the RBCs at the inlet of the chip that are carried downstream.
Distributions and images of the type shown in Figure 3 are used only as an initial guide for setting the system parameters, because the degree of RBC concentration provides an immediate assessment of the strength of the acoustic energy. In a typical experiment, the side and center output streams are collected and their contents are analyzed for the concentration of cell types. This information is used to further refine the operating parameters of the system for LYM enrichment.
Lymphocyte Enrichment
We tested the system for the enrichment of LYMs from various blood products, tuning voltages, flow rates, and side flow fractions to separate a product with a high LYM purity (percent WBCs that are LYMs) while maintaining a high overall LYM recovery (number of LYMs collected in the side flow fraction divided by the number that flowed through). The sample collection and calculation of the recovery and purity for each run was carried out as described in the Run Procedure and Data Collection section above. Figure 4 presents the performance of our system for purifying LYMs from leukapheresis product, buffy coat, and whole blood. In Figure 4A , B , the system is tuned to prioritize the sample purity. In this configuration, the final LYM purity is 97% from leukapheresis product, 92% from buffy coat, and 59% from whole blood, while maintaining an overall LYM recovery of 43%, 29%, and 25%, respectively. In Figure 4C , D , the system is tuned to prioritize recovery. Here, 72%, 54%, and 37% of LYMs are recovered from leukapheresis product, buffy coat, and whole blood, respectively, while achieving a purity of 91%, 72%, and 44%, respectively. Table 1 lists the system parameters and other experimental details for the data presented in Figure 4 . The volumetric flow rate varied from 30 to 100 µL/min, the HCT varied from 1.7% to 9.9%, and the transducer drive amplitude varied from 60 to 120 Vpp. These high-purity and high-recovery modes of operation demonstrate the flexibility of the acoustophoretic blood separation platform and its utility for blood processing.
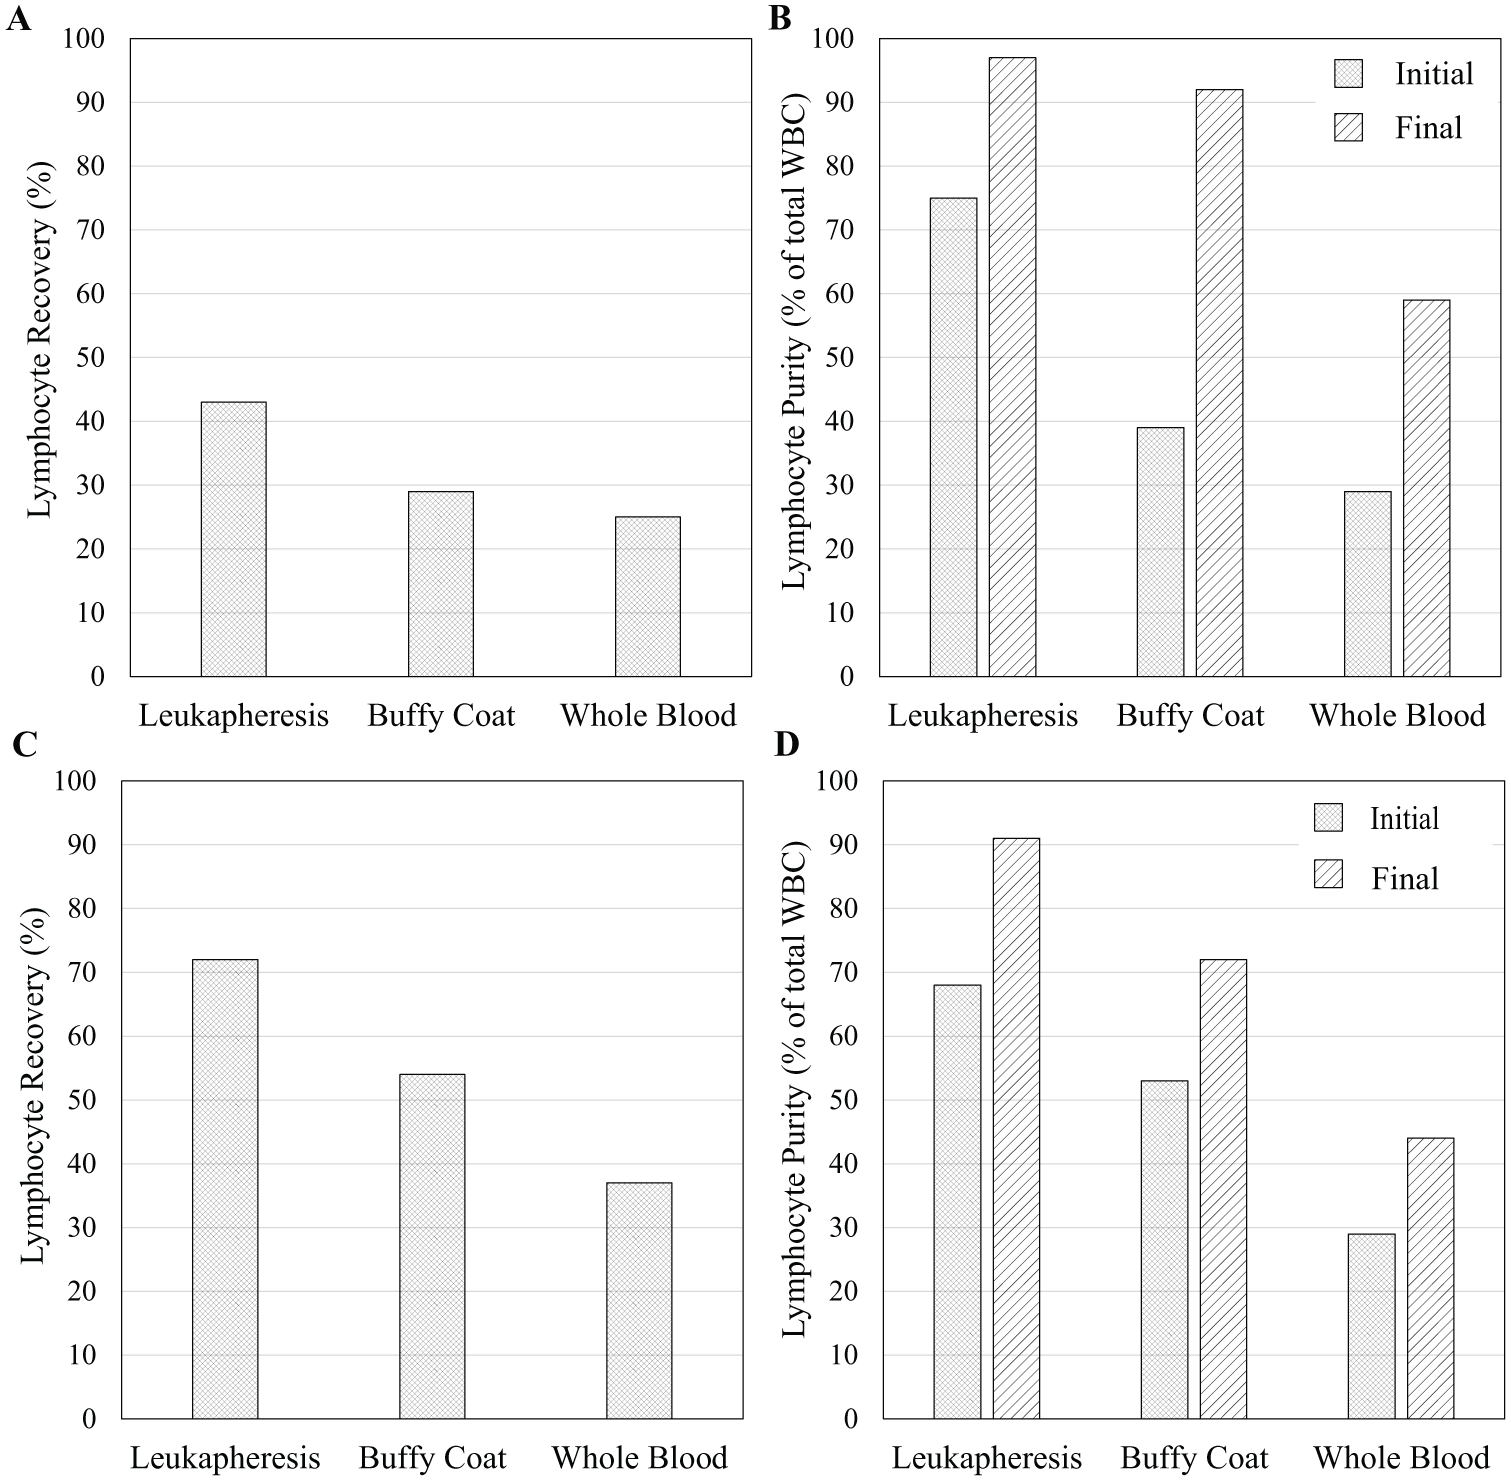
LYM recovery and purity in the collected side output for three blood products with the system tuned to prioritize high purity (
Operating Parameters and Conditions for the Results Shown in Figure 4.
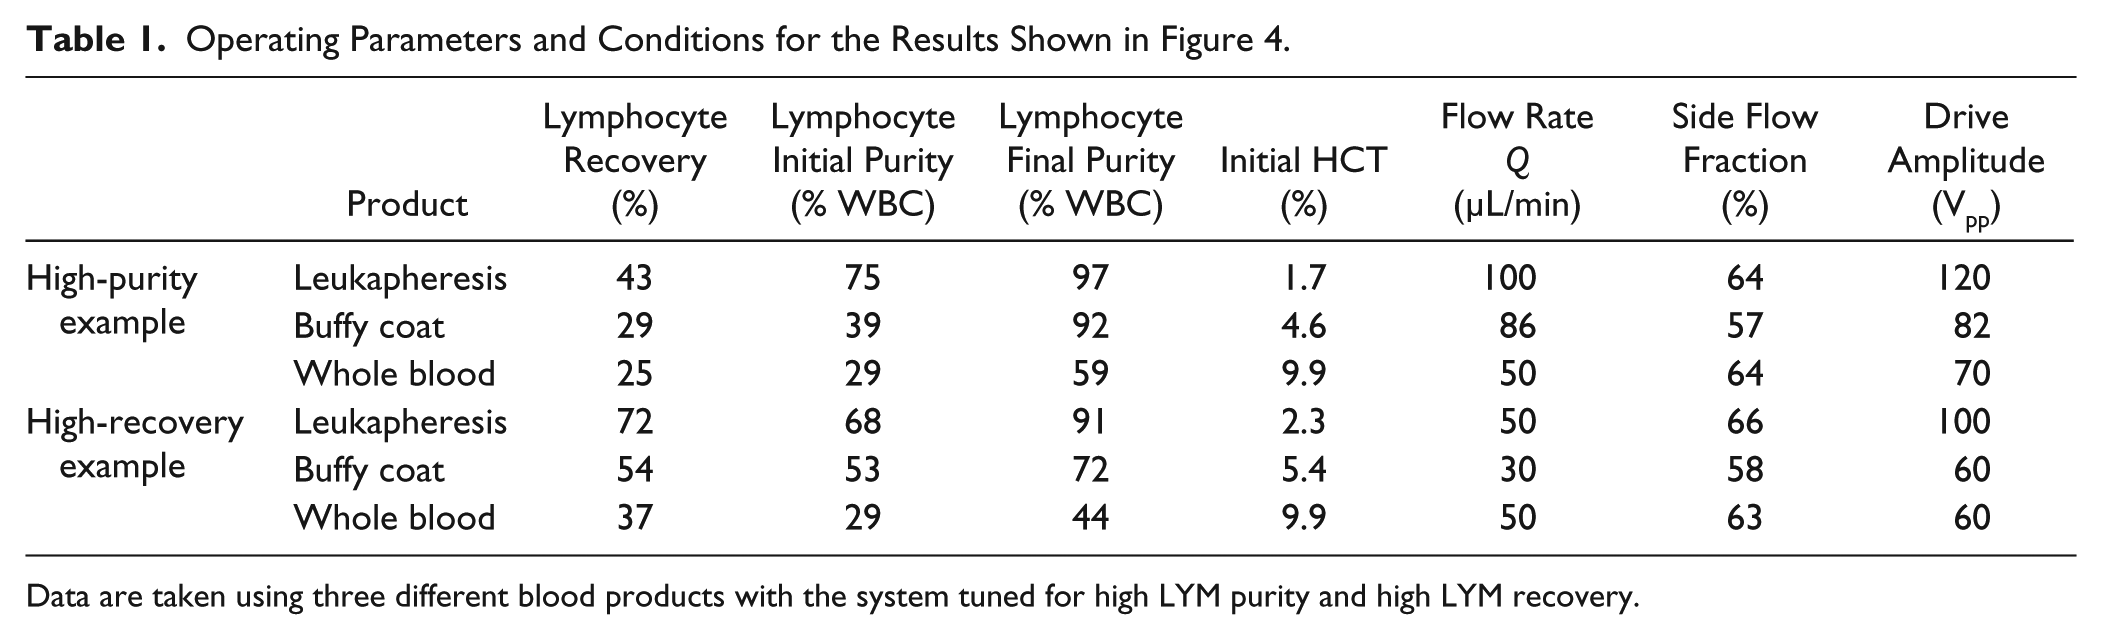
Data are taken using three different blood products with the system tuned for high LYM purity and high LYM recovery.
While Figure 4 summarizes selected examples of performance, Figure 5 presents a detailed example of separation of cell types using leukapheresis product, and illustrates how parameters are varied to optimize tuning. The results are plotted as a function of transducer voltage (i.e., acoustic excitation amplitude) for four different side flow fractions. For all data sets, increasing the transducer voltage causes cells to focus to a greater degree and decreases recovery in the side stream. PLTs and LYM, however, display only slight amplitude-dependent behavior, owing to their relatively small size and lower density, possibly because of margination by other blood components in the center stream of the flow. 32 Under optimized conditions, LYM recovery remains large as the transducer voltage is increased, while RBCs and other WBCs are further depleted. Increasing the side flow fraction increases the recovery of all cell types but also somewhat reduces LYM purity, as more of the focused granulocytes are collected in the side outlet.
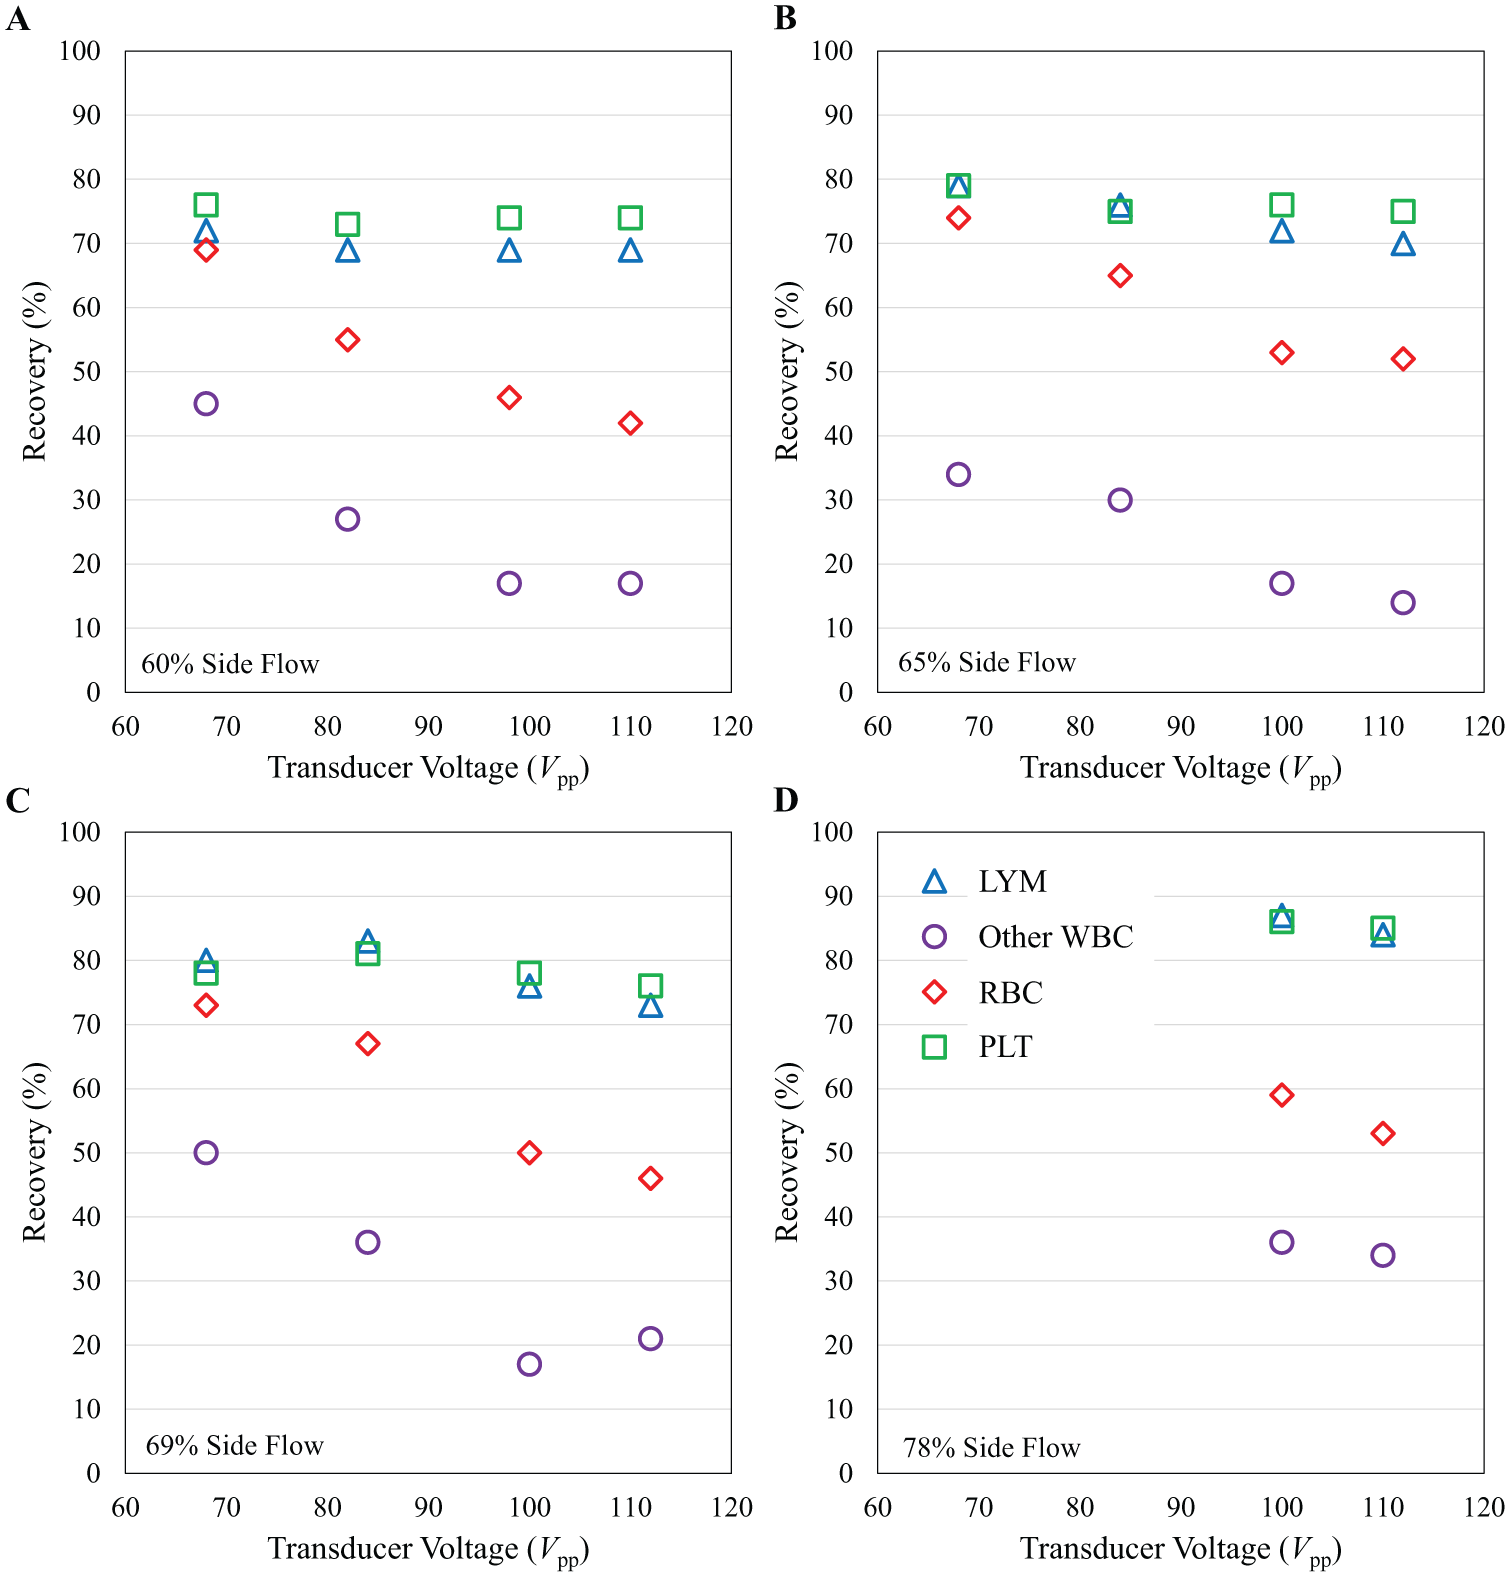
Recovery of multiple cell types as a function of transducer drive amplitude for four different volumetric side flow fractions. Recovery is shown for LYMs (blue triangles), other WBCs (non-LYMs) (purple circles), RBCs (red diamonds), and PLTs (green squares) in the collected side output of the device as a function of transducer drive amplitude for side flow fractions of (
Two-Stage Platelet Depletion
Here, we use a two-stage separation procedure (two passes through the acoustic separation device) in order to obtain a higher amount of PLT depletion ( Fig. 6 ). In the first stage, the transducer is driven with a relatively large side flow fraction and lower flow rate (120 Vpp, 75% side flow, 60 µL/min) to collect most blood components at the center output of the microchannel, with the exception of PLTs, which experience a smaller acoustic radiation force and are collected at the side outputs of the microchannel (PLT recovery of 72% side and 28% center after the first stage). The collected intermediate product from the center output is then diluted 1:1 and processed through the system a second time with a higher flow rate of 100 µL/min. The final product, collected at the side outputs, contains only 16% of the original PLTs, but retains 41% of the LYMs with 88% purity as a fraction of total WBCs. As compared with single-stage separation operating at comparable lymphocyte purity, the two-stage separation procedure has lower overall LYM recovery (41% vs. 73% for two-stage and single-stage separation, respectively) but much higher PLT depletion (84% vs. 24% for two-stage and single-stage separation, respectively). We anticipate that similar results could be obtained by connecting two devices in series.
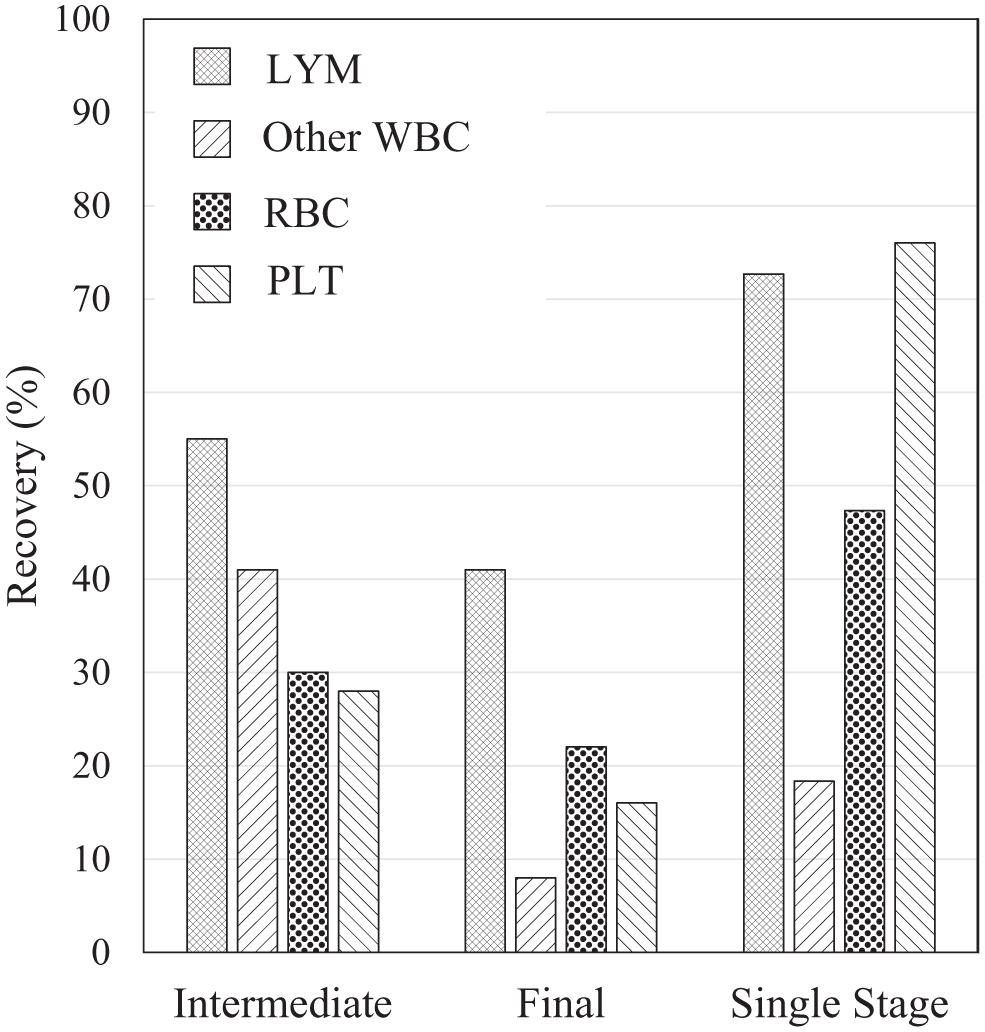
Recovery of multiple cell types from a two-stage process targeted at depleting PLTs, compared with a single-stage process. The recovery of LYMs, other WBCs (non-LYMs), RBCs, and PLTs is shown after the intermediate stage and the final stage, and compared with single-stage purification as presented in Figure 5 . The final LYM purity was 88% in both single-stage and two-stage processes. The two-stage sample is leukapheresis product diluted to 2.3% HCT in PBS and Histopaque. The first-stage system parameters are side flow ratio = 75%, transducer drive amplitude = 120 Vpp, and Q = 60 µL/min, and the second-stage parameters are side flow ratio = 72%, transducer drive amplitude = 122 Vpp, and Q = 100 µL/min. The single-stage sample is shown for comparison and is leukapheresis product diluted to 2.3% HCT in PBS and Histopaque with system parameters set to side flow ratio = 70%, transducer drive amplitude = 100 Vpp, and Q = 50 µL/min.
Monocyte Depletion
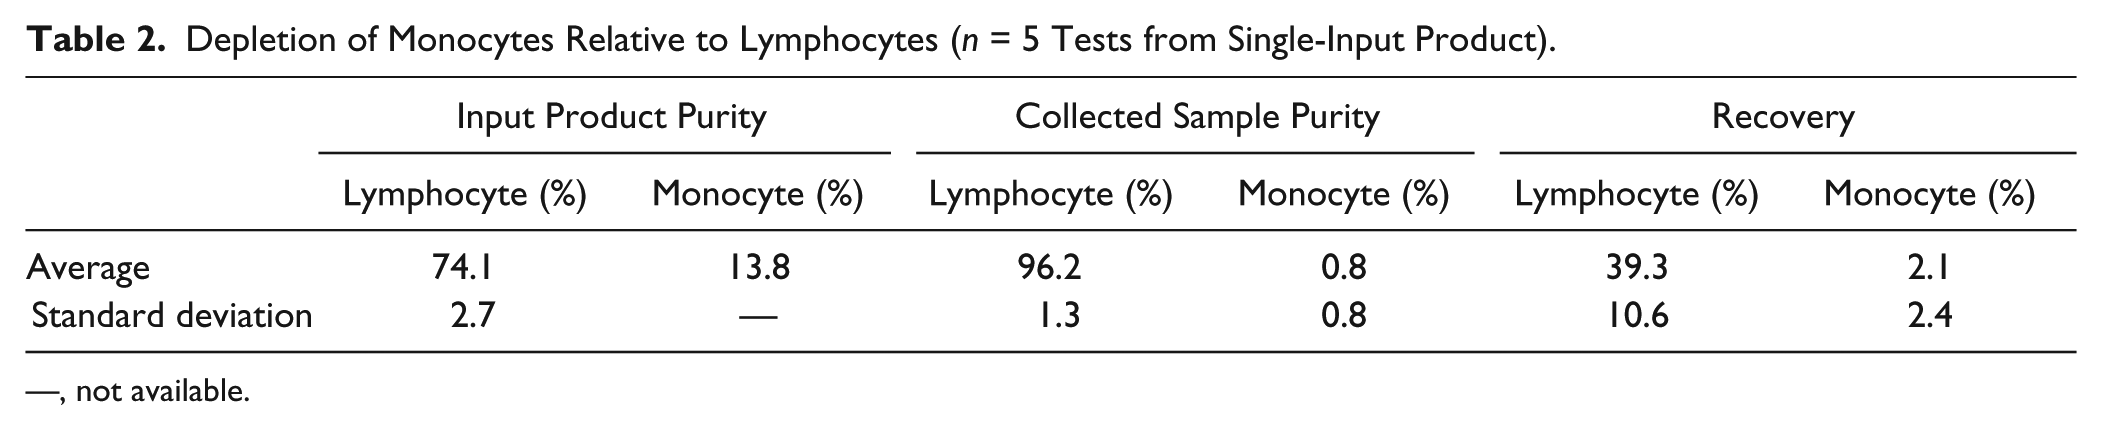
Under conditions similar to those of the “high-purity” tuning shown above ( Fig. 4A , B ), a leukapheresis product sample was analyzed by flow cytometry for the separation of monocytes (CD14+) after the process. Five experiments were performed comprising slight variation in voltage (104–120 V) and side flow fraction (61%–64%), where the variations were meant to also test for fine tuning of LYM purity (data not shown). In all cases, the flow was 100 µL/min and the dilution was 1:1 with PBS and density medium as described in Materials and Methods. As shown in Table 2 , the average monocyte depletion (depletion = 1 – recovery) was 98%, while the LYM recovery was 39% and the LYM purity was 96%. Monocytes are reported as percent CD45+ and CD14+, and LYMs are reported as percent WBCs by hematology analyzer.
Depletion of Monocytes Relative to Lymphocytes (n = 5 Tests from Single-Input Product).
—, not available.
Red Blood Cell Depletion
Erythrocytes respond to acoustophoresis somewhat more strongly than LYMs under the operating conditions presented here. The relative recovery of LYMs to the recovery of RBCs and the final number of RBCs/LYMs were calculated from leukapheresis samples under varying conditions but producing similar performance. For high-purity tuning, as in Figure 4A , B , and setting a requirement of ≥93% purity (n = 11 tests), the average relative recovery was 0.94 and the average final number of RBCs/LYMs was 8.9. For high-recovery tuning, as in Figure 4C , D , and setting a requirement of 69%–73% recovery (n = 8 tests), the average relative recovery of LYMs to RBCs was 1.4 and the average final number of RBCs/LYMs was 6.9. In the two-stage process, the recovery of LYMs to RBCs reached 1.9 and the count of RBCs/LYMs in the final product was 6.1.
Lymphocyte Viability and Distribution of Subtypes
Following the purification of LYMs from leukapheresis product, the collected and waste fractions were analyzed by flow cytometry to confirm viability and compare distribution of subtypes. Cell viability was assessed less than 2 h after processing by measuring the presence of annexin-V and 7-AAD exclusion as a surrogate for early apoptosis and necrosis, respectively. Processed samples measured 11 ± 8% annexin-V+ and 98 ± 2% 7-AAD– and were not significantly different from controls.
Acoustophoresis is not predicted to distinguish among LYM subtypes, because the physical properties of these cells are nearly identical. As expected, a standard panel labeling T (CD3+), B (CD19+), and natural killer (CD16+ or 56+) cells revealed no significant change (<2%) in the relative frequencies of these phenotypes when comparing the outlet fractions.
Discussion
The results presented above indicate that acoustic separation in microchannels can be used to purify LYMs relative to other blood cell types, and that the process is effective on conventional blood products and without the need to modify or wash cells. As with all purification methods, a trade-off is observed between the competing objectives of high recovery and high purity, and the system can be tuned to favor one or the other. Between these objectives is a continuum that further experiments will elucidate. In comparison with centrifugal methods, acoustic separation achieves a higher purity of LYMs with respect to other leukocytes at comparable recovery, although the depletion of erythrocytes may be lower. The purity performance for LYMs approaches that of elutriation, reported at 92%–96% purity and 66%–82% recovery when starting with a leukapheresis product,9,10,33 while acoustophoresis has the advantages of continuous separation for a wide range of process volumes. In comparison with fluorescence-assisted cell sorting (FACS) cytometers, which are generally operated on the order of 104 events/s, in acoustophoresis no labeling is required, and the throughput reported here of input cells is more than 7 × 10⁵ cells/s for the whole blood separations. On the other hand, the purity obtained by FACS is superior.
Acoustic separation of blood components in microchannels has been tested previously, but using devices made from silicon, glass, or metals. Direct comparisons between those results and ours are not possible because of differences in sample preparation and separation goals. Grenvall et al. achieved 95% purity and 87% recovery in a silicon microchannel at an input rate of about 140 cells/s using a sample of washed and fixed WBCs. 24 Urbansky et al. used a silicon microchannel and 20× diluted whole blood (~4 × 10⁵ cells/s) and obtained 53% purity and 87% recovery MNCs. 34 Using a stainless steel device, Chen et al. achieved 97% purity and 85% recovery of all combined RBCs and WBCs (i.e., vs PLTs, with no discrimination of LYMs) at a cell input rate of 5 × 10⁸ cells/s. 35 These results, taken with ours, could be interpreted to show that factors of processing rate and cell concentration dominate over differences in device materials in their impact on separation performance.
Among the blood products tested, the highest recovery is obtained in leukapheresis product, less in buffy coat, and still less in whole blood ( Fig. 4 ). Conversely, in terms of enrichment (final LYM purity divided by the initial one), we observe higher gains in whole blood and buffy coat, and less in leukapheresis product. Further study is needed to explain these trends, but we speculate that the reductions in recovery are due to particle–particle interactions, where a higher load of RBCs relative to LYMs acts to transport some LYMs, along with the flux of RBCs, toward the center outlet. Meanwhile, in terms of enrichment, one explanation is that the high fraction of granulocytes in whole blood and buffy coat is readily depleted, while the monocytes and residual granulocytes making up the non-LYM population in the leukapheresis product have lower acoustophoretic mobility and are less easily discriminated from LYMs.
For use in cell therapy workflow, we envision acoustic separation as a preprocessing step after blood collection and before magnetic selection, if employed, or before activation. We expect that a reduction in interfering cells will aid process control and net downstream yield of successfully transduced cells. 6 This could reduce overall processing time and conserve costly selection antibodies and the transduction vector. 2 To displace established methods in this role, such as density gradient centrifugation, an acoustic separator would have to achieve throughput greater than 100 mL/h. We have recently reported an acoustic separator identical to that described above but having 12 parallel separation channels connected by a branched manifold, 36 and such a device could eventually meet these throughput requirements.
Despite the potential advantages of acoustic separation for cell therapy, a number of hurdles and questions remain. Although we and others have shown that acoustophoresis has no ill effects on various cells by many measures,37,38 downstream steps of transduction and expansion of T cells or HSCs following acoustic separation have to our knowledge not yet been attempted. Additionally, blood samples representing the wide range in cell counts resulting from differing disease states, chemotherapy, and natural patient variation have yet to be tested for comparison with our current results from normal blood, and processing of clinical volumes awaits device scale-up. Along with functional validation, the engineering needed to construct an automated instrument with controls and a user interface is a task for future development. On the other hand, along with these developments there are opportunities for performance improvements in recovery and purity as microchannel resonance is optimized16,18 and operating protocols evolve.
In conclusion, an acoustic microchannel device fabricated from plastic is shown to purify LYMs relative to other white cell types while also depleting red cells. In a two-stage procedure, PLTs are depleted as well, although recovery is reduced. Acoustofluidic separation may have advantages over existing commercial centrifugal or counterflow elutriation systems in terms of the combined performance in recovery and purity, along with continuous, flow-through processing and potential for future automation. With a scaled-up device for increased throughput, an acoustophoretic separation system could aid in cell therapy workflow toward ultimately reducing costs and expanding access to patients.
Footnotes
Acknowledgements
We are grateful to Parker Dow and Ryan Silva for contributions to device developments and to Dorit Berlin for helpful discussions on cell therapy processing.
Declaration of Conflicting Interests
The authors declared no potential conflicts of interest with respect to the research, authorship, and/or publication of this article.
Funding
The authors received no external financial support for the research, authorship, and/or publication of this article.