
Abstract
Phenotypic cell–based assays have proven to be efficient at discovering first-in-class therapeutic drugs mainly because they allow for scanning a wide spectrum of possible targets at once. However, despite compelling methodological advances, posterior identification of a compound’s mechanism of action (MOA) has remained difficult and highly refractory to automated analyses. Methods such as the cell painting assay and multiplexing fluorescent dyes to reveal broadly relevant cellular components were recently suggested for MOA prediction. We demonstrated that adding fluorescent dyes to a single assay has limited impact on MOA prediction accuracy, as monitoring only the nuclei stain could reach compelling levels of accuracy. This observation suggested that multiplexed measurements are highly correlated and nuclei stain could possibly reflect the general state of the cell. We then hypothesized that combining unrelated and possibly simple cell-based assays could bring a solution that would be biologically and technically more relevant to predict a drug target than using a single assay multiplexing dyes. We show that such a combination of past screen data could rationally be reused in screening facilities to train an ensemble classifier to predict drug targets and prioritize a possibly large list of unknown compound hits at once.
Introduction
Most often, the current model of drug discovery implies prior identification of a target. This identification allows primary biomolecular screens to focus on a narrowed set of mechanisms of action (MOAs). This approach has shown some success, especially in identifying best-in-class drugs. However, this strategy generates the production of increasingly weak first-in-class drugs, along with ever higher costs. Furthermore, despite widespread adoption of the target-based approach by pharmaceutical companies, an alternative approach, named phenotypic, has brought twice the amount of compounds of a new therapeutic class (i.e., based on a new MOA) to the market in recent years. 1
Nevertheless, a major challenge of phenotypic approaches remains the posterior identification of the MOA of a lead compound having a desirable effect, for which we have little prior information. Various methods have been developed to dig into the activity of a compound in a cellular system in order to uncover interactions with cell products, including direct biochemical methods, genetic interactions, or computational inference. 2 However, the precise identification of the efficacy target remains a tedious task with little chance of success and is largely refractory to systematic analyses.3,5
Inferring the MOA of an unknown compound in a systematic way by phenotypic similarity has been studied in the past.6,7 More recently, it has been formulated as a classification problem in the phenotypic feature space, using either gene expression or morphometric profiles for a low number of MOAs.8,10 Drug target associations were predicted this way and experimentally confirmed, 11 suggesting a route to identify the action of new therapeutic agents. Realistically, rather than precisely identifying the efficacy target of each drug, the functional prediction by profiling could be considered an efficient tool for hit prioritization following a primary high-content screening (HCS). Building a robust method to solve this task on a large scale would bring a solution to one of the main obstacles to phenotypic screening dedicated to drug discovery.
A recent promising approach, the cell painting assay, proposes using six multiplexed fluorescent dyes in a high-throughput image-based assay to create morphological profiles that monitor the general activity of the cell. 12 As for a typical HCS, multi-well-plated cells are treated with compounds, stained, fixed, and imaged with a high-throughput microscope. Automated image analysis is performed to identify individual cells. Then, thousands of morphological features (measures of size, shape, texture, intensity, and neighborhood) on six channels imaging eight cellular compartments are computed to produce a rich profile per cell. Those individual cell profiles can be used for the detection of subtle phenotypes and are efficient to group chemical compounds or genes into functional pathways. Note that adding dyes is limited technically by the number of separated channels one can simultaneously image with a fluorescent microscope, due to the strong overlap of fluorescent protein emission spectra. Therefore, approaches were suggested to identify and iteratively replace the least informative dyes, 13 select the most effective cell line, 14 or image compartments separately in a complex multiple set of experiments. 15 However, the cell painting procedure seems to represents nowadays one of the most optimal ways to simultaneously capture a maximum of information on the cell state in a single high-throughput assay.
In this work, we hypothesize that while a complex cell painting assay on an optimized cell line represents a compelling approach, using a combination of simple image-based assays on several cell lines may be more relevant biologically, more practical, and more accurate for the task of hit prioritization.
Materials and Methods
Patient-Derived Cell Lines
Patient-derived malignant pleural mesothelioma cell lines MPM04/BAR, MPM10/CORO, MPM11/DEL, MPM17/GAG, MPM24/MART, MPM25/MAY, MPM28/MLD, MPM59/LLA, and MPM60/MASS cells (obtained from Didier Jean, INSERM UMR 1162, Paris, France) were cultured in Roswell Park Memorial Institute (RPMI) 1640 medium (Gibco Life Technologies, Waltham, MA), supplemented with 10% (v/v) fetal bovine serum (20% for MPM11/DEL) (Gibco Life Technologies) and 1% (v/v) penicillin/streptomycin (Gibco Life Technologies) in a 5% CO2 humidified atmosphere at 37 °C. The prostate IGR-Cap1 R100 cell line was grown as described previously. 22 The medium was replaced every 3–4 days.
For compound screening, cells were counted with a T4 Cellometer cell counter (Nexcelom, Lawrence, MA) and then seeded in 384-well plates (ViewPlate-384 Black, PerkinElmer, Waltham, MA) in 40 µL of cell media using the MultiDrop Combi (Thermo Fisher Scientific, Waltham, MA). Cell line densities were empirically determined: 3000 cells per well for IGR-Cap-100; 1750 cells per well for MPM10/CORO, MPM17/GAG, and MPM24/MART; 2000 cells per well for MPM04/BAR, MPM25/MAY, and MPM59/LLA; 2500 cells per well for MPM60/MASS; and 3000 cells per well for MPM11/DEL and MPM28/MLD. The screen was performed at early cell passages for all replicates after the cells had been thawed from liquid nitrogen and passaged three times.
Phenotypic High-Content Screening Assays
Cells were treated with a commercially available collection of 1200 off-patent drugs (the Prestwick library, http://www.prestwickchemical.com). All compounds were diluted in cell media using the MultiChannel ArmTM 384 (MCA 384) (TECAN) for a final concentration of 10 µM in the screen. The concentration of DMSO in each assay well, including all control wells, was 0.5%. Forty-eight hours after compound transfer, mesothelioma cells were next stained with Hoechst 33342 nuclear stain solution (1:500, Life Technologies, Waltham, MA) for 20 min.
Prostate cancer cells were incubated for 3 h at 37 °C with 10 µM 5-ethynyl-2-deoxyuridine (EdU, Invitrogen, Waltham, MA) and then fixed with paraformaldehyde 3% for 15 min (Sigma, St. Louis, MO). Cells were next permeabilized for 5 min with Triton X-100 and labeled with an anti-rat Ki67 cell proliferation marker (1:500, Millipore, Billerica, MA) and DAPI. Click-it reaction was added for 30 min to locate EdU in order to detect cells in the S-phase. The drug screening was performed in two independent replicates for each cell line.
Images were acquired using the IN Cell 2000 automated imaging system (GE Healthcare, Pittsburgh, PA) using a 10× 0.45 NA objective (Nikon, Tokyo, Japan).
For the BBBC021 dataset, details are available in Caie et al. 16
Image Analysis and Feature Processing
For the mesothelioma screen, each compound was represented by four fields of view (FOVs). CellProfiler 17 was used to initially find nuclei on each FOV from the Hoechst channel. On the identified nucleus mask, a predefined set of 193 features, such as intensity, morphology, and texture, was extracted to describe the drug effect at the single cell level. Features from the different FOVs of the same well were averaged in order to get a single vector describing the compound effect. To normalize for batch and spatial effects, DMSO negative control was used to perform a robust z-score normalization and iterative adaptive median filtering. 23 The two technical replicates were averaged together, defining the final feature representation for each compound.
For the prostate cancer screen, nuclear segmentation from the DAPI channel was used as a mask to extract Ki67 (cell proliferation marker) and EdU (S-phase) marker features. A total of 36 measures were obtained using the IN Cell Analyzer Workstation 3.7 software (GE Healthcare). Then the same normalization as that for the mesothelioma assays has been applied.
For the BBBC021 dataset, Ljosa et al. 10 provided the raw features (453 features) as supplementary data. We followed the same feature processing as described in Ljosa et al. 10 for data normalization and the mean profile method. In more details, we averaged features of cells from the same well (four FOVs per well) in one feature vector. Then we computed the median of the feature vectors corresponding to the same drug compound condition (two to three biological replicates per condition). This procedure gives a unique feature profile for each drug-concentration condition.
Confusion Matrices
MOA annotations for the BBBC021 dataset are available online at https://data.broadinstitute.org/bbbc/BBBC021/ and as supplementary data in Ljosa et al. 10 We used a leave-one-out cross-validation approach; that is, for a left-out compound at a particular concentration, we took its feature profile and determined the nearest-neighbor profile with respect to cosine distance. The predicted MOA for the left-out condition is decided to be the nearest neighbor’s MOA label. To avoid overfitting when the nearest-neighboring profile is determined, we excluded other concentrations of the same compound.
Targets of Prestwick Library Compounds
Based on the compound Chemical Abstracts Service (CAS) number, a script was used to automatically query ChemBank and DrugBank simultaneously to retrieve all available data, including all known gene targets for each compound. To mimic the scenario of predicting targets of new compounds, we performed a leave-one-compound-out cross-validation. For this prediction, we could only use a subset of the Prestwick compounds that had at least one common target with the other drugs in the set. From the initial set of 1200 compounds, after removing compounds with no known targets, compounds whose target was unique, or nonclinically validated targets from the original investigator, we obtained 614 compounds targeting 113 genes.
Target Prediction
The prediction task was performed with random forests as weak base classifiers. During training, we constructed a given number of decision trees 24 that we optimized at 30 after testing a range of values between 20 and 40. More precisely for each tree, a random subset of features is selected and the best split of input data points based on this subset is determined to construct the decision tree. To generate predictions, we built an ensemble classifier made of these random forests, with each forest constructed on one assay independently. For this step, we used the MATLAB machine learning toolbox: https://www.mathworks.com/help/stats/classificationensemble-class.html. For a left-out compound, we summed the probabilities to belong to a particular class over all individual random forest classifiers and assigned the maximum class as the predicted class (top 1 prediction). We used this process of soft voting because majority voting would otherwise essentially become a random selection when combining a low number of assays, such as two or three. We also checked if the target was in the top 5 highest soft votes (top 5 prediction).
Supplementary Information
MATLAB code and all datasets needed to reproduce the results are available at https://github.com/biocompibens/MultiplexTarget.
Results
General Fluorescent Markers Seem Redundant for MOA Prediction
We used the BBBC021 dataset10,16 where cells have been stained for DNA, actin, and tubulin as general markers of the cell phenotype, and treated with 38 drugs at two to three concentrations. An image processing step was performed to detect all individual cells and their nuclei. Following this step, a set of 453 features quantifying intensity, morphology, and texture were computed per cell on all channels using CellProfiler 17 (see Materials and Methods section). Similarly to Ljosa et al., 10 we used the guilt-by-association approach, 18 which associates an MOA to an unknown compound based on the similarity of their morphometric profiles. Such morphometric profiles were constructed by taking the average value of each feature for all cells of a given treatment, thus producing 453-dimensional vectors when features computed on all channel were considered. In our experiment, we alternatively considered features computed from the nuclei stain only ( Fig. 1A ), features computed from the nuclei and actin stains only ( Fig. 1B ), and eventually features computed from the three available markers ( Fig. 1C ). Note here that the segmentation process for each cell consists of identifying individual nuclei on the DAPI channel first (see examples of DAPI images in Fig. 2 ), and then applying a region-growing algorithm on the actin channel, using nuclei as seeds, to obtain the cell boundaries. Therefore, features computed from the tubulin channel depend on the actin channel, which itself depends on the DNA channel. This is the reason why we disregarded profiles that would not contain DNA stain or contained tubulin only. Figure 1C reproduces the results obtained in Ljosa et al. 10 using all markers and reaching 83% accuracy for 12 MOAs. Unsuspectingly, Figure 1A shows that removing all channels but DNA preserves a high level of accuracy at 68% for 12 MOAs. It indicates that the majority of information is already captured by the nucleus channel and can be retrieved by means of intensity, morphological, and texture features over the cell nuclei. Figure 2 shows that some of these differences between MOAs are partially visible on the DNA channel. Subsequent addition of actin and tubulin to the DAPI only slightly increases the accuracy for the 12 MOAs (74% and 83%, respectively; Fig. 1B,C ).
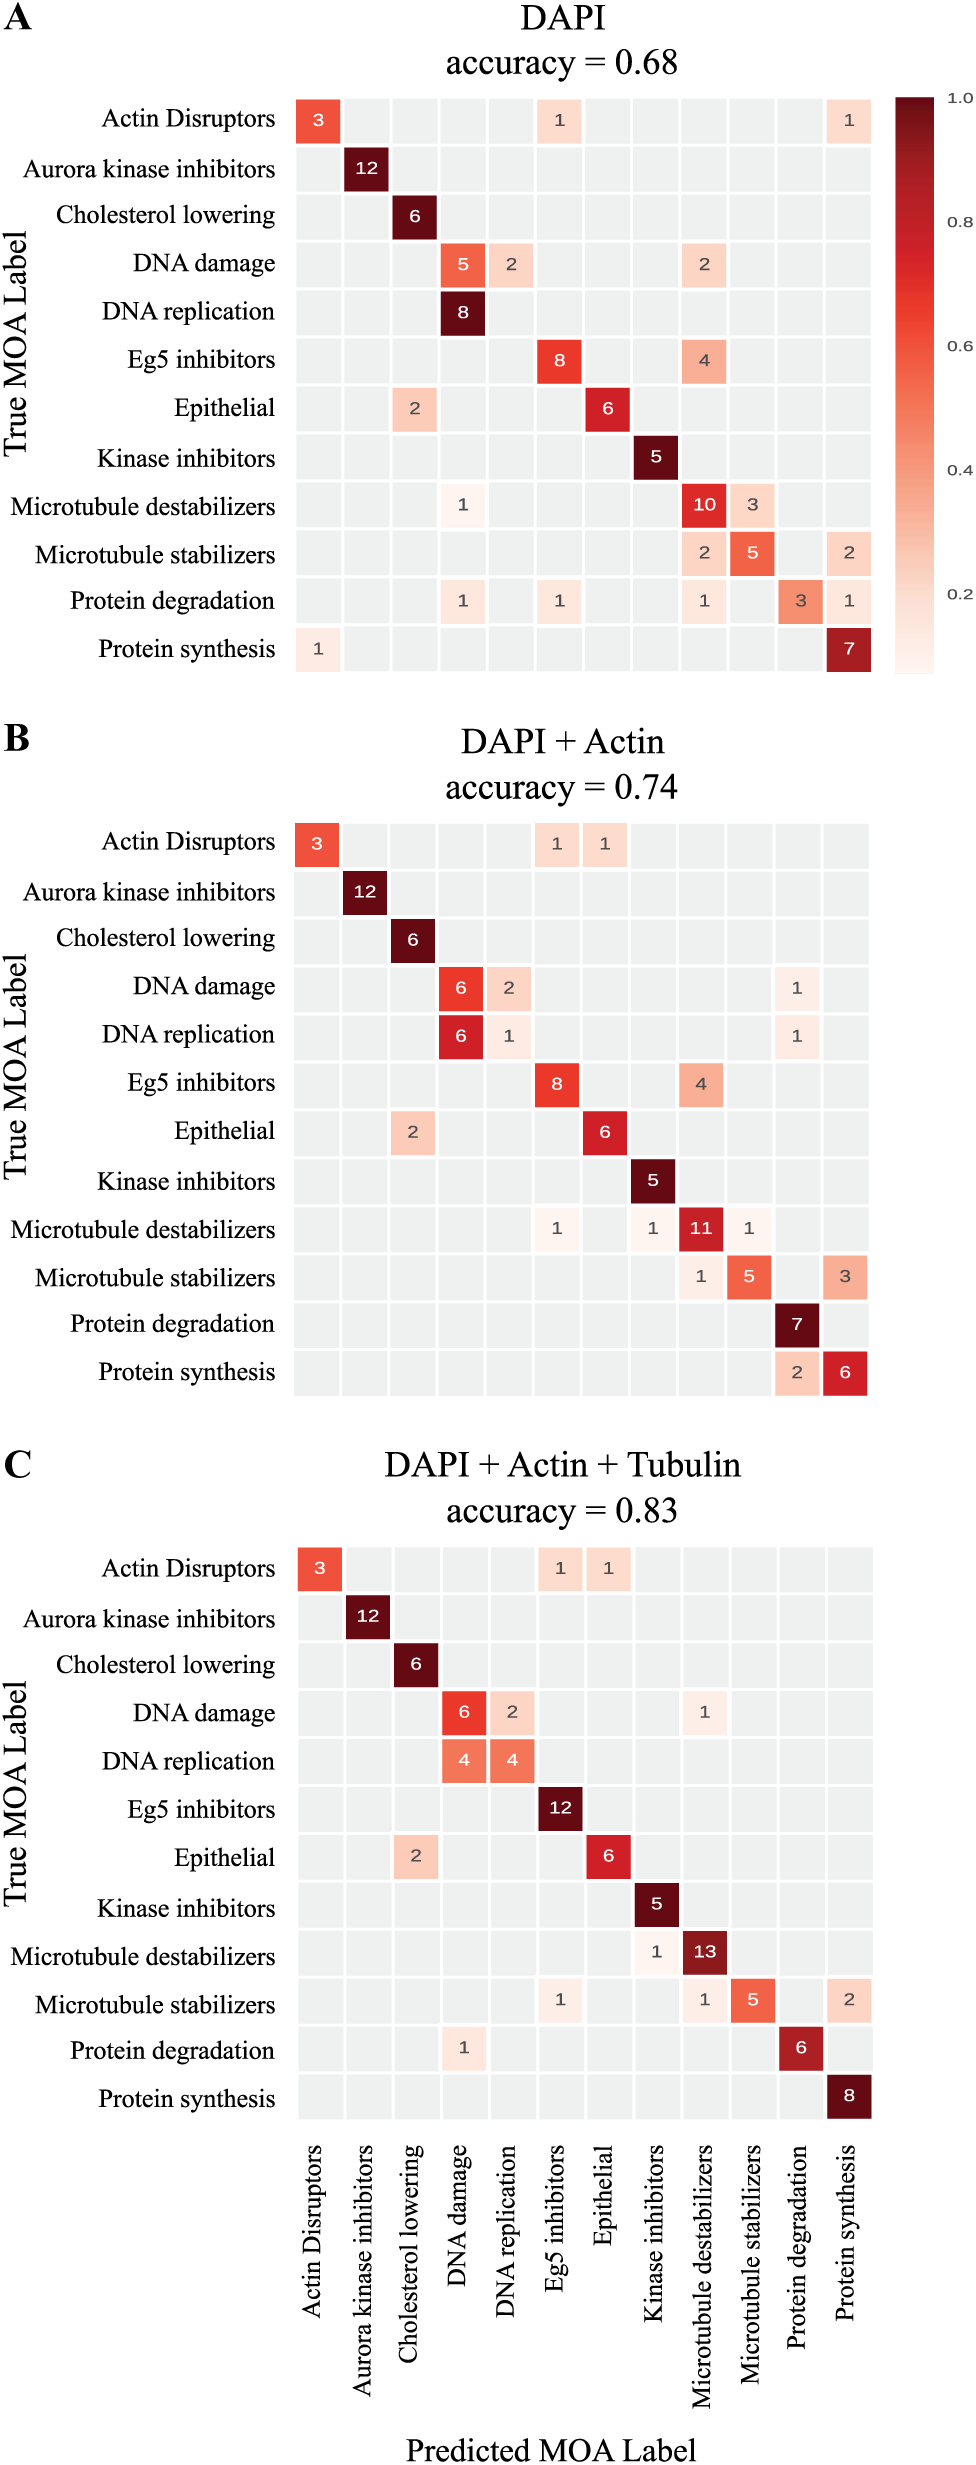
Combining fluorescent markers does not significantly improve MOA prediction accuracy. The above confusion matrices for MOA prediction were obtained using a leave-one-out cross-validation approach. The results are based on features from (
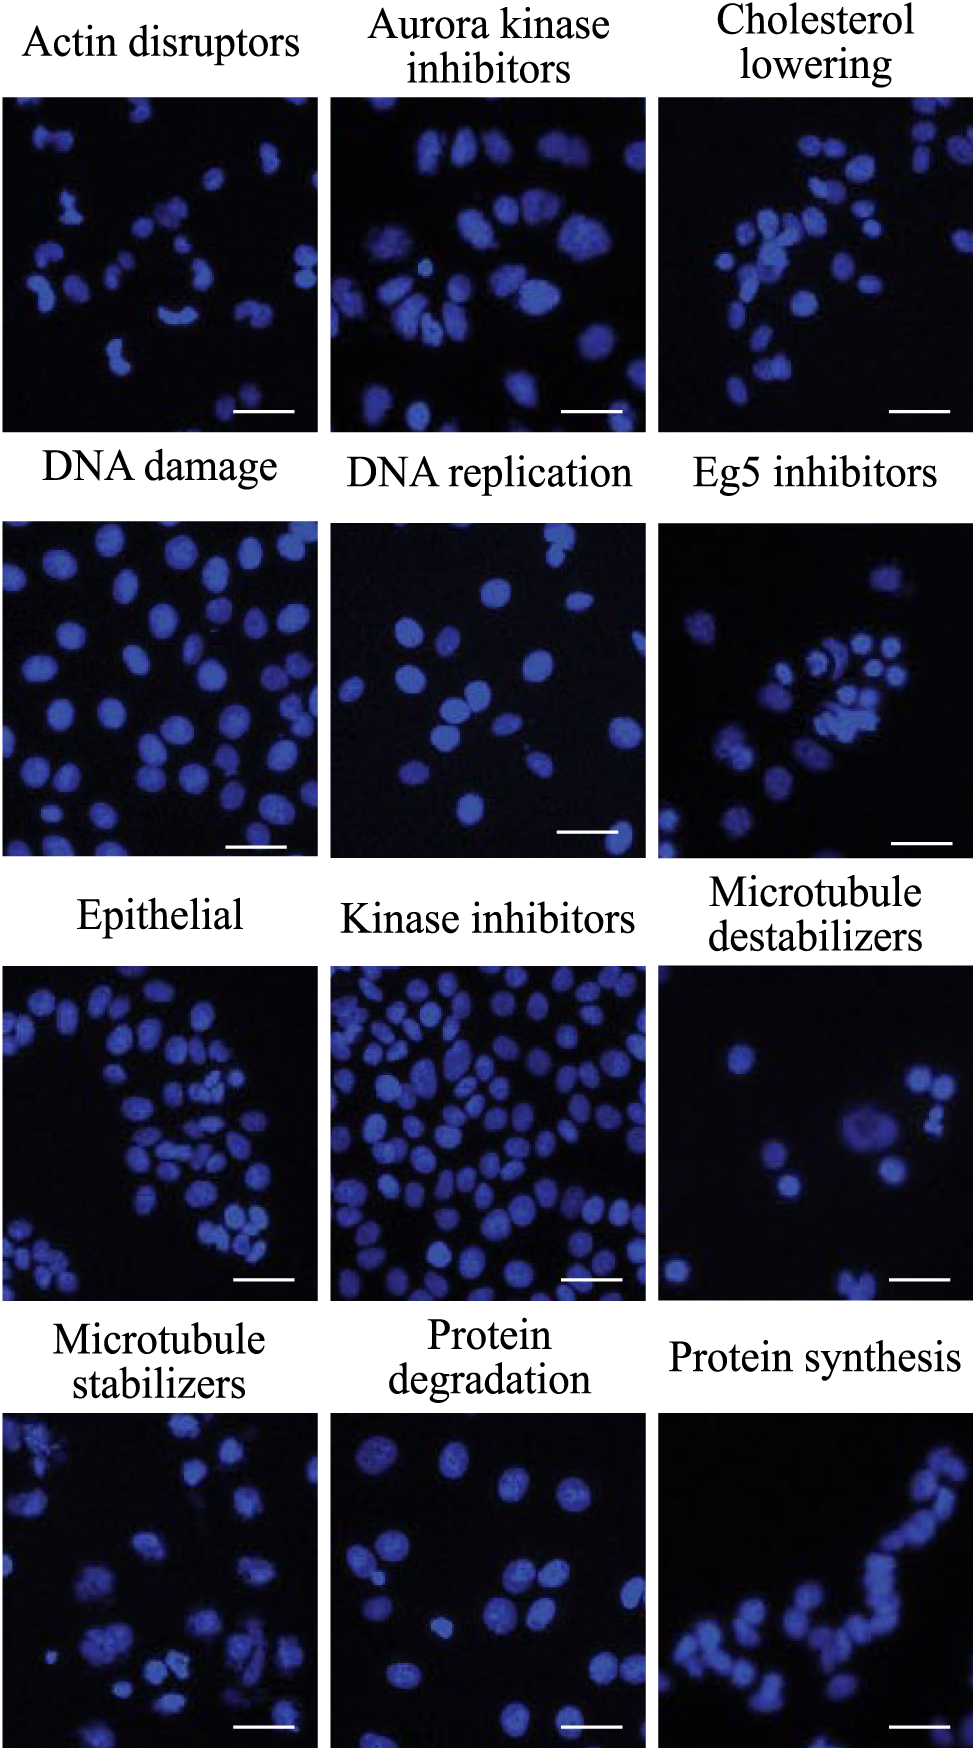
Some MOAs can be distinguished by eye using DNA only. Selected images from each of the 12 MOAs from the BBBC021 dataset. 16 Here, only the DAPI channel is displayed. While it is obviously impossible for the naked eye to precisely sort these images by MOA, differences are clearly discernible in some of the images from the DNA shape and texture. Scale bar, 50 µm.
Combining Cell Lines Improves Target Prediction
We reused image sets of screens already performed by the Biophenics platform at the Curie Institute (Paris, France). They included nine patient-derived malignant pleural mesothelioma cell lines and one prostate cancer cell line. We selected those screens mainly because they were all performed with the Prestwick library. This library is a commercially available collection of 1200 Food and Drug Administration (FDA) and European Medicines Agency (EMA) approved drugs that have been extensively studied and for which we could retrieve the known targets through the ChemBank and DrugBank online databases (see Material and Methods). After removing the gene targets for which we had only one corresponding drug or not enough information, we ended with a total of 614 compounds targeting 113 gene products. We then used a similar image analysis pipeline as in Ljosa et al., 10 where cells were individually detected, and then features were computed per cell on all available markers (which consisted of DNA only for 9 of the 10 cell lines). Furthermore, mean vector profiles were computed for each sample treatment, that is, per well. We then performed independent trainings of one random forest classifier per cell line and combined the results of all classifiers by soft voting, obtaining a score per target for each compound. We subsequently performed a leave-one-compound-out cross-validation procedure to test the accuracy of our approach in correctly predicting the target of any of the 614 compounds. Figure 3 shows that the prediction accuracy level is cell line dependent: some cell lines can predict more targets than others. Figure 3 also demonstrates that prediction accuracy increases with the number of combined cell lines. Altogether, these results show that each cell line brings its share of information, which, when properly combined, can lead to an overall increase of accuracy of the drug target prediction.
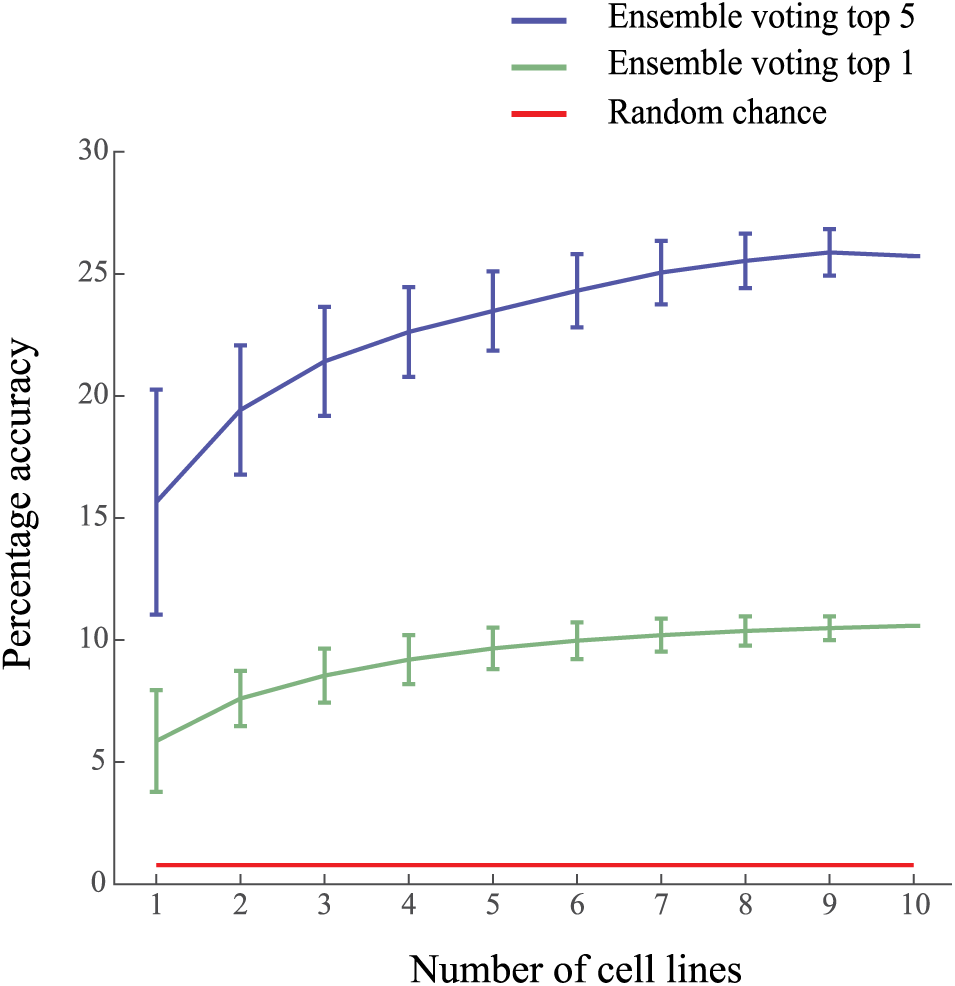
Combining simple assays gradually improves the accuracy of target prediction. Plot showing the accuracy obtained using an increasing number of cell lines for classification. The predicted target for one compound is based on an ensemble classifier trained on 1–10 cell lines. The accuracy is obtained using a leave-one-out cross-validation procedure. Error bars represents standard deviation. The error bar obtained for a single cell line shows that accuracy is cell line dependent; some cell lines, when taken alone, are more predictive than others. For each compound, the ensemble classifier outputs a vector where each value represents the probability of association with a target. The top 1 voting outputs the target corresponding to the mode of this probability vector; the predicted target is then compared with the ground-truth target to determine the accuracy (green line). The top 5 voting outputs the five most probable targets according to the ensemble classifier; the prediction is considered correct when the ground-truth target is present in the top 5 (blue line). These predictions should be compared with the probability to predict the correct target at random, which is 0.09% – 1 over 113, the number of considered targets. Our approach, using 10 random cell lines, achieves 25% accuracy of molecular target prediction out of 113 targets with the top 5 prediction method (blue curve). These results are obtained for 10 cell lines, 614 compounds, and 113 targets.
Discussion
Using several markers can be useful in a typical HCS assay. Doing so enables protein colocalization to be visualized and specific morphological response to perturbations to be monitored by extracting dedicated features. For instance, it is useful to measure the nuclear translocation of a protein, or a G-protein-coupled receptor (GPCR) internalization. Intuitively, it was reasonable to hypothesize that capturing the general state of the cell would also be better achieved by multiplexing several dyes to monitor principal cellular components, such as endoplasmic reticulum, mitochondria, microtubules, or the actin network, as done in cell painting assays. 12 However, we demonstrated in the Results section that, unexpectedly, increasing the number of fluorescent markers did not substantially improve MOA prediction, as DNA alone seemed to closely characterize directly or indirectly the general state of the cell ( Fig. 2 ). Strikingly, the first confusion matrix ( Fig. 1A ) also shows that even MOAs related to cytoskeleton (actin disruptors, microtubule stabilizers, or destabilizers) or other cytoplasmic pathways (protein degradation and cholesterol lowering) could be correctly predicted by DNA staining alone. It was not possible to test yet whether a component other than DNA could be as or more informative on its own because all features computed on other markers depend on DNA staining, which is used to initiate the cell detection algorithm. These results led to the conclusion that DNA shape, texture, and intensity features capture variations similar to those of most other cell components because all these components are interconnected and react together in a perturbation-specific way. In other words, a substantial relationship exists between such global markers, and increasing their amount does not necessarily add significant information for the general task of predicting the MOA or the target of an unknown drug.
This observation, combined with the fact that the number of markers that can simultaneously be imaged is technically limited, led to the idea that instead of using multiple dyes on a single cell line, it could be more relevant to use multiple cell lines with few markers. Furthermore, this is precisely the type of screen that can be abundantly found in the screening history of a typical high-throughput platform facility. Accordingly, we gathered data to test this idea. The Results section and Figure 3 describe how combining a random set of 10 cell-based image assays with few markers can reach better relative accuracy than previously observed using a more complex setup. Indeed, in Figure 3 , an accuracy 11.3 times better than random is reached (with a value of 0.10 for 113 genes), while Ljosa et al. 10 obtained an accuracy 9.96 times better than random (with a value of 0.83 for 12 MOAs), reproduced in Figure 1C .
These results suggested that using multiple cell lines instead of one is more relevant biologically to predict a drug target association. This suggestion matches with the fact that, while highly variable, any given human cell line expresses on average a third of the human genes. 19 As a consequence, even with a known high affinity, a molecule cannot be found to bind to a gene product in cells where this gene is not expressed. Therefore, scanning a larger set of expressed genes through various cell lines would rationally increase the chances of uncovering an existing link between a drug and its target. Using multiple cell lines with simple markers instead of multiple dyes on a single cell line is not only more biologically relevant, but also technically sound, as the number of cell lines that can be added, in opposition to dyes, is virtually unlimited.
Multiplying cell lines would also be practical, as no additional experimental work would be required because past screens can be used as a training set. Typically, most assays performed on an HCS platform only aim to measure a specific phenotype variation, along with the cell count as a measure of toxicity. 20 This cell count is typically based on nucleus staining. Such simple assays are usually cheap, and therefore abundantly available across research institutes and hospital screening facilities. Some previous work described methods where data from high-throughput screening assays stored on PubChem were aggregated to build compound biological fingerprints. 21 They were notably used for biological hit extension by phenotype similarity. However, that approach would not allow us to obtain information on previously uncharacterized compounds that are newly tested. In our approach, we focus on predicting the functions of drugs in order to prioritize a list of hits from HCS assays. We developed a machine learning framework that constructs a classifier from weak learners, each trained on individual assays. As random forest classifiers are independently trained on each assay, our approach can straightforwardly combine assays with a very different nature, number of markers, and quantitative features. In practice, an optimal set of cell lines could be first identified from the past screens of a facility as producing the best ensemble classifier (see the training part in Fig. 4 ); the only requirement is that all those screens use the same library of compounds for which the molecular actions are known. Ideally, the library would include compounds acting on most (if not all) known druggable targets. Prioritizing 200 previously uncharacterized compounds from a new HCS campaign would then consist of thawing cells from the selected cell lines and treating them with the 200 compounds to be characterized (see the application part in Fig. 4 ). Once image analysis and normalization of the features are performed ( Fig. 4B,C,F ), the classifier trained on past assays would produce a vector of scores for each of the 200 drugs, indicating what gene is most likely to be targeted ( Fig. 4G,H ).
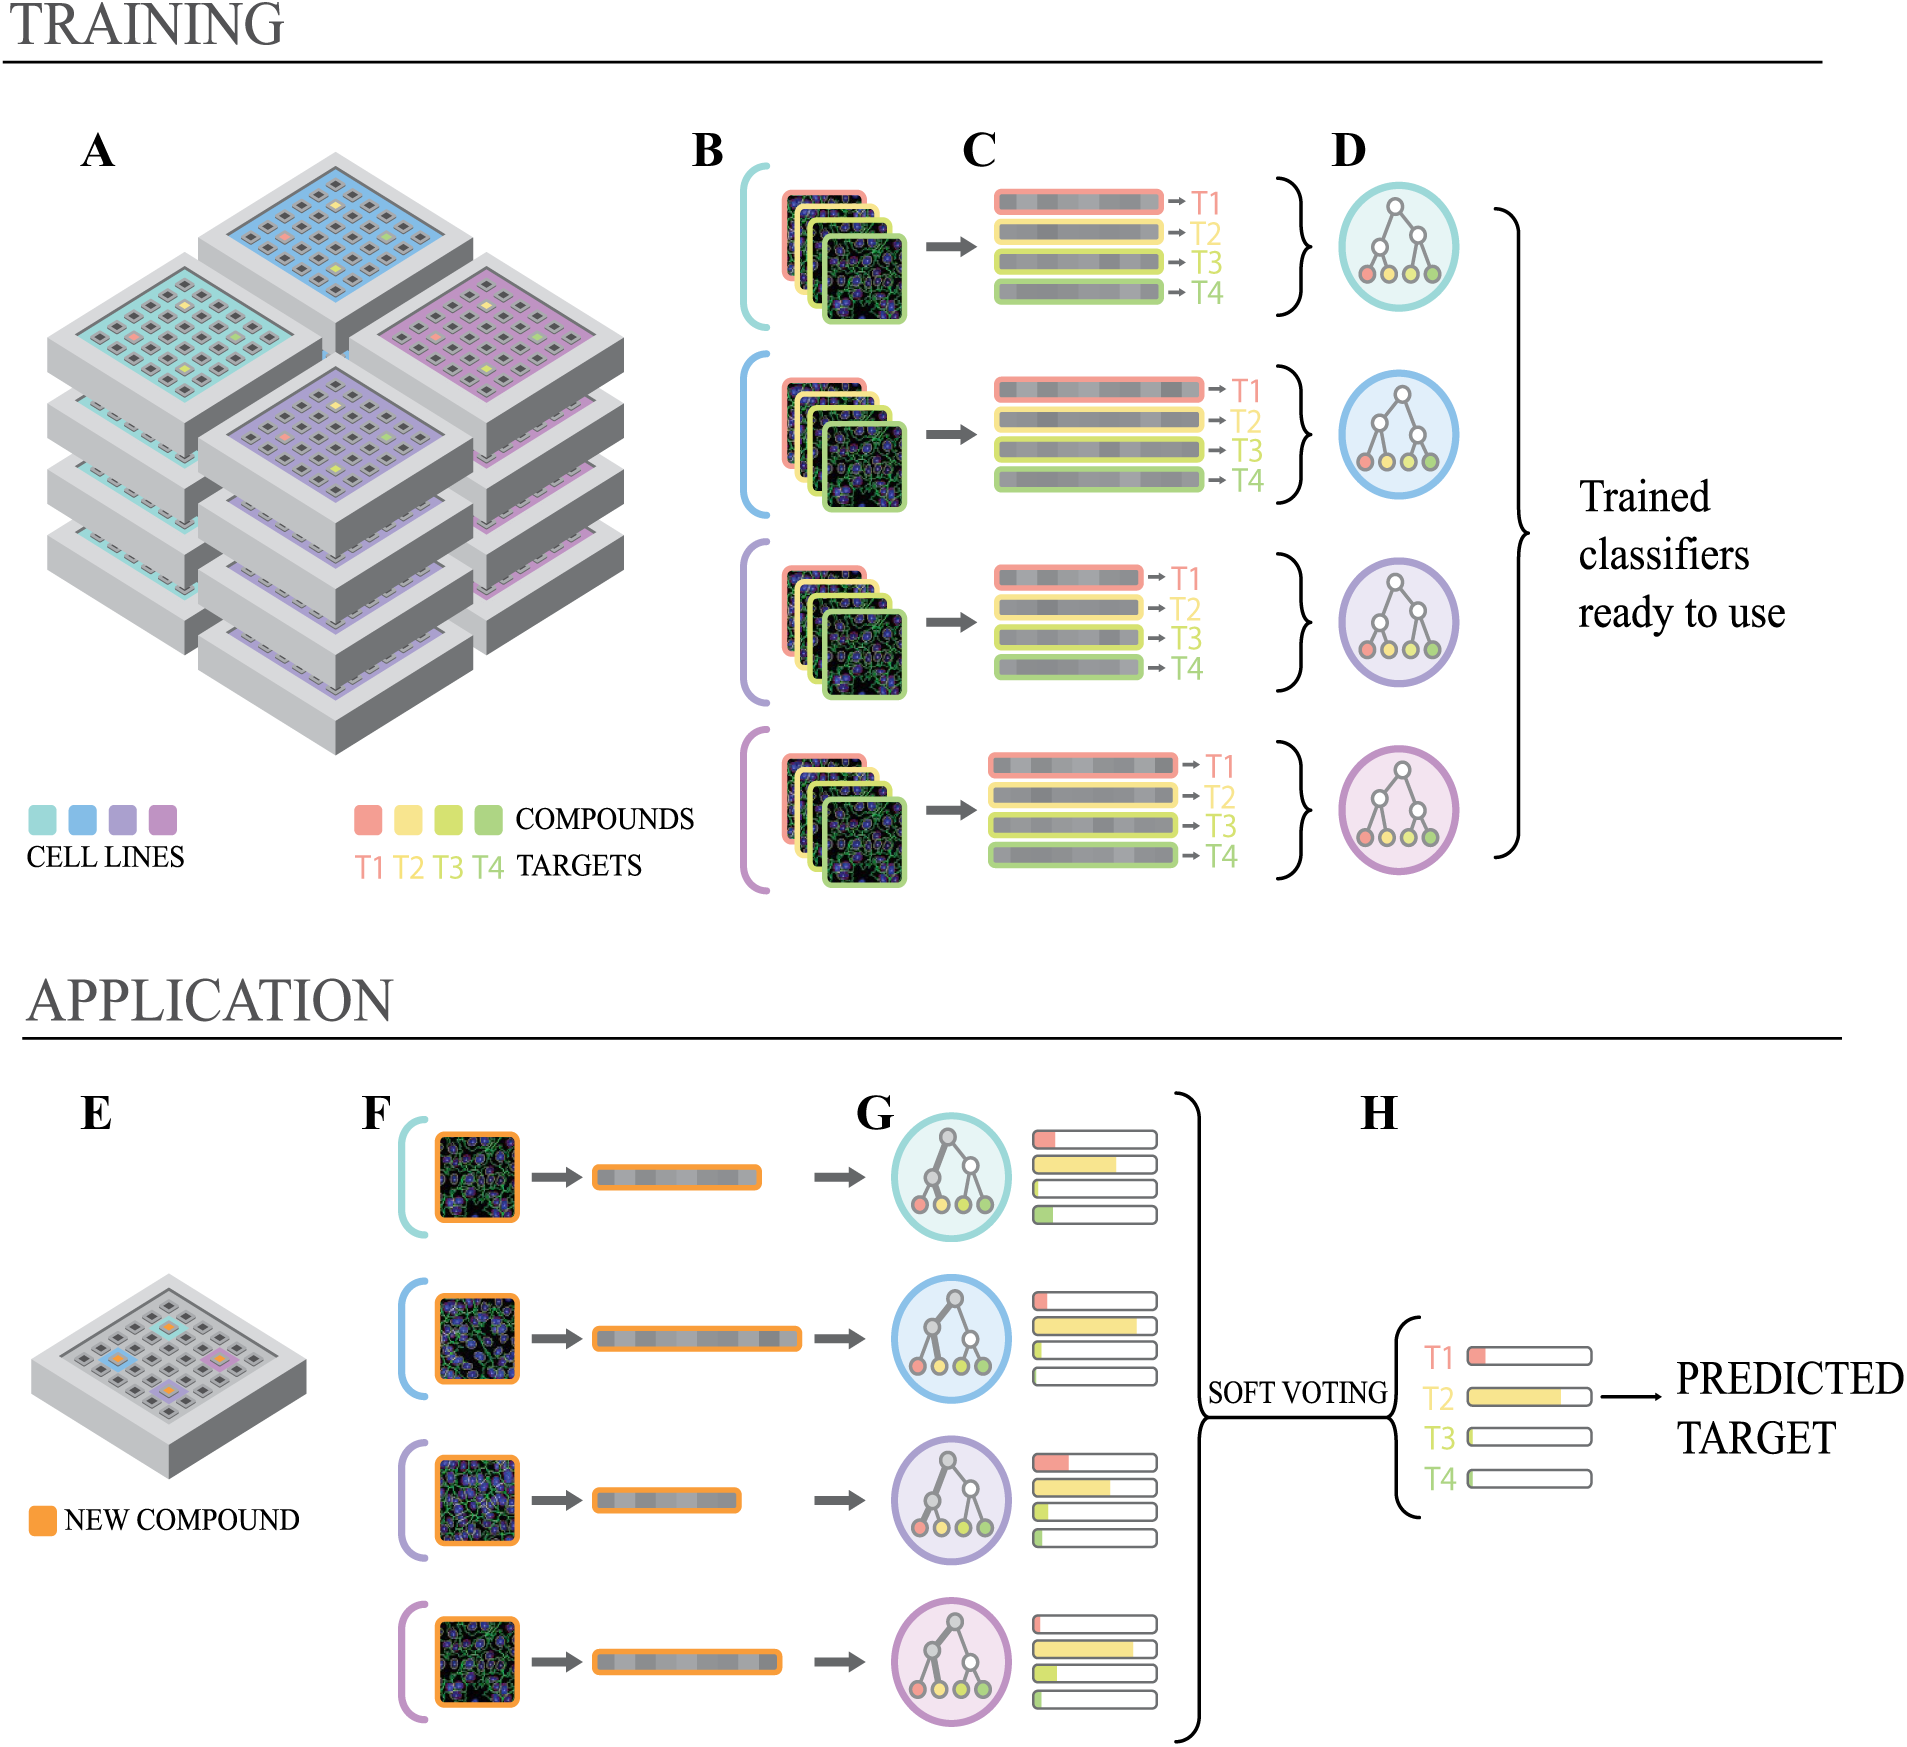
Using past screens for target prediction in practice. (
The presented results demonstrate that each cell line brings its bit of additional information that incrementally increases the overall accuracy of drug target prediction. However, there is probably much room for improvement, as 9 out of the 10 cell lines we used were very similar to each other. Those nine cell lines were tumor cells of the same cancer, albeit derived from different patients. Our intuition is that a more diverse set of cell lines corresponding to various tissues would expose a wider range of expression profiles and could possibly largely improve the accuracy of our ensemble classifier. Also, these nine cell lines, in opposition to the remaining prostate cancer cells, were stained with Hoechst only. While we demonstrated that multiplexing global component markers like actin and tubulin may not be very useful, marker labeling for disease model-specific proteins may in turn contribute to characterize some drug–target interactions. These observations lead to the conclusion that the selection of assays could largely be improved and optimized to maximize accuracy.
An orthogonal track of improvement would consist of considering not only one target corresponding to the best score, but also a set of genes corresponding to the highest scores to identify the pathways targeted by the drug. Indeed, in practice, this approach would be more efficient for two reasons. First, Figure 3 shows that the chances of finding the target in the five best scores jump to 25% accuracy for 113 targets. Therefore, performing a pathway enrichment analysis may end up being more informative than simply hoping for the efficacy target to get the highest score. Second, it would allow us to identify the pathway targeted by a drug, even if the actual drug’s target gene was not part of the training set. The latter is particularly compelling since it would typically be the case for a drug that would bind to a yet uncharacterized target.
In this article, we demonstrated that a common and inexpensive marker, such as Hoechst 33342 or DAPI, labeling DNA, provides unexpectedly rich information on the general state of the cell. We then hypothesized that combining a set of simple past screens could be more efficient to predict the drug target than combining markers in a single assay. We described this approach as not only more relevant biologically and technically, but also applicable in practice to prioritize a list of previously uncharacterized compounds. From this very preliminary proof of concept, we envision two tracks of improvement to be able to claim general applicability of our approach. First, a more diverse combination of cell lines should definitely be selected to expose a larger set of expressed gene products. Second, a set of top-scoring genes could be considered, rather than only the gene corresponding to the best score, in order to robustly recover the targeted pathways. Altogether, we predict that combining simple past assays of an HCS facility could offer a powerful way to prioritize phenotypic hits and alleviate one of the major bottlenecks of phenotypic drug discovery.
Footnotes
Acknowledgements
The authors would like to thank Didier Jean for providing the nine cell lines used for the mesothelioma screens, and Adele Soria, Aurianne Lescure, and Sarah Tessier for their screening technical assistance. We also thank Shantanu Singh, Vebjorn Ljosa, and Anne Carpenter for helpful discussions; Mary Ann Letellier and Don D. Nguyen for valuable comments on the manuscript; and Felipe Delestro from the Bioinformatics Platform of IBENS for the conception and design of the figures.
Declaration of Conflicting Interests
The authors declared no potential conflicts of interest with respect to the research, authorship, and/or publication of this article.
Funding
The authors disclosed receipt of the following financial support for the research, authorship, and/or publication of this article: This work has received support under the program “Investissements d’Avenir” launched by the French Government and implemented by ANR with the references ANR–10–LABX–54 MEMOLIFE and ANR–10–IDEX–0001–02 PSL* Research University. Prostate screening was supported by the grant INCAPAIR PROSTATE program n2010-1-PRO-03 from the French National Institute of Cancer.