
Abstract
Adoption of spheroids within high-content screening (HCS) has lagged behind high-throughput screening (HTS) due to issues with running complex assays on large three-dimensional (3D) structures.
To enable multiplexed imaging and analysis of spheroids, different cancer cell lines were grown in 3D on micropatterned 96-well plates with automated production of nine uniform spheroids per well. Spheroids achieve diameters of up to 600 µm, and reproducibility was experimentally validated (interwell and interplate CVdiameter <5%). Biphoton imaging confirmed that micropatterned spheroids exhibit characteristic cell heterogeneity with distinct microregions. Furthermore, central necrosis appears at a consistent spheroid size, suggesting standardized growth.
Using three reference compounds (fluorouracil, irinotecan, and staurosporine), we validated HT-29 micropatterned spheroids on an HCS platform, benchmarking against hanging-drop spheroids. Spheroid formation and imaging in a single plate accelerate assay workflow, and fixed positioning prevents structures from overlapping or sticking to the well wall, augmenting image processing reliability. Furthermore, multiple spheroids per well increase the statistical confidence sufficiently to discriminate compound mechanisms of action and generate EC50 values for endpoints of cell death, architectural change, and size within a single-pass read. Higher quality data and a more efficient HCS work chain should encourage integration of micropatterned spheroid models within fundamental research and drug discovery applications.
Introduction
Described since the 1940s, spheroids are simple but relevant three-dimensional (3D) models and the most common 3D in vitro culture method in use even today. Spheroids can recapitulate small nonvascularized tumors, mime aspects of early development in the form of embryoid bodies, and serve as tissue organoid surrogates. The increased or decreased sensitivity of spheroids to drugs compared to 2D cell monolayers provides important information for extrapolation of activity in vivo, and spheroids are therefore recommended as mandatory models for drug-screening programs. 1
Spheroids can be formed under anchorage-independent or -dependent conditions. For both techniques, homemade and commercial products exist that allow high-throughput generation of spheroids in a format amenable with microplate readers providing whole-well average readouts of cell viability.2–4 Recent progress in specialized imaging cytometers and the analysis of phase contrast images has opened up multiplexing of plate assays with high-throughput low-resolution microscopy of spheroids, providing complementary simple endpoints concerning spheroid numbers and size.5–7 As yet, however, spheroids have been rarely used in multiparametric high-content screening (HCS) campaigns, the only strategy that can provide functional insights into the spatial pattern of response within individual spheroids and an understanding of the mechanisms that underlie response (
To take full advantage of spheroids in HCS, three main obstacles need to be overcome while providing sufficient throughput: implementation into an industrial setting; control of spheroid shape and size heterogeneity; and staining, imaging, and analysis of thick structures. Fluorescent signals from spheroids can be challenging to quantify due to depth-dependent light scattering that attenuates intensity. Depending on their size and compactness, whole spheroids are also largely impenetrable to antibodies. Progress in emerging concepts such as methods to increase tissue transparency, physical expansion of the specimen itself (expansion microscopy), nanoprobes that diffuse into thick structures, new imaging instrumentation, and analytical platforms are succeeding in extending the depth, resolution, content, and speed of imaging of 3D structures.8–12 There remain, however, a number of basic practical issues hindering mainstream adoption of spheroids in HCS related to difficulties of standardizing heterogeneous structures, compatibility with automated setup, staining of floating structures, imprecise identification of multiple spheroids per well, or necessary trade-offs in data sampling (statistics) in the case of single spheroids per well. In addition, high-content fluorescence microscopy necessitates flat optical-grade glass-bottomed plates, ruling out spheroid formation in round-bottomed wells.
Reproducibility of spheroid size is a critical parameter for achieving a robust HCS and consequential for other reasons, depending on the type of spheroid. Thus, in stem cells, the size of the spheroid influences differentiation potential and trajectories. 13 In the case of proliferative cancer cells, spheroid size along with cell number and density affect the presence of pathophysiological gradients and the formation of specific regions, such as the drug-resistant niche of hypoxic quiescent cells. Heterogeneous spheroids have different sizes of diffusion gradients and therefore vary in their response pattern to the different pharmacokinetics and pharmacodynamics of drug penetration, contributing in turn to the variability and main difficulty of cell-based analyses. 14 Generation of size-controllable uniform spheroids from 100 to 1000 µm is therefore highly desirable for image-based screens.
Engineering equivalently sized spheroids compatible with high throughput and imaging is possible with technological plates such as the microspace compartmentalized wells developed by Kuraray. 15 However, maximum spheroid dimensions are limited to 200×200×100 µm, which does not adequately address clinically relevant treatment deficits such as limited drug penetration and hypoxia in spheroids. Similarly, micropatterned plates commercialized by CosmoBio (Tokyo, Japan) provide 250 spheroids per well in a 384-plate format, but, again, this is limited by its design to small spheroids (100 µm diameter). Furthermore, the high cell density per well may induce spheroids to be hypoxia-positive, even at this size. 16 Other solutions developed by 3D Biomatrix and InSphero based on the hanging-drop cell culture procedure can provide consistent control over spheroids up to 1 mm in diameter. Unfortunately, a delicate transfer step to a receiver plate is required to accommodate stable focusing and microscopic evaluation, risking disaggregation and/or loss of structures.17,18
It is noteworthy that the few HCS articles published using spheroids (
The focus of this study was to help expand the use of spheroids in HCS by filling the unmet need for an easy one-step method adaptable to automated liquid-handling equipment and producing multiple homogeneous image-compatible 3D structures. We present and describe the advantages of the OncoSpheres system for delivering an exact number per well of standardized micropatterned spheroids in a narrow focal plane—a format well adapted for drug discovery HCS campaigns.
Materials and Methods
Reagents
Cell lines and cultivation
All cell lines were of human origin, and they were purchased from the American Type Culture Collection (ATCC, Manassas, VA) or the German Collection of Microorganisms and Cell Cultures (DSMZ, Braunschweig, Germany). Cell lines were cultivated as per ATCC or DSMZ instructions with 0.5% penicillin/streptomycin in the medium and at 37 °C in a humidified atmosphere containing 5% CO2.
Formation of Spheroids (Manual and Automated Production) and Establishment of Reference Growth Curves
For the production of spheroids, 96-well micropatterned plates with a Society for Biomolecular Screening (SBS) footprint and black/glass bottoms were used (CYTOO, Grenoble, France). For each cell line, initial optimization experiments were performed manually to define the preferred protein coating substrate (collagen I, laminin, or fibronectin) for cellular adherence to micropatterns, cell seeding density, day of washing, and medium renewal. Wells were prefilled with 50 µl of prewarmed growth medium and incubated at 37 °C during trypsinization and counting of cell lines. For HT-29 spheroids, 50,000 cells per well were seeded in 50 µl of medium and placed in the incubator for attachment to micropatterns. After 24–72 h, cells not attached to micropatterns were removed in a washing step by taking out 100 µl of medium and flushing the well with 200 µl of fresh growth medium with pipetting against the two opposite walls of the well. 200 µl of fully complemented medium was added. This step was performed sequentially, column by column. Finally, the plate was returned to the incubator for continuation of spheroid growth. Medium was exchanged every 48–72 h during the first 8 days and then every day to prevent medium deprivation and encourage continuous spheroid growth.
Automated cell seeding, washing, and medium renewal were performed using a Freedom EVO 150 workstation (Tecan, Männedorf, Switzerland) configured with a multichannel pipetting system with 96-well capabilities. The operating software was used to group pipetting and device commands into scripts, creating specific programs used in this work. The protocol for automated washing of spheroids was adapted from the manual procedure as follows. Tips were aligned sequentially in four positions against the border of the well (at 0°, 90°, 180°, and 270°), and slow aspiration and dispense rates of 20 µl/s used. For a cycle of washing, medium was first taken out, and 200 µl of fresh prewarmed growth medium was added, aspirated, and rejected in the four defined positions two times. This wash cycle was repeated three consecutive times to remove all nonadhered HT-29 cells from the well. After the final addition of 200 µl of growth medium, plates were returned to the incubator. Depending on the cell line, a second washing step was performed at 96 h with more vigorous aspiration–dispense rates of 200 µl/s. Use of phosphate buffered saline (PBS) instead of medium during the flushing steps can further help clean up non-micropatterned cells from the well and borders. Reference growth curves were constructed by pooling spheroid growth data from five to nine different experiments and a linear correlation extrapolated using Excel.
Time Lapse Microscopy and Bright-Field Image Analysis of Micropatterned Spheroids in 96-Well Plates
For growth determination, time lapse images were acquired every 2 days at 10× magnification for 21 days using a DMI6000 inverted microscope equipped with a light-emitting diode (LED) transmitted light illuminator and environmental control incubator (Leica, Wetzlar, Germany). Between each acquisition, the 96-well plate containing the spheroids was kept in a cell culture incubator. Images were subsequently imported, assembled, and analyzed automatically using a software suite of tools developed in-house called CYTOOls, which is integrated into the open-source ImageJ framework as a plug-in. 24 More specifically, the tool named Spheroid Analyzer is dedicated to growth determination, handles bright-field and phase contrast images, and extracts the number of spheroids per well, measures of size, and morphological parameters. Data output from the plug-in were analyzed in Excel. Offered as a lower throughput alternative for spheroid analysis, Spheroid Analyzer is freely available on request for research use only via the CYTOO website: https://cytoo.com/contact-us.
Spheroid Staining and Multiphoton Microscopy
HT-29 spheroids were characterized at different stages of growth by multiphoton imaging carried out on an upright, two-photon, laser-scanning LSM 7 MP microscope (Zeiss, Jena, Germany) equipped with a water immersion 20× objective [numerical aperture (NA) 1.0; Zeiss] and a tunable titanium–sapphire laser (680–1080 nm; Chameleon Ultra II, Coherent, Santa Clara, CA). Spheroids were fixed for 1–2 h in formalin (Sigma-Aldrich, St. Louis, MO) and stained with Hoechst 33342 (Life Technologies, Carlsbad, CA) in PBS solution containing 0.1% Triton-X100 (Sigma-Aldrich) for 2 h. Fluorescence emission was detected by a photomultiplier tube with a 492/sp25 nm filter (Semrock, Rochester, NY). For visualization of the necrotic center, sulphorhodamine B (SRB; Sigma-Aldrich) was added to the medium of live spheroids at 100 µM, and images were obtained with excitation at 800 nm. Images were mounted using ImageJ. Spheroid height could be estimated from images due to the strong backscattering of light reflected from the glass bottom, indicating the base of the spheroid.
Spheroid Dissociation and Viability Testing
HT-29 spheroids were cultured over 21 days and, at different time intervals, dissociated and counted by the following procedure. Spheroids were rinsed with PBS (Ca2+ and Mg2+ free) and harvested in the well by incubation with accutase at 37 °C for 20 min, followed by mechanical dissociation with a blue (1 ml) tip and micropipette. The cell suspension was diluted with medium, and viable cells were counted manually by selecting for cells that are bright and retractile under phase contrast. Cell viability was also measured with the CellTiter-Glo (CTG, Promega, Madison, WI) luminescent assay following the manufacturer’s instructions. Samples were transferred into 96-well white-walled assay plates (Greiner Bio-One, Frickenhausen, Germany), and luminescence measurements recorded on a microplate reader (BioTek, France).
Drug Exposure and Dose–Response Experiments
5-Fluorouracil (5-FU), irinotecan, and staurosporine were purchased from Sigma-Aldrich. Compounds were added once the spheroids had reached logarithmic growth and a spheroid diameter of 300–340 µm. Drugs were applied for 72 h in triplicate wells at seven different concentrations in semi-log. The dilution series was prepared in culture medium from 300 mM concentrated stocks in DMSO for 5-FU and irinotecan and 10 mM stock for staurosporine. Compounds were tested at 0.1–100 µM for 5-FU and irinotecan and 0.01–10 µM for staurosporine. Treated spheroids were compared in parallel to six negative control wells containing 0.1% DMSO and six control wells containing just medium on the same plate. To avoid edge effects, the outer wells were excluded from analysis.
Live Spheroid Staining and High-Content Image Analysis
We chose to use a protocol that includes all cells in the analysis. Alternatively, dead cells can be easily washed out from the bottom of wells by exchanging the media before labeling of spheroids. To avoid dislodging drug-treated spheroids and dead or dying cells due to spheroid dissociation as an effect of drug treatment, Hoechst 33342 (ex/em 361/486 nm; Life Technologies) and propidium iodide (PI) (ex/em 536/617 nm; Sigma-Aldrich) were added directly to live spheroids overnight at 16.2 nM and for 2 h at 0.9 µM, respectively. At these low nontoxic concentrations, clear staining of spheroids with no background is obtained and washing steps to remove surplus dye can be avoided. Other fluorescent probes have also been used to stain spheroids in this system, including Calcein AM (ex/em; 504/523; Sigma-Aldrich) added at a final concentration of 0.2 µM for up to 2 h and SYTOX Green (ex/em 504/523 nm; Life Technologies) incubated overnight at 0.2 µM.
Bright-field and fluorescent images were captured with the Operetta imaging platform (PerkinElmer, Waltham, MA) using a 2×, 0.08 NA, 6.2 mm working distance objective. Acquisition parameters were based on optimal excitation and emission wavelengths of the fluorescence probes. Images were analyzed with a script developed using Acapella software (PerkinElmer). Size and morphological features (diameter, area, and roundness) were determined based on object identification of bright-field or Hoechst 33342 stained structures. The image analysis algorithm also quantifies cytotoxicity across the whole spheroid or in specific regions of the spheroid using the total or average PI fluorescent intensity, providing information about levels of cell death. To assess peripheral spheroid fluorescence, a peripheral mask (ring) was derived by eroding the original segmented object by 3 µm to minimize overlap with the PI-positive necrotic center. Data can be accessed on a per-spheroid basis, creating multiple results per well, and as a global well average of nine spheroids.
Statistics
Unless otherwise indicated, n values refer to the number of wells dedicated to an experimental condition from a 96-well plate. All growth kinetic graphs are presented as the mean and the standard deviation (SD) and are representative of two or more experiments. Dose–response curves were fitted using Prism v.5 software (GraphPad Software, La Jolla, CA) using the equation for a four-parameter sigmoidal dose response with variable slope. For EC50 determinations, each compound data point is the average of three wells representing data points from a total of 27 spheroids. Signal-to-noise ratio (SNR), signal-to-background ratio (SBR), and coefficient of variation (CV%) were calculated from the means of three maximum effect treated wells and six control wells according to standard formula. Standard acceptance criteria are set at SNR >10, SBR >2, and CV% <20.
Results and Discussion
Miniaturization of Micropatterned Spheroid Formation and Growth
Large spheroids (0.3–1 mm) are the most technically challenging to establish and assay in a way that adequately addresses clinically relevant drug delivery efficiency. To support an HCS approach, we decided to validate the use of micropatterns for the production of uniform biorelevant cancer microtissues in a 96-well (6.3 mm well diameter) format. The use of micropatterns that provide a controllable microenvironment for spheroid growth has been investigated in the past, but in 55 mm Petri dish format only. 25 Preliminary experiments investigated the effects of micropattern geometry, diameter, pitch, and cell-seeding density on HT-29 spheroid growth dynamics and size. Based on these initial results, a specific micropatterned 96-well plate was designed in which the dimensions and arrangement of the micropatterns addressed issues of (1) spheroid size heterogeneity, (2) the undesired detachment of spheroids during wash procedures or long-term growth, (3) spheroids touching and growing into one another as they expand, and (4) overcrowding that prevents optimal growth conditions for the production of large spheroids. This optimized OncoSpheres design resulted in HT-29 spheroids reaching diameters as large as 613 µm (SD ±39) within 20 days, as illustrated in Figure 1A .
Growth kinetics of HT-29 spheroids manually cultured on micropatterns in 96-well plates. (
We next predicted the number of viable cells within HT-29 spheroids at different stages of growth by dissociating and counting the cells. The graph ( Fig. 1B ) clearly shows that for healthy spheroids with diameters larger than the range of 200–500 µm, size is directly proportional to the number of viable cells within a spheroid, indicating that proliferation rates remain linear over the time of culture. This correlation was further validated using the CTG luminescent viability assay ( Fig. 1C ). Thus, beneficial culture conditions combined with an ideal micropattern design can support sustained growth of fast-proliferating cancer cells, potentially favoring a natural installation of metabolic gradients within large spheroids in a 96-well format.
To demonstrate the versatility of the micropatterned spheroid formation system, other cancer cell lines were cultured as tumor spheroids. As for other spheroid production techniques, differences exist with regard to the ability of various cell lines to form classical compact spheroids, depending on the degree of cell–cell interactions that affect spheroid tightness and overall morphology. Thus, HCT-116 colon cancer cells and T-47D breast cancer cells ( Fig. 1D ) developed dense and compact spheroids, as did HT-29 cells. In contrast and in agreement with Kenny et al., 26 other cell lines loosely aggregated with an irregular surface, forming mass (MCF-7) or stellate-like architectures (MDA-MB-231), whereas others lacking aggregation capacity (A549 and HeLa) exhibited expansion outside of the micropattern area ( Fig. 1D ). As reported by others, 6 addition of 2.5–5% Matrigel that provides extracellular matrix signaling helped to induce compaction of some aggregates such as T-47D (data not shown) and, in our experience, is sufficiently dilute as to not interfere with automation. Finally, we have also exploited micropatterns for shipment and transfer of intact spheroids in pre-prepared 96-well plates to other sites for subsequent drug treatment, imaging, and analysis (data not shown).
Characterization of Standardized Micropatterned Spheroids in 3D
To be a relevant model of in vivo avascular microtumors, spheroids larger than a certain size must be internally asymmetric, possessing stratified layers of proliferating, quiescent/hypoxic, and dead cells that result from the limited diffusion distance of oxygen and nutrients into the spheroid core. To verify overall spheroid morphology and visualize the interior of micropatterned spheroids, we performed biphoton microscopy. Although photon scattering prevents deep imaging into the spheroid center, it did not prevent estimates of spheroid height above the micropatterned glass surface. A representative 3D reconstruction of a freshly paraformaldehyde fixed and stained HT-29 spheroid of dimensions 400–325 µm is shown in
Figure 2A
. Based on the measurement of several spheroids, we conclude that spheroids grown from the bottom up on micropatterns are spherical, although spheroids of >450 µm diameter in width tend toward a more oblate ellipsoid shape (
Three-dimensional (3D) biphoton imaging of micropatterned HT-29 spheroids. (
Biphoton images of micropatterned HT-29 spheroids also revealed a cell-dense proliferating zone in the surface layers with the presence of mitotic nuclei ( Fig. 2B ). The inner layers showed low Hoechst staining and sparse cells, possibly indicating formation of a necrotic core zone. Addition of SRB, a cell membrane–impermeable hydrophilic anionic protein stain with affinity for basic proteins, directly to live spheroids confirmed the presence of a necrotic core region ( Fig. 2C ). SRB diffusion throughout the spheroid reveals a typical staining of proteins located in the extracellular matrix between cells in the peripheral layers and an accumulation in damaged cells at the central core. Bright hot spots in the viable niche probably correspond to dead cell aggregates. These observations suggest that micropatterned spheroids are models of biological relevance reproducing the internal cellular heterogeneity and pathophysiology conditions that mirror the situation seen for tumor tissue in vivo.
Semiautomated Software for Nondestructive Analysis of Spheroid Growth over Time
Because spheroids are adhered to micropatterns, it is easy to renew the total culture medium multiple times during extended culture periods, allowing chronic exposure to drug candidates and long-term spheroid growth without losing or disrupting structures. Use of cell-adhesive micropatterns has the additional benefit of fixing the location of each spheroid throughout the stages of cell seeding, growth, and treatment, enabling the continuous monitoring and tracking of the same individual spheroids over time, as presented in Figure 3A . To this end, Spheroid Analyzer was developed as part of a software suite of processing tools called CYTOOls to extract and measure spheroid objects on bright-field mounted images at the individual spheroid level, enabling the study of spheroid populations on a well-by-well basis. To overcome difficulties of low contrast, noise, and uneven illumination inherent to bright-field stitched images, a snake algorithm guided by gradient vector flow (GVF) based on a Sobel edge map of the image is used to locate object boundaries. 27 A unique feature made possible only by the existence of the micropatterns is a flexible, user-defined grid of circles that is used for the initialization of the multiple snakes in each well and thus fits with the exact position of the spheroids. Inclusion of this starting indicator element considerably augments the accuracy of object contour definition and decreases the probability of picking up artifacts or debris in the image. Typical size and morphological descriptors are then measured for every identified object in a well and stored in a table, as presented in Figure 3B . Spheroid Analyzer should facilitate screening of micropatterned spheroids within labs that cannot invest in specialized HCS equipment and commercial software.
Sequence of transilluminated microscopy images showing long-term HT-29 spheroid growth and analysis. (
Automated Formation of Consistently Sized Spheroids
Within industry, automation of spheroid formation in a 96-well microtiter format is an important bottleneck determining throughput of spheroid applications. To increase compatibility with automated washing routines and imaging, we optimized the design layout further by removing micropatterns present at the well peripheral edges. This brings the number of micropatterned spheroids to nine centrally placed in the well in the final OncoSpheres design. An automated liquid-handling robot was used for all steps of cell seeding, washing, and feeding to produce multiple uniform spheroids per well (see the Methods section). Among the advantages of the OncoSpheres system is the ease of conducting automated total medium exchange for effective and frequent feeding of spheroids, maximizing metabolic activity and proliferation. In this way, we were able to produce HT-29 and T-47D OncoSpheres achieving sizes equivalent to those of the manual procedure, and with even better homogeneity. Thus, as seen in
Figure 4A
Characterization of OncoSpheres prepared with the liquid-handling robot. (
The standardization of spheroid growth rate and size by micropatterns allowed us to construct reference growth curves for both spheroid cell models, HT-29 (
Fig. 4C
) and T-47D (shown in
Proof-of-Concept High-Content Assay and Quality Control Characteristics
To demonstrate applicability of OncoSpheres to the whole HCS process with multiparametric analysis and the extraction of EC50 values, we used the PerkinElmer Operetta system in wide-field mode with a 2× long working distance objective. Under these conditions, an entire well is acquired in just one image, and a 96-well micropatterned plate in up to four channels takes less than 10 min.
We tested overall dose response of HT-29 OncoSpheres to three reference compounds with different modes of action. Antimetabolite 5-FU and topisomerase I inhibitor irinotecan are standard drugs in the treatment of colon cancer that specifically target proliferating cells particularly during S-phase inducing cell-cycle arrest and apoptosis, although at higher concentrations non-S-phase cells can also be killed. Staurosporine is a nonselective protein kinase inhibitor that also induces apoptosis, and it is not included in standard therapies.
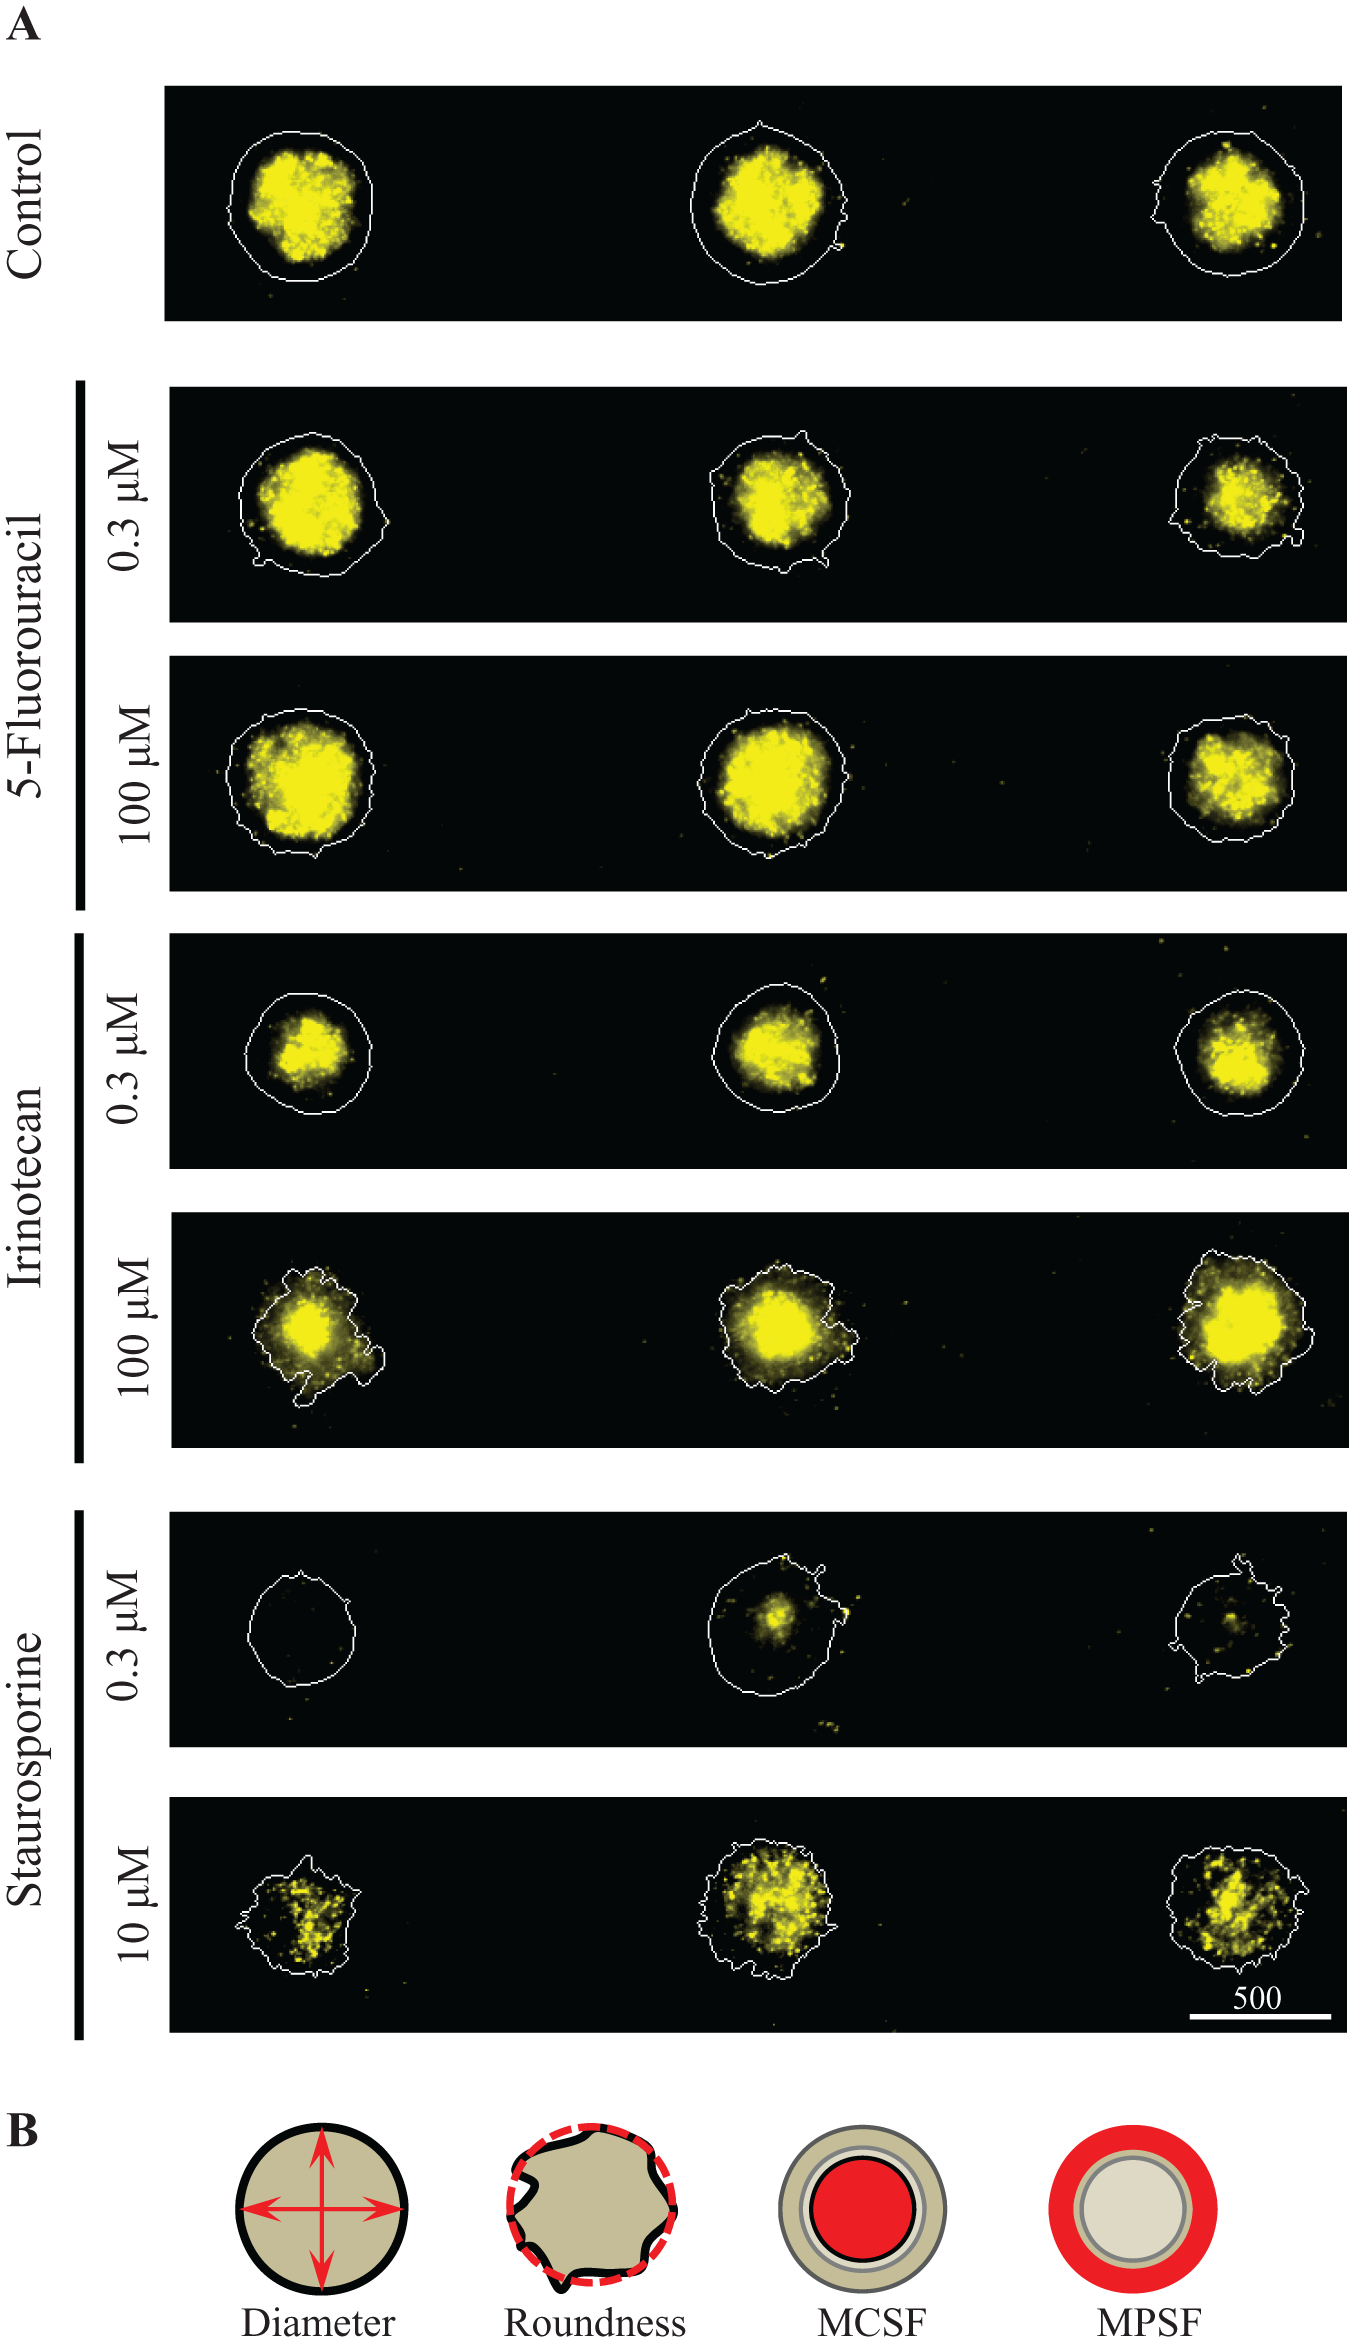
Fluorescent images of propidium iodide (PI)-stained micropatterned HT-29 OncoSpheres exposed to increasing concentrations of drugs and image analysis strategy. (
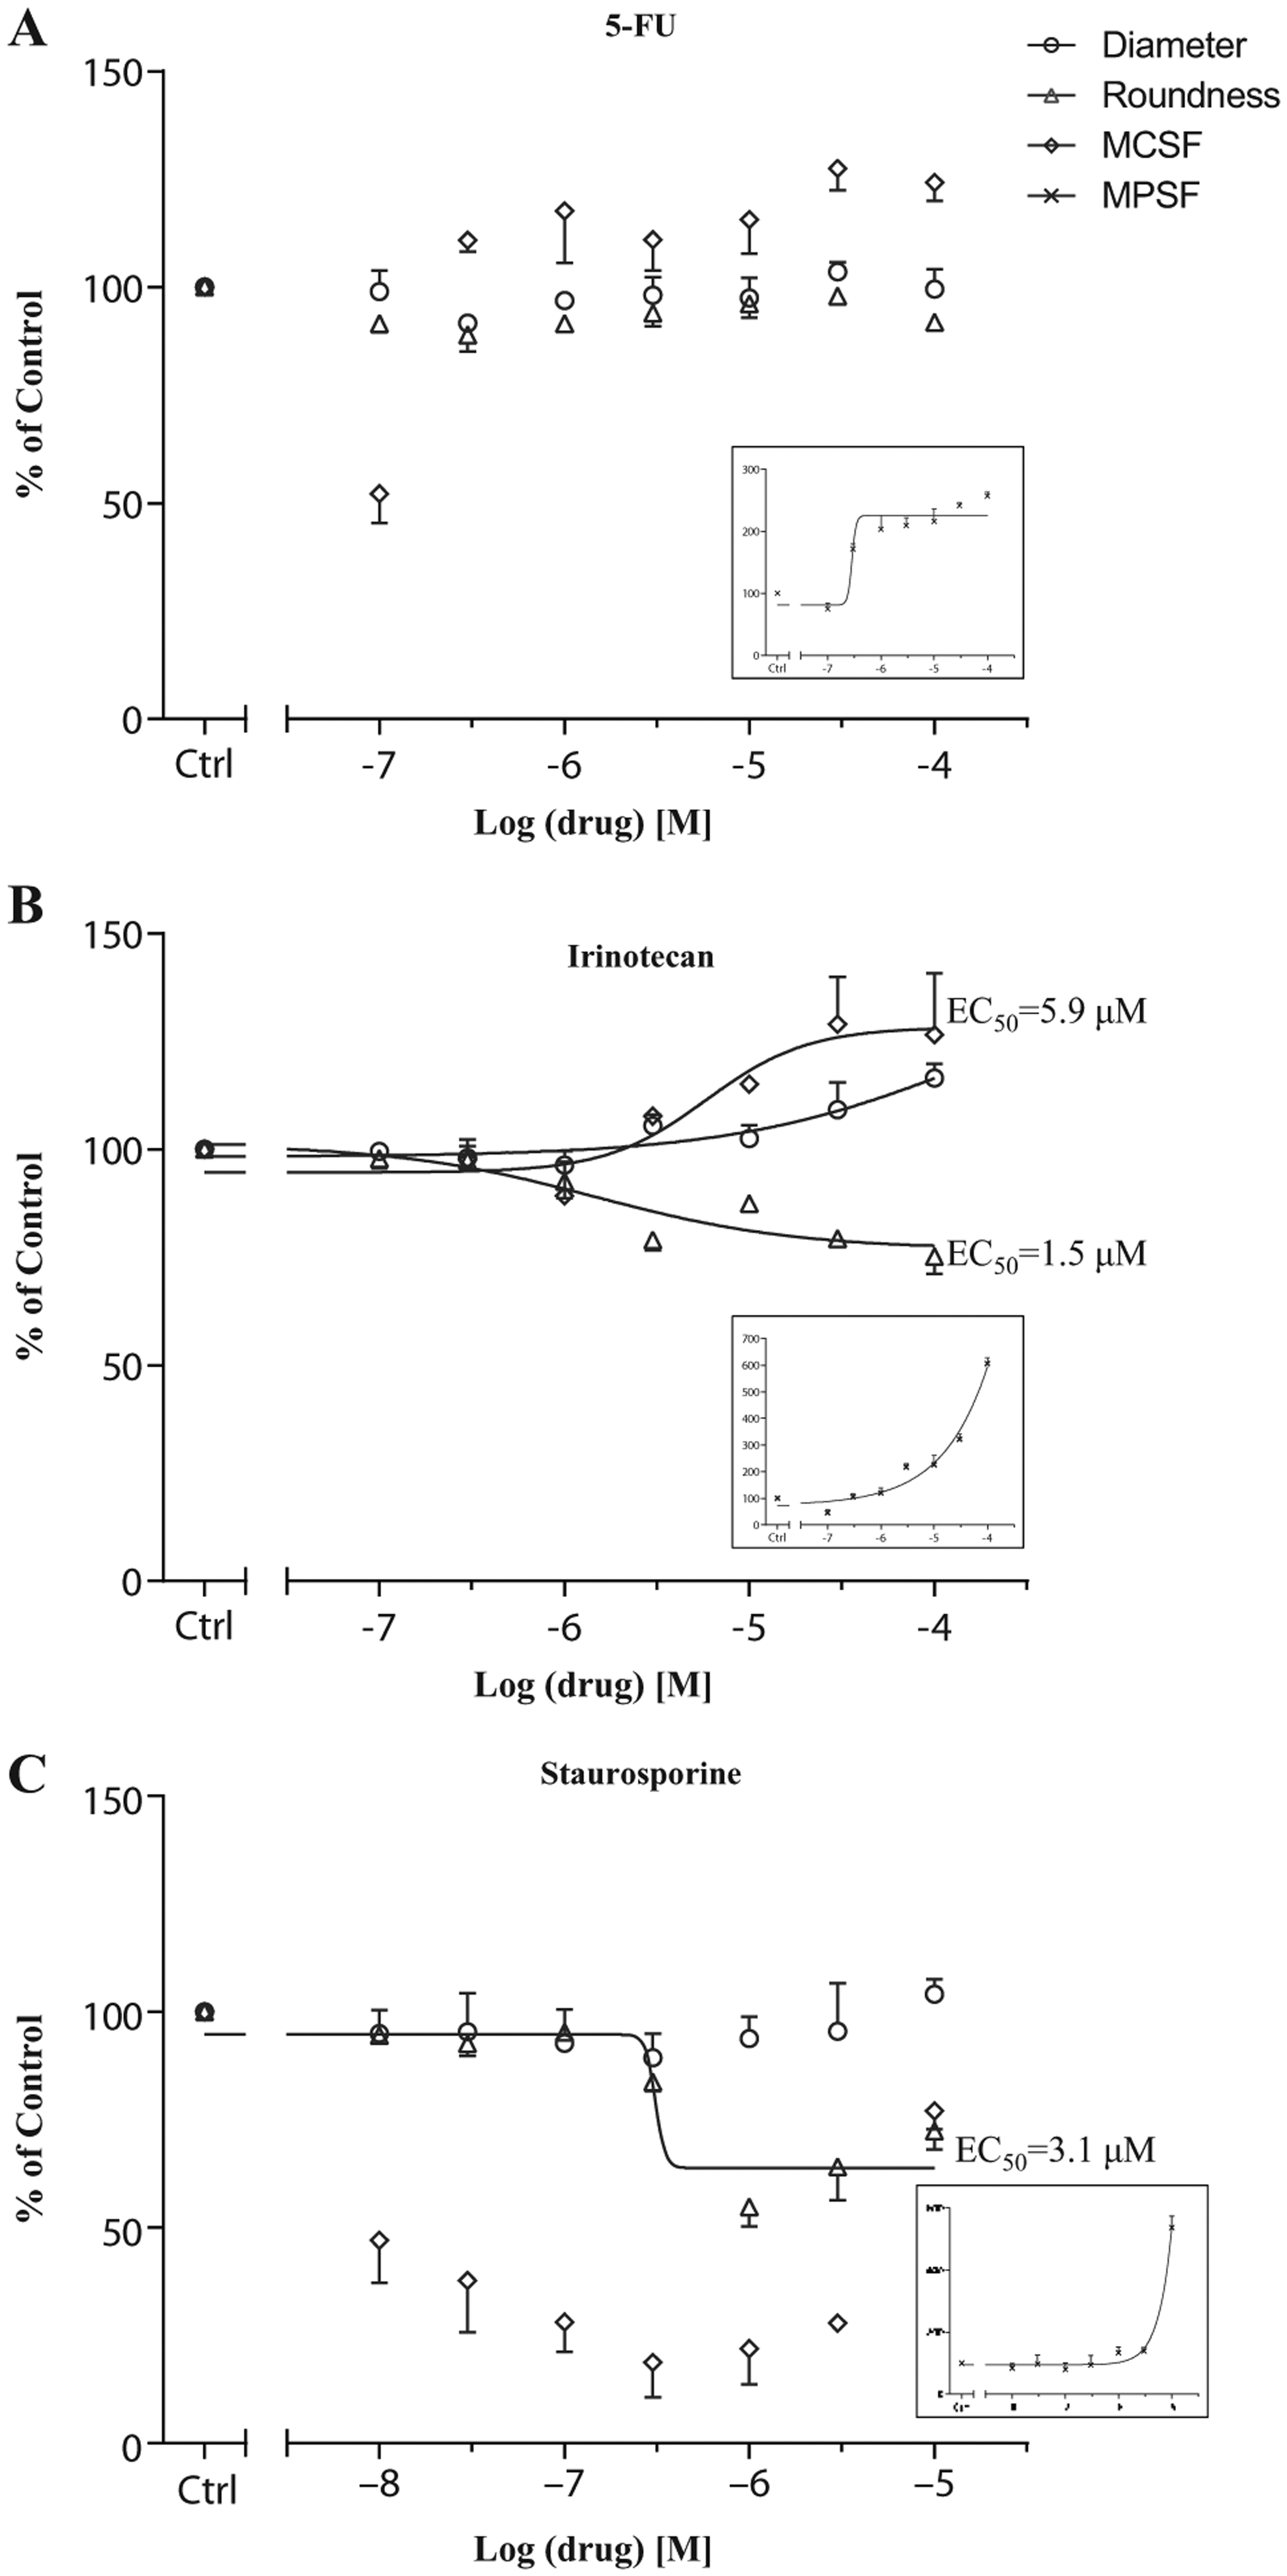
The combination of fast, automated readouts with high-content analysis and nine micropatterned spheroids per well presents a unique opportunity to study drug effects on subpopulations of spheroids as well as locally within each spheroid. To establish the suitability of each of the multiple imaging parameters [diameter, area, roundness, MPSF, MCSF, and mean total spheroid fluorescence (MTSF)] for quantification and characterization of compound effects, the assay window and signal variation were assessed through SNR, SBR, and CV% calculations on a small data set. Depending on the readout and the effect of the individual compounds, SBR values varied between 1.12 and 6.72 (acceptance criteria is ≥2), SNR values between 3.2 and 33.5 (acceptance criteria is ≥10), and the majority of CV% values were lower than 20%, reflecting overall moderate assay signal strength with low variance (
Dose–Response Analysis and Compound Profiling by HCA
HCA integrates several assay types into one quantitative assay, allowing direct correlation of viability with structural and morphological changes in response to treatment and the comparison of different compound profiles. Using the selected image analysis parameters described above, an overall picture of the effectiveness of each drug as well as a clear distinction between their different modes of action could be observed. Thus, within the tested concentration range (0.1–100 µM) and only 3 days of treatment, little effect of 5-FU was detected on the imaging parameters of spheroid diameter, roundness, and MCSF. MPSF, however, did increase significantly compared to control spheroids, indicating the death of cells in the outer proliferative rim, correlating with 5-FU being a cell-cycle-specific inhibitor (
Figs. 5A
Dose–response curves and compound profiling on HT-29 OncoSpheres. For each drug (
After 3 days of treatment with irinotecan at 0.1–100 µM, spheroid size (diameter;
Fig. 6B
) was similar to that of DMSO control spheroids except at the two highest doses of 30 and 100 µM, which caused slight spheroid swelling. Inspection of the corresponding images confirmed that the increase in spheroid size corresponded to a disintegration of spheroid architecture (
Fig. 5A
for PI staining and more visible in
In the case of staurosporine treatment (
Fig. 5A
), a concentration range between 0.01 and 10 µM prevented growth of spheroids over the 3-day treatment regime, resulting in spheroids that were 10–15% smaller than control spheroids (visible in Calein AM–stained and Hoechst-stained spheroids shown in
Overall, staurosporine is seen to act as a general inhibitor of overall spheroid growth, whereas 5-FU and irinotecan are cytotoxic first and foremost for proliferating cells. 5-FU is less efficient in HT-29 spheroids than irinotecan, affecting fewer imaging parameters. Similarly, Friedrich et al., using the acid phosphatase assay, also noted a difference in sensitivity of HT-29 spheroids to these two drugs, although a <50% reduction in viability using their readout prevented IC50 determinations. 30 Moreover, the in-depth dose-dependent description of the compound effects described here could not have been observed or predicted using traditional plate reader assays. This illustrates the increased value of HCS over HTS viability assays for improved understanding of drug action, combining localization and intensity analysis to provide subtle but measurable phenotypic changes that can discriminate cytotoxic from cytostatic (growth-inhibitory) concentrations of compounds as well as mode of action.
Performance Compared to Floating Hanging-Drop Spheroids
To highlight the potential benefits of OncoSpheres for imaging and HCA, we conducted a benchmark analysis with ready-made HT-29 spheroids purchased directly from InSphero. The company provides image-ready prefabricated spheroids with a narrow size distribution using the hanging-drop procedure conveniently transferred into a GravityTrap plate for downstream imaging analyses. For Oncospheres, the same standard conditions described in this article were used to prepare spheroids, and test compounds irinotecan and staurosporin were added to both systems when spheroids reached 300–340 µm in diameter (at 4 days after reception of HT-29 spheroids prepared by InSphero and 8 days after seeding for HT-29 OncoSpheres). Irinotecan and staurosporine treatment of spheroids resulted in similar compound effects in both 96-well plate systems, including preferential killing of proliferative cells in the outer spheroid rim by irinotecan and inhibition of spheroid growth by staurosporine (
- Direct formation of spatially separated size-standardized spheroids without a transfer step prior to imaging.
- Attachment to micropatterns allows frequent automated total culture medium exchange for optimal spheroid feeding, avoiding nutrient limitations.
- Immobilized nonoverlapping spheroids in the same z-axis facilitate fidelity of image capture and result in robust segmentation, simplifying object identification and quantification.
- Multiple spheroids per well increase the number of measurements, generating more statistically robust data per condition.
Such data should allow increased throughput with less false positives and negatives in a single run and compounds with undesirable dose–response behavior to be eliminated as early as possible. Micropatterned spheroids therefore offer several significant advantages for conducting HCS assays with large 3D structures.
Conclusions
Spheroids have a long history, and our aim was to bring this useful model up to speed for primary and secondary HCS. The OncoSpheres system described here conforms to standard automated liquid-handling robots and is optimized for multichannel quantitative imaging and batch analysis processing. It has been explicitly designed for image-based screens because an increasing number of technologies arise that eliminate the difficulties associated with incorporating spheroids into HTS,
31
but few meet the challenges and constraints particular to HCS. As well as numerous advantages for HCS (
Footnotes
Acknowledgements
We thank colleagues at CYTOO for the production of plates and useful discussions and Boudewijn Van der Sanden and Florence Appaix (Grenoble Institut des Neurosciences, Grenoble, France) for expert help and access to the Grenoble Platform of Intravital Microscopy.
Declaration of Conflicting Interests
The authors declared the following potential conflicts of interest with respect to the research, authorship, and/or publication of this article: The authors are employees of CYTOO SA, which manufactures and commercializes the plates and assay described in this work.
Funding
The authors disclosed receipt of the following financial support for the research, authorship, and/or publication of this article: This work was financed by Bpifrance as part of France’s Industrial Strategic Innovation (ISI) grant program under the project entitled Evolved Tissue Inspired Cell Systems (ETICS) with contract number 1107018W. The Intravital Microscopy Grenoble platform was partly funded by the French Investissement d’Avenir program run by the Agence Nationale pour la Recherche under the grant Infrastructure d’avenir en Biologie Santé—ANR11-INBS-0006.
References
Supplementary Material
Please find the following supplemental material available below.
For Open Access articles published under a Creative Commons License, all supplemental material carries the same license as the article it is associated with.
For non-Open Access articles published, all supplemental material carries a non-exclusive license, and permission requests for re-use of supplemental material or any part of supplemental material shall be sent directly to the copyright owner as specified in the copyright notice associated with the article.