
Abstract
High-content imaging (HCI) is a powerful method for quantifying biological effects in vitro. Historically, HCI has been applied to adherent cells growing in monolayers. With the advent of confocal versions of HCI devices, researchers now have the option of performing analyses on 3D cell cultures. However, some obstacles remain in integrating the third dimension, such as limited light penetration and less sophisticated image analysis.
Here, we report the development of an HCI technique for imaging human bronchial 3D organotypic air–liquid interface (ALI) cultures (hBR-ALI).
In this method, we monitored differentiation status through HCI evaluation markers representative of ciliated epithelial cells and goblet cells (Muc5AC [mucin 5AC]). As a second use case for demonstrating the utility of this technique, we induced goblet cell hyperplasia in hBR-ALI by using interleukin (IL)-13.
Our results demonstrate the utility of the HCI technique for imaging hBR-ALI grown on Transwell inserts. This technique may be expanded to other cell culture systems, such as skin epithelia and 3D intestinal systems.
Keywords
Introduction
The requirement for more physiologically relevant in vitro systems that closely mimic the characteristics and functionalities of the part of the human body they model has led to the development of more complex cellular models, which range from 2D co-cultures to complex 3D co-culture systems. 1 Today, 3D models are commonly used for different applications, such as drug screening, 2 compound adsorption, 3 and toxicity screening. 4 The increasing complexity of these models has also introduced several new technical challenges concerning their use in combination with classical endpoints, including fluorescence-based imaging. 5 Additionally, further improvements are required in automation and high-throughput approaches for using these models. 6
Models such as air–liquid interface (ALI) organotypic tissues are of particular interest in the context of in vitro inhalation toxicology. 7 These tissues can be obtained when normal human bronchial epithelial (NHBE) cells (Lonza, Basel, Switzerland) are grown to confluence on a Transwell (Corning, NY) system and differentiated at the air-exposed surface to produce human bronchial 3D organotypic ALI cultures (hBR-ALI). This procedure enables the formation of a polarized, pseudostratified epithelium composed of basal, ciliated, and goblet cells ( Suppl. Fig. S1 ). 8 hBR-ALI is a useful tool for the in vitro study of airway epithelial biology, as it closely resembles the architecture and microenvironment of human large airways. 9 When compared with nondifferentiated submerged airway epithelial cells, the in vitro response of differentiated airway epithelial cells growing at the ALI may also more accurately reflect the response of lung epithelia in vivo. 10
To investigate whether high-content imaging (HCI) techniques can be adapted to 3D culture systems, we investigated phenotypic markers expressed by hBR-ALI, including β-tubulin 4, 11 Muc5AC, 12 and p63, 13 which were selected to identify ciliated, goblet, and basal cells, respectively. We also included the marker ZO-1 (zonula occludens-1), 14 a member of the family of tight junction proteins, to better visualize the overall tissue morphology.
Materials and Methods
Tissue Generation
hBR-ALIs were prepared as previously described. 15
Tissue Processing, Embedding, Sectioning, and Staining
Tissues were processed as previously described. 16
Immunostaining
To detect goblet, ciliated, and basal cells in hBR-ALI, we used antibodies to target specific cell-type markers. The tissues were first fixed in 4% (w/v) paraformaldehyde (Sigma, St. Louis, MO, USA) for 15 min and then blocked for 1 h in blocking solution (0.5% Triton X-100, 5% normal goat serum, and 2% bovine serum albumin at room temperature; all reagents from Thermo Fisher Scientific, Waltham, MA, USA) in 1× Dulbecco’s phosphate-buffered saline (D-PBS; without calcium, magnesium, or phenol red; STEMCELL Technologies, Vancouver, BC, Canada). The tissues were stained with a β-tubulin 4 antibody conjugated to Alexa 647 (1:250; ab204034; Abcam, Cambridge, UK), Muc5AC antibody conjugated to Alexa 550 (1:250; ab218714; Abcam), ZO-1 antibody conjugated to Alexa 594 (1:250; 339194: Invitrogen, Carlsbad, CA, USA) or p63 antibody (1:250; ab735; Abcam) diluted in D-PBS with 2% normal goat serum (Thermo Fisher Scientific) and 1% bovine serum albumin (Thermo Fisher Scientific). For the p63 staining, the tissues were incubated a second time with a secondary antibody conjugated to Alexa 488 (1:250; ab96879; Abcam). Nuclei were counterstained by using the ProLong Diamond Antifade Mountant with 4′,6-diamidino-2-phenylindole (DAPI; Thermo Fisher Scientific). Primary and secondary antibodies were incubated overnight at 4 °C and for 1 h at room temperature in the dark, respectively. Each washing step was performed by adding 200 µL of PBS.
Tissue clearing was then performed to enhance image resolution ( Suppl. Fig. S2a,b ); this helped improve the signal detection, leading to better and more robust quantification ( Suppl. Fig. S2c ). To this end, the apical surface of the tissues was treated with Visikol HISTO-M (Visikol, Whitehouse Station, NJ) immediately after nuclear counterstaining, and the tissues were incubated for 1 h at room temperature. Once stained, the tissues can be stored for 2–3 months in the dark at 4 °C.
Image Acquisition
In contrast to the previously described method, 17 the intact insert was imaged to avoid additional manipulation of the hBR-ALI inserts and allow the process to remain less time-consuming. In this method, the distance between the cells and the camera objective is greater, and there is a microporous membrane between the objective and light source of the HCI system. Both of these factors interfere with the imaging process, leading to decreased and less distinct signals. To partly overcome these problems, we designed a dedicated insert holder—3D-printed by 3D Systems (Rock Hill, SC) by using Accura Xtreme (https://www.3dsystems.com/sites/default/files/2018-11/3d-systems-accura-Xtreme-datasheet-USEN-11-01-18-web.pdf)—that reflects the geometry of a standard 24-well plate ( Suppl. Fig. S3a ). Using this holder, we avoided using the standard 24-well plate, thereby moving the tissue closer to the camera objective and eliminating interference from the plastic bottom. Images were acquired with the CellInsight CX7 High-Content Screening (HCS) Platform (Thermo Fisher Scientific) and analyzed with Studio software (Thermo Fisher Scientific) by using the Spot Detector BioApplication. Of note, the signal of phenotypic markers was used as a reference for autofocusing, and the nuclear compartment was imaged by using a fine-tuned offset. Spot detection analysis was finally applied over the whole image by setting the entire field of view (FoV) as the “object.” (This procedure may be software dependent.)
Focus Plane Identification
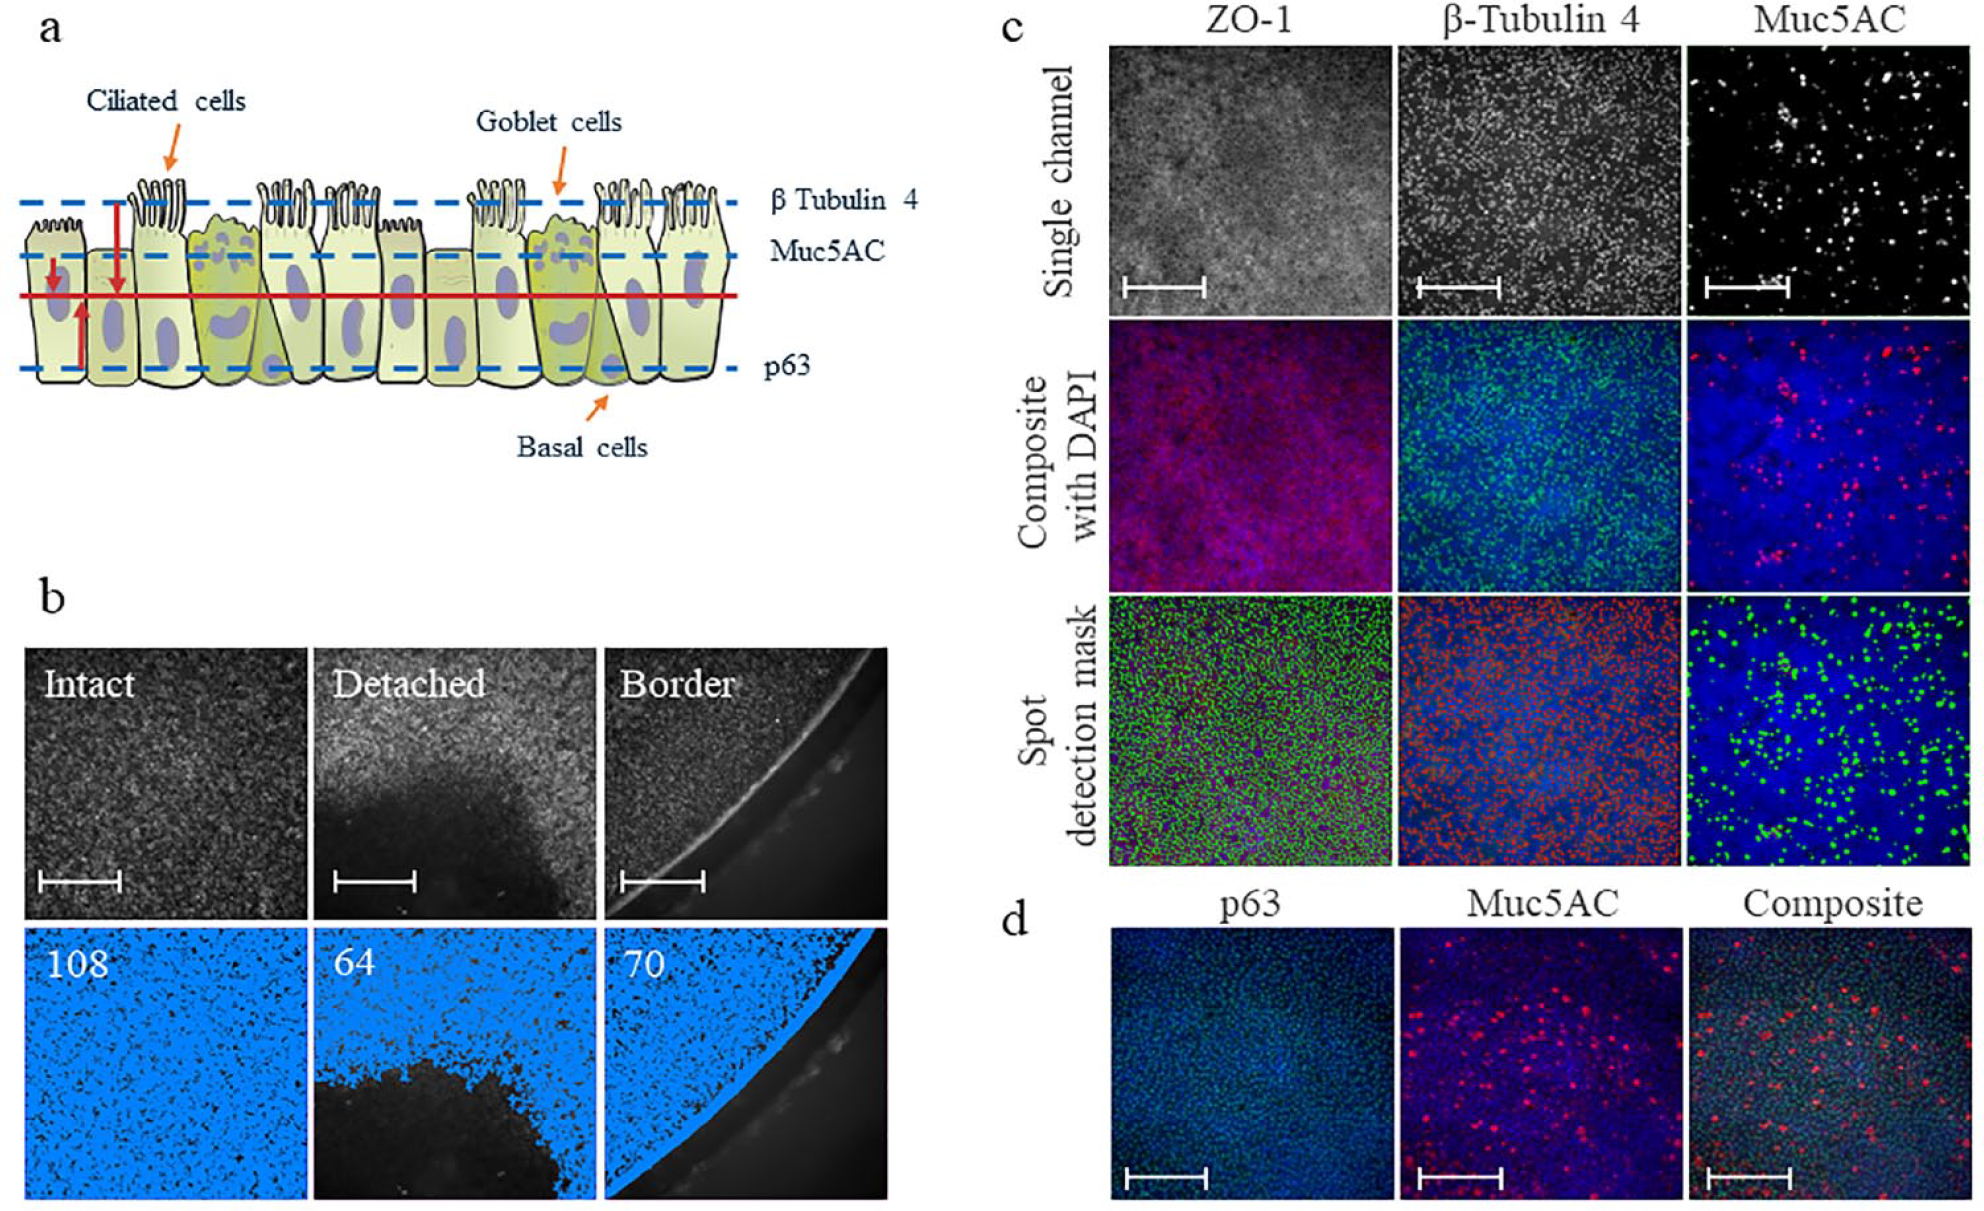
HCS-based methods for 2D cell cultures normally employ stained nuclei as the reference for focal plane and cell (often defined as the “object”) identification ( Suppl. Fig. S3b , left panel). Because the hBR-ALI is pseudostratified, nuclei can be distributed along the whole z axis and partially overlap with each other ( Suppl. Fig. S3b , right panel). Therefore, the traditional nuclear reference used in the 2D approach cannot be easily applied to hBR-ALI. However, markers such as β-tubulin 4, Muc5AC, and p63 have a more restricted spatial distribution along the z axis, because the cells expressing these markers are located more apically or basally in reconstituted bronchial epithelia; therefore, the focal plane for imaging these markers is relatively defined. In this study, we applied a defined offset specific to each marker to image the corresponding nuclei for reference ( Fig. 1a ).
(
Case Studies
We used two case studies to test and verify the developed protocols and overall approach: (1) staining and detection of goblet (Muc5AC-positive) and ciliated (β-tubulin 4-positive) cells during the 4-week tissue maturation period 18 and (2) staining and detection of goblet (Muc5AC-positive) cells in an in vitro model of goblet cell hyperplasia. 19 The model was recreated by applying 10 ng/mL interleukin (IL)-13 (PeproTech, London, UK) to the basolateral compartment of the Transwell system of a mature tissue (at least 4 weeks after ALI-switch) in a total volume of 600 µL of PneumaCult-ALI medium (STEMCELL Technologies). The cytokine-containing medium was refreshed every second day for up to 2 weeks.
Results and Discussion
Image Analysis
For quantitative analysis of individual markers per cell, nuclei were counterstained with DAPI, and the images were analyzed by the spot detection method (software, application name “Spot Total Area”), a rapid and flexible image analysis algorithm. This study employed spot detection—normally used for the identification and analysis of intracellular punctate objects such as multiprotein complexes, specialized endosomes, and other organelles—for cell component and marker identification. Spot Total Area was chosen because it allows evaluation of the area effectively covered by the signal in the FoV. In contrast, alternative applications like “Spot Count” might not properly discriminate two or more adjacent objectives, leading to underestimation of the results. In addition, Spot Total Area identified areas where the tissue was damaged as well as those limited by the camera reaching the border of the inserts ( Fig. 1b ).
Similar to the nuclear signal, the expression of a selection of phenotypic markers was investigated by applying a spot detection-based mask. Cell-type-specific markers β-tubulin 4, p63, and Muc5AC were selected for identifying ciliated, goblet, and basal cells, respectively. In addition, ZO-1, a member of the family of tight junction proteins, was included for resolving cell-to-cell boundaries. Figure 1c shows the tight junction signals visible after ZO-1 staining as well as examples of stained ciliated and goblet cells. The lower panels show the applied spot detection mask, and it is possible to appreciate how specific the signal recognition is.
Similar to other fluorescence-based methods, HCI offers the possibility to multiplex several markers, which helps decrease the number of 3D tissues that need to be prepared. Figure 1d shows stained basal and goblet cells in the same tissue. The basal cell marker p63 is imaged in the green channel, while Muc5AC, a marker of goblet cells, is imaged in the far red.
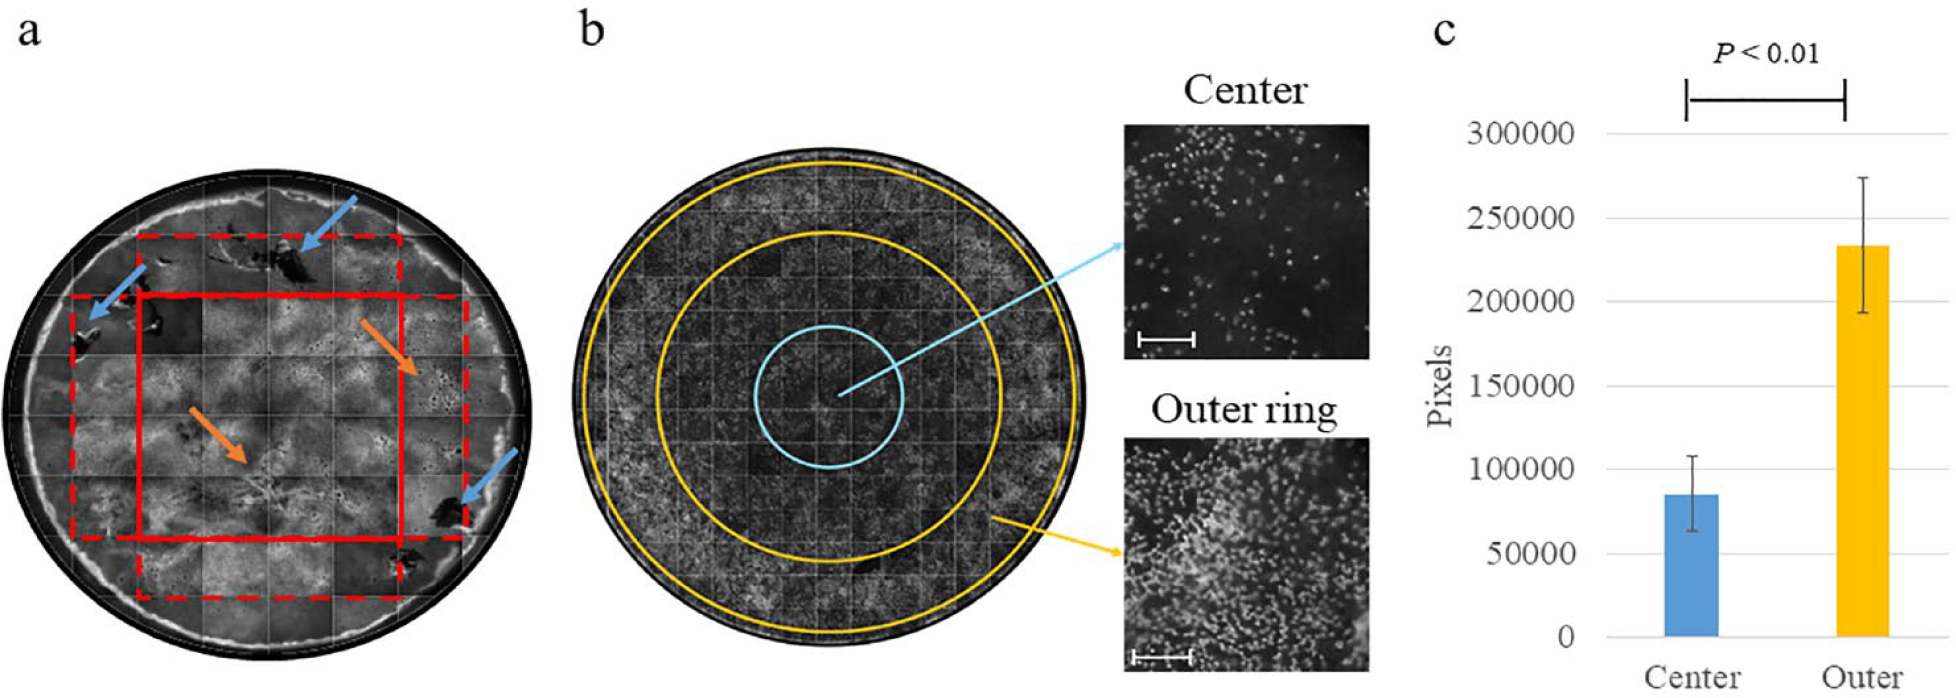
Besides spot detection-based quantification of cellular features, single FoV images can also be mounted to allow visualization of the whole (mount) tissue. After accurate optimization of the form factor of the insert holder (e.g., size, format, and position of the center of the well), it is possible to fully image the entire hBR-ALI by acquiring 60 images at 10× magnification. This image of the whole tissue allows easy identification of tissue damage and abnormalities in hBR-ALI ( Fig. 2a ). Evaluating the expression and distribution of phenotypic markers by whole-mount analysis might help define the time point after airlift at which the tissues reach full differentiation; for example, by β-tubulin 4 staining, the presence and distribution of cilia can be assessed over time to infer the time point at which they reach the maximum number. It should be noted that the expression of markers across the whole tissue might not be homogeneous. In the example presented here, the tissue was characterized by higher expression of cilia at the outer ring than at the center ( Fig. 2b ). This was confirmed by the results of image analysis by using the spot detection algorithm. In this case, images were acquired at 20× magnification to increase the fragmentation into a higher number of FoVs (up to 132), leading to better resolution between the central and outer rings. Extrapolation of data at the FoV level allowed quantitative comparison between the outer ring and center of the tissue. In the example reported here, comparison of the Spot Total Area of individual FoVs at the central and outer rings of the image revealed a greater than twofold difference in ciliary density ( Fig. 2c ).
(
However, for higher-throughput quantification of markers across hBR-ALI, it might be sufficient to limit the investigation to 16 or 32 FoVs, as they would already represent 35% and 70% of the whole tissue area, respectively (at 10× magnification). Finally, for further optimization of the image acquisition protocol, we selected 16 FoVs equally distributed between the central and outer rings ( Suppl. Fig. S3c ). This approach ensures full representative analysis of the tissue, with no additional time requirement for acquisition, and was selected for the present case studies.
Case Studies
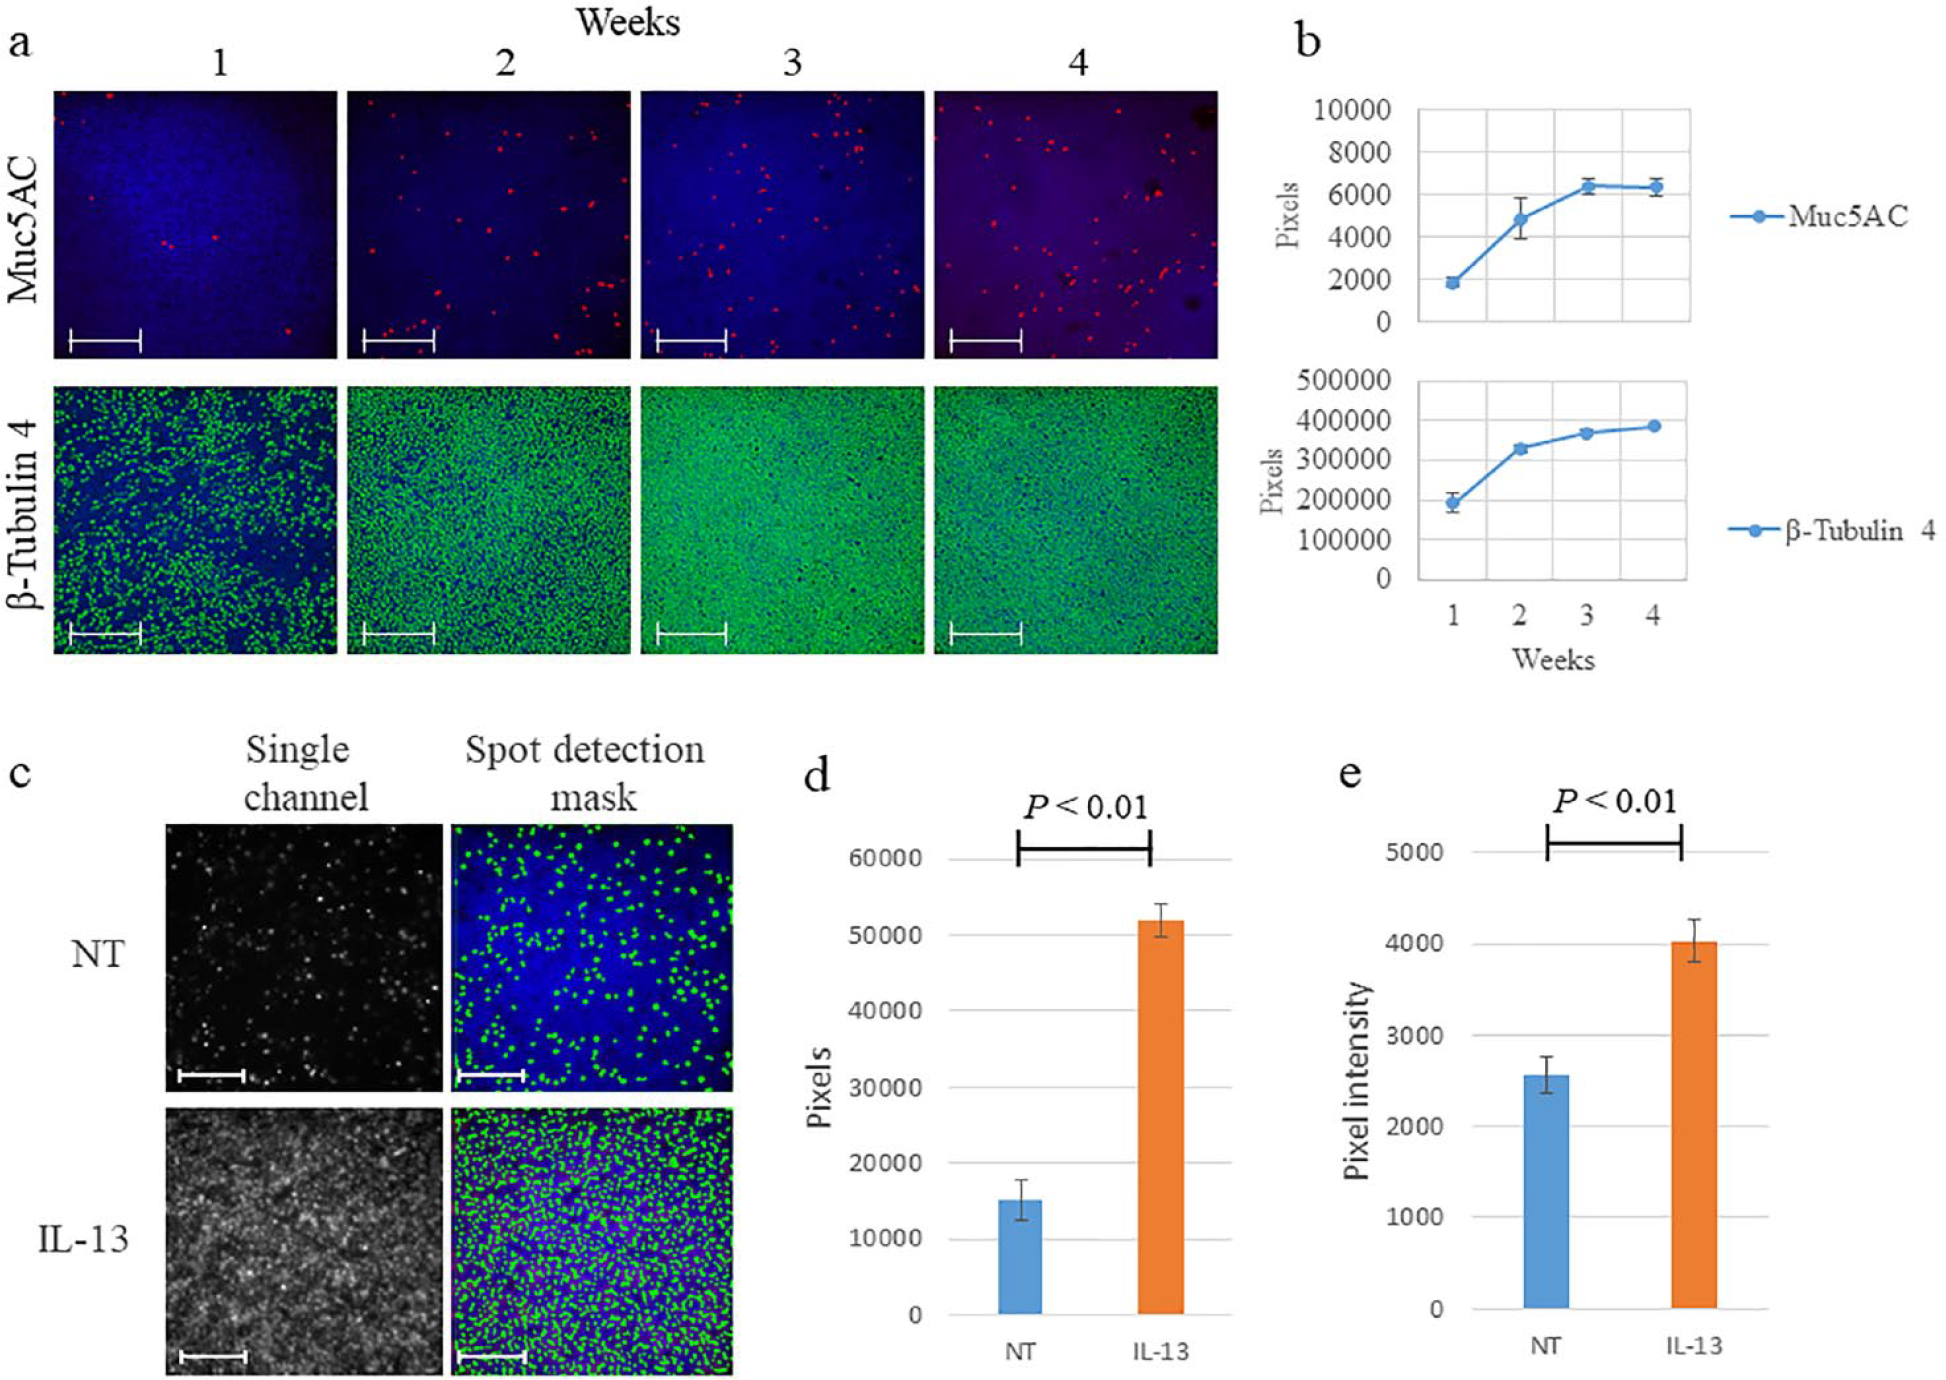
During the maturation process, three independent tissues were fixed and stained for Muc5AC and β-tubulin 4 every week before image acquisition ( Fig. 3a ). The images were analyzed, and the Spot Total Area was quantified. Both markers showed a time-dependent increase in expression, which appeared to reach a plateau 3–4 weeks after maturation was induced ( Fig. 3b ).
(
In the second example, where we investigated an in vitro model of goblet cell hyperplasia,19,20 IL-13 treatment induced an evident increase in goblet cell density ( Fig. 3c ), with Spot Total Area detection showing an almost fourfold increase (from ~15,000 to >50,000 positive pixels) in Muc5Ac signal ( Fig. 3d ). In addition, measurement of Spot Average Intensity in HCI revealed a nearly 40% increase in Muc5AC expression at the single-cell level in IL-13-treated tissues relative to untreated tissues ( Fig. 3e ).
These examples show that maturation- and time-dependent expression of phenotypic markers can be easily tracked and quantified. The same markers can also be used as endpoints in experiments investigating specific phenotypic changes, such as goblet cell hyperplasia or loss of barrier integrity. The case study presented here shows that IL-13 treatment causes an increase in both goblet cell distribution and Muc5AC expression in bronchial epithelial tissues.
Conclusion and Future Perspective
For many decades, standard submerged 2D cultures were the most widely used tool for scientists. More recently, several different solutions have been developed to address the increasing demand for more physiologically relevant in vitro systems. However, while the physiological relevance of in vitro models has improved, their system complexity has increased, which often limits their application in standard in vitro investigations. In the context of HCI applications, several different aspects, including image acquisition and analysis, require different approaches or new tools in order to enable the transition from 2D to 3D systems.
To address these challenges in the context of the ALI model, we developed some innovative solutions, which allowed us to overcome the technical limitations stemming from the intrinsic complexity of the model. To allow image acquisition without excising the Transwell membrane, we designed an insert holder that allowed us to generate higher-quality pictures without laborious processing of the sample. Next, because the standard autofocus procedure relying on nuclei detection is limited by the irregular distribution of nuclei along the z axis, we decided to use the signal of phenotypic markers as the reference for autofocus. This allowed more efficient and reproducible identification of the optimal focal plane. In fact, the selected phenotypic markers showed a more consistent distribution along the z axis. Finally, to analyze the images, we readapted the overall analysis strategy, moving from individual cells to the whole tissue. This, in combination with the use of Spot Detector BioApplication, allowed investigation at the tissue level. In addition, extracting and analyzing data at the FoV level allowed us to evaluate marker distribution and, therefore, tissue homogeneity.
The overall test system can be further improved by reducing the culture size of the tissue from the current 24-well format to the 96-well format. This will undoubtedly enable a significant increase in throughput, allowing the system to be used for hit-to-lead screening. Additionally, its applicability to different test systems, such as skin and gingival ALI tissues, must be verified. We expect that the method might require some adaptation to account for differences in tissue morphology (e.g., the presence of a keratinized layer).
Supplemental Material
Marescotti_Supplementary_Figure_1 – Supplemental material for In Vitro High-Content Imaging-Based Phenotypic Analysis of Bronchial 3D Organotypic Air–Liquid Interface Cultures
Supplemental material, Marescotti_Supplementary_Figure_1 for In Vitro High-Content Imaging-Based Phenotypic Analysis of Bronchial 3D Organotypic Air–Liquid Interface Cultures by Diego Marescotti, David Bovard, Moran Morelli, Antonin Sandoz, Karsta Luettich, Stefan Frentzel, Manuel Peitsch and Julia Hoeng in SLAS Technology
Supplemental Material
Marescotti_Supplementary_Figure_2 – Supplemental material for In Vitro High-Content Imaging-Based Phenotypic Analysis of Bronchial 3D Organotypic Air–Liquid Interface Cultures
Supplemental material, Marescotti_Supplementary_Figure_2 for In Vitro High-Content Imaging-Based Phenotypic Analysis of Bronchial 3D Organotypic Air–Liquid Interface Cultures by Diego Marescotti, David Bovard, Moran Morelli, Antonin Sandoz, Karsta Luettich, Stefan Frentzel, Manuel Peitsch and Julia Hoeng in SLAS Technology
Supplemental Material
Marescotti_Supplementary_Figure_3 – Supplemental material for In Vitro High-Content Imaging-Based Phenotypic Analysis of Bronchial 3D Organotypic Air–Liquid Interface Cultures
Supplemental material, Marescotti_Supplementary_Figure_3 for In Vitro High-Content Imaging-Based Phenotypic Analysis of Bronchial 3D Organotypic Air–Liquid Interface Cultures by Diego Marescotti, David Bovard, Moran Morelli, Antonin Sandoz, Karsta Luettich, Stefan Frentzel, Manuel Peitsch and Julia Hoeng in SLAS Technology
Supplemental Material
Supplementary_figure_captions_Review_2 – Supplemental material for In Vitro High-Content Imaging-Based Phenotypic Analysis of Bronchial 3D Organotypic Air–Liquid Interface Cultures
Supplemental material, Supplementary_figure_captions_Review_2 for In Vitro High-Content Imaging-Based Phenotypic Analysis of Bronchial 3D Organotypic Air–Liquid Interface Cultures by Diego Marescotti, David Bovard, Moran Morelli, Antonin Sandoz, Karsta Luettich, Stefan Frentzel, Manuel Peitsch and Julia Hoeng in SLAS Technology
Footnotes
Acknowledgements
We are grateful for helpful discussions and editorial assistance by Sindhoora Bhargavi Gopala Reddy and Nicholas Karoglou. We also express our thanks to Maxime Mioulane for help with the development of the image analysis algorithm.
Supplemental material is available online with this article.
Declaration of Conflicting Interests
The authors declared the following potential conflicts of interest with respect to the research, authorship, and/or publication of this article: All authors are employed by Philip Morris International and their research and authorship of this article was completed within the scope of their employment with Philip Morris International.
Funding
The authors received no financial support for the research, authorship, and/or publication of this article.
References
Supplementary Material
Please find the following supplemental material available below.
For Open Access articles published under a Creative Commons License, all supplemental material carries the same license as the article it is associated with.
For non-Open Access articles published, all supplemental material carries a non-exclusive license, and permission requests for re-use of supplemental material or any part of supplemental material shall be sent directly to the copyright owner as specified in the copyright notice associated with the article.