
Abstract
A microfluidic paper analytical device (μPAD) was created for the sensitive quantification of cancer antigens, carcinoembryonic antigen (CEA) and carbohydrate antigen 19-9 (CA 19-9), from human whole blood and serum, toward diagnosis and prognosis of colorectal cancer. Anti-CEA and anti–CA 19-9 antibodies were covalently linked to submicron, fluorescent polystyrene particles, loaded, and then dried in the center of the μPAD channel. CEA- or CA 19-9–spiked blood or serum samples were loaded to the inlet of μPAD, and subsequent immunoagglutination changed the fluorescent scatter signals upon ultraviolet (UV) excitation. The total assay time was about 1 min. Detection limits were 1 pg/mL for CEA and 0.1 U/mL for CA 19-9 from both 10% diluted blood and undiluted serum. The use of UV excitation and subsequent fluorescence scattering enabled much higher double-normalized intensities (up to 1.28–3.51, compared with 1.067 with the elastic Mie scatter detection), successful detection in the presence of blood or serum, and distinct multiplex assays with minimum cross-reaction of antibodies. The results with undiluted serum showed the larger dynamic range and smaller standard errors, which can be attributed to the presence of serum proteins, functioning as a stabilizer or a passivating protein for the particles within paper fibers.
Keywords
Introduction
Cancer is one of the leading causes of morbidity and mortality among humans throughout the world. Early screening of biomarkers for this disease has reduced the mortality rates and thus contributed to its prevention. 1 Early monitoring is also a key to maintaining a good quality of a patient’s life, which is significantly affected by treatment modalities such as chemotherapy, radiotherapy, and surgical resections. 2
In this work, we focus on the early screening of colorectal cancer, which is the third most common cause of cancer death. 1 Carcinoembryonic antigen (CEA) is an 180–200 kDa glycoprotein that has been used in the diagnosis and prognosis of cancers of the stomach, colon, rectum, pancreas, lung, breast, and medullary thyroid.3,4 In advanced colorectal cancer, CEA can be elevated in most patients, but the levels drop after successful treatment or resection. 5 The carbohydrate antigen 19-9 (CA 19-9) is another tumor marker that has been used as a prognostic parameter for colorectal cancer. 5 Early detection of these cancer markers could increase treatment rates and patient survival rates.
Both CEA and CA 19-9 have been assayed from the patients’ blood to monitor colorectal cancer; while CEA is a more general cancer marker, CA 19-9 is a more specific colorectal cancer marker. The gold standard for the detection and quantification of CEA and CA 19-9 in blood and serum is an enzyme-linked immunosorbent assay (ELISA), typically performed on a microplate. While ELISA can offer a very low limit of detection and sufficient specificity, it still involves multiple steps of loading and washing reagents and a sample, which is not an appropriate characteristic toward point-of-care diagnostics. Simpler platforms have been suggested and evaluated, most notably sandwich-type immunoassays performed on a lateral flow assay (LFA) paper strip. While commercial LFAs are available to detect various cancer markers from a human bodily fluid, such as blood, saliva, or serum, they merely provide a yes or no result for cancer markers using a relatively high cutoff concentration (e.g., 5 ng/mL CEA). It is possible to achieve a lower detection limit on LFA if the sample matrix is water or buffer, as reported by Liu et al. 6 Therefore, sample purification steps will be necessary, such as centrifugation, chromatography, and/or filtration, to adapt this LFA technology toward sensitive detection of cancer markers from human bodily fluids.
Microfluidic paper analytical devices (μPADs) have recently drawn attraction among lab-on-a-chip (LOC) systems, which is a natural expansion of paper-based immunoassays (LFAs). Reduced sample and reagent consumption, lower power consumption (flow is spontaneous), and low costs have been reported as some of the advantages of μPADs. 7 Several publications in the recent literature have demonstrated the diverse biomedical applications of μPADs, but some of these analytical devices have yet to achieve sufficient sensitivity when using colorimetric detection.8,9 In addition, blood and serum are complex matrices that usually require purification of potentially interfering substances prior to capturing the target analyte. 10
LFA or μPAD assays of CEA and CA 19-9 are summarized in Table 1 .6,11–30 While very low detection limits were demonstrated with clean buffer (phosphate-buffered saline [PBS])—0.06–10 pg/mL for CEA and 16.3 mU/mL to 0.17 U/mL for CA 19-9, those with human serum were substantially higher—26.5 ng/mL for CEA and 23.9 U/mL for CA 19-9. (The CEA detection limit of 0.03 ng/mL in Liu et al. 29 should be considered an exception, as it required the use of a syringe pump and an oven for continuous removal of serum proteins. Even in this case, this detection limit is still substantially higher than those with PBS.) The detection limits of other cancer markers are quite similar to those of CEA and CA 19-9: a few picograms per milliliter or a few milliunits per milliliter with PBS and a few nanograms per milliliter or a few tens of units per milliliter with plasma or serum. The assays from plasma and serum18,27,28 also required 10× to 20× dilution. Sensitive quantification of cancer markers (including CEA and CA 19-9) on LFA or μPAD has not been reported with human whole blood, to the best of our knowledge. Pretreatments such as purification and/or isolation were necessary to achieve a low limit of detection, which would prevent the assays from being performed in near real time and at the point of care. Without pretreatment, detection limits were quite high and the assays merely provided yes or no results.
Summary of LFA and μPAD Assays Previously Reported for Cancer Biomarker Detection in Literature (Reported Techniques Are Categorized by Sample Matrix, Detection Method, Target Analyte, and Detection Limit).
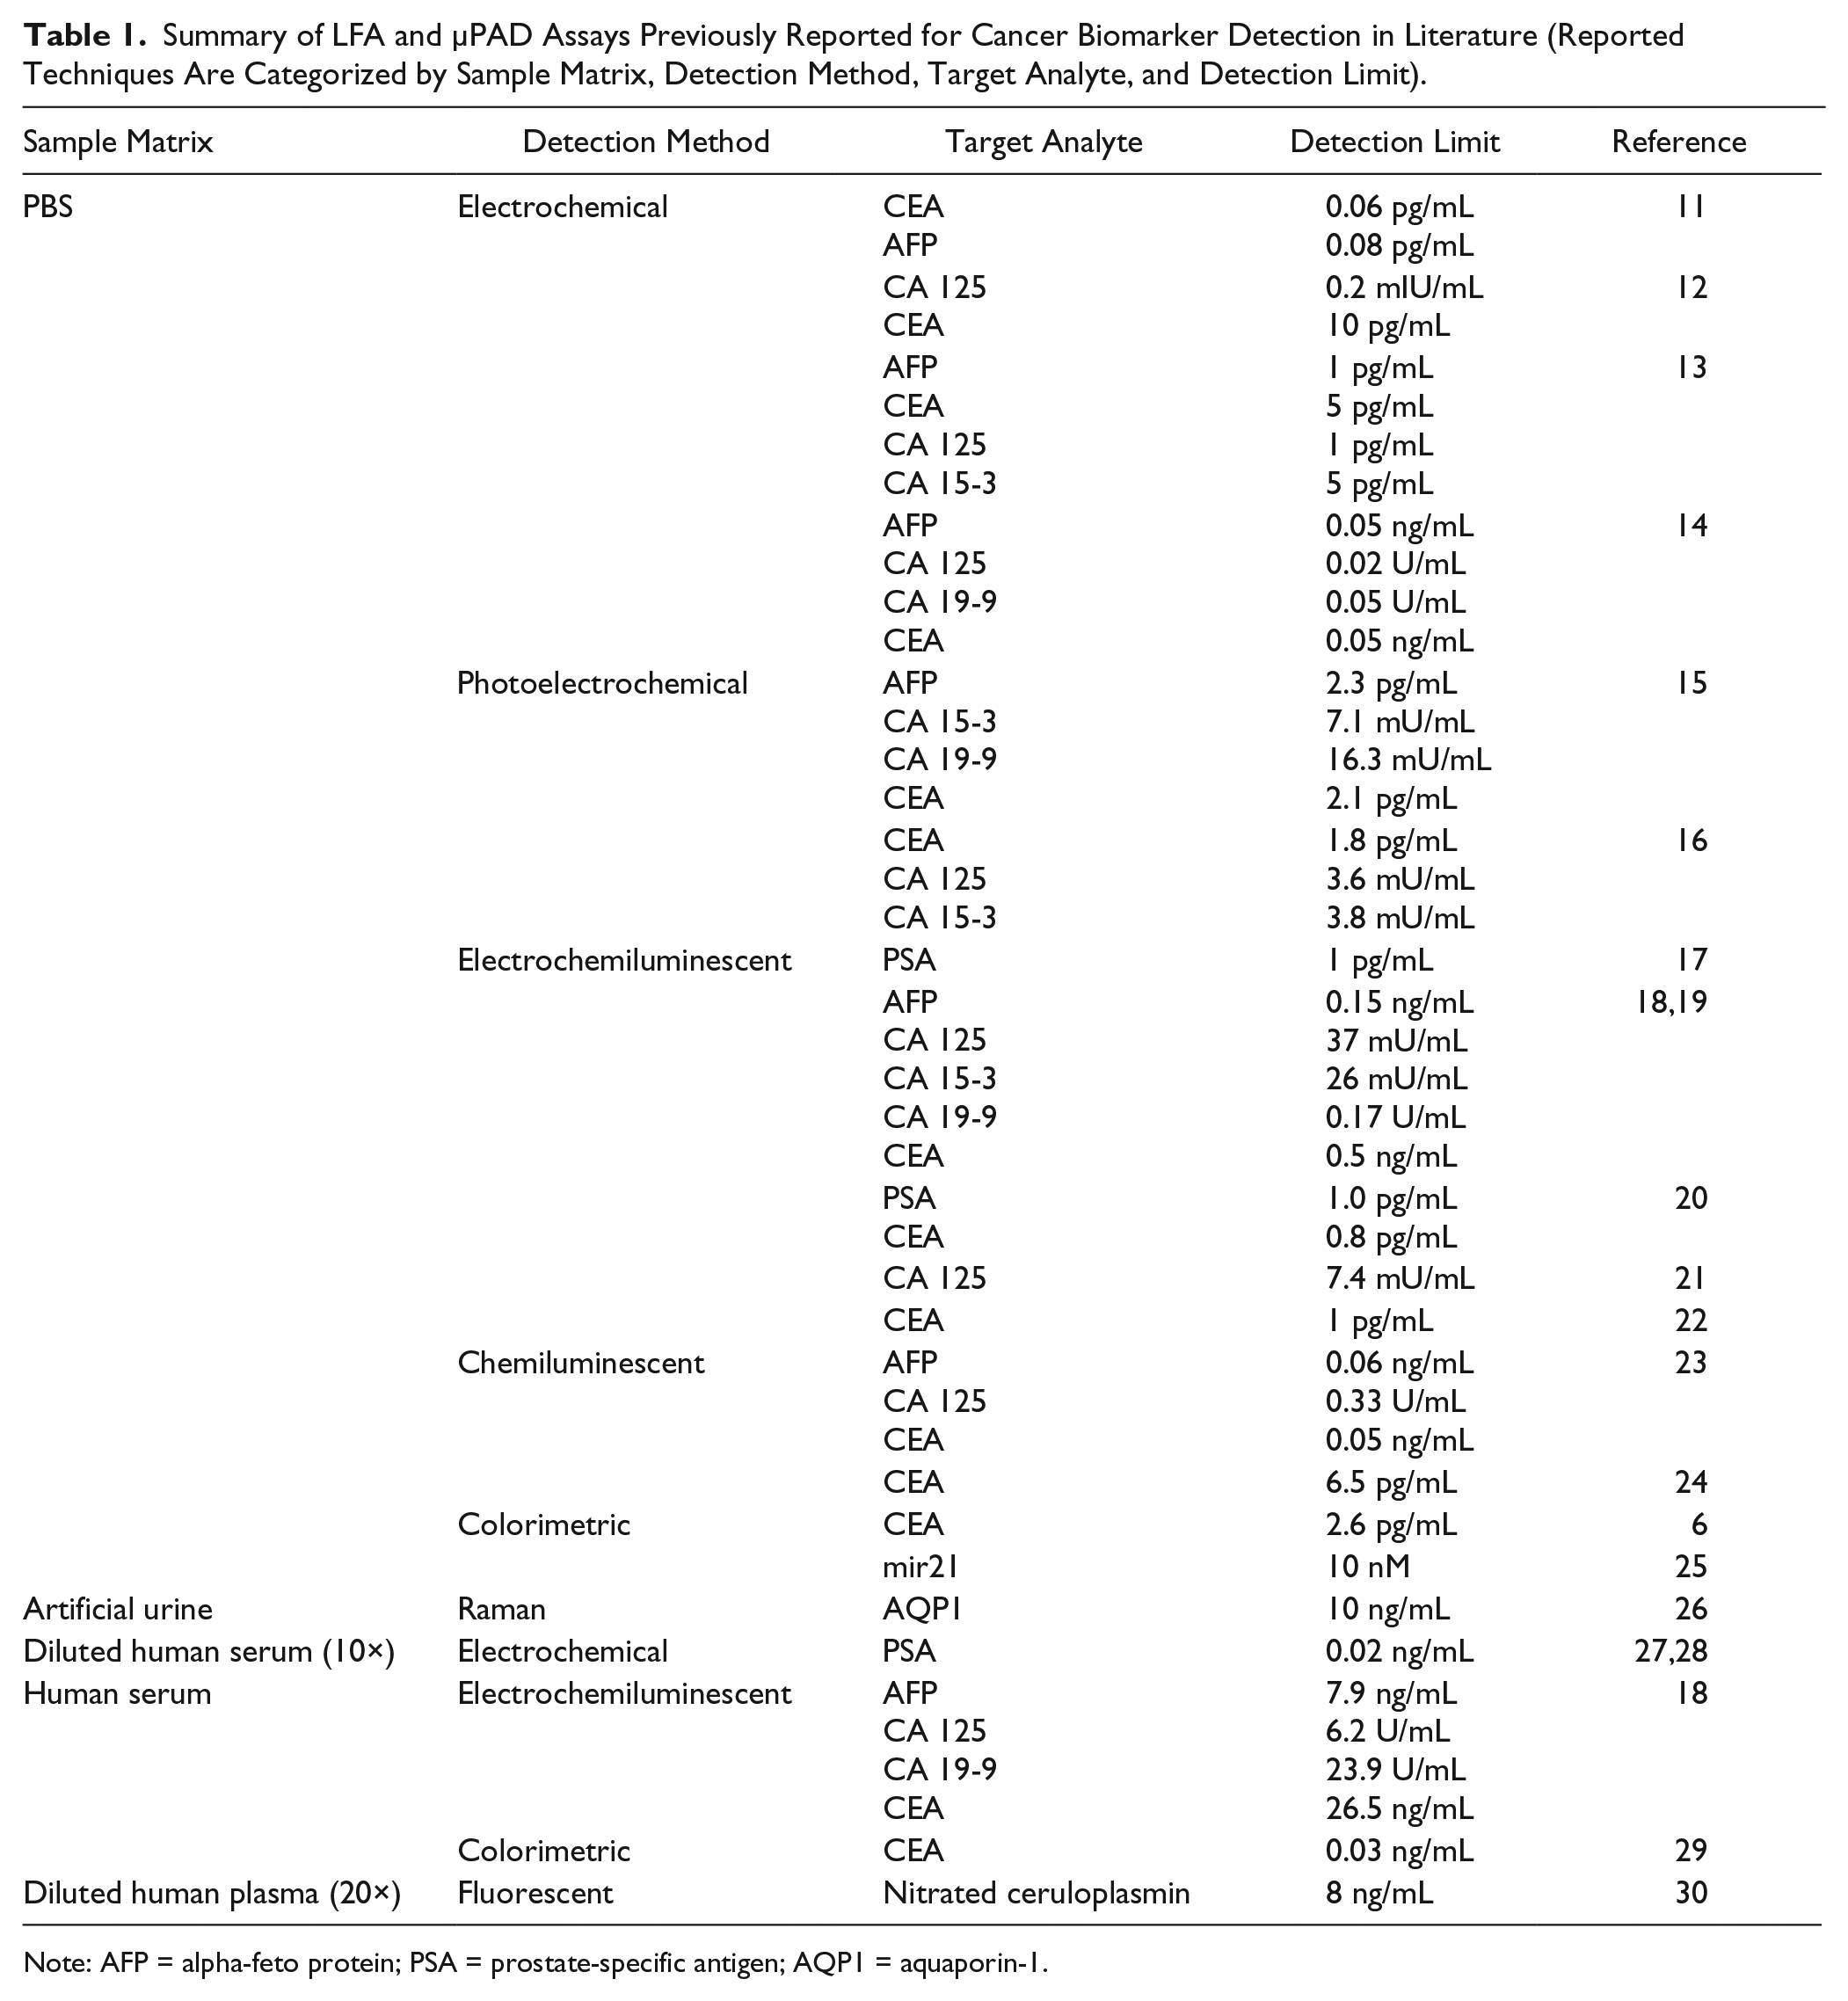
Note: AFP = alpha-feto protein; PSA = prostate-specific antigen; AQP1 = aquaporin-1.
Previously, bacterial detection and quantification of a single species were realized by analyzing the angle-specific Mie scatter signal from immunoagglutinated polystyrene particles in a polydimethyl siloxane (PDMS)–based LOC device, as well as on a μPAD.31–34 This particular method enabled a very low level of detection, typically at 10 colony-forming units (CFUs; roughly corresponding to 10 viable cells) per milliliter of sample, with essentially a one-step reaction toward the near-real-time assay (less than 5 min per assay). While this method has successfully been demonstrated for assaying bacteria from myriad samples, there exists a limitation of using this method for complex sample matrices, such as whole blood or serum, on a μPAD platform. The differences in scattering intensities were merely 5%–10% between the negative and positive samples from a μPAD,33,34 since the paper substrate is not optically transparent; thus, backscattering should be measured, which is substantially weaker than forward scattering. In PDMS-based LOC devices, however, stronger forward scattering can be used, generating bigger differences in scattering intensities (10%–30%).31,32 With simple sample matrices, such as bacterial culture media, urine, or wastewater, such small intensity differences (5%–10%) could still be identified through using an appropriate negative control and normalizing the scattering intensities.33–35 With whole blood or serum, however, sample-to-sample variations are too significant to be efficiently normalized and thus are eliminated.
In this study, a one-step immunoagglutination assay for CEA and CA 19-9 in water, water with 5% bovine serum albumin (BSA), 10% diluted human whole blood, or undiluted human blood serum is described. Fluorescence scattering detection is the main sensing modality, contrary to the elastic Mie scatter detection in our previous work.31–34 Submicron-sized fluorescent polystyrene particles are used with ultraviolet (UV) excitation and blue/red emission, which helps isolate target signals from incident light in the presence of sample matrices (blood and serum). They should still exhibit the angle-specific Mie scattering characteristics, since their submicron sizes are comparable to the wavelengths of incident and scattered light. To make a distinction, we will refer to this new method as “fluorescence scattering” and the previous method as “elastic Mie scattering.” A single light source (UV light-emitting diode [LED]) is used to excite two different fluorescent particles, which enables the potential for a multiplex assay. In addition, UV excitation generates much stronger fluorescence scatter signals due to their shorter wavelength and thus higher energy. The analytical performance of this one-step procedure is tested for the clinically relevant ranges of both biomarkers (CEA and CA 19-9).
Materials and Methods
CEA and CA 19-9 Samples
All reagents were of the highest purity available and directly used for the assay without further purifications. All solutions were prepared using deionized water (18 MΩ cm). The CEA standards (cat. A01442H, Meridian Life Science, Inc. Memphis, TN) were prepared with deionized water, deionized water with 5% (w/v) BSA, diluted (10% v/v) human whole blood (heparinated; ZenBio, Inc., Research Triangle Park, NC), and undiluted human stripped blood serum screened and found negative for serology disease-state markers (Valley Biomedical Products and Services, Inc., Winchester, VA) in parallel dilutions (from 1 pg/mL to 10 ng/mL). The CA 19-9 standards (cat. A86199H, Meridian Life Science) were prepared with deionized water, deionized water with 5% (w/v) BSA, diluted (10% v/v) human whole blood, and undiluted human stripped blood serum in parallel dilutions (10 mU/mL to 50 U/mL). The volume of CEA and CA 19-9 solutions added to the human serum was less than 5%; hence, the CEA- and CA 19-9–spiked serum solutions were virtually undiluted.
Fabrication of μPAD
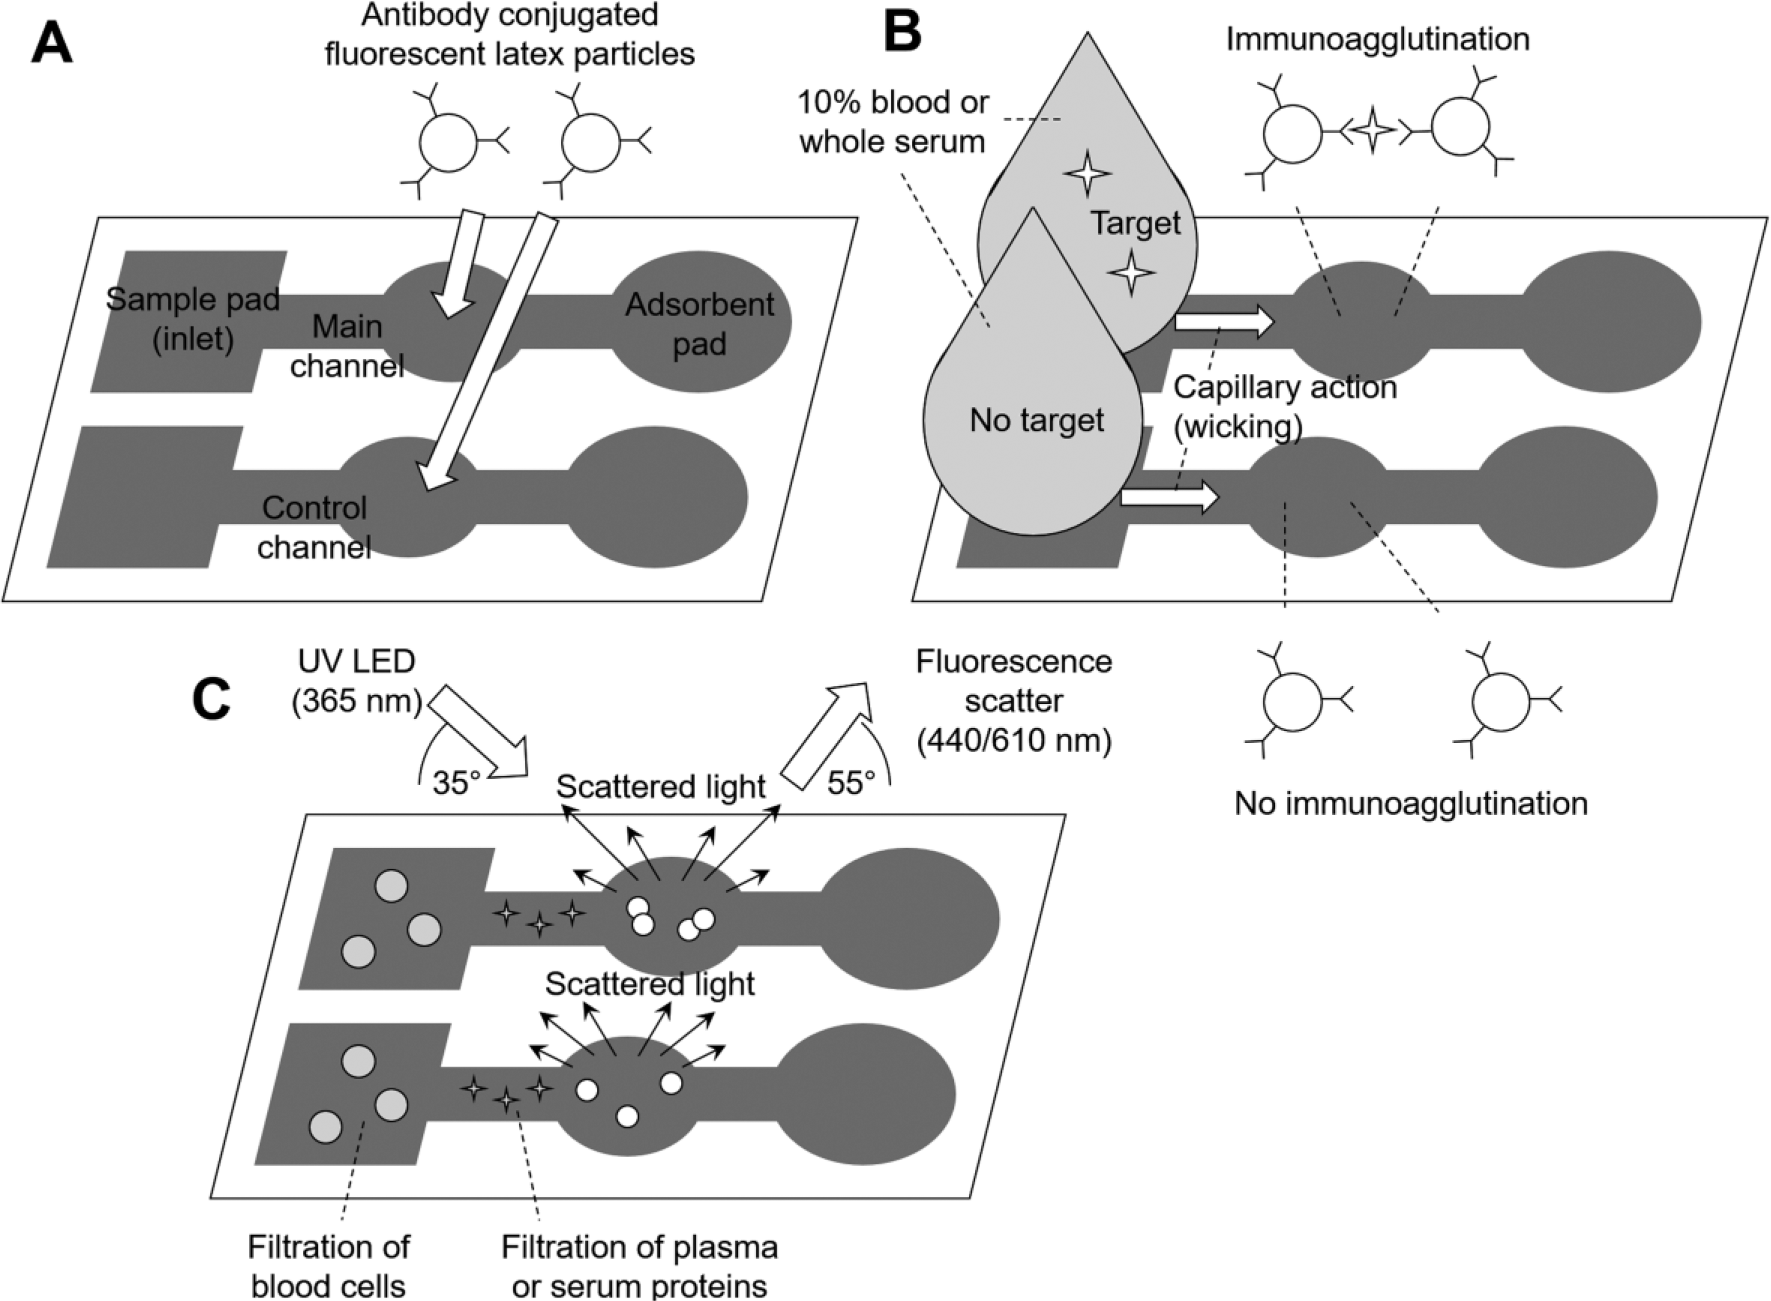
Photolithography was used to pattern microfluidic channels on paper.33,36 Cellulose chromatography paper (cut into 1 × 4 cm pieces, thickness = 100 μm, average pore size = 10 μm; GE Healthcare, Kent, UK) was impregnated with SU-8 2010 negative photoresist (Microchem, Westborough, MA) by dipping the paper into SU-8 solution (dissolved in photoresist thinner), baked on a hot plate, and then exposed to UV light through a transparency mask. Unpolymerized photoresist was removed from the paper through rinsing with acetone (Sigma-Aldrich, St. Louis, MO) and isopropyl alcohol (Sigma-Aldrich). Each channel consisted of a straight channel (2.5 × 21 mm) and an oval shape in the middle of the length to serve as a detection area where antibody-conjugated, fluorescent particles were loaded and detected, and another oval shape at the end of the length to serve as an absorbent pad ( Fig. 1 ).
Assay procedure. (
Covalent Antibody Conjugation to Particles
Human monoclonal capture and detection antibodies to CEA (cat. MAM02-009 and MAM02-007, Meridian Life Science) were used for CEA detection. Human monoclonal capture and detection antibodies to CA 19-9 (cat. M66107M and M66106M, Meridian Life Science) were used for CA 19-9 detection. Note that polyclonal antibodies have been used for all previous work of the elastic Mie scatter immunoagglutination assays in microfluidic platforms. The use of monoclonal antibodies to CEA and CA 19-9 in this work could improve the specificity of the assay, while possibly increasing the lower limit of detection and decreasing the dynamic range of the assay, since polyclonal antibodies can bind to multiple types of target’s epitopes, while monoclonal antibodies bind only to a single type of epitope.
Anti-CEA antibody was covalently conjugated to the blue fluorescent (350 nm excitation/440 nm emission), highly carboxylated, 1.0 μm diameter, polystyrene latex particles (cat. F8815, Life Technologies, Grand Island, NY). Anti–CA 19-9 antibody was covalently conjugated to the red fluorescent (340–370 nm excitation/610 nm emission), highly carboxylated, 0.20 μm diameter, polystyrene latex particles (cat. F20881, Life Technologies) for CA 19-9 detection. These two different fluorescent particles were purchased from the same vendor and can be excited with a single UV light source. Since the vendor did not provide these two particles at the same diameter, the largest-sized particles were chosen from their catalog to minimize the amount of antibody to fully cover the particle surface. Antibodies were covalently linked using the following procedure: particles were activated with 1-ethyl-3-(3-dimethylaminopropyl)-carbodiimide (cat. 22980, Thermo Fisher Scientific, Inc., Carlsbad, CA) and N-hydroxysulfosuccinimide (cat. 24510, Thermo Fisher Scientific) at room temperature in an activation buffer, 50 mM 2-(N-morpholino) ethanesulfonic acid (MES; Sigma-Aldrich) at pH 6.0, and rotated for 30 min. The particle suspension was centrifuged and washed with MES buffer two times at 14,200 g. After the final run, the particles were resuspended in activation buffer and incubated with antibody for 2.5 h at room temperature. A solution with ethanolamine was incubated for 30 min to quench the reaction at room temperature. The protein-labeled particle suspension was centrifuged and washed with PBS a total of three times. After the final centrifuge, the particles were resuspended in a storage buffer of water with 1% BSA and 2 mM sodium azide, and stored at 4 °C before the assays.
Assay Procedure
The particles were soft centrifuged (i.e., at lower rpm than the normal rinsing step) to remove nonspecifically aggregated particles during the conjugation protocol. Equal volumes of capture antibody-conjugated and detection antibody-conjugated particles were combined. The final concentration of antibody-conjugated particles was 1% (w/v). The volume of particle suspension loaded in each paper microfluidic channel was 3.0 μL ( Fig. 1A ). All paper channels were dried at room temperature for 7 min prior to use. The initial fluorescence intensity was measured with a miniature spectrometer (USB4000, Ocean Optics, Inc., Dunedin, FL) after particles had dried.
Each CEA-spiked or CA 19-9–spiked deionized water, deionized water with 5% BSA, 10% diluted whole blood, or undiluted human serum sample was loaded on the inlet of the paper channel. Capillary action spontaneously drew the sample through the channel ( Fig. 1B ). The negative control for each experiment was performed by running a sample matrix solution (water, water + BSA, blood, or serum) without antigen through the channel. Fluorescence detection was performed using a miniature spectrometer 1 min after sample loading ( Fig. 1C ).
Spectroscopic Detection and Data Analysis
A three-axis angle positioning stage was assembled and used for assay testing. One end of a bifurcated fiber-optic cable connected to a 365 nm UV LED light source (AAP63, Seoul VioSys Co., Ltd., Ansan, South Korea) was used to align the detection area with the probe, and the other end of the fiber optic was connected to a miniature spectrometer (USB4000, Ocean Optics) to measure fluorescence. A 365 nm UV LED can excite both 1.0 µm blue fluorescent particles (350 nm excitation) and 0.20 µm red fluorescent particles (340–370 nm excitation). The particles were chosen based on the separation difference between the emission of the UV LED light source and the emission of the fluorescent particles. In order to accurately measure the change in fluorescent scattering, the peaks between the light source and particles must be well resolved. The optimum angles were determined by calculating the greatest increase in signal intensity at 440 nm after blue fluorescent particles were loaded and dried on the channel. The probe end of the detector fiber optic was positioned 145° from the incident UV light ( Fig. 1C ). The μPAD was positioned 55° from the UV incident light or 90° from the detector fiber optic ( Fig. 1C ). These angles were optimized from a series of experiments, varying the angles at 5° increments ( Suppl. Material S1 ). The paper channel was placed 1 cm vertically from the end of the detection probe. The intensity spectrum of the fluorescent particles was recorded before (background signal) and 1 min after (sample signal) the samples were loaded. The spectra were analyzed in a computer that was connected to a miniature spectrometer (USB4000, Ocean Optics). For the anti-CEA-conjugated particles, the region between 400 and 500 nm was used to analyze the blue fluorescent scatter intensity. For the anti–CA 19-9–conjugated particles, the region between 600 and 700 nm was used to analyze the red fluorescent scatter intensity.
After the particles were preloaded and dried in the oval in the middle of the channel, a “background intensity” (represented with subscript B) from each channel was taken. After the antigen-spiked samples had flowed through the detection area, a “sample intensity” (represented with subscript S) from each channel was recorded. The background-normalized signal for a given sample was IS/IB. Each sample intensity measurement was always paired with a zero-concentration measurement (i.e., no target in water, water + BSA, blood, or serum; represented with subscript 0). The background-normalized signal for zero-concentration sample was (IS/IB)0. Channel-to-channel variation and the effect of particle loading conditions were canceled out through this first normalization step.
A second normalization step was performed by dividing the background-normalized sample signal with that of the zero-concentration sample, that is, (IS/IB)/(IS/IB)0. Batch-to-batch variation among the particles was eliminated through this step. Since the zero-concentration measurements were made every time the sample measurements were made, the zero-concentration data should also have a standard error, enabling statistical comparison between the zero and nonzero data. In addition, since each intensity value was normalized to a single reference value, errors were not propagated during double normalization.
A series of double-normalized intensity values were obtained for different concentrations of CEA and CA 19-9. An F test was used to determine if the variances between the control and sample were equal. Then, a paired t test was performed in order to calculate a p value, which was used to determine whether the double-normalized intensity at a given concentration was statistically significant compared with the control. All t tests were two-tailed and heteroscedastic. All data points represent the averages from three different experiments, each time using different μPADs preloaded with antibody-conjugated particles, but using the same target solution (hence no error bars in the x axis). Error bars represent standard errors of the means. Linear regression analyses were also performed for all assays to obtain linear fitting equations and R2 values.
Microscopic Observations
Fluorescence microscopic images of the anti-CEA-conjugated particles on a glass slide were taken in order to observe the changes in aggregation in the absence and presence of CEA in serum. Three microliters of anti-CEA-conjugated particles in water was placed on a clean glass slide and allowed to dry. Microscopic images were taken 1 min after adding 12 µL of undiluted serum and 10 ng/mL CEA in serum. A UV filter cube was used to excite the particles at 380 nm.
Scanning electron microscope images of the anti-CEA-conjugated particles loaded and dried on the paper microfluidic channel were taken in order to observe the aggregation in the absence and presence of CEA in serum. Three microliters of anti-CEA-conjugated particles in water was placed in the center of μPAD. When the channel was fully dry, 12 µL of serum either with or without 10 ng/mL CEA was loaded onto the inlet and allowed to completely fill the channel. Once the channel was completely dry, the μPAD was sputter coated with platinum, adhered to a conductive carbon tab, and imaged in a Hitachi S-4800 Field Emission SEM under high vacuum.
Results
Spectral Response of Fluorescent Polystyrene Particles
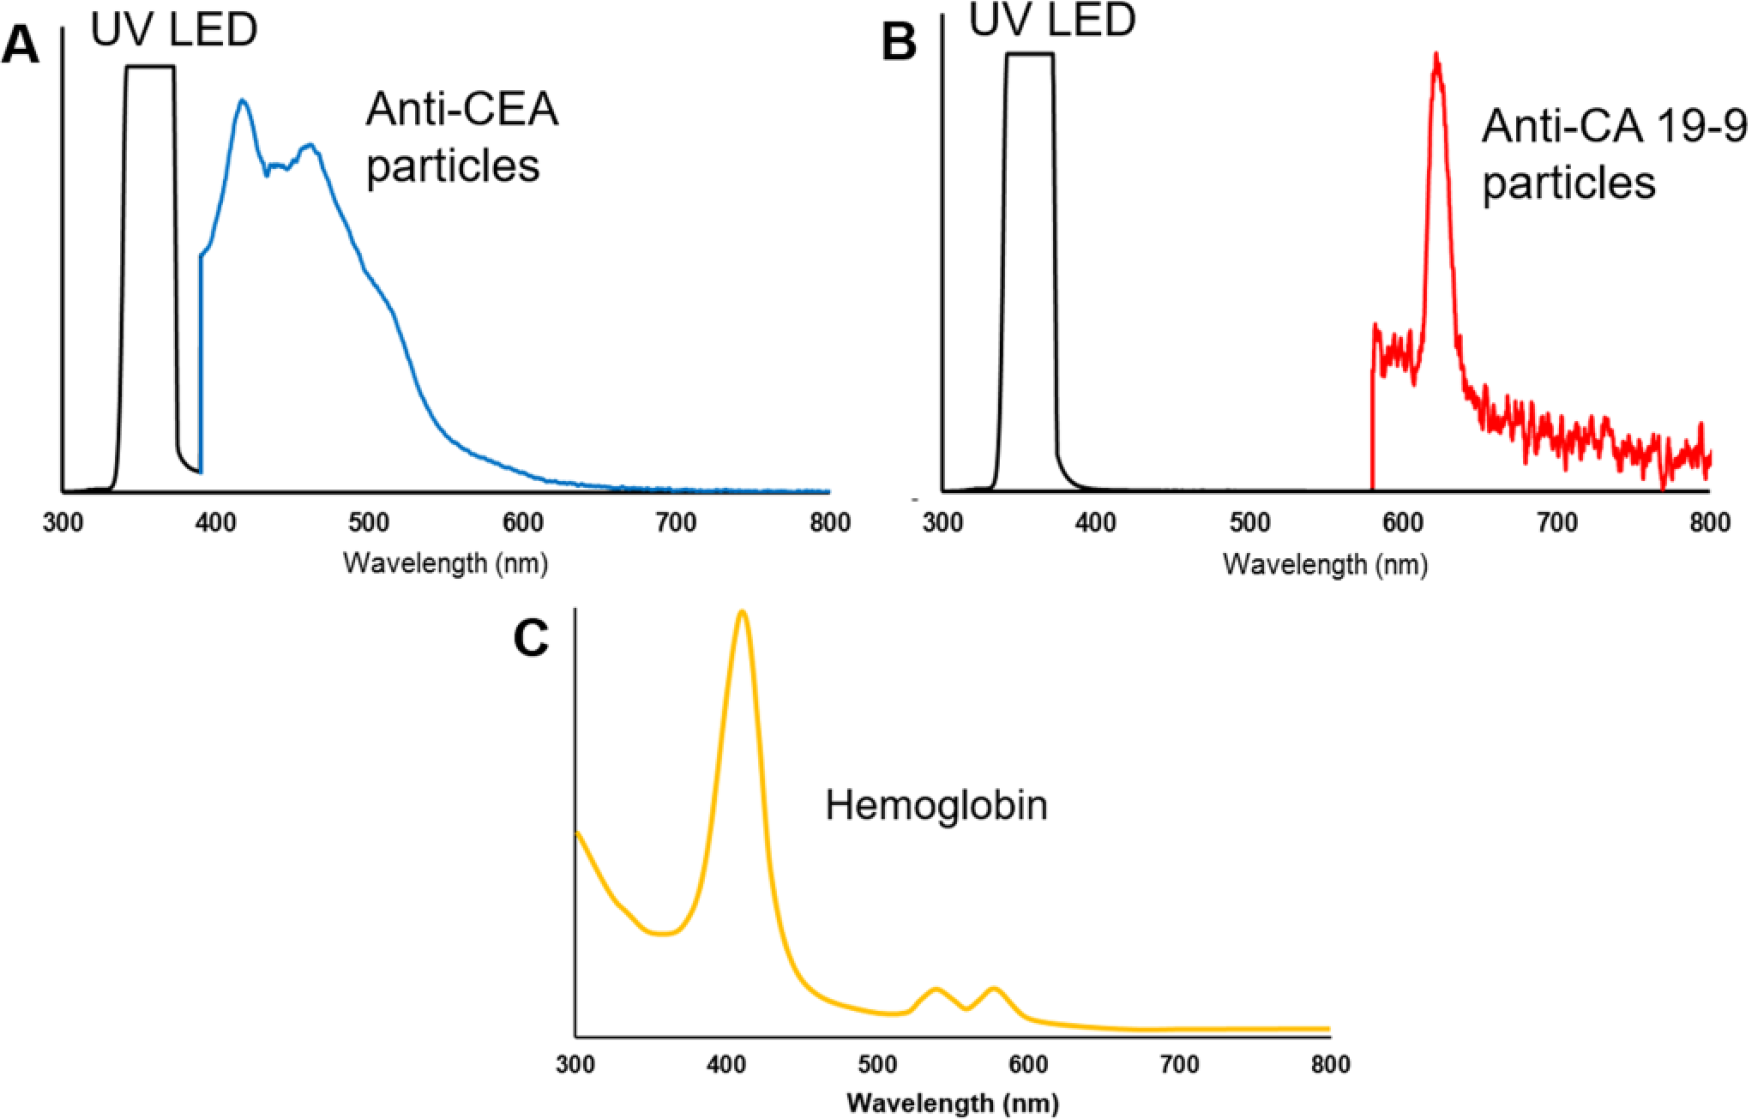
Figure 2A shows the fluorescence emission spectrum of the anti-CEA-conjugated fluorescent particles (3 μL of 1% suspension) loaded and dried on the detection zone of the paper microfluidic channel. Elastic scattering of the UV light off of the cellulose fibers results in the broad, saturated peak around 365 nm. Fluorescent scattering of the anti-CEA-conjugated particles results in the peak with a maximum at 440 nm. The fluorescent scattering peak is shown 46 times greater than the values recorded on the spectrometer.
(
Figure 2B shows the fluorescence emission spectrum of the anti–CA 19-9–conjugated fluorescent particles (3 μL of 1% suspension) loaded and dried on the detection zone of the paper microfluidic channel. Elastic scattering of the UV light off of the cellulose fibers results in the broad, saturated peak around 365 nm. Fluorescent scattering of the anti–CA 19-9–conjugated particles results in the peak with a maximum at 610 nm. Again, the intensities of the fluorescent scattering peak are multiplied by a factor of 75.
Figure 2C shows the absorbance spectrum of 0.25 mg/mL hemoglobin (primarily met-hemoglobin) in a 1 cm path length cuvette using a spectrophotometer, indicating very strong absorption in violet color (peak at 405 nm), significant absorption in green color (peaks at 540–580 nm), reduced absorption in blue color, and very weak absorption in red color. Fluorescence emissions of anti-CEA-conjugated (440 nm blue color) and anti–CA 19-9–conjugated particles (610 nm red color) can therefore be detectable in the presence of hemoglobin, and thus whole blood. While hemoglobin does absorb some of the 365 nm UV incident light, its absorption is significantly weaker than short-wavelength UV (UV-B and UV-C) and violet color (peak at 405 nm); thus, it allows 365 nm UV excitation to pass through the sample matrix. In addition, the intensity of UV LED is orders of magnitude stronger than the fluorescent emissions or hemoglobin absorption, which is sufficient to be used for exciting fluorescent particles in the presence of whole blood or serum.
CEA Detection
Figure 3 shows the results with μPAD detection of CEA from deionized water, deionized water with 5% BSA, 10% diluted whole human blood, and undiluted human blood serum. Each data point represents the average from three different experiments, each time using a different μPAD preloaded with antibody-conjugated particles, but using the same target solution. The following CEA concentrations were tested: 1 pg/mL, 10 pg/mL, 0.1 ng/mL, 1 ng/mL, 4 ng/mL, and 10 ng/mL, where the CEA concentration of 4 ng/mL has typically been used to diagnose/prognose cancer. For the CEA assay with water, the maximum double-normalized blue fluorescence scattering intensity was 1.41 ± 0.08, which is significantly higher (p < 0.05) than that with the elastic Mie scatter detection of Escherichia coli using a similar μPAD platform, 1.067 ± 0.003 (or 6.7% difference),33,34 presumably due to the use of fluorescence scatter. The normalized intensities increased up to 0.1 ng/mL, followed by a decrease, indicating that the linear range of the assay is up to 0.1 ng/mL. For this linear region, linear regression analysis was performed with the fitting equation of y = 0.1176x + 1.1237 and an R2 value of 0.8107, where y is the double-normalized intensity and x is the log10 CEA concentration in picograms per milliliter. All CEA assays with deionized water passed the t tests (two-tailed and heteroscedastic) in comparison with the 0 pg/mL result (p < 0.05), and thus the detection limit was 1 pg/mL.
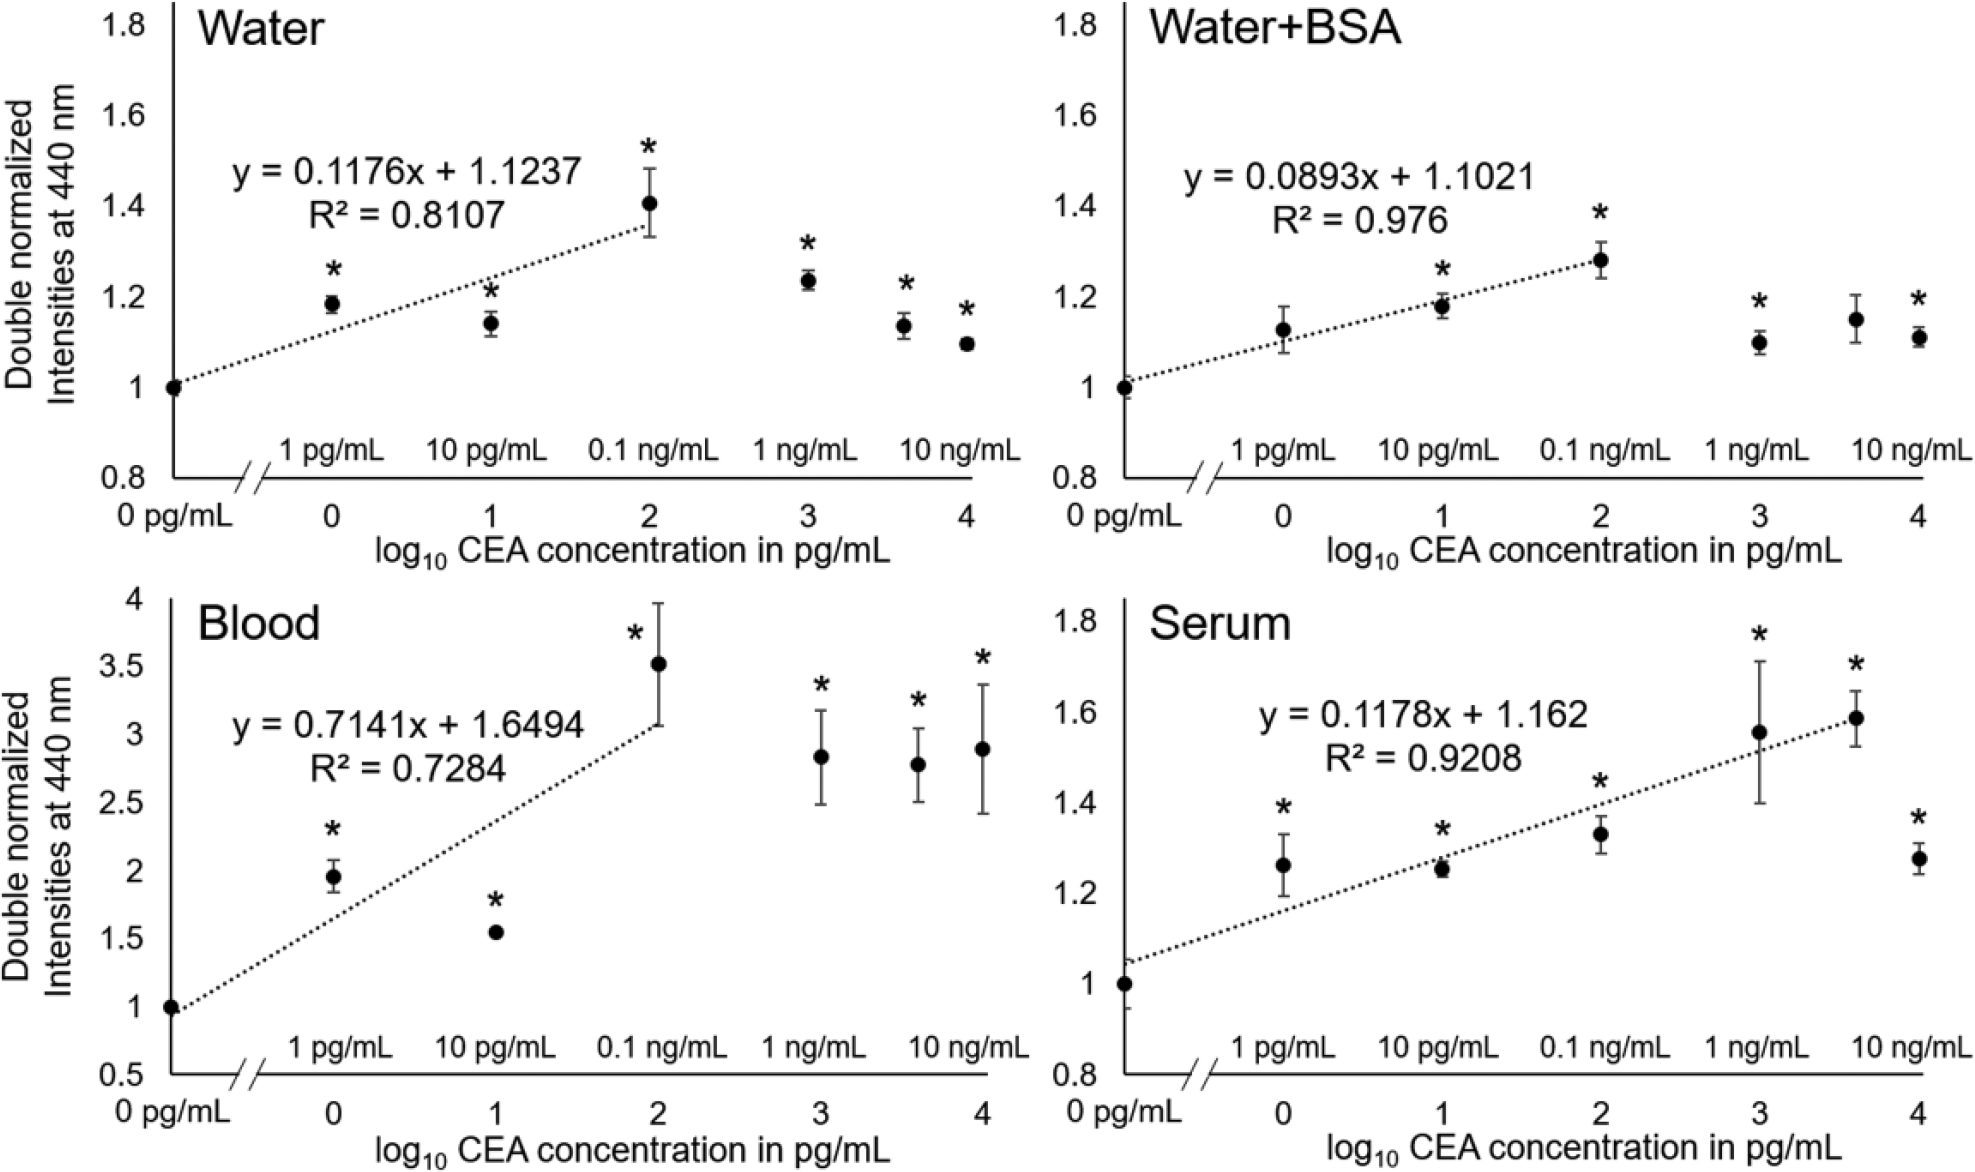
Results of μPAD CEA assay in deionized water, deionized water with 5% (w/v) BSA, 10% (v/v) diluted human whole blood, and undiluted human blood serum. Fluorescent scatter intensities were measured at 440 nm and double normalized. Average of three different experiments, each time using different μPADs. Error bars represent standard errors of the mean. * represents substantial difference from the zero-concentration sample in each different sample matrix (water, water + BSA, blood, and serum) with p < 0.05.
The experiments were repeated with deionized water containing 5% (w/v) BSA. The maximum normalized intensity was about 1.28 ± 0.04, which is slightly smaller than those with water, diluted blood, and undiluted serum. There was a region of increasing double-normalized intensities up to 0.1 ng/mL CEA, followed by a decrease. This mirrored the trend obtained using deionized water as the sample matrix. The linear equation was y = 0.0893x + 1.1021 and the R2 value was 0.976. The double-normalized intensities behaved the most linearly than any other sample matrices, with a higher R2 value and overall smaller standard error. The results indicate that the BSA had some stabilizing effect on the immunoagglutination assay. All concentrations except for the 1 pg/mL and 4 ng/mL samples were significantly different from the control based on the above-mentioned t tests (p < 0.05). These two concentrations may have passed significance if there had been less variance in the double-normalized intensities.
The same experiments were performed with diluted (10% v/v) human whole blood. The maximum normalized intensity was 3.51 ± 0.45, significantly higher (p < 0.05) than the elastic Mie scatter detection from μPAD (1.067 ± 0.003), as well as those with water, water + BSA, and serum. These amplified intensities contributed to the statistically significant results for all concentrations from the control based on the above-mentioned t tests (p < 0.05), and thus the detection limit of 1 pg/mL. However, the linear range was narrower, showing the maximum intensity at 0.1 ng/mL CEA. After this point, the double-normalized intensities remained about the same. For this linear region, linear regression analysis was performed with the fitting equation of y = 0.7141x + 1.6494 and an R2 value of 0.7284. This relatively narrower linear relationship can be attributed to the presence of blood cells and proteins that could interact with the particles.
Finally, the experiments were repeated with undiluted human blood serum. All sample dilutions containing CEA were significantly different from the control (p < 0.05), following the same t tests. The maximum intensity was 1.58 ± 0.06, again significantly higher (p < 0.05) than the Mie scatter detection from μPAD (1.067 ± 0.003) and similar to those with water and water + BSA. The detection limit was 1 pg/mL. There was a linear relationship between the double-normalized intensity with increasing CEA concentration up to 4 ng/mL and the linear equation of y = 0.1178x + 1.162 and R2 = 0.9208. The intensity decreased at 10 ng/mL, indicating that this concentration is outside of the linear range.
Detection limits of CEA assays were 1 pg/mL with water, blood, and serum, and 10 pg/mL with water + BSA, which are substantially lower than a few nanograms per milliliter with the other LFA or μPAD cancer marker assays with serum.18,28,29
CA 19-9 Detection
Figure 4 shows the results with μPAD detection of CA 19-9 from deionized water, deionized water with 5% BSA, 10% diluted whole human blood, and undiluted human blood serum. Each data point represents the average from three different experiments, each time using a different μPAD preloaded with antibody-conjugated particles, but using the same target solution. The following CA 19-9 concentrations were tested: 10 mU/mL, 0.1 U/mL, 1 U/mL, 10 U/mL, 25 U/mL, and 50 U/mL, where the CA 19-9 concentration of 40 U/mL has typically been used to diagnose/prognose cancer. For the CA 19-9 assay with water, the maximum double-normalized red fluorescence intensity was 1.43 ± 0.07, which is significantly higher (p < 0.05) than that with the elastic Mie scatter detection of E. coli using a similar μPAD platform, 1.067 ± 0.003,33,34 again due to the use of fluorescence scatter. There appears to be a linear region up to 10 U/mL, with the linear equation of y = 0.1111x + 0.9994 and R2 = 0.8995. The samples containing 1, 10, and 25 U/mL CA 19-9 passed the t test compared with the control, while the other concentrations were not significantly different from the control. The normalized intensities decreased for the higher concentrations of 25 U/mL and 50 U/mL, indicating that these concentrations are outside the linear range of the assay.
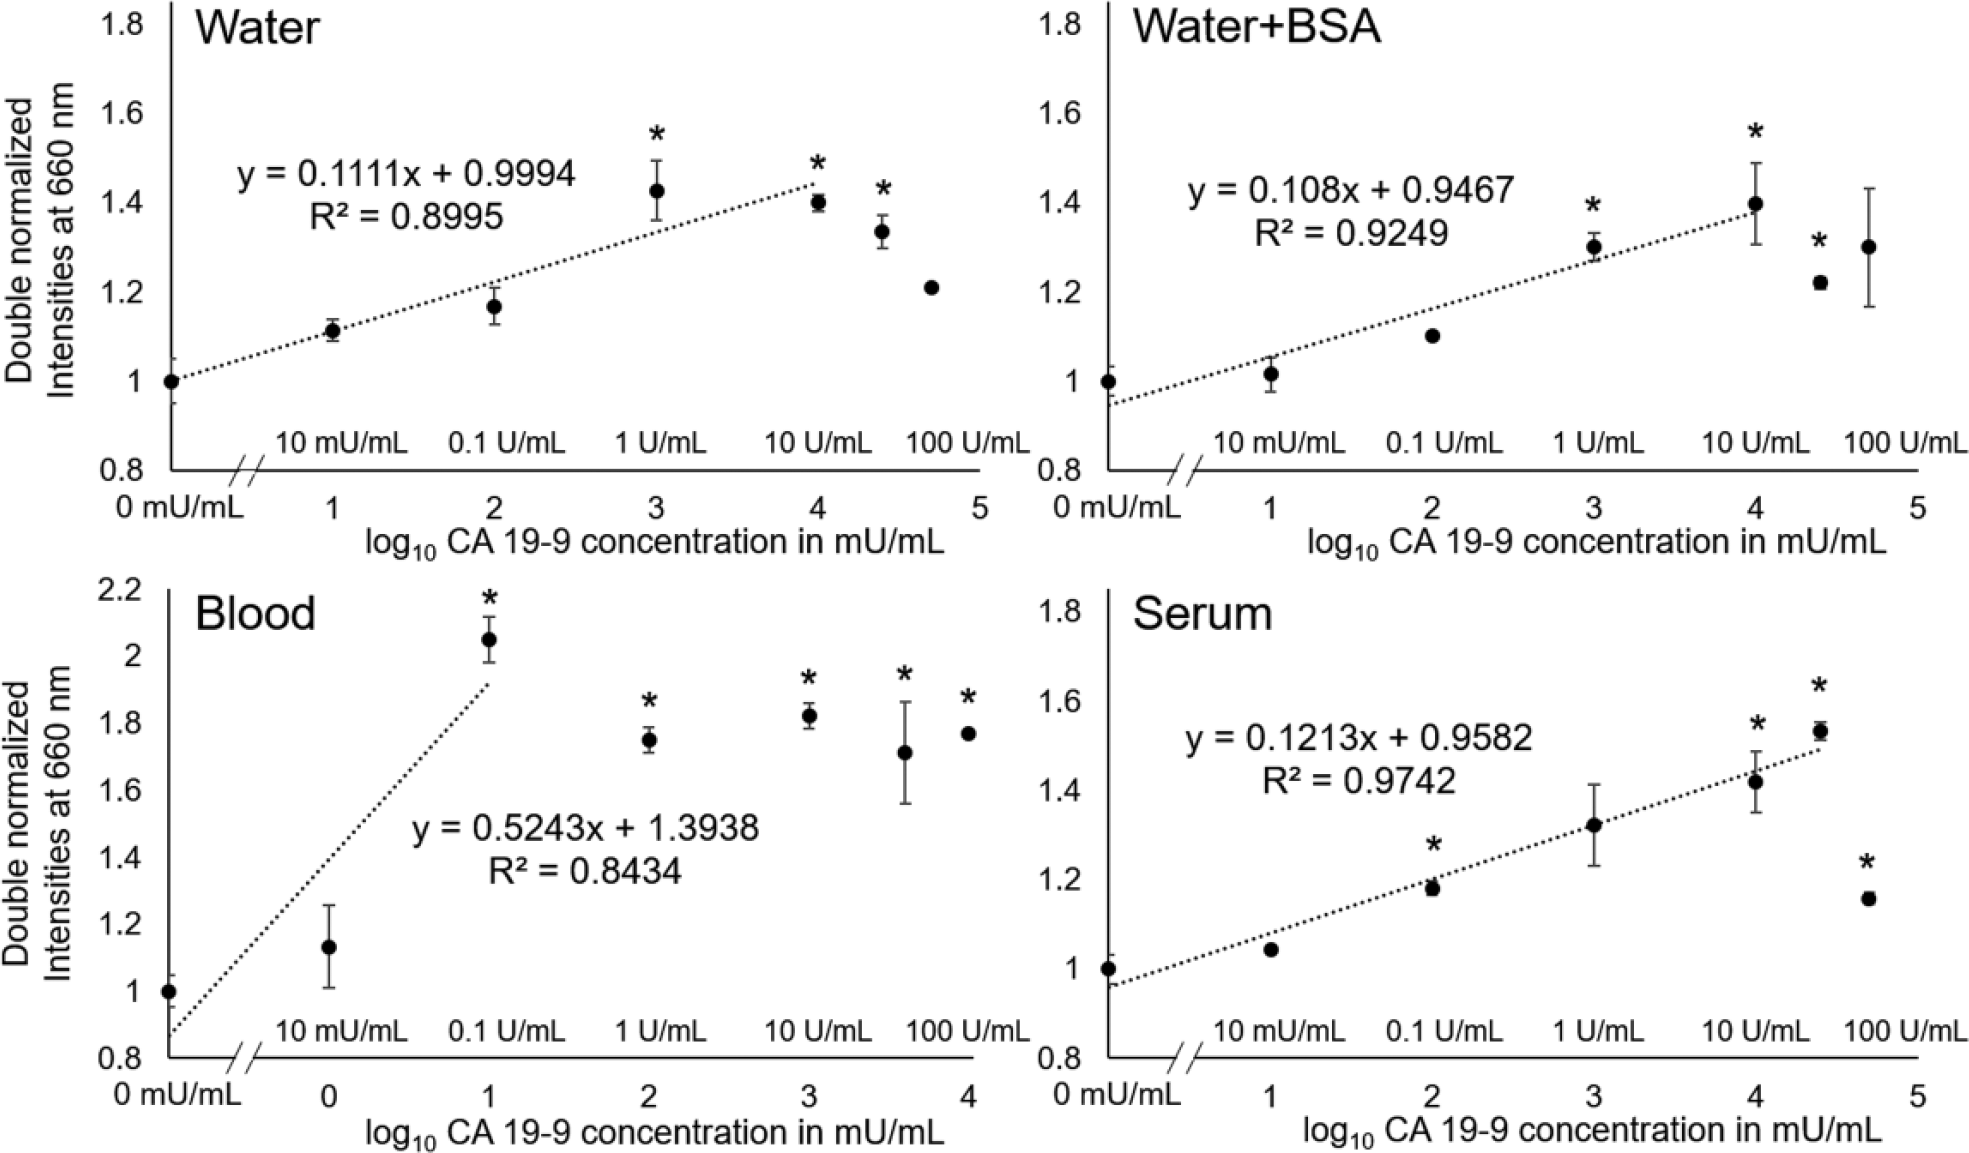
Results of μPAD CA 19-9 assay in deionized water, deionized water with 5% (w/v) BSA, 10% (v/v) diluted human whole blood, and undiluted human blood serum. Fluorescent scatter intensities were measured at 660 nm and double normalized. Average of three different experiments, each time using different μPADs. Error bars represent standard errors of the mean. * represents substantial difference from the zero-concentration sample in each different sample matrix (water, water + BSA, blood, and serum) with p < 0.05.
The experiments were repeated with deionized water containing 5% (w/v) BSA. The maximum normalized intensity was 1.39 ± 0.09, which is similar to those with water and undiluted serum. There is a linear region up to 10 U/mL with the linear equation of y = 0.108x + 0.9467 and an R2 value of 0.9249. Again, BSA seemed to have some stabilizing effect, as the R2 value was higher and the standard errors were overall smaller than those with deionized water. The normalized intensities decreased for the higher concentrations of 25 and 50 U/mL, indicating that these concentrations fall outside of the linear range of the assay. Compared with the control, the concentrations of 1, 10, and 25 U/mL passed the above-mentioned t tests (p < 0.05), while the other concentrations did not.
The same experiments were performed with diluted (10% v/v) human whole blood. The maximum normalized intensity was 2.04 ± 0.07, again significantly higher (p < 0.05) than that of the elastic Mie scatter detection (1.067 ± 0.003).33,34 There appears to be a narrow linear range up to 0.1 U/mL, followed by a plateau or a saturated response up to 50 U/mL. The linear equation was y = 0.5243x + 1.3938 and the R2 value was 0.8434, indicating a relatively poor linear relationship between double-normalized intensity and CA 19-9 concentration. Statistically meaningful results could be obtained from 0.1 U/mL (detection limit) to 10 U/mL using the above-mentioned t tests (p < 0.05).
Finally, the experiments were repeated with undiluted human blood serum. All dilutions containing CA 19-9 were significantly different than the control (p < 0.05, using the above-mentioned t tests) except for the concentrations of 10 mU/mL and 1 U/mL. The detection limit was 0.1 U/mL with undiluted serum, which is lower than a few tens of U/mL with diluted serum on LFA or μPAD. 18 There exists a linear range up to 25 U/mL, with the maximum intensity of 1.53 ± 0.02, similar to those with water and water + BSA, followed by a decrease at 50 U/mL. The linear equation was y = 0.1213x + 0.9582 and the R2 value was 0.9742, indicating a very strong linear relationship.
While no work has been reported in quantifying CA 19-9 from diluted human blood on LFA or μPAD, this assay platform provides a lower limit of detection of 0.1 U/mL with diluted blood and undiluted serum. Detection limits of other LFA and μPAD assays are a few tens of U/mL with diluted plasma or diluted serum, and those with PBS are 16.3 mU/mL to 0.17 U/mL ( Table 1 ).14,15,18,19
Multiplex Detection
This μPAD has the potential for multiplex detection using a single UV LED light source that can excite both fluorescent particles that produce distinct emission spectra. By loading the blue and red fluorescent particles in the same particle loading zone, the assays for CEA and CA 19-9 in a complex sample can be completed in a single run.
Figure 5 shows the results with µPAD multiplex detection of CEA and CA 19-9 from deionized water, deionized water with 5% BSA, 10% diluted human whole blood, and undiluted human serum. Channels were preloaded with both anti-CEA-conjugated particles (440 nm blue fluorescence) and anti–CA 19-9–conjugated particles (610 nm red fluorescence), and assayed for a negative control (just sample matrix), 10 ng/mL CEA in varying sample matrix, and 50 U/mL CA 19-9 in varying sample matrix. These concentrations represent abnormal ranges of CEA and CA 19-9, since 4 ng/mL CEA and 40 U/mL CA 19-9 have been used to diagnose/prognose cancer, as described previously. All channels were excited with a single UV LED light source (365 nm), which excited both types of fluorescent particles at the same time.
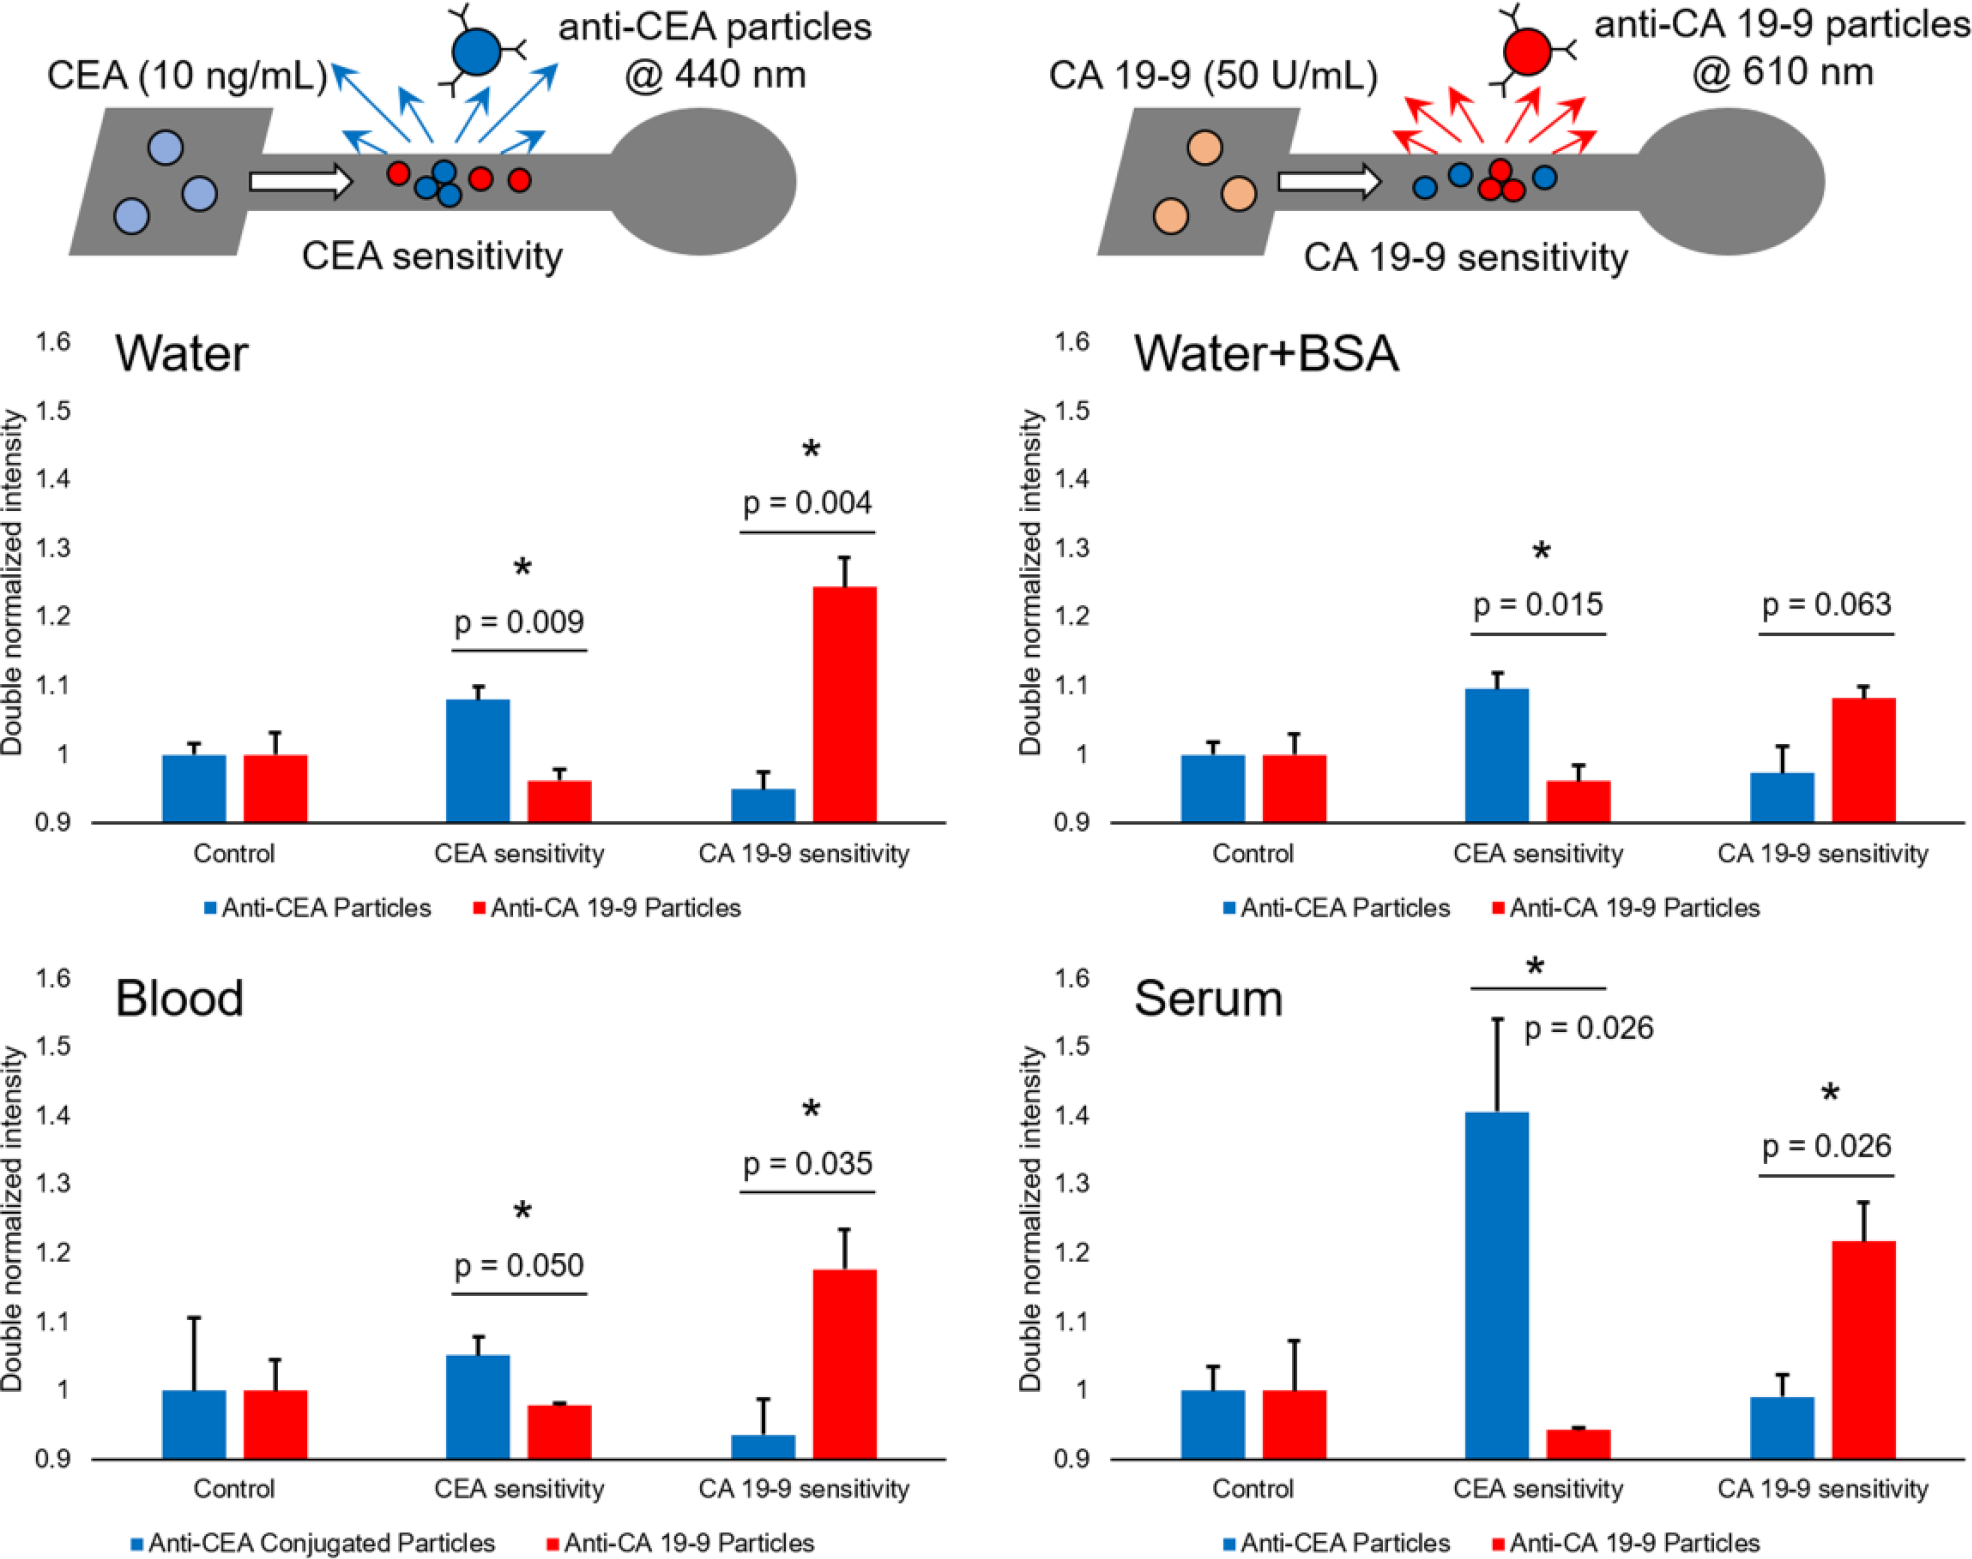
Results of μPAD multiplexed assays in deionized water, deionized water with 5% (w/v) BSA, 10% (v/v) diluted human whole blood, and undiluted human blood serum. Each channel was preloaded with both the blue fluorescent (440 nm emission), anti-CEA-conjugated particles and the red fluorescent (610 nm emission), anti–CA 19-9–conjugated particles. All particles were excited by a single UV LED light source (365 nm). Assays were performed for a negative control (sample matrix only), 10 ng/mL CEA in varying sample matrix, and 50 U/mL CA 19-9 in varying sample matrix. Average of three different experiments, each time using different μPADs. Error bars represent standard errors of the mean. * represents the substantial difference in blue and red normalized intensities from a single channel in each different sample matrix (water, water + BSA, blood, and serum) with p < 0.05.
For multiplex assays performed in deionized water, there was no statistical difference between the blue and red fluorescence scattering intensities (double normalized) (p > 0.05) for the control samples, while there were significant differences between them (p < 0.05) for assaying both 10 ng/mL CEA and 50 U/mL CA 19-9. The red fluorescence (from anti–CA 19-9 particles) was substantially lower and close to 1 with 10 ng/mL CEA, and the blue fluorescence (from anti-CEA particles) was also substantially lower and close to 1 with 50 U/mL CA 19-9. This indicates that CEA and CA 19-9 did not cross-react with the alternatively labeled antibody-conjugated particles.
For multiplex assays performed in deionized water with 5% (w/v) BSA, the overall assay results are almost identical to those performed in deionized water. There was no statistical difference (p > 0.05) between two fluorescence scattering intensities for the control samples, while significant differences were observed for assaying 10 ng/mL CEA and 50 U/mL CA 19-9 (p < 0.05). However, the normalized intensities were attenuated, and the t test failed for the CA 19-9 assay, although its p value of 0.063 is close to 0.05. Again, the red fluorescence for the CEA assay and the blue fluorescence for the CA 19-9 assay were both close to 1, indicating no significant cross-reactions.
For multiplex assays performed in diluted (10% v/v) human whole blood, the overall assay results are similar to those performed in water, despite the augmented complexity of the sample matrix. There was no statistical difference (p > 0.05) between the two fluorescence scattering intensities for the control samples, while there were significant differences for assaying both 10 ng/mL CEA and 50 U/mL CA 19-9 (p < 0.05). The results also indicate that there were no significant cross-reactions with the alternatively labeled antibody-conjugated particles.
For multiplex assays performed in undiluted human serum, the overall assay results are similar to those performed in water and blood, while showing increased signal intensities with better statistics. There was no statistical difference (p > 0.05) between two fluorescence scattering intensities for the control samples, while significant differences were observed for assaying 10 ng/mL CEA and 50 U/mL CA 19-9 (p < 0.05). Again, the red fluorescence for the CEA assay and the blue fluorescence for the CA 19-9 assay were both close to 1, indicating no significant cross-reactions.
Discussion
Previous research has supported that immunoagglutination of antibody-conjugated particles in a μPAD platform provided a method of detecting and quantifying bacterial samples in clean and field water samples.33,37 This current work is an attempt to extend and make the assay adaptable to cancer markers directly from the more challenging sample matrices: human whole blood and human blood serum. In addition, fluorescence scattering detection was attempted, in contrast to the elastic Mie scatter detection in our previous attempts,31–33 with an aim to collect the higher normalized intensities from complex sample matrices.
For both CEA and CA 19-9 assays, a clinically relevant range of detection could be made (1–5 ng/mL and 10–50 U/mL, respectively) with human blood and serum, while the maximum normalized intensities (1.28–3.51) were significantly higher (p < 0.05) than that with Mie scatter detection (1.067). These higher normalized intensities can be attributed to the fact that only the fluorescence scattering signals were collected with this assay, while only a small increase in elastic Mie scatter was detected in previous studies. All assays with four different sample matrices showed a reasonable linear relationship between the double-normalized intensities and the target concentrations, followed by a decrease (a plateau in case of the assays with blood). This bell-shaped standard curve has been observed in multiple instances for the elastic Mie scatter detection of immunoagglutination assays.33,34,37 The high-concentration samples can easily be assayed by simply diluting the blood or serum sample to 10%. While fluorescence scattering was observed in this work, fluorescence scattering originated from the particles whose size was comparable to the wavelength of incident light; thus, it still followed the Mie scatter theory.
A multiplex assay was also performed by loading both types of antibody-conjugated particles to a single channel. A single UV LED light source was able to excite both types of particles at the same time. The normalized intensities from the particles conjugated with nontarget antibodies were smaller than those from the target antibody-conjugated particles and close to 1, indicating that the cross-reaction was minimal.
The overall improved assay performance in the presence of blood and serum can be attributed to the use of UV excitation and subsequent fluorescence scattering detection. Digital images of μPADs were taken and shown in Figure 6 . These images clearly indicate the blue fluorescent particles in the central regions of the microfluidic channels, while the colorations from blood or serum that filled the entire channel could not be identified under UV LED excitation. (The blue colors from nonchannel regions can be attributed to the autofluorescence of wax material and paper fibers.) These results only indicate the ability to detect fluorescence scattering in the presence of blood and serum; they do not demonstrate an alternative detection method. A digital camera is not as sensitive as a spectrophotometer to the differences in fluorescence scattering between the negative and positive samples, which is why the detection area appears saturated in all images.
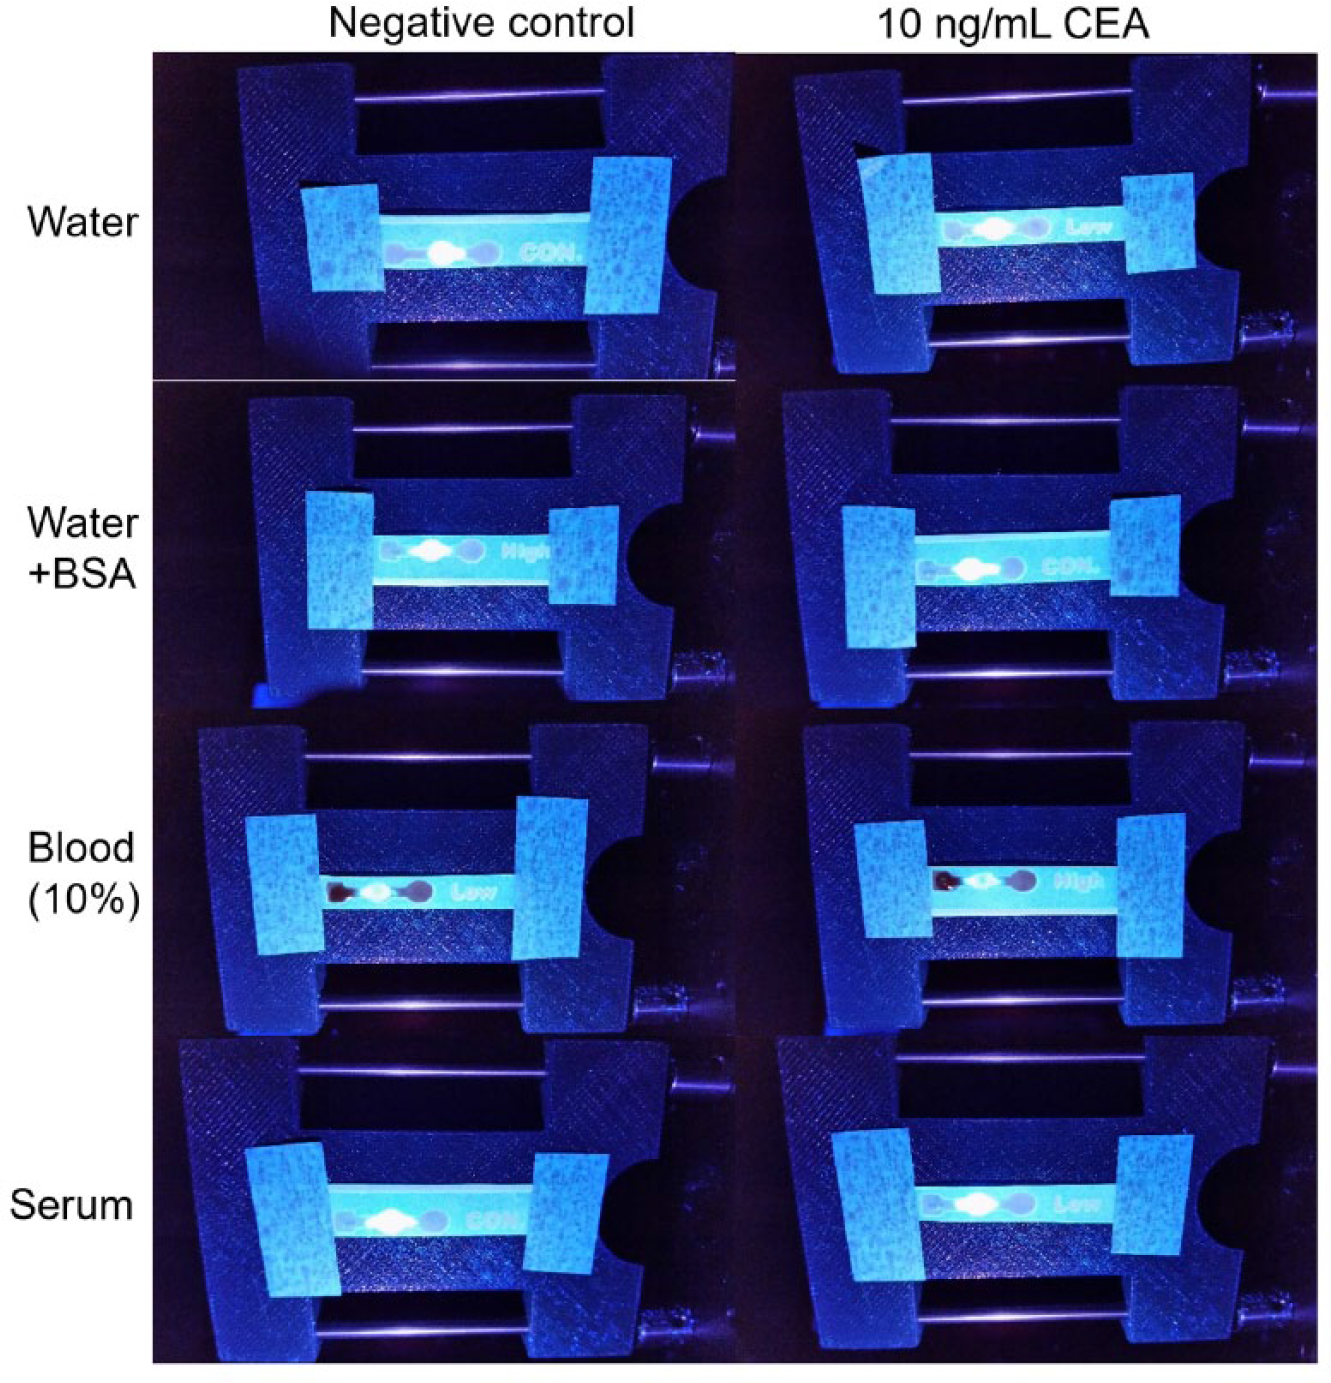
Digital images of μPAD, preloaded with anti-CEA-conjugated fluorescent particles, for assaying 0 ng/mL CEA (negative control; left column) and 10 ng/mL CEA (positive sample; right column) in deionized water (top), deionized water with 5% BSA (second row), 10% diluted human whole blood (third row), and undiluted human blood serum (bottom row). Note: Faint labels (“con,” low,” and “high”) in the strips do not carry any meaning.
For both CEA and CA 19-9 assays, the experiments with undiluted serum provided results similar to those with water and water + BSA, despite the complexity and high protein concentrations in undiluted human serum. Since the experiments with diluted human blood showed a smaller dynamic range and larger standard error, we can conclude that the serum components (most notably albumins and immunoglobulins) contributed to stabilizing the antibody-conjugated particles, while the nonserum components (blood cells and clotting proteins) did not. This interpretation can further be supported with the improved linearity of the assays with water + BSA over those with water, where BSA can function very similarly to human serum albumin. Albumin has frequently been used as a stabilizing agent for polystyrene particles. 31
It should also be noted that the linear ranges were extended to higher concentrations with undiluted serum. Since albumins and immunoglobulins are the common major components in blood and serum, and the experiments with water + BSA did not show any improvements in extending the linear range, immunoglobulins or a serum component other than albumins may have stimulated the antibody–antigen binding under an antigen-excess situation (too much CEA and CA 19-9 in the sample for the given amount of antibodies).
With these improvements, very low detection limits could be achieved—1 pg/mL CEA and 0.1 U/mL CA 19-9 with blood and serum. These low detection limits have not been reported with the other LOC assays for cancer markers from heparinated human whole blood (diluted) or human blood serum (undiluted), which can be attributed to not only the well-known strengths of μPAD—filtration capability and precisely controlled capillary flow, but also the use of fluorescence-based particle immunoagglutination, augmented by the addition of blood or serum.
The results with undiluted human serum showed the most interesting trend, a larger dynamic range and smaller standard error. To further explain this behavior, fluorescence microscopic images of the anti-CEA-conjugated particles on a glass slide and scanning electron microscopic (SEM) images of the same particles on a μPAD were acquired before and after the negative/positive samples were loaded ( Fig. 7 ). The negative sample was undiluted serum without any CEA, and the positive sample was 10 ng/mL CEA in undiluted serum. The fluorescence microscopic image with the negative sample showed the particles primarily as singlets with almost no aggregates, while that with the positive sample showed substantial immunoagglutination. The SEM image of the dried particles on paper showed the particles primarily as singlets with a few aggregates despite soft centrifugation. The second SEM image of the particles with the negative sample showed mostly singlets with almost no aggregation, corroborating the role of serum in improving the assay performance. After 10 ng/mL CEA in undiluted serum was added to the channel, the particles immunoagglutinated with no singlets seen.
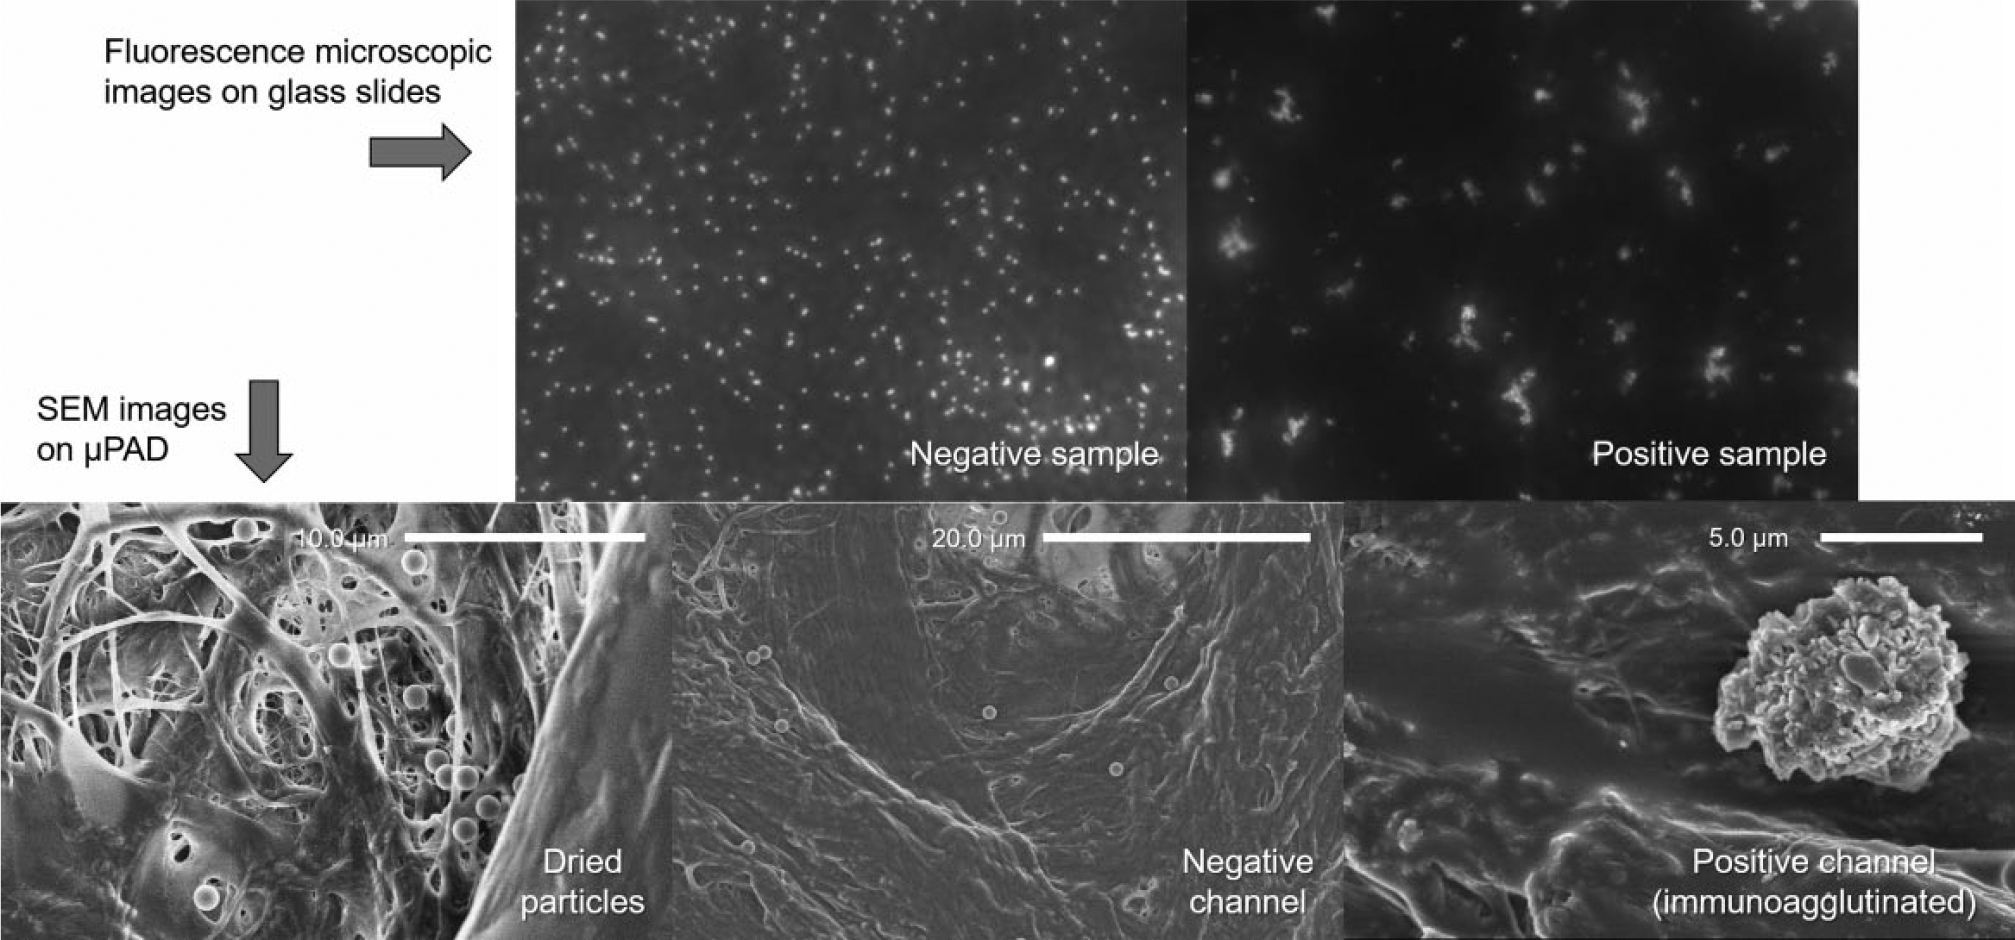
Representative fluorescence microscopic images on a glass slide (top row) and SEM images on the μPAD (bottom row) of the 1.0 µm anti-CEA-conjugated particles. The negative sample was undiluted serum without any CEA, and the positive sample was 10 ng/mL CEA in undiluted serum. The fluorescence images were taken with 380 nm UV light excitation. The particles loaded and dried on the μPAD (bottom left) showed mostly singlets with occasional aggregation. The particles 1 min after adding 12 µL of undiluted serum without any CEA (i.e., negative control) showed mostly singlets with almost no aggregation (top left and bottom middle). The particles 1 min after adding 12 µL of 10 ng/mL CEA in undiluted serum showed substantial immunoagglutination (top right and bottom right).
This paper microfluidic system has the potential for sensitive and multiplex detection of cancer markers from complicated sample matrices, such as whole blood and serum, using a single UV LED light source. While only two cancer markers, CEA and CA 10-9, have been assayed in this work, there is a potential for simultaneous detection of three or four cancer markers other than CEA and CA 19-9.
Footnotes
Acknowledgements
The authors thank Dr. Tu San Park at the University of Arizona (currently with Kyungpook National University) for experimental assistance and helpful discussion.
Supplementary material is available online with this article.
Declaration of Conflicting Interests
The authors declared no potential conflicts of interest with respect to the research, authorship, and/or publication of this article.
Funding
The authors disclosed receipt of the following financial support for the research, authorship, and/or publication of this article: This work was supported by the UA/NASA Space Grant Graduate Fellowship (awarded to Cayla Baynes) and BIO5 Institute at the University of Arizona.
References
Supplementary Material
Please find the following supplemental material available below.
For Open Access articles published under a Creative Commons License, all supplemental material carries the same license as the article it is associated with.
For non-Open Access articles published, all supplemental material carries a non-exclusive license, and permission requests for re-use of supplemental material or any part of supplemental material shall be sent directly to the copyright owner as specified in the copyright notice associated with the article.