
Abstract
Lactoferrin is an abundant glycoprotein in human body fluids and is known as a biomarker for various diseases. Therefore, point-of-care testing (POCT) for lactoferrin is of interest. Microfluidic paper-based analytical devices (µPADs) have gained a lot of attention as next-generation POCT device candidates, due to their inexpensiveness, operational simplicity, and being safely disposable. This work presents a colorimetric sensing approach for quantitative lactoferrin analysis. The detection mechanism takes advantage of the high affinity of lactoferrin to ferric ions (Fe3+). Lactoferrin is able to displace an indicator from a colorimetric 2-(5-bromo-2-pyridylazo)-5-diethylaminophenol (5-Br-PADAP)-Fe3+ complex, resulting in a color change. A 5-Br-PADAP-Fe3+ complex was encapsulated into water-dispersible poly(styrene-block-vinylpyrrolidone) particles, whose physical entrapment in the cellulosic fiber network results in the immobilization of the complex to the paper matrix. The complex-encapsulating particles showed a color change response in accordance with lactoferrin concentration. Both color intensity-based paper well plates and distance readout-based µPADs are demonstrated. Color intensity-based devices allowed quantitative analysis of lactoferrin concentrations with a limit of detection of 110 µg/mL, using a smartphone and a color readout app. On the other hand, distance readout-based µPADs showed changes of the length of colored sections in accordance with lactoferrin concentration. In summary, we successfully developed both colorimetric intensity-based paper wells and distance-based µPADs for lactoferrin detection. This work demonstrates a user-friendly colorimetric analysis platform for lactoferrin without requiring lab equipment and expensive antibodies.
Introduction
Lactoferrin, a glycoprotein relatively abundant in human biofluids such as saliva, milk, tear fluid, and nasal secretion, draws significant attention for its role in homeostasis and its antibacterial activity. 1 An increasing demand for the quantitative analysis of lactoferrin concentrations is expected. It has, for example, been shown that salivary lactoferrin levels are a candidate biomarker for important diseases, including Alzheimer’s disease.2,3 Its typical concentration in saliva is within the 2–5 µg/mL range, but it reaches 60 µg/mL during infections and inflammations. 4
Conventional detection methods for lactoferrin are based on immunoassays, such as the enzyme-linked immunosorbent assay (ELISA), 5 single radial immunodiffusion (SRID), 6 and the latex aggregation method. 7 Although these immunoassay-based systems show high sensitivity and selectivity due to the strong affinity of the specific antigen–antibody reaction, they are not suitable for point-of-care testing (POCT) because they require expert knowledge, multiple-step assay protocols, and dedicated laboratory equipment. An additional drawback is the requirement of relatively costly antibodies. To address some of these problems, alternative approaches have been suggested, including those based on charge-containing polymers, 8 surface plasmon resonance, 9 and aptamers. 10 However, they also suffer from a lack of assay simplicity and mostly rely on benchtop laboratory instruments.
Microfluidic paper-based analytical devices (µPADs) were first introduced by the Whitesides group in 2007. 11 This analytical assay platform profits from several characteristics of paper, including low material costs and being lightweight, allowing easy transport. Safe disposability by incineration is a significant advantage when working with potentially hazardous biological samples. The porous structure of paper enables the capillary-driven transport of sample liquids without external pumping, resulting in operational simplicity. Therefore, µPADs are regarded as promising candidates for POCT assays. Hence, a large number of diagnostic applications of µPADs have been reported.12–16
One of the simplest signaling methods for µPADs is color intensity-based detection. Although this simple method allows naked eye judgment for qualitative assays or, combined with a smartphone camera, quantitative assays, it is affected by environmental light conditions and therefore requires a specific light box and calibration control to obtain reproducible results. Another drawback is the time dependency of the signal intensity due to the evaporation-caused concentration of applied sample solutions, requiring a timed readout protocol. Since color intensity-based methods require special assay protocols and knowledge for both testing and data interpretation, more user-friendly and calibration-free techniques for µPADs are preferred. As calibration-free signaling methods, distance-based,17–25 text-based,26–30 counting-based,31–33 timing-based,34–37 and barcode-based38–41 readout motifs have been suggested. Distance-based µPADs enabling simple quantitative signal readouts, like in the case of an analog thermometer, are particularly suitable for POCT, and consequently, many works targeting various diagnostically relevant analytes such as glucose, 20 cysteine, 20 and hematocrit value 23 have been reported.
Our group has previously reported on µPADs for antibody-free tear lactoferrin detection, including a distance-based readout motif.42,43 However, these µPADs still require a short-wavelength (256 nm) UV excitation light source, due to the detection mechanism being based on the fluorescence emission of a lactoferrin–terbium complex. In contrast to their longer-wavelength (365 nm)-emitting counterparts, short-wavelength-emitting UV excitation light sources are much less common and potentially harmful for human eyes. In addition, fluorescence intensity-based signals recorded from paper surfaces depend on the distance and positioning of the excitation light sources. In order to achieve full independence of laboratory equipment and maximum user-friendliness, a simpler colorimetric distance-based readout mechanism for lactoferrin-detecting µPADs is desired.
In this work, we propose a purely colorimetric approach for distance-based quantitative lactoferrin analysis on a µPAD platform. The detection mechanism takes advantage of a unique characteristic of lactoferrin, that is, the high affinity to ferric ions (Fe3+) with a binding constant of log K = 22. 44 Lactoferrin is able to remove bound Fe3+ from a colorimetric indicator–Fe3+ complex, resulting in a color change to that of the uncomplexed indicator. While methods based on the high affinity of some proteins to Fe3+ have already been reported independent of µPAD applications, these rely on fluorescence 45 or electrochemical signal detection. 46 Here, we describe a simple proof-of-concept study for the colorimetric intensity- and distance readout-based detection of lactoferrin with paper-based assays relying on a lactoferrin-induced ligand exchange reaction from an Fe3+-binding colorimetric indicator to the metal binding protein.
Materials and Methods
Reagents and Equipment
Iron (III) chloride hexahydrate, lactoferrin from bovine milk, potassium chloride, calcium chloride dihydrate, sodium chloride, magnesium chloride hexahydrate,
Preparation of Br-PADAP-Fe3+ Complex-Encapsulating Particles
Encapsulation of the Br-PADAP-Fe3+ complex into poly(1-vinylpyrrolidone-co-styrene) particles was performed according to a previously reported method, 47 with the exception of purifying the commercially obtained aqueous particle dispersion by dialysis against pure water for 2 days, followed by freeze-drying, before use. In short, 0.87 g of freeze-dried particles was dispersed into an ethanol/water mixture (80:40 v/v). Next, a solution of iron (III) chloride hexahydrate (2.47 mg, 9 µmol) and 5-Br-PADAP (6.29 mg, 18 µmol) in 20 mL of ethanol was added to the particle dispersion under stirring. Ethanol was then removed from the mixture under reduced pressure. The residue was diluted with water up to a 10 mL overall volume.
Colorimetric Detection in Solution
The colorimetric response of Br-PADAP-Fe3+ complex-encapsulating particles in solution was recorded in sodium bicarbonate buffer (pH 7.0, 1 mM) containing 0–1 mg/mL of lactoferrin in the presence of 20 µL of the above-mentioned complex-encapsulating particle dispersion. The various samples were incubated for 90 min before being transferred to a 96-well plate that was finally scanned by the scanner. Acquired pictures were analyzed by ImageJ to extract the hue value of the HSV (hue, saturation, value) color space.
Fabrication of Paper Well Plates for Color Intensity-Based Readout
Paper well plates were prepared using the wax printing technique.48,49 A piece of Whatman 541 filter paper was cut into A4 size and fed into the ColorQube 8580 printer to print patterns in black wax. A single detection area consists of a 7 mm unmodified hydrophilic circular diameter paper region surrounded by a circular 11 mm diameter solid black hydrophobic wax ring, placed in the center of a 16 mm square wax-surrounded area (
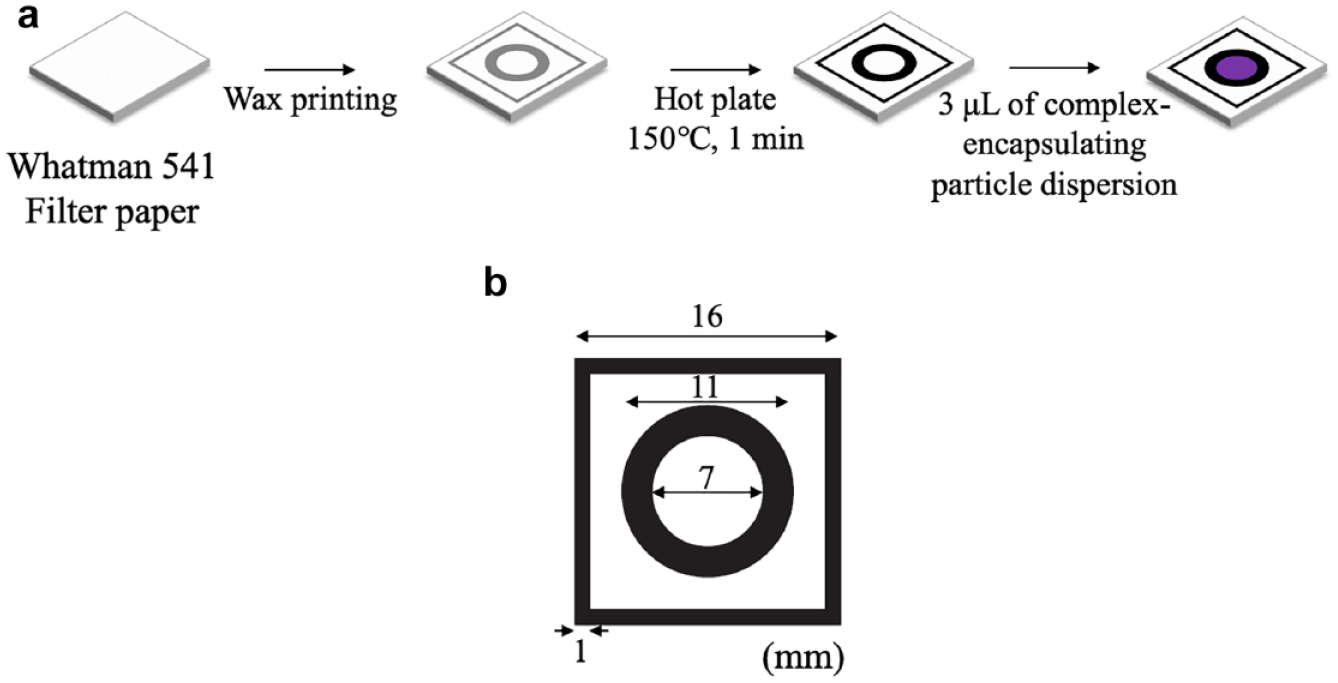
Paper well plates for color intensity-based readout: (
Signal Acquisition and Quantitative Analysis for Color Intensity-Based Paper Well Readout with a Scanner or a Smartphone
Forty microliters of standard solutions containing 0–1 mg/mL lactoferrin in sodium bicarbonate buffer (pH 7.0, 1 mM) was deposited onto paper wells and allowed to dry at room temperature. Colorimetric data were collected either by scanning and extracting the hue values using the ImageJ software, or by taking a photo with the ProCam app using an iPhone 7 inside a Styrofoam box under ambient light, followed by hue value readout with the ColorMate app (
Fabrication of µPADs for Distance-Based Readout
A4-sized Whatman 541 filter paper was prepared and 40 wax patterns (
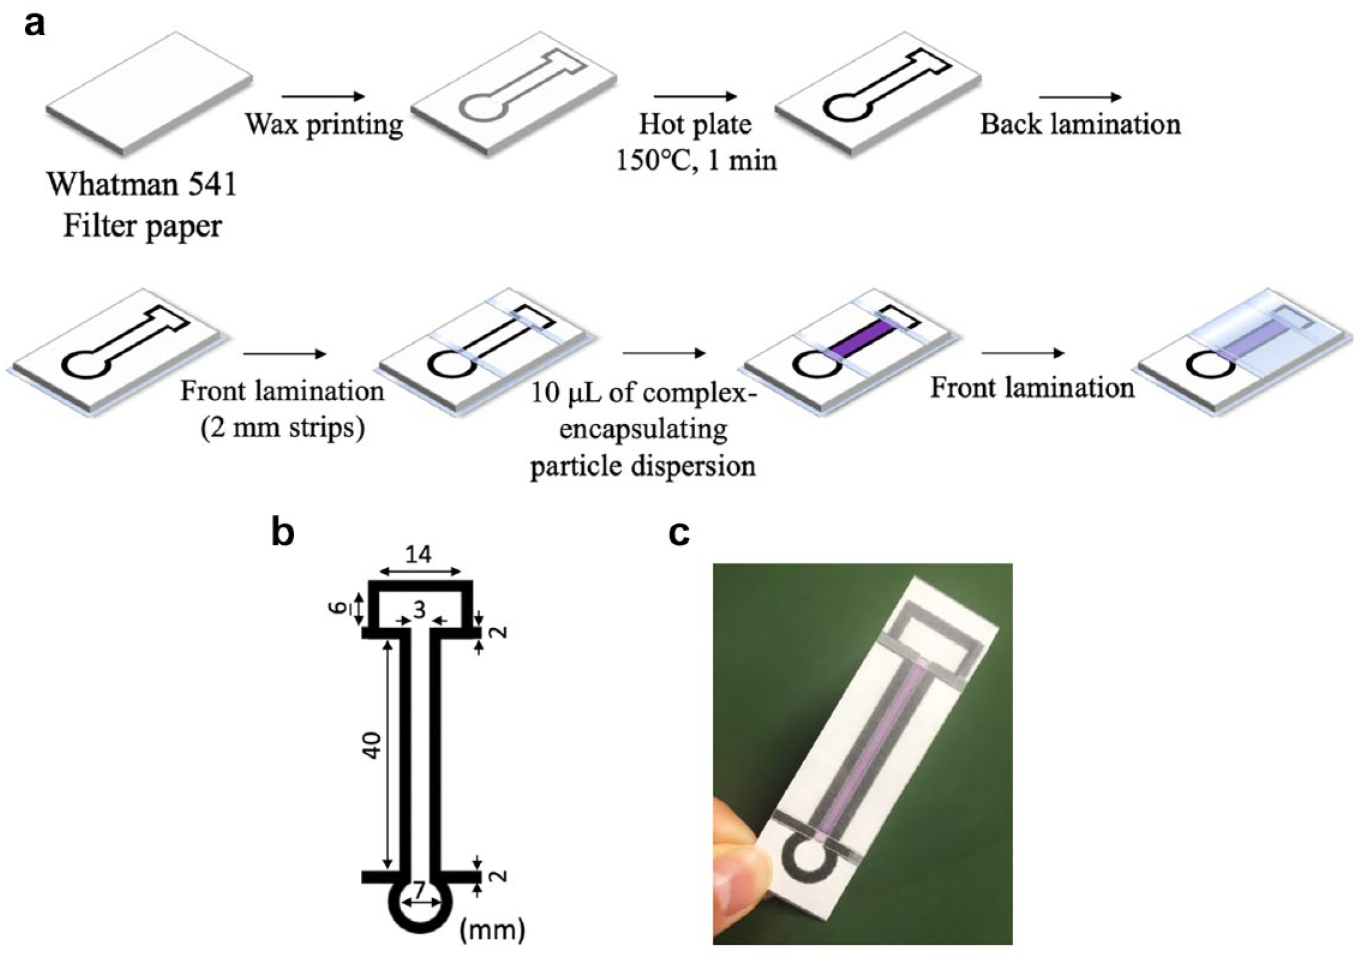
µPADs for distance-based readout: (
Signal Acquisition and Quantitative Analysis for Distance-Based µPAD Readout
Forty microliters of standard solutions containing 0–2 mg/mL lactoferrin in sodium bicarbonate buffer (pH 7.0, 1 mM) was deposited onto the sample inlet areas on devices and left until fully dried, followed by scanning and extracting the hue values using the ImageJ software (
Results and Discussion
Selection of the Colorimetric Lactoferrin Detection System
As already stated above, lactoferrin is known for its strong binding to Fe3+, where one protein molecule is able to bind two of the metal cations in their trivalent state. Therefore, it has been expected that the protein is able to induce a ligand exchange reaction with a weaker Fe3+-binding ligand. In the case of the weaker Fe3+-binding ligand being a colorimetric Fe3+ indicator, this exchange reaction results in reversing the indicator color from its Fe3+ bound to the original unbound state. In a series of preliminary experiments, a variety of known colorimetric Fe3+ indicators were evaluated. For this purpose, indicator–Fe3+ complexes were screened in solution for their colorimetric response toward the presence of lactoferrin (data not shown). Based on the experimental observations, 5-Br-PADAP, 50 a colorimetric indicator for Fe3+ showing orange to purple color transition when chelating Fe3+ in a 2:1 stoichiometric ratio, was chosen. The reported Fe3+ binding constant of log K = 13.3 is sufficiently large for the formation of stable indicator–Fe3+ complexes, while being well below the binding constant of lactoferrin toward Fe3+, an important prerequisite for the ligand exchange reaction of the indicator in the presence of the glycoprotein. However, due to the limited water solubility of 5-Br-PADAP and its Fe3+ complex, this compound is not directly applicable as a colorimetric indicator for lactoferrin detection on a µPAD. To address this problem, 5-Br-PADAP was encapsulated into poly(styrene-block-vinylpyrrolidone) particles, which contribute to both high water dispersibility and at the same time result in the physical immobilization of the indicator system onto the paper surface.
Successful encapsulation of the 5-Br-PADAP-Fe3+ complex into the polymeric nanoparticles was first confirmed by naked eye. The complex-loaded particle dispersion was twofold diluted with water and centrifuged at 12,000 RCF for 60 min. The supernatant showed a slightly purple color due to the presence of excess 5-Br-PADAP-Fe3+ complex, while the deep purple color of the loaded particles was clearly visible (
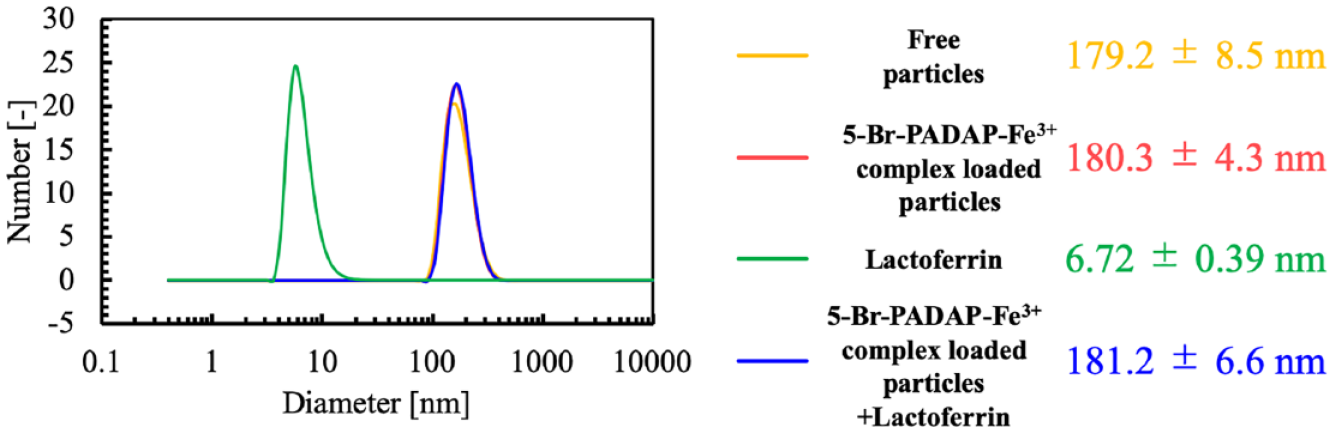
DLS results for aqueous particle dispersions or lactoferrin solution (measured in 1 mM NaHCO3 buffer, pH 7.0); particle sizes indicate mean values and standard deviations for three independent measurements.
Lactoferrin Concentration-Dependent Colorimetric Response in Solution
At first, the lactoferrin concentration-dependent response behavior of the 5-Br-PADAP-Fe3+ complex-encapsulating nanoparticles was investigated in aqueous dispersions. The presence of the polymeric particles with their strong light scattering properties prevents the use of UV/Vis spectrophotometry. For this reason, the lactoferrin response was evaluated by scanning the bottom of 96-well microplates containing mixtures of complex-loaded nanoparticles in the presence of various lactoferrin concentrations, followed by digital color analysis. The images above (
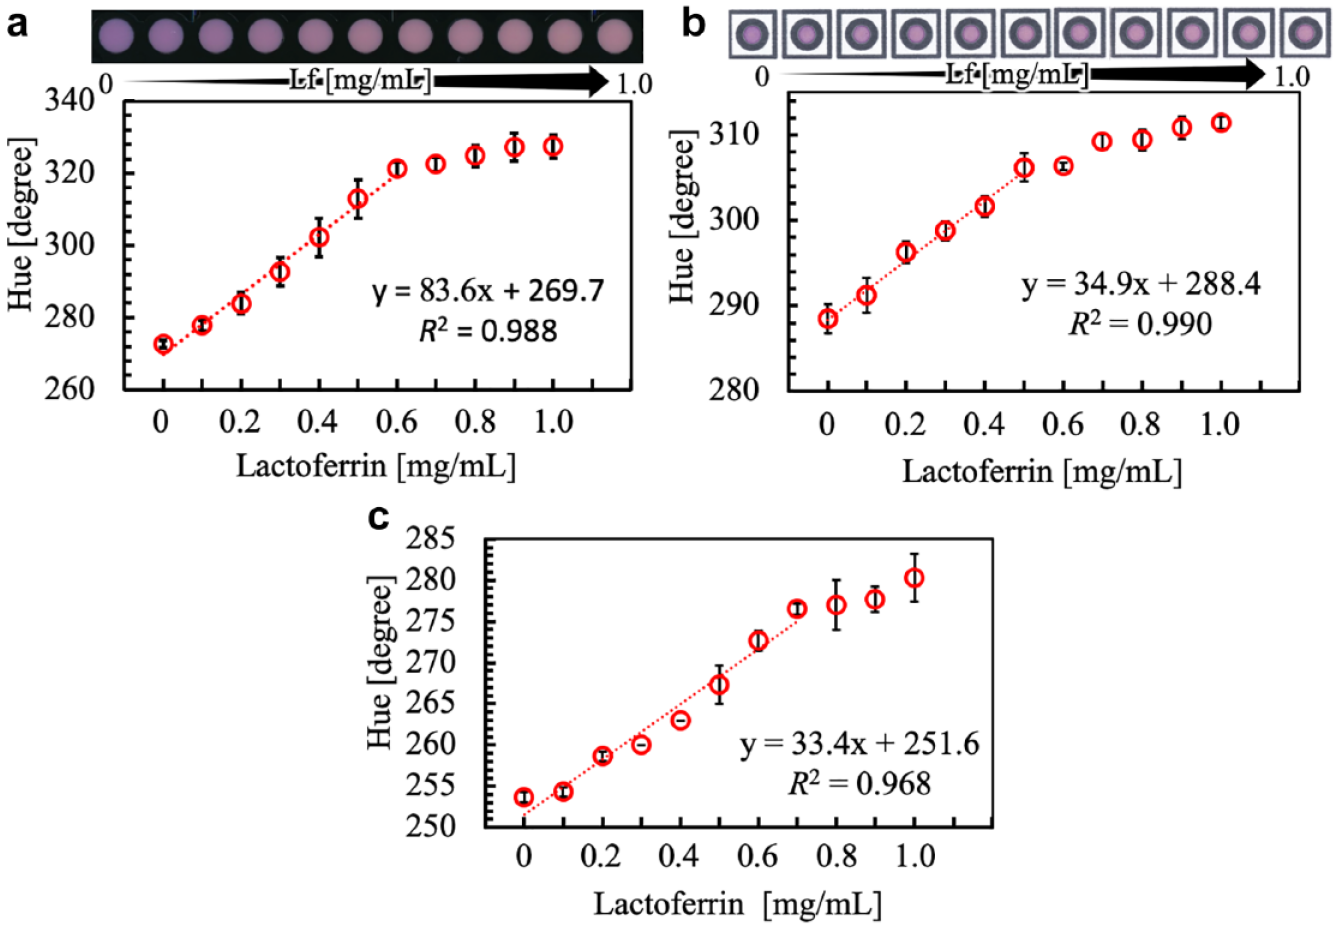
Lactoferrin concentration-dependent colorimetric response curves in (
Color Intensity Readout-Based Paper Well Plates
To confirm the suitability of the 5-Br-PADAP-Fe3+ complex-encapsulating nanoparticles as a reagent for the colorimetric detection of lactoferrin on a paper platform, experiments were performed with paper well plates wherein the colorimetric indicator particles have been predeposited onto the paper surface. Figure 4b shows the scanned images as well as the lactoferrin response curve obtained through color scanning of paper well plates after sample application and full drying. Similar to the experiments performed in homogeneous solution, the linear response range for lactoferrin concentration-dependent hue value changes was in the range of 0–500 µg/mL. The limit of detection was found to be 150 µg/mL.
To investigate the possibility for a more user-friendly approach, paper well plates were alternatively imaged inside a white Styrofoam box placed under ambient light with a smartphone using a camera app with elevated user control features, while processing of the acquired image data was performed with a commercially available color readout app (
µPADs for Distance-Based Readout
As already mentioned in the introduction, distance-based signal readout is a major approach to achieve calibration-free assays. The general principle relies on the continuous depletion of the target analyte from the sample during capillary action-driven flow along a colorimetric reagent-modified microfluidic channel patterned in a paper device. In this context, the electrostatic adsorption of lactoferrin to the surface of the paper substrate and to the 5-Br-PADAP-Fe3+ complex-loaded particles is of high importance to achieve a distance-based colorimetric signal. Lactoferrin with a pI value of around 9 carries positive charges under neutral pH conditions.
44
ζ-Potential measurements of the 5-Br-PADAP-Fe3+ complex-loaded particles showed a shift into the positive direction from −5.9 ± 1.3 mV to −2.0 ± 0.5 mV after the addition of lactoferrin, while the absence of a significant change of the hydrodynamic diameter (
In order to obtain reproducible colorimetric signal changes in distance-based µPADs, it is of high importance that the washing out of colorimetric reagents during sample flow in the microfluidic paper channel is prevented. The physical entrapment of the colorimetric Fe3+ complex-loaded particles inside the cellulosic fiber network has been confirmed through SEM images recorded before and after exposure of the µPAD to sample flow. The results of
Figure 5
qualitatively indicate that there is no significant washing out of polymeric particles by sample flow. As in the case of experiments with paper well plates, a color change from purple to red was observed (
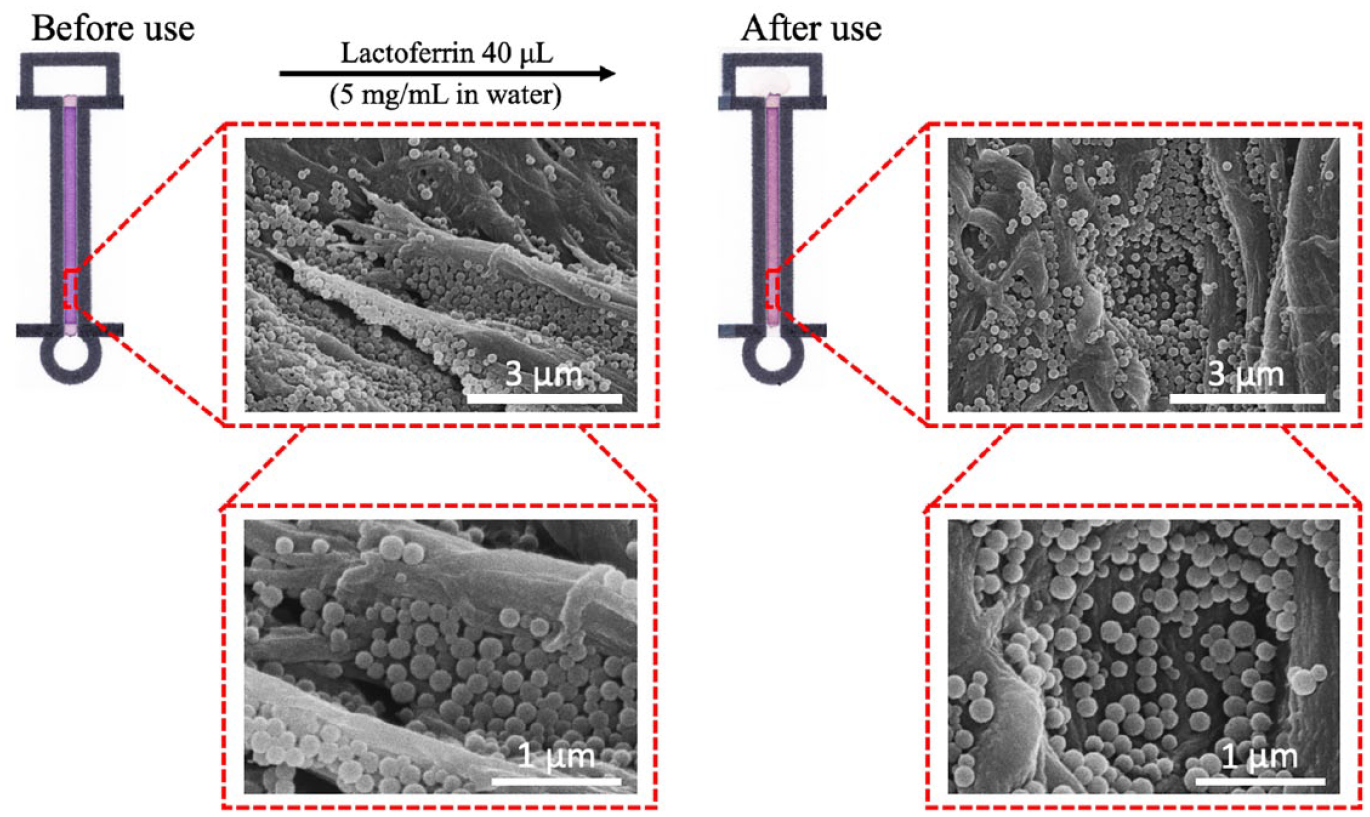
SEM images of microfluidic channel sections of µPAD surfaces with deposited Br-PADAP-Fe3+ complex-encapsulating nanoparticles before and after the flow of 40 µL of lactoferrin containing aqueous solution.
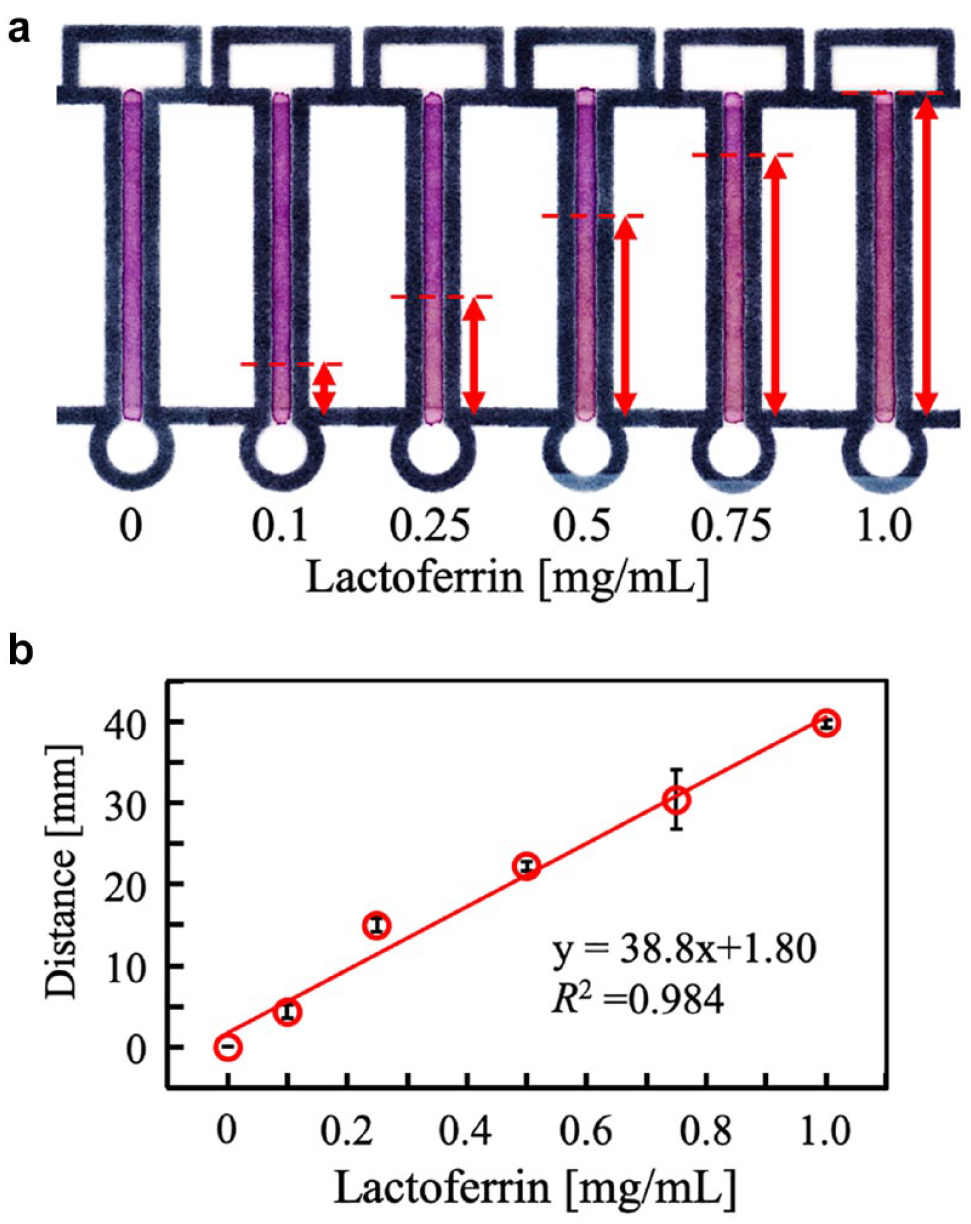
µPADs for distance-based readout: (
While relying on a scanner/camera and software-assisted signal readout in the case of distance-based µPADs might be interpreted as eliminating the original purpose of this readout motif, this is not necessarily the case. It has, for example, become standard to improve the quantitative data processing capabilities for color intensity-based µPADs by switching from the original naked-eye readout to a scanner/camera and software-assisted signal readout. Paper-based devices relying on barcode 39 or QR-code 38 signal visualization also profit from the combination of the simplicity of paper assay platforms with the practical usefulness of software-assisted signal interpretation. Similarly, the use of simple technical means for signal readout from distance-based µPADs is not necessarily a step backwards. Many advantages of distance-based signaling motifs over color intensity-based approaches, such as being generally calibration-free and independent of readout timing, are not limited to their naked-eye readout.
Selectivity and Interference Studies
The selectivity toward lactoferrin and the influence of potentially interfering compounds on the lactoferrin response were studied for all three evaluated types of sensing platforms, namely, aqueous solution, color intensity-based paper well plates, and distance-based µPADs. Since the detection of lactoferrin in human saliva could become one potential future application, experiments were performed against compounds and at concentrations typically found in saliva, including metal ions like Na+, K+, Ca2+, and Mg2+, as well as glucose, lysozyme, and albumin. In the following, the selectivity behavior and the response in mixtures of lactoferrin and a possible interferent are discussed. It should be mentioned, however, that we are currently unable to fully explain all of the observed trends and that some of the data interpretation is based on assumptions.
Aqueous Solution
Selectivity for lactoferrin was evaluated using solutions containing a single compound (21 mM NaCl, 37 mM KCl, 2.05 mM CaCl2, 0.56 mM MgCl2, 2 mg/mL glucose, 12 µg/mL lysozyme, 344 µg/mL albumin), whereas their potential interference was tested in mixtures of lactoferrin (500 µg/mL) and the respective compound. The results are shown in Figure 7a in the form of experimentally observed hue value changes. The alkali metal and alkaline earth metal cations by themselves resulted in a colorimetric response similar to the one of lactoferrin. This behavior is interpreted as being caused by an increase in ionic strength of the sample solution, decreasing the apparent stability constant of the 5-Br-PADAP-Fe3+ complex and hence increasing the ratio of Fe3+-free indicator. While the presence of albumin alone does not result in a significant colorimetric signal, the response is slightly decreased when lactoferrin and albumin coexist in solution. This is attributed to a possible electrostatic interaction between net negatively charged albumin (pI 4.7–4.952) and net positively charged lactoferrin.
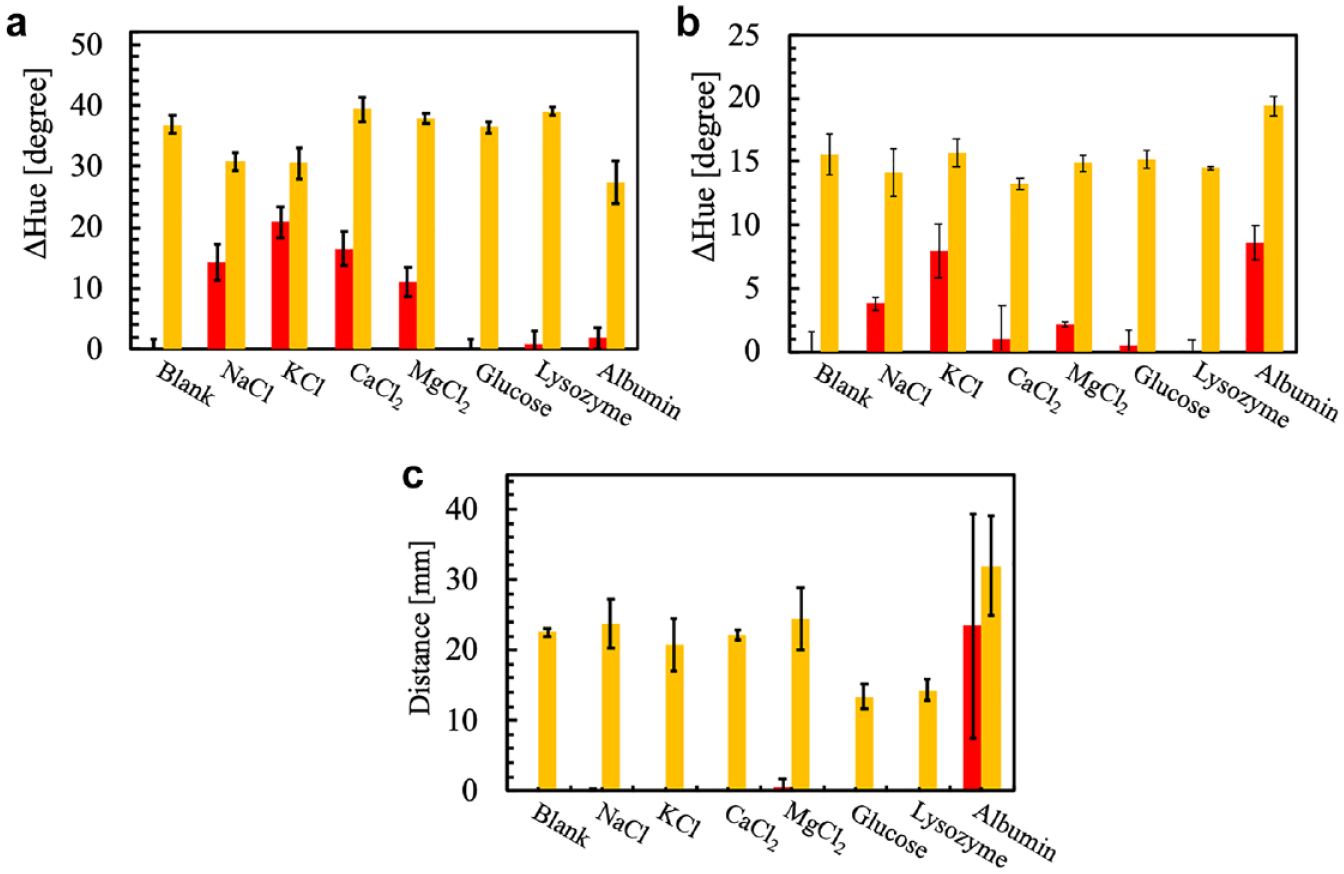
Selectivity and interference patterns (red bars show the response to single compounds and orange bars the response to 0.5 mg/mL lactoferrin in the presence of potential interferents) in (
Color Intensity-Based Paper Well Plates
The used sample solutions are identical to the ones described above, and the resulting selectivity and interference patterns are summarized in Figure 7b . Since the response mechanism in solution and on paper well plates is essentially the same, no significant changes compared with the solution situation are expected. However, one difference is the fact that the solution-based approach represents a solution equilibrium, whereas in the case of paper well plates solutes are infinitely concentrated due to the image recording occurring after complete drying of the paper spots. This is most likely the cause for observing a colorimetric response to albumin concentrated under these experimental conditions, since some binding of Fe3+ by albumin has been previously reported, although with a stability constant significantly lower (log K = 7.5) than that of lactoferrin. 53
µPADs for Distance-Based Readout
The selectivity and interference patterns obtained for the distance-based signal readout shown in Figure 7c are different from those observed for the color intensity-based approaches in solution and on paper wells. This can be explained by the different response mechanism. With the exception of albumin, none of the evaluated substances result in a significant distance signal by themselves. The signal observed for albumin solutions can be explained by the Fe3+ binding capacity of the protein in its concentrated form after sample liquid evaporation. At the same time, the adsorption of albumin to the paper surface is expected to have a certain surface blocking effect, leading to lower adsorption of lactoferrin and hence an increased distance signal in mixed solution. The shortened distance signal observed in the presence of glucose and lysozyme is attributed to the increased sample viscosities, resulting in lower liquid wicking rates. While the latter could be overcome by sample dilution prior to µPAD application, other alternatives need to be considered to diminish the influence of albumin. A potential approach could include the on-device removal of albumin from a lactoferrin-containing sample by making use of the two protein’s significantly different pI values already mentioned above. Introducing positive charges into an initial part of the microfluidic flow channel, such as by paper surface modification with an amine-terminated compound,54–57 could result in the adsorption of a major fraction of albumin, while allowing the passage of net positively charged lactoferrin to a downstream section of the channel modified with the 5-Br-PADAP-Fe3+ complex-loaded particles.
Conclusion
Both color intensity-based paper well plates and distance-based µPADs relying on an antibody-free colorimetric detection mechanism have been demonstrated. Color intensity-based readout from paper spots can be as simple as using a smartphone with a commercially available camera and color data processing apps. A paper platform-compatible indicator system for lactoferrin relying on a colorimetric Fe3+–indicator complex in combination with core–shell structured poly(styrene-block-vinylpyrrolidone) nanoparticles has been developed. Although the limits of detection for lactoferrin achieved with the current system are not sufficiently low to be directly applicable to a broad variety of physiological samples and potential selectivity issues need to be further addressed, we believe that this work demonstrates a potential strategy toward the development of antibody-free lactoferrin analysis systems not requiring any specific laboratory equipment. Future work should focus on the design of colorimetric Fe3+ indicators showing more pronounced color changes and enhanced water solubility, while offering the possibility to be immobilized to the surface of the paper substrate.
Supplemental Material
ESI – Supplemental material for Microfluidic Paper-Based Analytical Devices for Colorimetric Detection of Lactoferrin
Supplemental material, ESI for Microfluidic Paper-Based Analytical Devices for Colorimetric Detection of Lactoferrin by Hiroko Kudo, Kento Maejima, Yuki Hiruta and Daniel Citterio in SLAS Technology
Footnotes
Acknowledgements
We would like to thank Mr. Yuki Tokura and Prof. Dr. Seimei Shiratori at Keio University for their support with DLS and ζ-potential measurements.
Supplemental material is available online with this article.
Declaration of Conflicting Interests
The authors declared no potential conflicts of interest with respect to the research, authorship, and/or publication of this article.
Funding
The authors received no financial support for the research, authorship, and/or publication of this article.
References
Supplementary Material
Please find the following supplemental material available below.
For Open Access articles published under a Creative Commons License, all supplemental material carries the same license as the article it is associated with.
For non-Open Access articles published, all supplemental material carries a non-exclusive license, and permission requests for re-use of supplemental material or any part of supplemental material shall be sent directly to the copyright owner as specified in the copyright notice associated with the article.