
Abstract
A digital assay is one in which the sample is partitioned into many containers such that each partition contains a discrete number of biological entities (0, 1, 2, 3, . . .). A powerful technique in the biologist’s toolkit, digital assays bring a new level of precision in quantifying nucleic acids, measuring proteins and their enzymatic activity, and probing single-cell genotype and phenotype. Where part I of this review focused on the fundamentals of partitioning and digital PCR, part II turns its attention to digital protein and cell assays. Digital enzyme assays measure the kinetics of single proteins with enzymatic activity. Digital enzyme-linked immunoassays (ELISAs) quantify antigenic proteins with 2 to 3 log lower detection limit than conventional ELISA, making them well suited for low-abundance biomarkers. Digital cell assays probe single-cell genotype and phenotype, including gene expression, intracellular and surface proteins, metabolic activity, cytotoxicity, and transcriptomes (scRNA-seq). These methods exploit partitioning to 1) isolate single cells or proteins, 2) detect their activity via enzymatic amplification, and 3) tag them individually by coencapsulating them with molecular barcodes. When scaled, digital assays reveal stochastic differences between proteins or cells within a population, a key to understanding biological heterogeneity. This review is intended to give a broad perspective to scientists interested in adopting digital assays into their workflows.
Introduction
This article is the second part of a two-part review in digital assays. A digital assay is one in which the sample is partitioned into many small containers such that each partition contains a discrete number of biological entities (0, 1, 2, 3, . . .). Part I of this review 1 began with the fundamentals and benefits of partitioning, including Poisson statistics and sources of measurement uncertainty. These principles apply equally to all digital assays; hence, the reader is referred to the introductory sections of part I. The remainder of part I covered digital PCR (dPCR) for quantifying nucleic acids. We described five commercial dPCR instruments that partition samples into physically isolated chambers (cdPCR) or droplet emulsions (ddPCR). We compared the strengths of dPCR (absolute quantitation, precision, ability to detect rare/mutant targets) with quantitative real-time PCR (dynamic range, larger sample volumes, and throughput). Last, we detailed several promising applications of dPCR, including copy number variation (CNV), quantitation of circulating tumor and viral DNA, quantifying RNA/microRNA (miRNA) with reverse transcription dPCR, and preparing next-generation sequencing libraries.
Part II of this review focuses on how digital assays can be extended to proteins and cells. As proteins and cells are hierarchically more complex than nucleic acids, the assays have a correspondingly broader scope. Where digital PCR only on quantitation, digital protein assays quantify proteins (digital enzyme-linked immunosorbent assay [ELISA]) as well as their enzymatic activity. Digital cell assays probe a wide range of properties related to single-cell phenotype (gene expression, metabolic activity, secreted enzymes, quantitation of surface biomarkers) and genotype (genome, transcriptome). In this review, the relevant sections on digital PCR, protein, and cell assays are written so they can be read independent of one another.
Sample partitioning, the key step in digital assays, provides similar benefits in proteins/cells as it does for nucleic acids. First and foremost is that partitioning and amplification enable the detection of single entities (nucleic acid, proteins, or cells), as required for digital quantitation. In the case of nucleic acids, PCR amplification is ideal for detecting single-nucleotide sequences with high specificity and sensitivity. Without the luxury of PCR, digital protein and cell assays rely instead on enzymatic amplification with fluorogenic substrates, which generates a linear increase in fluorescence over time rather than an exponential fluorescence increase at each PCR replication cycle. In both cases, however, small partition volumes enable single-molecule detection within 30 to 40 cycles (PCR) or within minutes to hours (enzymatic amplification). Digital assays equally benefit from the sample enrichment that comes with partitioning. In digital PCR, partitioning helps detect rare nucleic acid targets in the presence of a wild-type population. In digital ELISA, partitioning enables the detection of low-abundance proteins in the presence of those at much higher concentrations. In both cases, increasing the number of partitions proportionally increases dynamic range. One difference is that while nucleic acids are relatively robust molecules, proteins can denature and lose their enzymatic activity or secondary structure required for antibody binding. Due to the high surface area to volume ratio in small partitions, care must be taken to avoid nonspecific binding. In digital cell assays, partitioning enables measurements of phenotype and genotype at single-cell resolution. In many cases, cells must remain viable if the assay requires metabolic screening or protein expression. In small partitions, nutrients are more rapidly depleted, and waste products build up more rapidly.
As digital PCR is a mature field, part I emphasized the many commercial instruments and a wide variety of applications being explored by the life sciences community with available tools. By comparison, digital protein and cell assays represent a younger but rapidly advancing field. As such, part II has a more academic focus, emphasizing proof of concept studies in a diverse set of assays. Nevertheless, two commercial instruments to be discussed include the Quanterix Digital ELISA system (Lexington, MA) and 10× Genomics Chromium system (Pleasanton, CA) for single-cell transcriptomics.
Digital Protein Assays
While much of the initial efforts in digital assays focused on nucleic acids, more recent efforts have expanded to quantifying proteins as well as their enzymatic activity, all at the single-molecule level. Digital enzyme assays can detect proteins with enzymatic activity, while digital ELISA extends this to any protein that can be detected with conventional ELISA. Digital enzymatic assays yield insights into enzymatic turnover rates, while digital ELISA can detect extremely low-abundance protein biomarkers in blood serum for clinical diagnostics.
Digital Enzyme Assays
Digital enzyme assays (1) count the number of enzymes in a sample and (2) measure single-enzyme turnover rates. The chemistry of digital enzyme assays ( Fig. 1 ) is no different than a conventional fluorogenic assay, but the key difference is partitioning. A dilute solution of enzyme is combined with a fluorogenic substrate and immediately partitioned into separate containers, such that each container has a small number of enzymes (on average <1) per partition. As the enzyme reacts with the substrate, the fluorescence in the partition increases at a rate proportional to the enzyme turnover rate and inversely proportional to volume. Unlike digital PCR, where each droplet is assigned a positive or negative fluorescence value, in digital enzyme kinetic assays, the rate of fluorescence increase is measured in each partition.2,3 When there is a discrete number of enzymes in each partition, the rate of fluorescence increase also becomes discrete and follows a Poisson distribution ( Fig. 1C,D ). There is, of course, some variability (i.e., noise) in the rate of increase due to variations in droplet size, small variations in substrate concentration, and stochastic differences between the enzymes’ levels of activity. In the time plot, this can be seen as a range of slopes in the time-fluorescence plot, while in the histogram, it appears as multiple Gaussian distributions convoluted with the exponential characteristic of a Poisson distribution. There are two advantages to miniaturizing partition size. First, it increases the effective concentration of the enzyme, so that substrate turnover dominates over nonspecific hydrolysis of the substrate. 4 Second, the small volume rapidly accumulates fluorescence, enabling single-molecule detection in minutes.
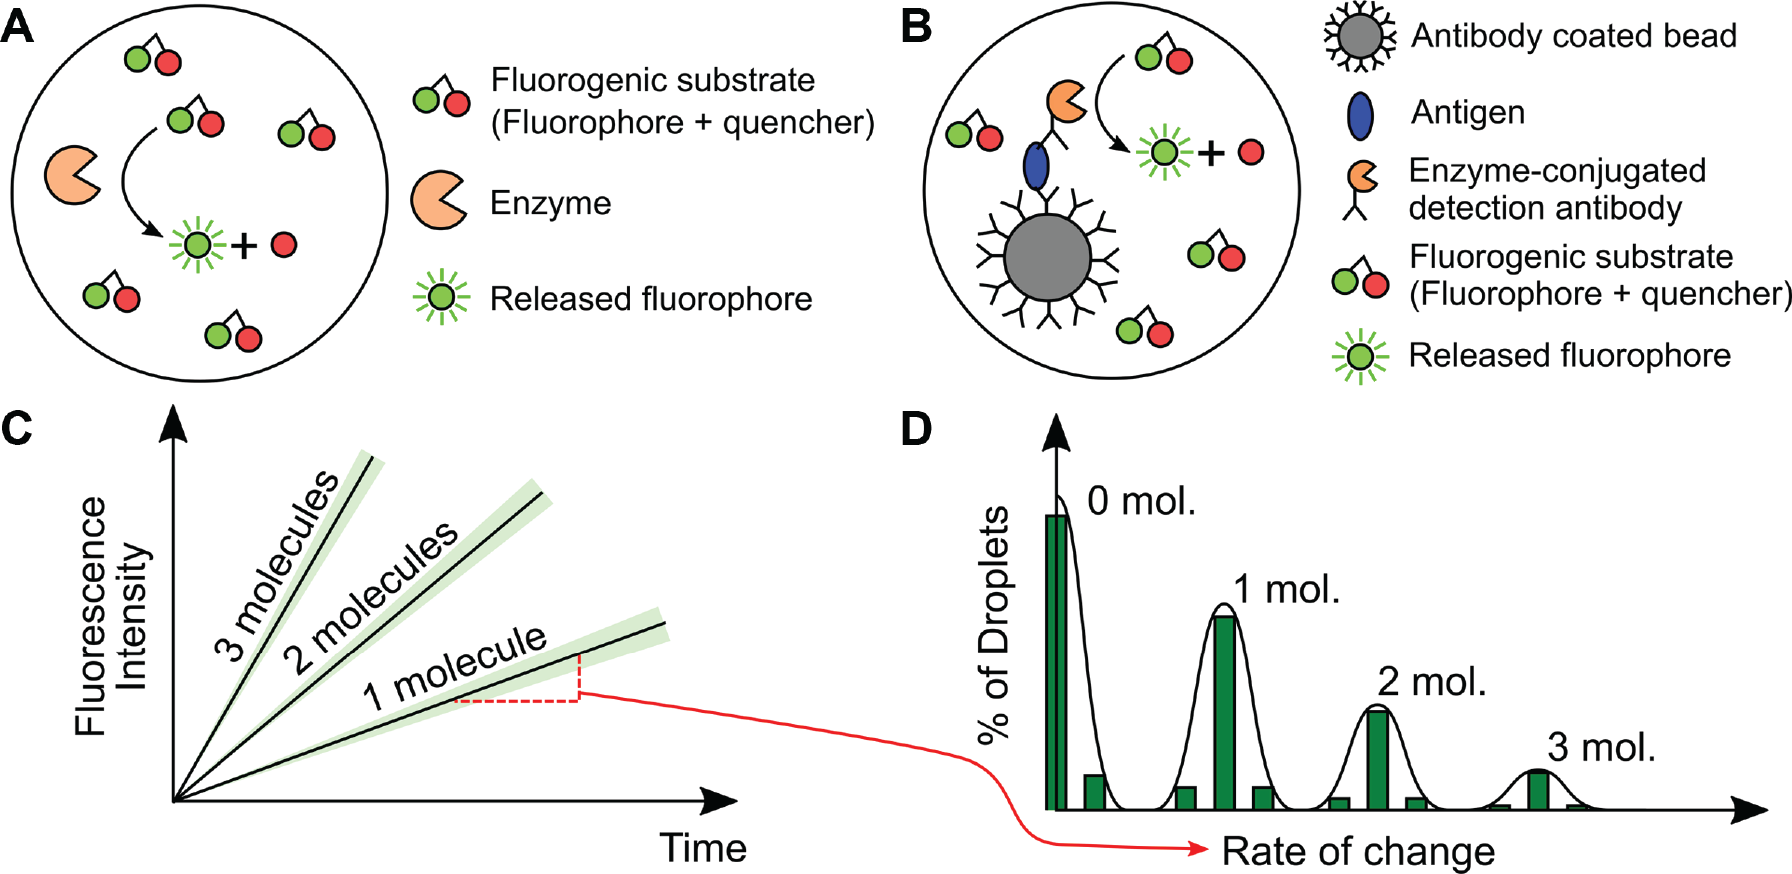
Two categories of digital protein assays. Comparison of (
The first demonstration of a digital enzyme assay dates back to 1961, when Rotman 2 measured the enzymatic activity of single molecules of β-D-galactosidase by atomizing a dilute solution of the enzyme and a fluorogenic reporter into silicone oil. The spray method resulted in highly nonuniform droplet sizes (0.1–40 µm). Nonetheless, by analyzing the rate of fluorescence increase in each drop, Rotman found a Poisson distribution typical of discrete molecule encapsulation.
More recently, Rondelez et al. 3 demonstrated digital enzyme assays in a highly uniform array of 30-fL wells, micromolded on the surface of a clear elastomer ( Fig. 2 ). A sample of β-galactosidase, diluted to a concentration of λ = 1, was dispensed on the array and then sealed into the wells when the array was pressed against a cover slip. The fluorescence in 300 chambers was monitored, revealing a quantization of reaction rates as found by Rotman. 2 However, due to the much smaller small-partition volume, single-enzyme fluorescence could be observed within minutes compared to >10 h as required in Rotman’s experiment. Other key points demonstrated were that (1) enzymes retained activity in the well and did not adsorb to the walls coated with an excess of bovine serum albumin (BSA) blocking solution, (2) fluorescence did not leak to surrounding chambers, and (3) in a 1.4-fL chamber, as few as 10 fluorescein molecules (10 nM concentration) could be detected using a conventional EPI-fluorescence setup with a CCD camera with image intensifier. The same group later demonstrated digital enzyme assays in surface-immobilized droplets (4.8 µm) arranged on a hydrophobic substrate patterned with circular hydrophilic features. 5 The droplets formed spontaneously when the aqueous sample solution was replaced with fluorocarbon oil, leaving sessile droplets in the hydrophilic regions. The droplets were less uniform, but the volumes could be adjusted serially using a pressure-driven micropipette. Although less scalable, the open array format allows for recovery, addition, or exchange of the sample. This study demonstrated single-enzyme detection within 2 min and also highlighted a key issue with droplet-based digital assays: fluorescein, as well as other fluorophores containing aromatic backbones, may slowly diffuse into the oil. This can decrease the observed rates of fluorescence and potentially interfere with neighboring assays.
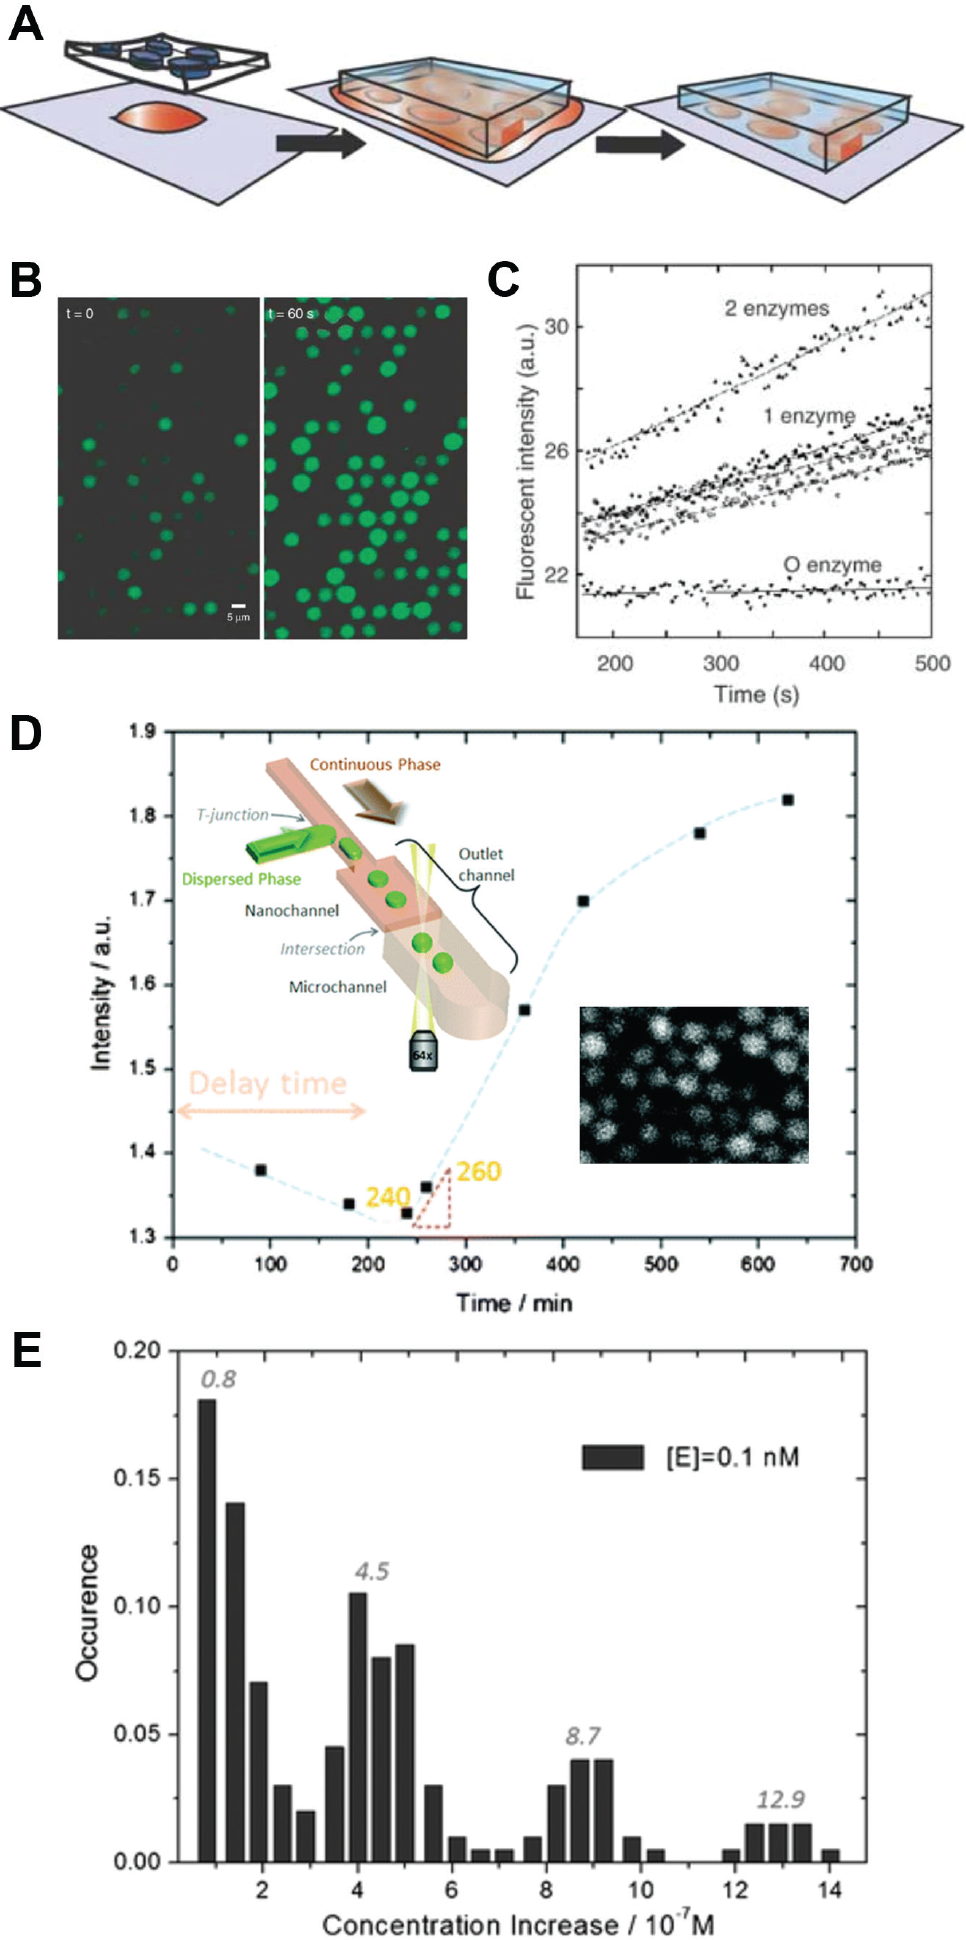
Digital enzyme assays. (
Arayanarakool et al.
6
performed enzyme activity assays in droplets generated using a nanoscale flow-focusing junction. A λ = 0.9 dilution of β-galactosidase (β-gal) was encapsulated in droplets of size 2 to 3 µm (10 fL) with the fluorogenic substrate fluorescein-β-
Digital enzyme assays may also be carried out in a bead-in-emulsion format, which is also used for digital ELISA as described in next section. The basic concept is that a single active enzyme is adsorbed to a single functionalized bead, which is then encapsulated in a well. Kim et al. 8 incubated an enzyme sample with functionalized beads at a 1:10 ratio, ensuring that >99% of the beads had zero or one enzyme attached. Then, the bead solution was injected into a hydrophobic cavity etched with thousands of hydrophilic microwells, each sized to fit only a single bead. An immiscible oil, flown orthogonally across the wells, encapsulated each microwell/bead. This technique involves two random processes, adsorption and encapsulation, and the probability of single-cell encapsulation becomes the product of two probabilities. Therefore, only a small fraction of the wells contains a single bead with a single enzyme; the majority contain beads with no enzyme or no beads at all. The low efficiency is compensated by having many wells. With a 1 million microwell array, the authors measured up to 700,000 beads and demonstrated a limit of detection of 10 zM of streptavidin-β-galactosidase conjugate (SβG).
At the extreme end of low volume, Christensen et al. 9 performed digital assays in small unilamellar lipid vesicles (SUVs). Synthesized using lipid self-assembly, SUVs are 15 to 700 nm in diameter and have volumes as little as 0.1 attoliters. When SUVs containing the substrate fluorescein diphosphate (FDP) and the enzyme alkaline phosphatase were merged, the reaction resulted in a step increase in fluorescence. This process could be repeated: if another SUV containing FDP was added, another step increase in the fluorescent product was observed. This unique approach attempts to measure the number of FDP molecules per partition, not by the rate of fluorescence increase but by the discretized fluorescence increase upon merging. However, it is not clear whether the method could detect single enzymes, since the authors used high concentrations (i.e.,λ > 3 for enzyme and λ > 600 for substrate).
In summary, the above studies have collectively shown that although some level of optimization is required, digital enzyme assays are a versatile and robust method to count single enzymes and quantify their activity. They can be performed with an epi-fluorescence microscope and CCD camera, a relatively simple setup compared to more complex alternatives such as single-fluorophore event counters, which require a confocal setup with photobleaching control. 10 Although the majority of studies worked with the well-known enzyme β-galactosidase, the basic principle could be extended to other enzymes, since a wide range of fluorogenic substrates is commercially available. When developing a digital enzyme assay, technical requirements include (1) an imaging system able to detect fluorescence at low levels, (2) blocking proteins 7 or biocompatible surfactants to prevent adsorption of proteins to the walls or liquid interfaces,11–14 and (3) appropriate partition sizes to accumulate detectable fluorescence in a reasonable timeframe. Compared to digital PCR, the detection of proteins is more difficult because it relies on linear enzymatic amplification rather than targeted PCR; however, the time can be decreased to minutes when the assay is miniaturized to sub-picoliter partitions.
Digital ELISA
Conventional vs. digital ELISA
ELISA is a universal method for detecting any protein that can be bound to an antibody, and it is a workhorse in both clinical and research workflows. Digital ELISA ( Fig. 1B ), its digital counterpart, can similarly detect any protein that can be labeled with an antibody, whereas a digital enzymatic assay is suitable only for proteins with enzymatic activity on a fluorogenic substrate. Conventional “analog” ELISA measures the concentration of protein in a sample based on the magnitude of emitted fluorescence, while digital ELISA essentially counts the number of proteins by partitioning the sample and performing single-molecule ELISA in each partition. A conventional direct ELISA consists of four steps: (1) adsorption of the antigen to a surface coated with a capture antibody, (2) binding an enzyme-labeled detection antibody to the antigen, and (3) measuring the increase in fluorescence as the enzyme reacts with a fluorogenic substrate. After a specified incubation time, the fluorescence magnitude is measured and correlated with protein concentration. Conventional ELISA is typically performed in a microplate well with 10- to 100-µL volumes. The detection limit is typically in the range of 10−13 M but is highly dependent on the sample and label. Digital ELISA ( Fig. 1B ) is based on the same chemical principle, except the sample is partitioned into many small containers, such that there is an average of <1 protein/enzyme immunocomplex per chamber. Fluorescence in a single partition indicates the presence of a single protein. The partition volume is typically small, and thus fluorescence accumulates rapidly such that even a single protein can be detected. Compared to conventional ELISA, digital ELISA lowers the detection limits by almost 3 log to 10−16 M. 15
Digital ELISA technology
In 2010, the pioneering effort of Rissin et al. 15 was the first to demonstrate digital ELISA ( Fig. 3A–D ). A dilute sample of ~3000 proteins in 100 µL (50 aM concentration) was incubated with 200,000 antibody-coated beads, and proteins bound to the beads probabilistically. Due to the large excess of beads, roughly 1% of the beads had a single protein, while most were empty. The beads were then labeled with a detection antibody conjugated with β-galactosidase as a reporter. Then, the sample was partitioned by passing the beads over a single-molecule array (Simoa) consisting of 50,000 reaction chambers, each large enough to fit only a single bead (50 fL). Only 40% to 60% of the beads were captured in wells, and therefore, only 0.4% to 0.6% of the wells contained a single bead with the enzyme-labeled protein. After adding a fluorogenic substrate, the chambers were sealed against a PDMS gasket, effectively isolating the chambers from one another. After a set incubation time, the fluorescence intensity in each chamber was measured using a digital camera. The proportion of empty beads (neglecting the empty wells) was used to determine the antigen concentration, similar to digital PCR in part I. 1 In digital ELISA, the concentration λ is typically kept <0.4 because differentiating fluorescent versus nonfluorescent drops becomes challenging as λ approaches 0.5. 16 However, the dynamic range can be extended by using analog detection at higher concentrations. 17
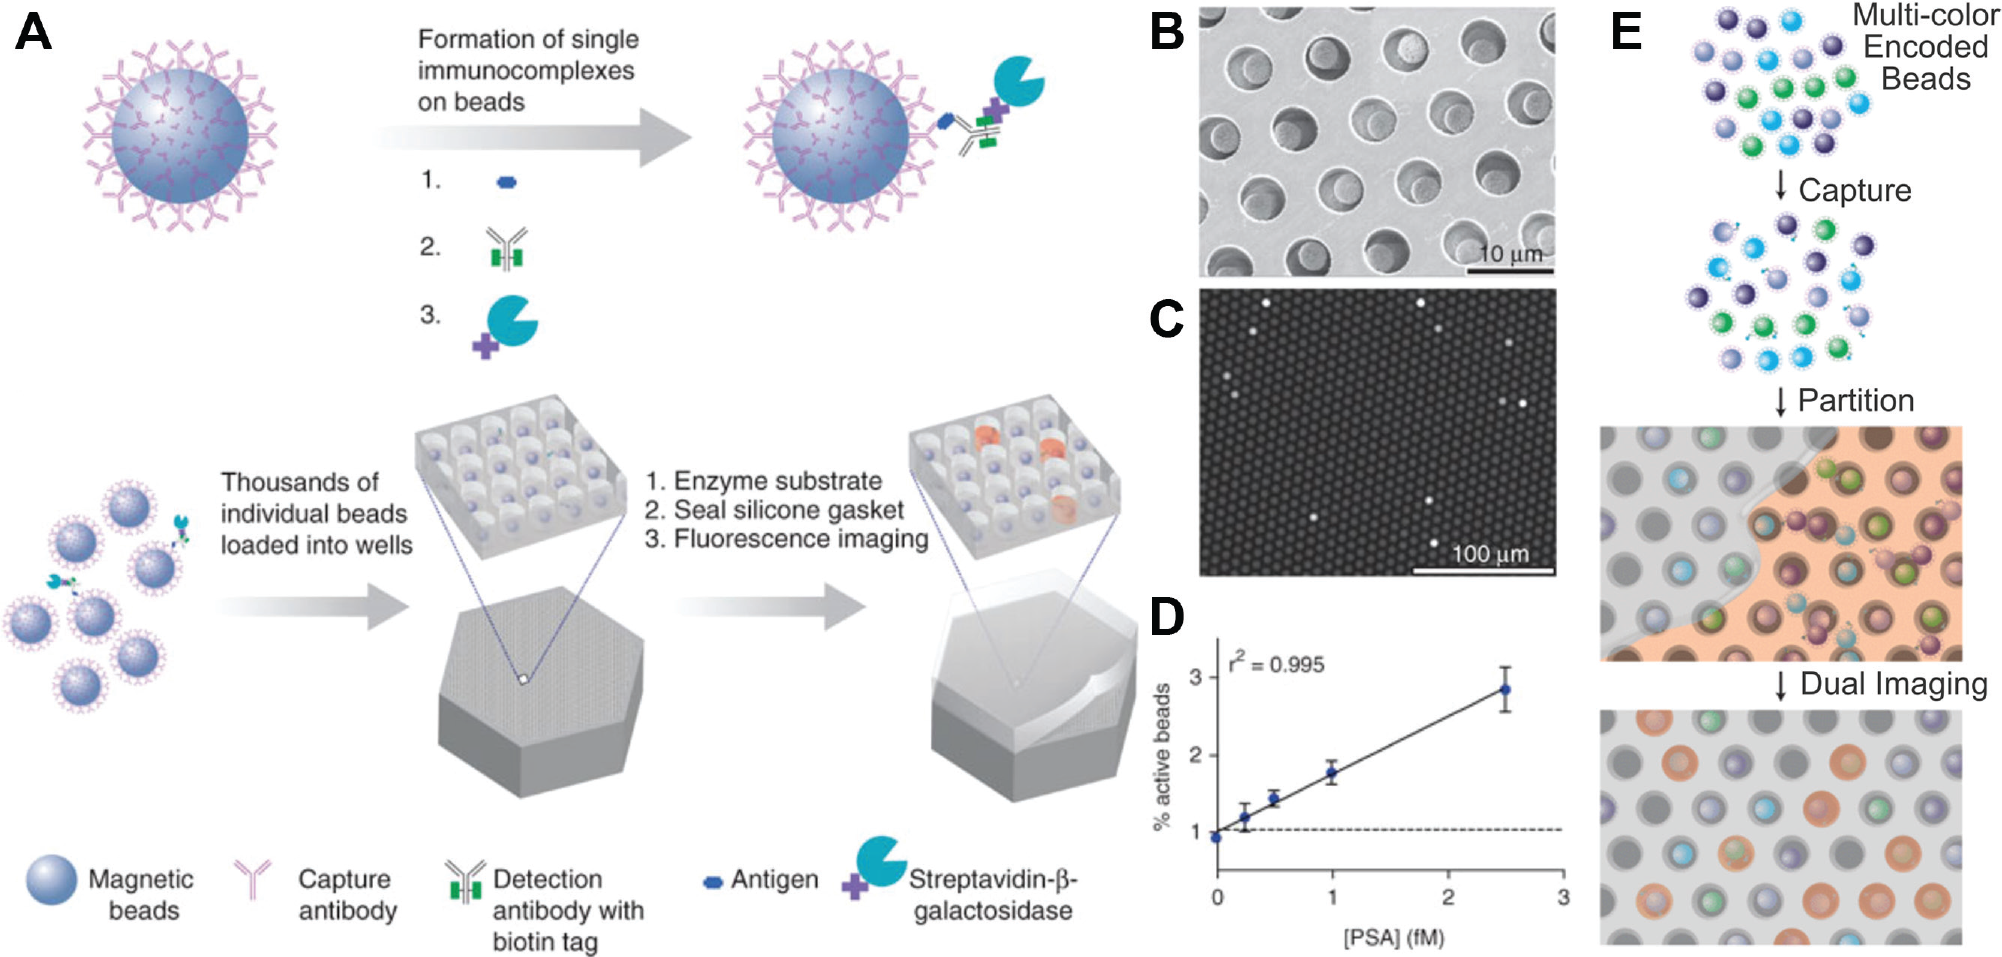
Digital enzyme-linked immunosorbent assay (ELISA). (
Droplet-based digital ELISA was demonstrated by Shim et al. 4 The workflow is similar, except that partitioning was performed in a droplet generator rather than a physical array. The droplet generator operated at >1.2 million droplets per second, nearly 100 times higher than typical implementations. The authors speculated this was achieved using microfluidic tip streaming 18 in a locally narrow flow-focusing junction, with a low-viscosity fluorocarbon oil and 5% fluorinated surfactant. Small volumes of 32 fL enabled enzymes to develop detectable fluorescence in ~10 min. While the chip had capacity to hold 200,000 droplets, like the Simoa system, the published results analyzed 5000 droplets, and the limit of detection was 46 fM compared to 0.4 fM for the Simoa system.
Multiplexed digital ELISA of several protein biomarkers has also been demonstrated in the Simoa system ( Fig. 3E ). 19 Multiplexing requires one subpopulation of beads assigned to each protein to be detected. Each subpopulation is conjugated with a unique fluorophore, along with a capture antibody for the protein it is assigned to. As before, proteins are bound to the beads and decorated with an enzyme-conjugated detection antibody. During the imaging step, the fluorescence is measured twice: once on the bead itself to identify the protein and once in the well to quantify the enzymatic product. The two measurements must be at nonoverlapping wavelengths, and care must be taken to avoid false positives due to optical and chemical crosstalk between beads. Using this system, Rissin et al. 19 demonstrated the simultaneous detection of four cytokines (tumor necrosis factor [TNF]–α, interleukin [IL]–6, IL-1α, and IL-1β) in plasma.
Commercial products
Digital ELISA technology using Simoa has been commercialized by Quanterix (MA). The flagship product, the Simoa HD-1 Analyzer ( Fig. 4A,B ), was covered in a 2016 article in the Journal of Laboratory Automation, the predecessor of the SLAS Technology Journal. 15 The HD-1 uses a workflow similar to work by Rissin et al. 16 described above, except that during partitioning, the commercial system uses a sealing oil instead of a PDMS gasket, 20 and the commercial system has automation and multiplexing capabilities. The consumable disc contains 24 flow cells, each with 216,000 microwells with a 40-fL volume (4.25 µm diameter × 3.25 µm height). Quanterix currently offers digital ELISA test kits for 30 different antigens, which are said to have 100 to 1000 times improved sensitivity over conventional ELISA, with limit of detection (LOD) in the range of 0.1 fM and coefficients of variation (CVs) <10%. The dynamic range is extended to 4 to 5 log by using Poisson statistics (digital counting) at low concentrations and averaging the fluorescence from each partition (“analog detection”) at higher concentrations. 17 The HD-1 system requires about 15 min for binding the target to the beads, 5 min for binding the antibody, and 5 min to bind the SBG reporter. Then, the sample is exposed to the fluorogenic substrate resorufin-β-D-galactopyranoside (RGP), partitioned, and imaged. 21 The Quanterix system can accommodate antibody affinities (KD) from 10−11 to 10−9 M and recommends kon of >105 /M-s. 22
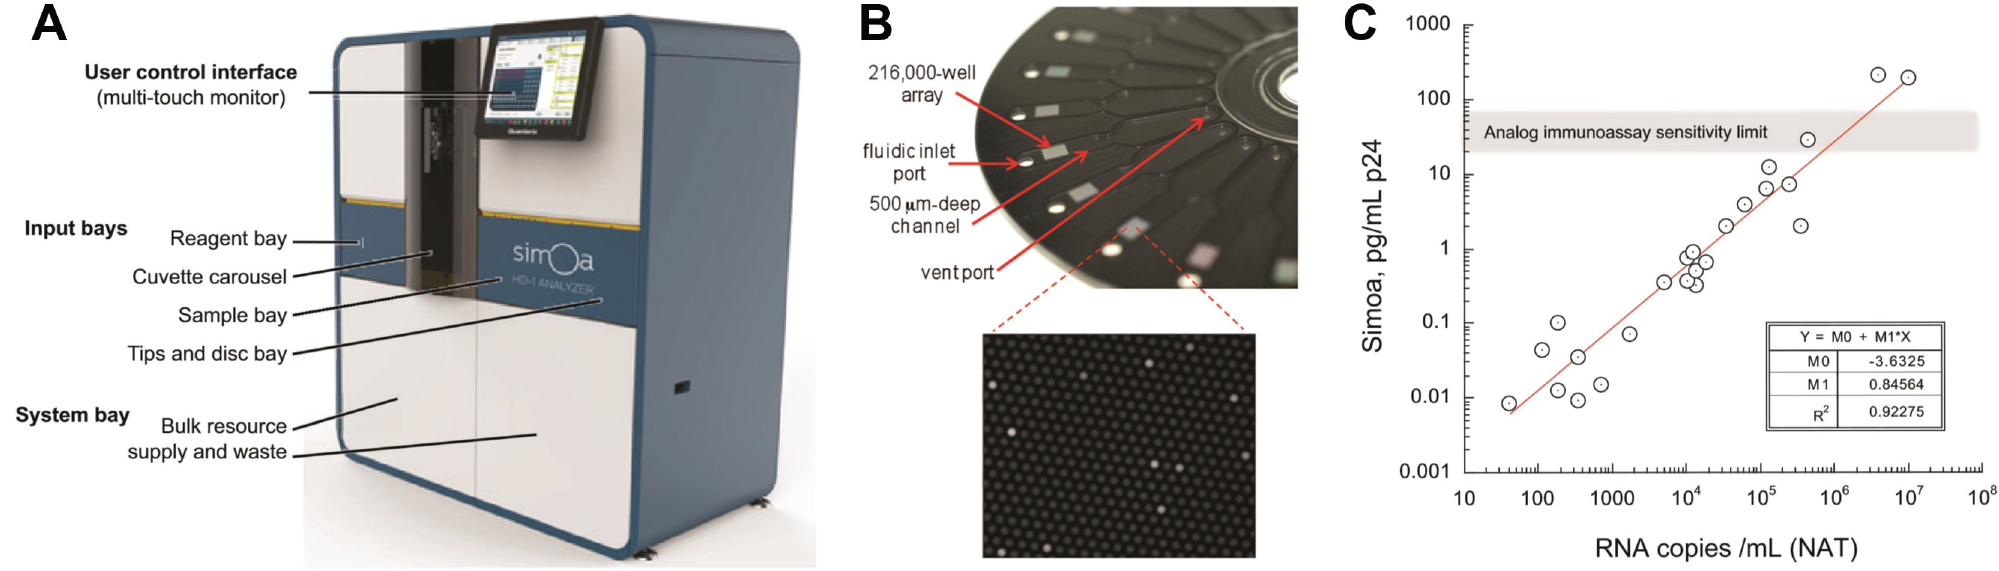
(
With regards to sensitivity, the Quanterix system achieves a LOD in the sub pg/mL range, 3 log smaller than traditional ELISA. 15 High-sensitivity methods like immuno-PCR 23 and biobarcode assays 24 achieve 2 log better improvement over ELISA but are less amenable to automation. The closest competitor to digital ELISA is the Erenna Singulex Immunoassay System (EMD-Millipore, Billerica, MA), which also achieves 3 log smaller LOD than ELISA. 25 The Erenna system counts individual fluorescently labeled immune complex using a confocal single-molecule cytometer. It achieves a 4-log range, <1-fM detection limit, and 7% CV. The Simoa HD-1 achieves similar sensitivity and dynamic range but also provides multiplexing capabilities (up to 6), 26 although multiplexing proportionally reduces the number of beads per target and, consequently, the dynamic range. The original Singulex system was designed for a single fluorophore, but in 2016, Singulex reported a triplex system that can detect IL-4, IL-6, and IL-10 with LOD in the 1-pg/mL range. 27
Applications of digital ELISA
The commercial push in digital ELISA is to detect low-concentration protein biomarkers in blood serum, leveraging the 3-log lower LOD compared to traditional ELISA. 15 Examples include biomarkers for cancer (prostate-specific antigen [PSA] at .1–100 pg/mL), neurological disorders (tau protein at 1–10 pg/mL), inflammation (cytokines TNF-α and IL-6 at <5 pg/mL), early stage human immunodeficiency virus (HIV) (p24 at .01–10 pg/mL), and cardiovascular disease (troponin at 10–100 pg/mL). For example, digital ELISA has been used to detect PSA in serum with an LOD as low as .05 pg/mL (0.4 fM). 28 With a sensitivity 2 log lower than conventional PSA, digital ELISA enables monitoring PSA levels in patients who have had PSA-producing tissue removed by prostatectomy. Schubert et al. 21 adapted the same assay for quantifying PSA expression in single prostate cancer cells and showed that expression can vary from cell to cell by two orders of magnitude (104−106 copies) due to genetic drift. A later study in a mouse cancer model showed that increased PSA is correlated with tumor growth and, more important, can predict tumor growth. 29 Mice inoculated with 10,000 to 100,000 cancer cells were monitored weekly for PSA. PSA levels of 10 fg/mL could be detected using digital ELISA but not with conventional ELISA. The PSA levels grew exponentially until week 6, when tumors could be visually observed. In some cases, the low LOD can lead to less invasive clinical diagnostics. For example, the neuronal protein tau, a marker for Alzheimer disease and hypoxic brain injury, is typically detected in the cerebrospinal fluid (CSF) but is also present in the peripheral circulation at a sub <100 pg/mL concentration where it can be detected by digital ELISA. Automated systems enable serial monitoring of these markers for early diagnostics, monitoring treatment efficacy, and posttreatment screening. Song et al. 30 developed an assay for amyloid-β 1-42, a marker associated with plaque formation in Alzheimer disease (AD) patients, in clinical plasma samples. They demonstrated lower LODs in the .3-pg/mL range, suitable for detecting rapid changes in response to AD therapeutics. Song et al. also demonstrated the first measurement of cytokines TNF-α and IL-6 in the plasma of Crohn disease (CD) patients, with LODs of 8 and 6 fg/mL, respectively. 31 The latter was found to be elevated in CD patients (10.9 pg/mL) and decreased 56% after therapy. Rivnak et al. 26 extended this work to a multiplex assay for six inflammatory markers for CD and diabetes, with a 10- to 30-fg/mL LOD for each marker. Wilson et al. 28 reported early detection of p24 in early stage HIV patients, prior to immune response. The p24 limit of detection was 2.5 fg/mL, and the marker levels correlated with viral RNA levels measured with a nucleic acid test ( Fig. 4C ).
Digital Cell Assays
The third type of digital assay involves the encapsulation of discrete numbers of cells in small-volume partitions. Compared to the digital assays with nucleic acids and proteins, digital cell assays span a much broader scope, a testament to the complexity of the cell itself. Whereas digital PCR focuses only on quantitation, and digital protein assays focus on quantitation and single-molecule kinetics, digital cell assays measure many aspects of cell phenotype and genotype: intracellular and extracellular gene expression, surface biomarkers, kinetic activity of cellular proteins, metabolic activity, cell secretions. It also includes genome and transcriptome sequencing. Each of these topics will be covered in turn.
Digital cell assays can be considered a subset of single-cell analysis, a vast area of research that is beyond the scope of this review but is covered extensively elsewhere.32–41 Here, we focus specifically on the subset of single-cell assays that exploit the partitioning of single cells into isolated containers, as was the case with the other digital assays. The methods discussed here fall into two categories: (1) encapsulating single cells with fluorogenic substrates for enzymatically amplified detection of proteins or metabolites and (2) co-encapsulation of single cells with barcoded beads for sequencing and transcriptomics. Methods of single-cell analysis not covered in this article include super-resolution microscopy,42–45 high-content (image) analysis, single and multicolor flow cytometry,46–50 imaging flow cytometry,51,52 single-cell mass spectrometry, mass cytometry, micropipette aspiration, and patch clamping.53–56
Opportunities and Challenges of Digital Cell Assays
From the standpoint of the cell biologist, partitioning cells is motivated by the desire to (1) study cellular processes at the single cell level and (2) better understand cell-to-cell variability in biological systems.
In conventional cell culture on a petri dish or well plate, a cell is akin to a fish in an ocean—any secretions are quickly diluted in an infinite extracellular volume and may even be masked by the secretions of other cells within the culture.57,58 In contrast, if a single cell is encapsulated in a volume comparable to the cell itself, any secretions and uptake will cause detectable changes in the partition’s composition. Examples include the metabolic exchange of nutrients and waste products or the enzymatic activity of secreted or surface proteins. Such changes in the extracellular environment cannot be easily detected with imaging or flow cytometry; however, with digital encapsulation, these changes can be detected with high sensitivity with the help of fluorogenic substrates and enzymatic amplification. Enzyme-linked reporters can also be used to quantify cellular proteins. As before, miniaturizing partitions make them more sensitive to changes in the extracellular space, thus providing high sensitivity. The concepts are demonstrated in many of the assays described in this section and summarized in Figure 5 .
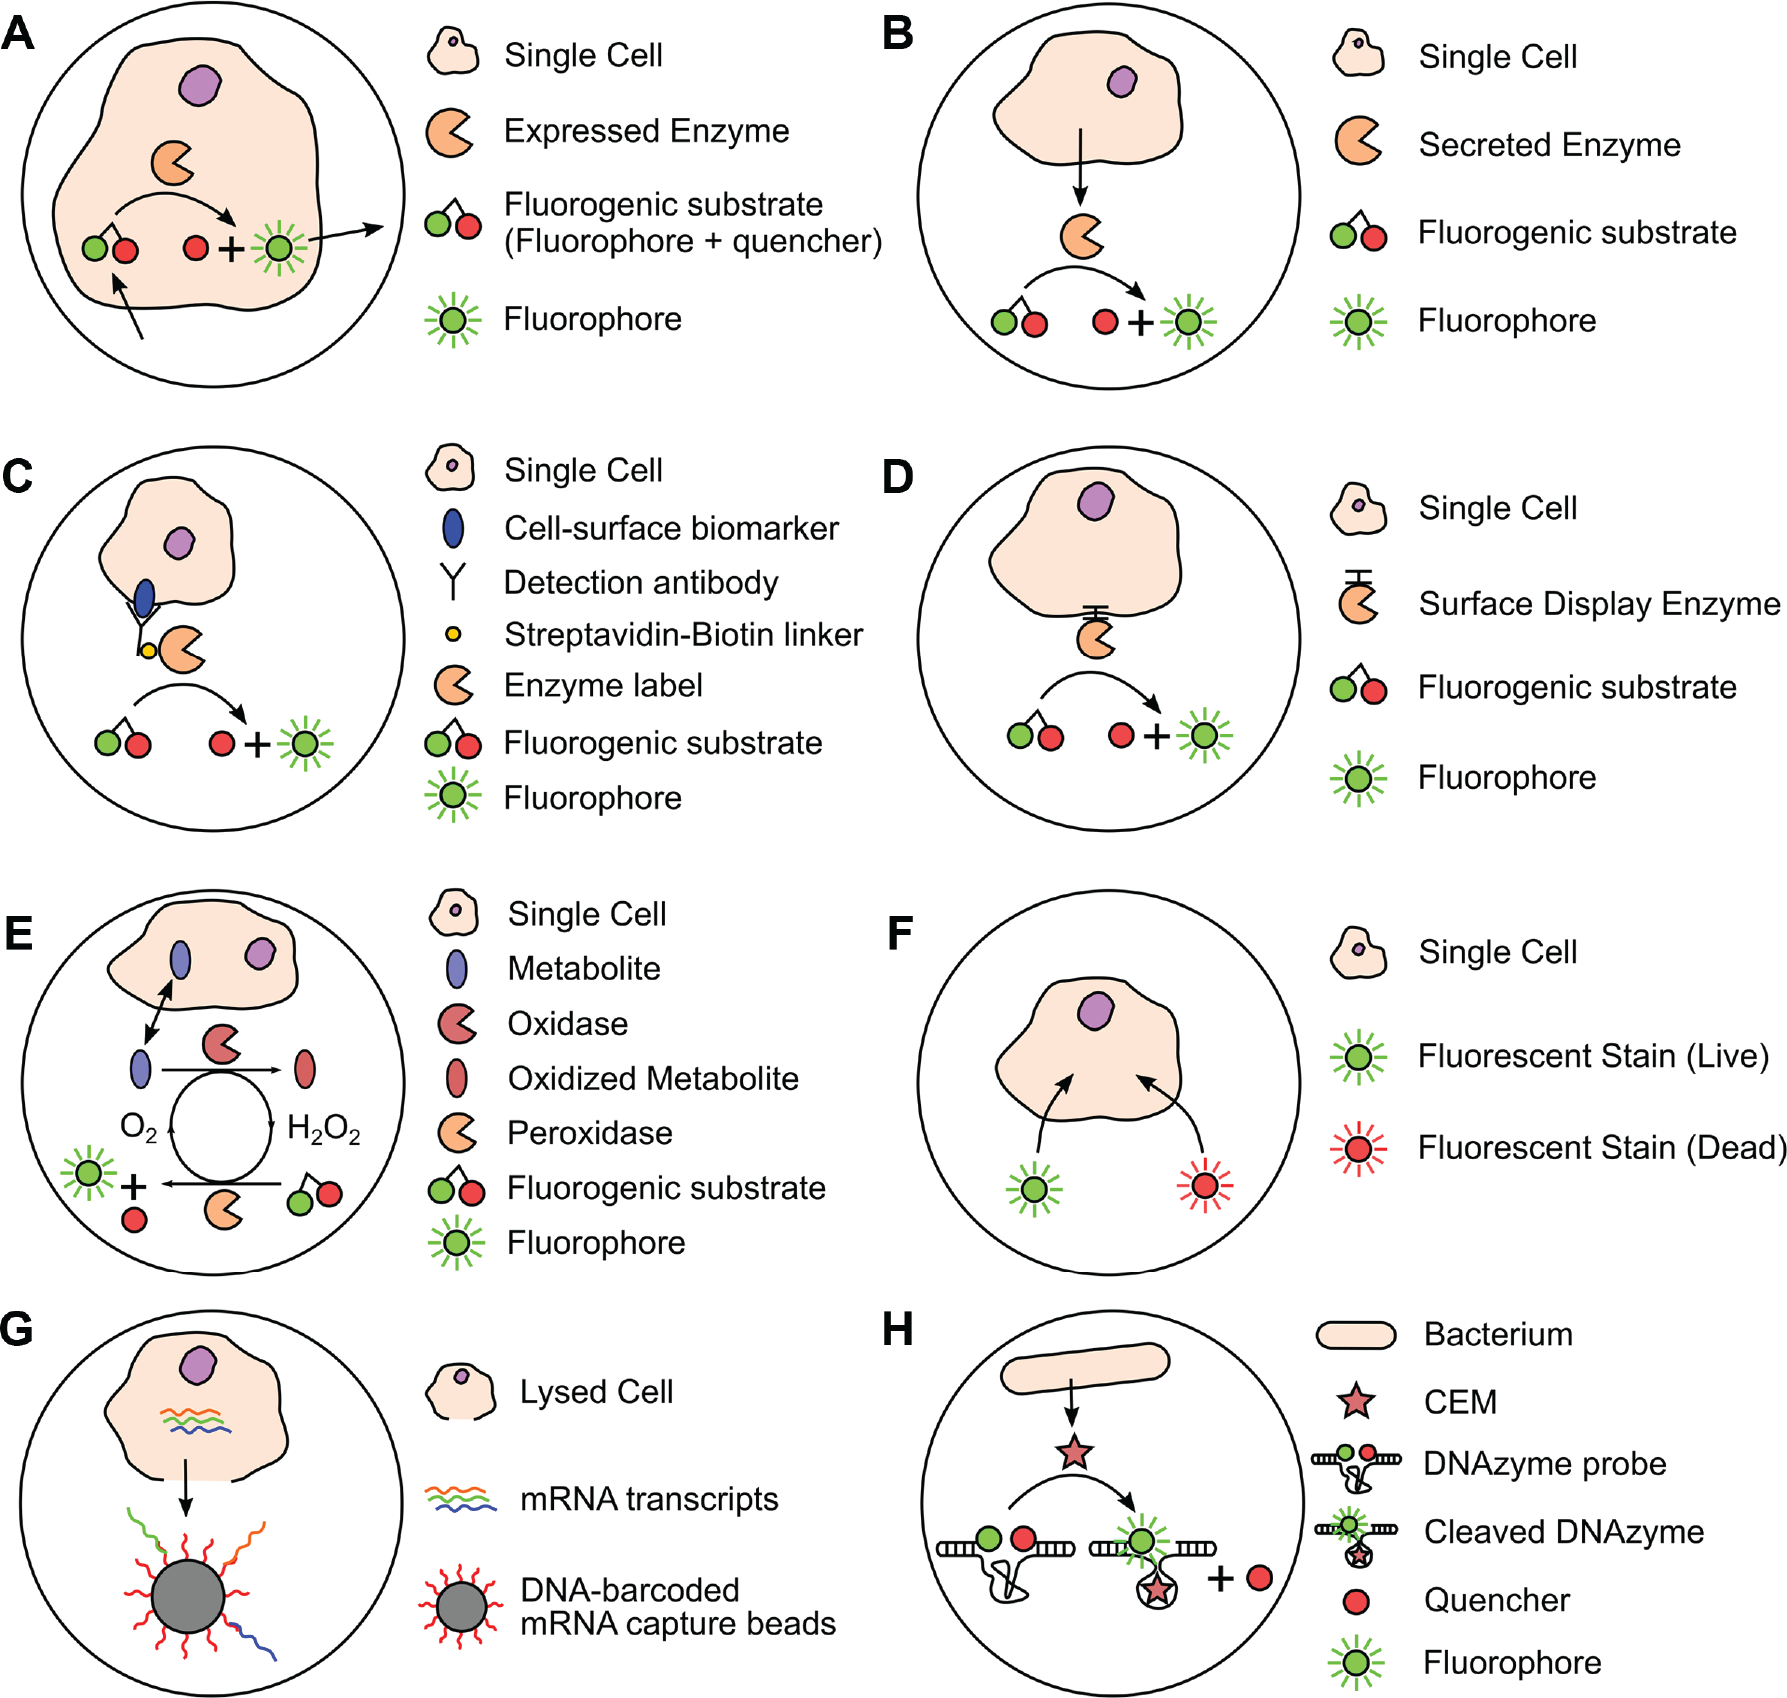
Comparison of digital cell assays. (
Single-cell assays enable the study of cell heterogeneity in populations, an area of growing interest with implications in disease pathology, immune response, development, differentiation, and general organism function. 59 High-throughput digital cell assays can help statistically quantify genomic or phenotypic differences between cells and, based on that, classify cells into subpopulations. For example, natural microbial populations are composed of many diverse cell types and phenotypes, many of which cannot be cultured individually. 60 Bulk metagenomic sequencing is unable to resolve the genomes of low abundant species 61 or their metabolic functions in a microbiome. 58 Even in monoclonal cell populations cultured identically (both prokaryotes and eukaryotes), cell-to-cell variability arises due to stochastic differences as well as defined mechanisms. 62 It is known, for example, that bacteria in an isogenic colony differ greatly in their expression of proteins, referred to as expression “noise,” due to stochastic differences in molecular pathways or their kinetic rates.58,63 Other phenotypic differences could include variation in metabolic activity, soluble factors secreted to the extracellular environment, cytoskeletal properties, the number of ribosomes, and cell cycle states. 62
Single-cell heterogeneity has practical and clinical implications. For example, in antibiotic resistance studies, adaptive (nonmutative) resistance of bacteria is known to be correlated with phenotype heterogeneity. 64 In infection pathology, the spatial organization of a cell is linked to phenotypic traits that enhance resistance to viral infection. 65 In immunology, genetically identical cells with diverse phenotypes together mount a host’s immune response. 66 In oncology, tumors are known to have a diversity of phenotypes due to genetic mutations, environmental cues, and other factors.67,68 Understanding the mechanisms of tumor heterogeneity can lead to better monitoring and the development of targeted therapies. These examples are illustrative but are by no means exhaustive.
Chamber and Droplet-Based Implementations
As with digital PCR and digital protein assays, single-cell assays can be implemented in chamber or droplet-based platforms. Both must address technical issues related to single-cell assays, including cell encapsulation, obtaining small partition volumes, maintaining cell viability, and detection. These issues are briefly outlined here, but for a more in-depth discussion, the reader may consult other excellent reviews.69–72
Chamber and droplet-based implementations
Chamber-based digital cell assay systems use sealed microchambers to encapsulate and isolate single cells. Using the flexible membrane valve technology developed by Unger, Quake, and colleagues, 73 cells can be loaded into chambers and sealed using a network of on-chip valves. This approach has been commercialized by Fluidigm (South San Francisco, CA), which now provides a wide variety of tools for single-cell analysis (many of which are out of the scope of this review). Droplet-based systems use flow focusing channels 74 to encapsulate cells in monodisperse water-in-oil (W/O) emulsions. 70 Historically speaking, the concept of emulsification to compartmentalize single-cell secretions was established well before microfluidics; cells were encapsulated in water-oil-water (W/O/W) emulsions generated by agitation or vortexing75,76 and subsequently analyzed by flow cytometry. 77 However, these methods produced large drops with wide size deviations, resulting in several issues. Large drops increase the time required to generate sufficient fluorescence and may lead to saturation if enzymes completely consume the substrate. Large drops are also more likely to contain multiple cells, so the secretion response is averaged over the population, making it difficult to identify high- or low-performing mutants. 78 Last, the emulsions are generated randomly but analyzed serially, making it difficult to pinpoint the start time of the assay. With microfluidic droplet generators, size can be tightly controlled, single/double emulsions can be made reproducibly, and cell loading, though still subject to Poisson statistics, is more predictable due to the uniform droplet size. 79 Incubation times can also be well controlled by maintaining the order of droplets in channels. For short reaction times, droplets allow precise control of reaction time when the detector (usually fluorescence) is placed a fixed distance downstream from the droplet generator. For long reaction times, droplets are immediately flown into low-temperature vials to stop the reaction until all droplets are collected. After a fixed incubation period at a chosen temperature, the temperature is again lowered as the drops are reinjected into the chip for analysis. 80 Multiple reviews discuss the growing use of droplets for high-throughput single-cell biology.57,70,71,81–83
Single-cell encapsulation efficiency
For single-cell studies, one would ideally like to have 100% encapsulation efficiency (i.e., all partitions contain a single cell). In chamber-based systems, cells can be directed to partitions using valving, as is done with the Fluidigm systems. In droplet-based systems, however, cells are subject to random encapsulation, governed by Poisson statistics, which leads to poor encapsulation efficiency. To ensure that <2% of the occupied drops contain multiples, the cell suspension must be diluted to λ = 0.040, in which case only 3.8% of drops contain a single cell. 84 This problem is exacerbated when co-encapsulating multiple targets. However, it is possible to manipulate and order cells within the fluid prior to encapsulation such that the encapsulation efficiency is improved. Edd et al. 84 used inertial ordering to improve efficiency two times while maintaining throughputs of 15 KHz. Using inertial ordering in a curved microchannel, 85 Kemna et al. 86 demonstrated encapsulation efficiencies of up to 77% while still maintaining a throughput of 2700 cells/s. Chabert et al. 87 used hydrodynamic shearing to sort droplet-containing cells by their larger size, at a throughput of 160 cells/s.70,87 Abate et al. 88 used deformable hydrogel beads that could be packed together at the drop generator. Packing the beads enables them to enter the junction at fixed time intervals. The droplet generation rate can be tuned to the same interval, achieving an impressive 98% bead encapsulation efficiency. Although the technique was not extended to cells, it was eventually adopted in a single-cell transcriptomics product by 10× genomics (discussed later). Microdrop generators typically produce a shear of <10 dyn/cm, leading to better cell viability than vortexing methods 79 ; however, nanodroplet generators produce higher shear forces that can potentially damage cells. 89
Maintaining cell viability and phenotype
Single-cell culture, by its very nature, negates the cell’s population context. Therefore, mechanisms of heterogeneity arising from cell-to-cell contact, signaling, or spatial organization62,65 may not occur if the cell is cultured in an isolated manner. For example, differences in insulin secretion among β cells are due to groups of adjacent cells forming secretory units, 90 which would be missed if cells were cultured separately. Thus, cells that require a population context to maintain heterogeneity must be cultured within that context, and a digital assay (if needed) may be used postculture for detection.
In situations where population context is not needed, cells may be cultured in partitions, where the following issues may arise. Eukaryotic cells may require a solid surface to attach to maintain viability. In chamber-based systems, this can be achieved with adhesion proteins on the channel surface, and in droplet-based systems, cells may be cultured in beads that are subsequently encapsulated in droplets. Long-term culture in small partitions is a challenge because cells eventually consume finite levels of nutrients while accumulating waste products within the partition. Bacteria, algae, and yeast cell proliferation slows dramatically in response to waste products. 57 Mammalian cells similarly slow down, for reasons not clearly understood. 57 These issues can potentially be alleviated by cell media exchange, accomplished either by valve operation in chamber-based systems or droplet merging/splitting operations in droplet-based systems. 91 The studies mentioned in this article demonstrate cell viability up to several days, not with nutrient exchange but with incubation in gas-permeable storage materials.70,92
Detection methods
For most of the studies described here ( Fig. 5 ), detection is based on fluorescence generated by enzymatic amplification with fluorogenic substrates. Chamber-based systems use fluorescence imaging, while droplets use either imaging or flow cytometry with laser-induced fluorescence (LIF) detection. LIF provides a high dynamic range but analyzes only a single droplet at a time, leading to longer analysis times. In single-cell sequencing assays, detection is ultimately carried out by the sequencing instrument. Although not described in this review, both chamber and droplet-based platforms can be coupled to a wide range of detection techniques, including chemiluminescence, raman spectroscopy, electrochemical detection, mass spectrometry, mass cytometry, and nuclear magnetic resonance spectroscopy. 93 Droplet-based platforms also include additional methods such as the change in droplet size due to metabolism-driven osmotic ripening, which can detect single yeast cells.94–96 These size changes can be monitored using image processing. 97
Examples of Digital Cell Assays
Figure 5 compares the many varieties of digital cell assays to study gene expression, surface biomarkers, directed evolution, metabolic activity, cytotoxicity, and DNA/RNA sequencing. A common theme is that all methods exploit partitioning, fluorescence, and fluorogenic substrates in some manner to enable single-cell measurements with improved temporal resolution, sensitivity, and differentiation between individual cells. Each method is outlined below.
Intracellular gene expression
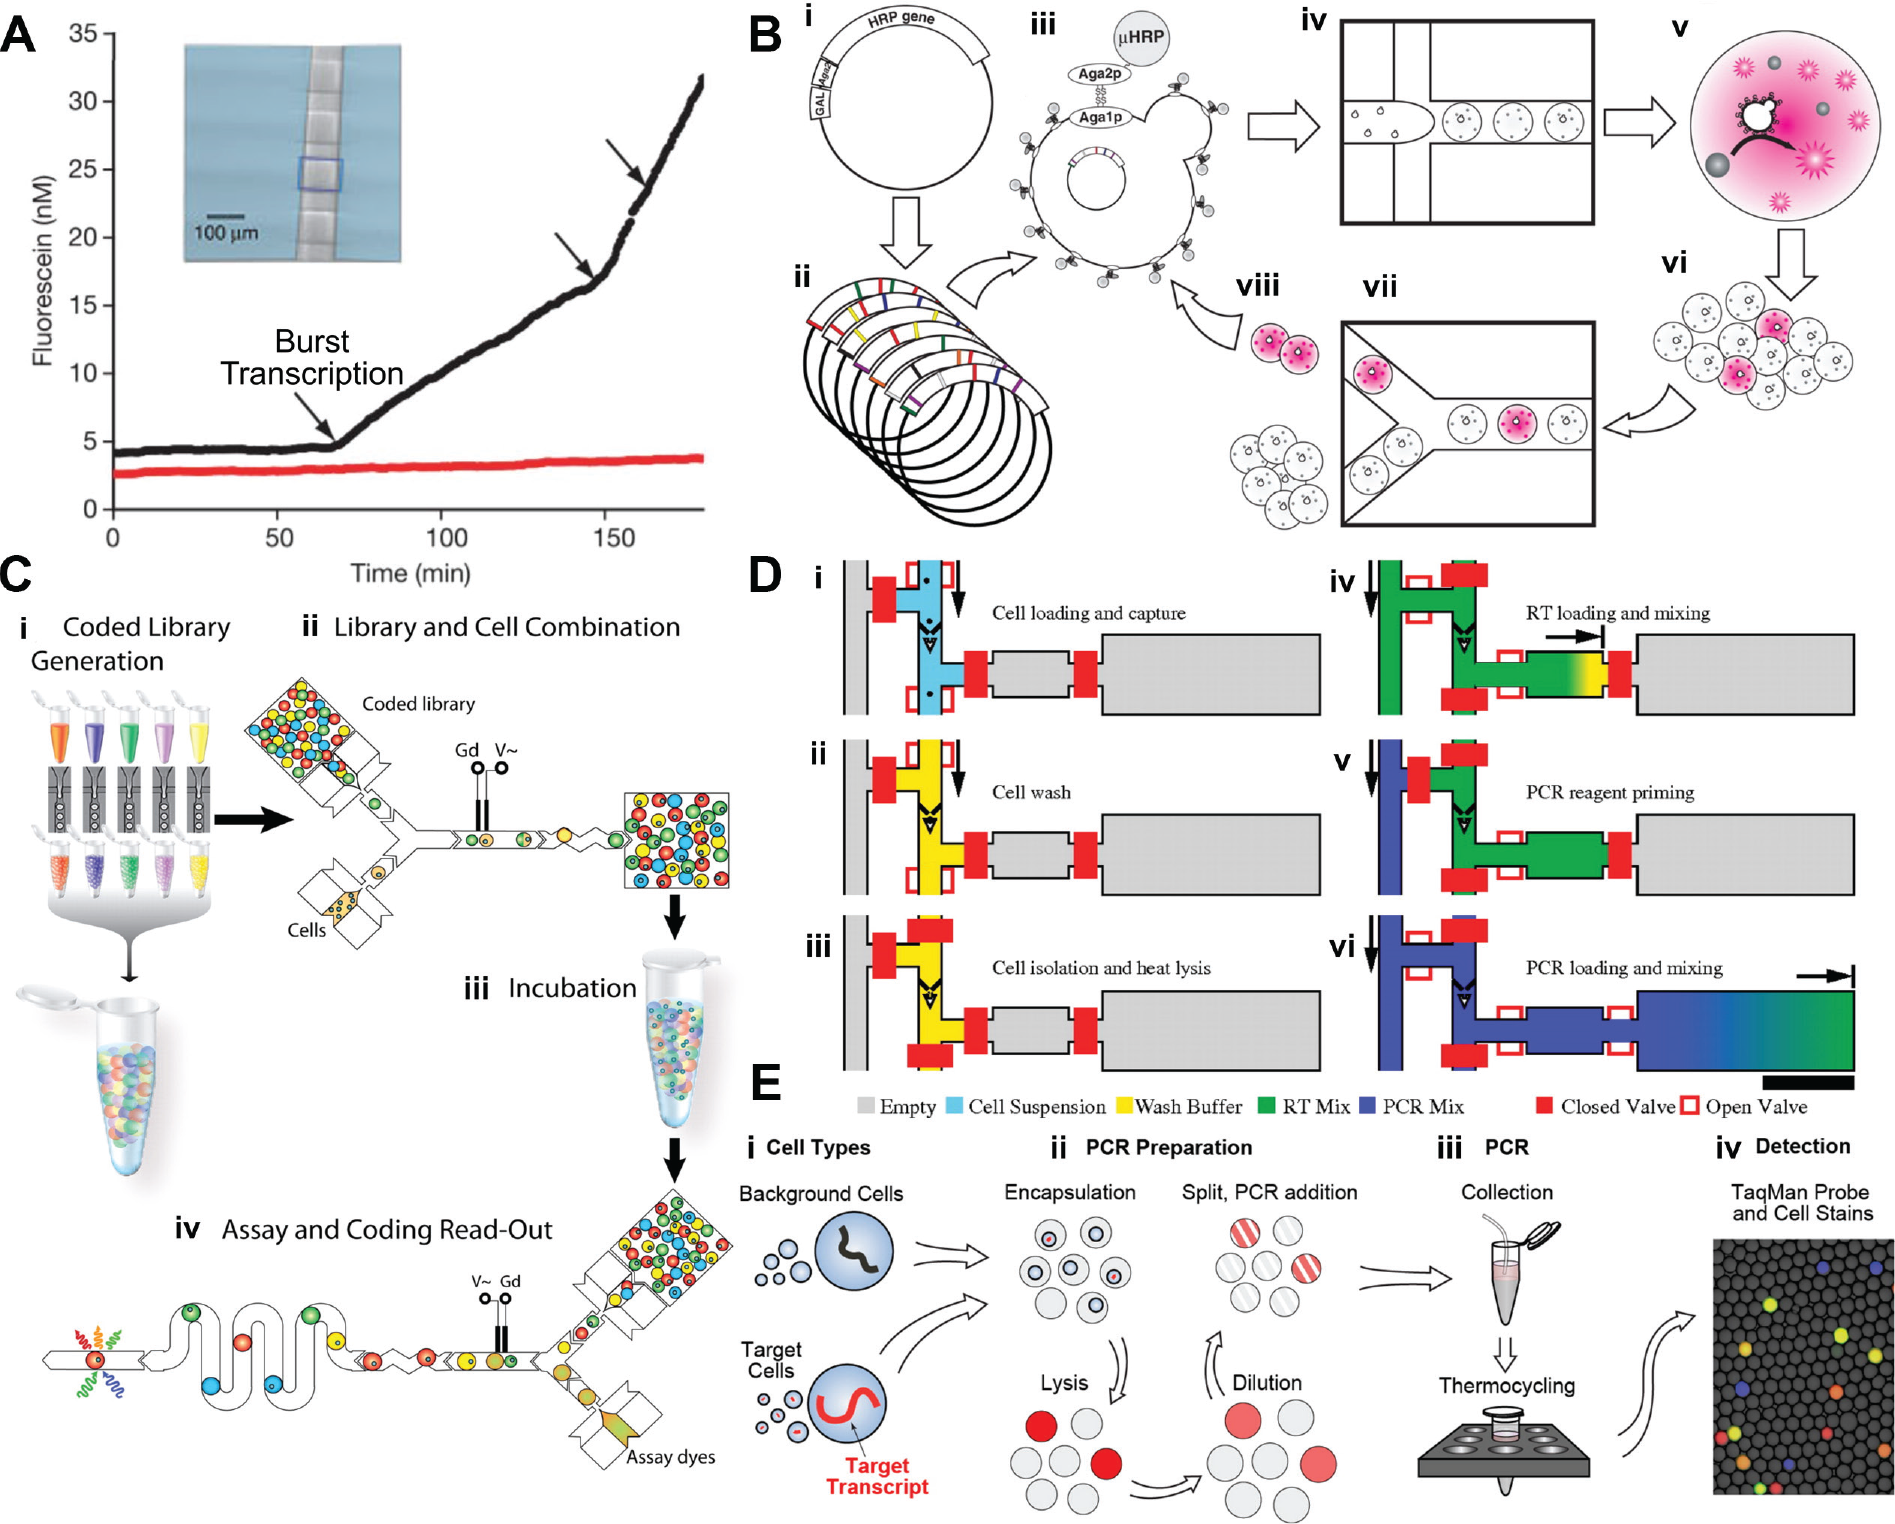
By encapsulating cells in 100-pL partitions, Cai et al. 98 measured single-cell gene expression at a temporal resolution sufficient to resolve individual transcription events ( Fig. 5A and Fig. 6A ). The study targeted β-galactosidase expression in yeast and mouse cells, which were partitioned using membrane valves. Each partition contained the fluorogenic substrate fluorescein-di-β-D-galactopyranoside (FDG), which releases fluorescence when hydrolyzed by β-gal. The rate of fluorescence increase is proportional to the number of enzymes present. When β-gal expression was repressed, the rate of fluorescence increase was found to change in discrete steps, indicating that β-gal molecules are synthesized in short bursts corresponding to binding/dissociation of the lac promotor. Single-cell gene expression has also been implemented on droplet platforms 99 and was used to determine dose-response curves for an injected hormone.
Examples of digital cell assays. (
Extracellular gene expression
A similar approach can be applied to extracellular gene expression ( Fig. 5B ). Ostafe et al. used droplet partitioning to screen yeast cells with high secreted cellulose activity. 78 A cascade reaction detects cellulase secreted within the droplet. Cellulase hydrolyzes carboxymethylcellulose into mono- and oligosaccharides, which can be detected by a series of enzymatic reactions that ultimately cleave the fluorogenic substrate aminophenoxifluorescein (APF), forming a fluorescent product within 20 min (simplified in Fig. 5B ). In cell populations where <1% were actively expressing cellulase, more than 300-fold enrichment was achieved by sorting the fluorescent droplets using a dielectrophoretic cell sorter.100,101
Surface biomarkers
Enzymatic amplification in small partitions has been used to detect low-abundance surface biomarkers ( Fig. 5C ). 80 Low-abundance biomarkers like cytokines cannot be easily detected by conventional flow cytometry, which is better suited to medium-high abundance surface markers (100s to 1000s of copies). By encapsulating cells in droplets, Joensson et al.80 leveraged enzymatic amplification to detect as few as 2.65 copies per droplet. The human monocytic cells were first labeled with biotinylated antibodies and a streptavidin-linked reporter enzyme (β-gal). They were then encapsulated in 40-µm droplets with the fluorogenic substrate FDG and incubated for 5 h to develop fluorescence. By analyzing the droplet fluorescence, the authors could distinguish populations containing low-abundance CD19 and CCR5 receptors from negative controls.
Directed evolution
Directed evolution refers to an iterative process where (1) mutations are induced into a cell population, (2) mutants are selected from a population based on a desired phenotype, and (3) the mutants are recultured to propagate the optimized traits. The process can be iterated several times to obtain mutant populations with highly optimized traits. Discovering and evolving rare mutants requires screening very large populations. In conventional directed evolution workflows using microtiter plates, screening 105 clones requires weeks or months, and the cost of capital equipment and reagents is often prohibitive. 78 Using droplet-based microfluidics, Agresti et al. 102 demonstrated directed evolution of horseradish peroxidase (HRP) with a 1,000-fold increase in speed and a 1,000,000-fold reduction in cost compared to microplates. Yeast cells modified with an HRP surface-display protein were encapsulated in droplets containing a fluorogenic HRP substrate ( Fig. 5D and Fig. 6B ). At each round of evolution, droplets with the highest levels of fluorescence were selected using fluorescence-activated droplet sorting (FADS). 101 In the first round of mutagenesis, 100 mutants were sorted from an initial population of 107 cells, and by the second round, the authors were able to evolve mutants with 10 times faster catalytic activity than the initial population. Due to high-speed microfluidic drop generators and sorters, the workflow could screen 108 mutants in less than 10 h using <150 µL in reagents.
Single-cell metabolic activity
Encapsulating single cells in partitions enables one to quantify the exchange of nutrients and waste products between the intracellular and extracellular space ( Fig. 5E ). By contrast, flow cytometry is suitable for measuring only intracellular activity. As before, small partition volumes allow one to quantify metabolite concentrations and secretions with exquisite sensitivity using common fluorogenic reagents. 92 Wang et al. 103 performed metabolic screening in droplets to identify yeast cells with increased xylose consumption, with the goal of evolving cells to efficiently digest lignocellulosic feedstocks. The cells were cultured and encapsulated in droplets and then merged with drops containing xylose detection reagents consisting of Amplex UltraRed, HRP, and pyranose oxidase. Xylose is oxidized by pyranose oxidase, generating H2O2, which then reacts with Amplex UltraRed in the presence of HRP to form the highly fluorescent compound resorufin. The latter reaction generates O2, which is coupled back to the first. Droplets containing xylose-consuming cells, which have lower fluorescence levels, were enriched by fluorescence-activated droplet sorting. 101 The authors demonstrated 420-fold enrichment in a single round and 42,600-fold enrichment in two rounds. By replacing pyranose oxidase with lactate oxidase, the same system performed a 5800 times enrichment of L-lactate–producing cells from a population of primarily d-lactate producers. Fluorogenic substrates can be applied to a wide variety of metabolites. For example, the HRP/Amplex Ultra Red system can be used with many oxidase enzymes. 103 The oxidase enzyme, specific to the target metabolite, oxidizes the metabolite and H2O2, which then reacts with Amplex Ultra Red in the presence of HRP to generate the fluorescent compound resorufin. The fluorescence is proportional to the concentration of metabolite of interest.
Cytotoxicity
In conventional toxicity screening, the ratio of live/dead cells in response to a chemical agent is determined by fluorescent live/dead staining, followed by imaging or flow cytometry. Brouzes et al. 92 implemented toxicity screening in droplet-encapsulated cells, which detected live/dead fluorescence in both the intracellular and extracellular space ( Fig. 5F and Fig. 6C ). Human monocytic cells were encapsulated in droplets and then merged with droplets containing different concentrations of mitomycin, with each concentration “barcoded” with a proportional concentration of a fluorescent tag (710 nm). Mammalian cells survived for up to 4 days in droplets in fluorocarbon oil, stabilized with a biocompatible fluorosurfactant. After incubation, the droplets were merged with droplets containing Calcein-AM and Sytox-Orange, resulting in 520 nm fluorescence if live or 617 nm fluorescence if dead. This resulted in a triplex fluorescence readout, one channel (710 nm) coding for drug concentration and the other two coding for cell viability. The survival rates for >900 cells were measured as a function of mitomycin concentration, generating a dose-response curve. The curve matched those taken using a standard microplate, although a 10% to 15% error was attributed to the shearing of cells during the encapsulation process. The advantage of droplets is that large libraries can be potentially explored, provided that each sublibrary of a drug can be uniquely barcoded.
Single-cell PCR
Single-cell DNA identification is useful for identifying genetic diversity in polyclonal cell populations like bacterial samples. Partitioning cells before PCR maintains single-cell traceability during amplification. For example, Zeng et al. 79 demonstrated DNA analysis of single cells in droplets, using an approach similar to BEAMing. 104 BEAMing (beads, emulsion, amplification, magnetics) is a technique for high-fidelity multiplex PCR, consisting of the following steps: (1) co-encapsulating primer-functionalized beads with single DNA molecules in droplets; (2) performing emulsion PCR, forming a forest of identical DNA on each bead; (3) collecting the beads with magnets or centrifugation; (4) labeling the DNA by hybridization; and (5) analyzing the beads by flow cytometry. 105 In Zeng et al., a limiting dilution of cells and an equally dilute solution of beads with attached forward primers were co-encapsulated in droplets with an excess of dye-labeled reverse primers and PCR reagents. 79 When cells were lysed in the drop, the DNA with attached reverse primers adsorbed on the beads, forming a complex along which PCR amplification could occur. After several rounds of thermal cycling, each bead contained a forest of adsorbed, dye-labeled DNA. The emulsion was then broken and the beads were analyzed using flow cytometry, relating fluorescence intensity to gene expression. The authors implemented the method on a 96-plex droplet generator array to detect a single pathogenic Escherichia coli among a nonpathogenic population of 105. (Part I discusses the importance of many partitions when detecting rare mutants.) Leung et al. 106 encapsulated single bacteria into droplets and performed whole-genome amplification (WGA) and off-chip sequencing. A key technological advance was a programmable droplet array chip, which provided partitioning, addressable storage, metering, and sample recovery required for off-chip sequencing. Sequencing revealed bacterial diversity in marine and oral samples.
Single-cell reverse transcriptase PCR
RNA quantification is useful in determining cell-to-cell and temporal variation in gene expression. Performing reverse transcriptase (RT)–PCR in nanoliter and picoliter volumes reduces measurement noise, improves sensitivity, and affords single-nucleotide specificity. 107 In RT–quantitative PCR, measurement noise increases significantly when there is less than one template per 100 nL, 108 and cell lysate inhibits the PCR reaction at concentrations >20 cells/100 nL. 107 Therefore, partitioning with precise concentrations is important to maintain amplification efficiency. In 2008, Beer et al. 109 first demonstrated RT-PCR in picoliter droplets (although not on single cells) by co-encapsulating RNA and RT-PCR mix in a droplet followed by thermal cycling. Later, Zhang et al. 110 performed single-cell RT-PCR in agarose droplets containing RT-PCR cocktail along with cell lysis agents. The labeled RT-PCR products were trapped on 5′ acrydite primers grafted to the agarose matrix. The droplets were later solidified into beads, allowing them to be subsequently analyzed by conventional flow cytometry. The system was used to differentiate cells based on their expression of EpCAM, a carcinoma-associated antigen. White et al. 107 demonstrated RT-PCR in single cells using a chamber-based device, where cells were (1) captured in a hydrodynamic trap, (2) isolated by pneumatic valves, and (3) subjected to heat lysis and reverse transcription/amplification ( Fig. 6D ). Single-pot PCR reagents were sequentially added after lysis to perform reverse transcription and isolation. An excess of RT reagent was added after lysing to avoid any inhibition. Using this system, they demonstrated quantitative analysis of miRNA expression, single-nucleotide variation in 300 cells per run. The highest throughput RT-PCR was demonstrated by Eastburn et al., 82 who performed RT-PCR in nearly 50,000 cells by using fast droplet generators and small droplet volumes. To avoid RT-PCR inhibition, they diluted cell lysates using on-chip droplet injection, merging, and splitting modules ( Fig. 6E ). By multiplex analysis, they could identify rare cell types present in as little as 0.3% of the population on the basis of their gene expression.
Single-cell RNA sequencing (scRNA-seq)
Digital partitioning enables single-cell transcriptome sequencing, which has long been considered an epitome for single-cell analysis. While single-cell RT-PCR (discussed above) is useful for quantifying the expression of specific genes, a full-sequence messenger RNA (mRNA) transcriptome provides a de novo, comprehensive analysis of cell heterogeneity. Without digital partitioning, an ensemble of cells can be pooled and their DNA can be sequenced, but this approach yields a metagenome. The two techniques described below combine digital partitioning with barcoding techniques that sequence thousands of single-cell transcripts in a single sequencing run, with each transcript linked to the cell of origin.
Drop-SEQ
First reported in 2015, Drop-SEQ is a method to obtain single-cell transcriptomes of tens of thousands of cells at a time ( Fig. 5G and Fig. 7A ). 111 The experimental technique exploits the massive parallelism offered by microdroplet-based partitioning. Cells are co-encapsulated with microbeads in a droplet containing lysis buffer. In the ideal case, a droplet contains exactly one cell and one bead ( Fig. 5G )—although this is only true of a small fraction of the droplets (see below). Each bead is functionalized with >108 attached oligomer strands, which capture the cell’s mRNA, amplify it, and trace its origin. Each oligomer strand has four sections: (1) a PCR handle, which serves as an attachment point for the replication polymerase; (2) a cell barcode, unique to each bead, which indicates the cell of origin; (3) a universal molecular indicator (UMI), unique to each strand, which is used to count the number of transcripts from each cell; and (4) a 30T sequence, which attaches a single mRNA transcript from the lysed cell. The cell barcodes are 12-base sequences generated by split-pool synthesis on the beads. 112 This method ensures that each bead is assigned a unique barcode, and all barcodes on a bead are identical. By contrast, the 8-base UMIs are formed by degenerate synthesis on all beads and strands at the same time, creating a unique random barcode on each strand.
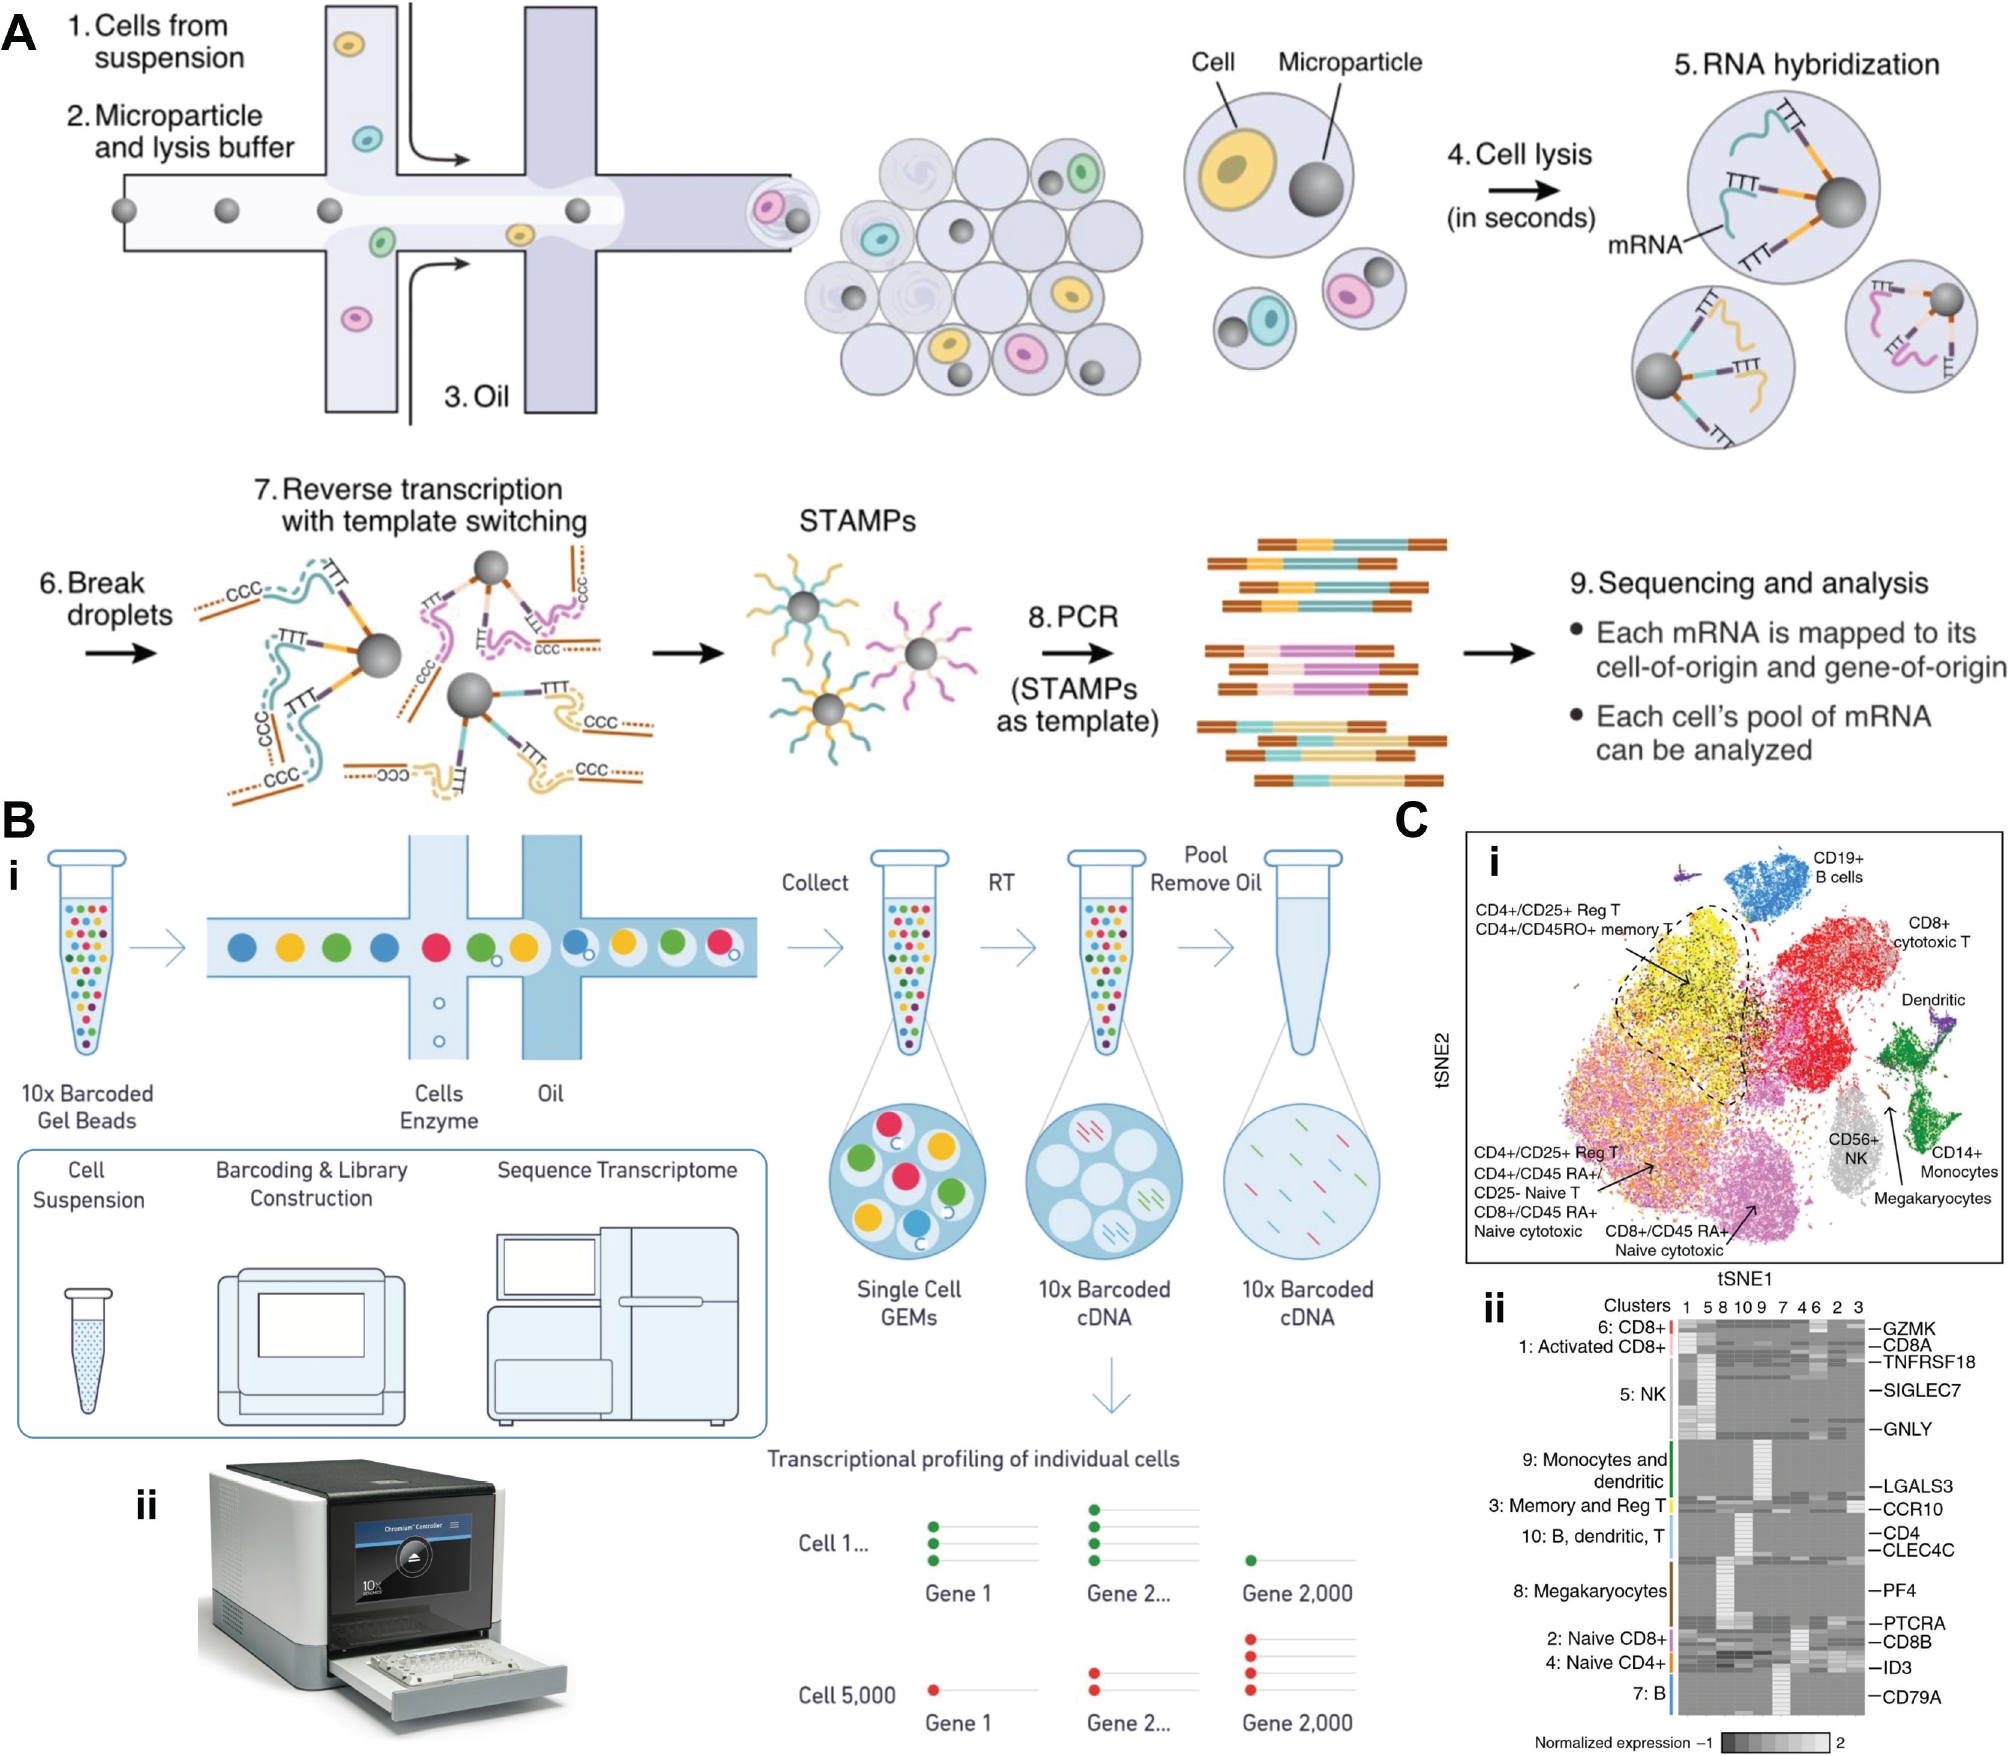
Single-cell RNA sequencing. (
A microfluidic co-flow focusing drop generator is used to co-encapsulate the beads and cells in a lysis buffer. Immediately after encapsulation, the cell is lysed, and its mRNA adsorbs to the beads along the 30T sequence. At this point, the emulsion is no longer needed, so it is broken and the bulk solution is then subjected to reverse transcription, forming a synthesized complementary DNA (cDNA) library on each bead. Template switching is used to add a second primer at the far end of each strand. The bead-oligomer complex is referred to as a STAMP (single-cell transcriptomes attached to a microparticle). Each strand contains the complement of a single mRNA sequence, labeled with a cell barcode and a UMI. Using the STAMPs as templates, the DNA is amplified and sequenced in a commercial synthesizer (such as Illumina, San Diego, CA). During data analysis, the cell barcode and UMI allow each cDNA read to be traced back to its cell of origin. In this way, the transcriptome of each cell can be assembled.
Drop-SEQ has proved to be a powerful method for identifying diversity in complex tissue samples. Macosko et al. 111 analyzed 44,800 retinal cells and could identify 39 distinct subpopulations matching previous studies using manual light microscopy. Moreover, further variation in gene expression could be seen within each subpopulation, suggesting deeper subclassifications in cell type or states. Drop-SEQ can prepare 10,000 single-cell transcripts in 12 h at a cost of $.065 per transcript, which is about 100 times faster and cheaper than conventional methods.
One limitation of Drop-SEQ is the efficiency of co-encapsulation. Only droplets that contain a single cell and single bead provide useful transcripts. A droplet with multiple cells with a single STAMP loses single-cell resolution, and a droplet with multiple STAMPs but one cell would report two identical cell types. Assuming well-mixed solutions, the number of cells in a droplet and the number of beads in a droplet are both independent Poisson distributions, and thus the probability of co-encapsulation is the product of the two. In DropSEQ, choosing the concentration becomes a trade-off between purity (avoiding multiple cells per bead) and throughput (maximizing encapsulation efficiency). For example, if the concentration of cells and beads is at an average concentration of l = 0.1 per partition, the probability of a single cell and single bead is
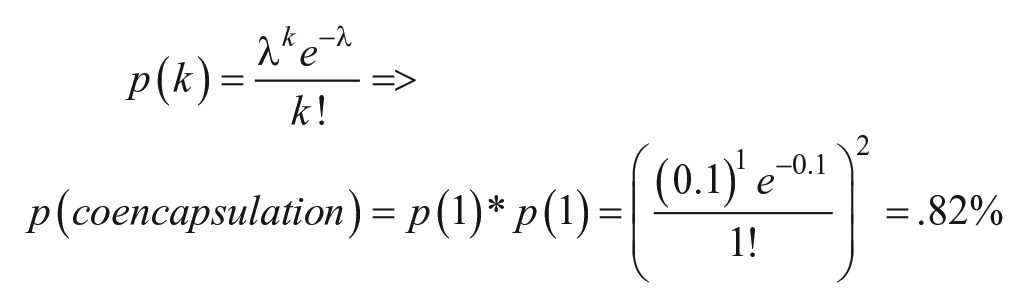
while the probability of a doublet is p(2)*p(1) = .04%. If l is increased to 1 to improve encapsulation efficiency, the probability of a single bead and cell increases to 13.5%, but the double probability increases to 6.7%. Drop-SEQ advocates a high purity mode or a high-speed mode, 111 depending on the application.
10× Genomics Chromium System
A recently available, commercial variant of Drop-SEQ improves on the encapsulation efficiency while providing an off-the-shelf solution to single-cell RNA sequencing. Sold by 10× Genomics, the Chromium system is similar to Drop-SEQ in that it co-encapsulates single cells with barcoded beads; however, Chromium achieves 10 to 50 times better bead encapsulation efficiency by using soft beads made from a hydrogel instead of a hard polymer ( Fig. 7B ). As shown by Abate et al., 88 deformable beads can be tightly packed upstream of a drop generator without clogging the chip. The close-packed, ordered beads flow single file into the drop generator with fixed spacing, resulting in nearly >100% encapsulation efficiency. 113 10× Genomics refers to this technology as gel bead in emulsion (GEM). The cell suspension, added at a second inlet, still has randomized encapsulation; therefore, the combined encapsulation efficiency is only a single Poisson distribution instead of a product of two. The Chromium system obtains 80% encapsulation efficiency of the GEMs and a combined 50% efficiency. The beads are collected and subjected to RT-PCR to create a cDNA library which is then removed and pooled for sequencing. The throughput of the system can be as many as ~50,000 single cells per 6-min run. 113
Like Drop-SEQ, 111 the Chromium system provides high-throughput single-cell gene expression data, which were used to identify subpopulations in immune samples. 113 Zheng et al. profiled 68,000 unsorted human peripheral blood mononuclear cells (PBMCs) using Chromium together with Illumina sequencing. Based on the expression of multiple genes, subpopulations could be clustered using a 2D t-distributed stochastic neighbor embedding (tSNE) projection ( Fig. 7C ). Cell types could then be inferred, as illustrated in the heatmap. Also described in this article was the detection of donor and host cells in bone marrow samples from acute myeloid leukemia (AML) patients. Notable was the ability to obtain transcriptomes from nearly 17,000 single bone marrow mononuclear cells (BMMCs), which are known to be fragile and difficult to measure after chemotherapy.
Linked-read genome sequencing
In addition to studies in cell heterogeneity, the 10× Genomics system enables a new technique called linked-read sequencing, which has shown promise in whole-genome sequence assembly. 114 Whole-genome shotgun sequencing today is based primarily on short reads (e.g., Illumina), which are assembled and aligned to a reference genome. This approach has some limitations: (1) although it can detect short nucleotide variants, it has difficulty in assembling structural variants >1 kbp, including long repeating sequences; (2) it is well suited for aligning a sample sequence to a reference genome but less suited for de novo assembly; and (3) it is difficult to infer chromosome location or phasing. Long-read sequencers (e.g., PacBio, Menlo Park, CA) can address some of these limitations in principle but still have limitations with throughput, cost, and accuracy.
The Chromium system provides so-called linked reads, where long genomic DNA sequences are encapsulated in GEMs. From the long parent molecule, multiple short reads are generated, each with a unique barcode linked to the parent. During assembly, the barcodes help to assemble the parent sequence from the corresponding small reads and infer connections between parents. Linked reads thus provide long-range information for assembling haplotypes, identifying complex structural variants like segmental duplications, covering low-accessibility regions, and performing de novo assembly. 115 Together, the three data types (short, long, and linked reads) provide complementary sets of sequences and mapping information: long reads provide scaffold information, linked reads are used to extend contigs and fill gaps between adjacent contigs generated by long reads, and short reads provide the accuracy for identifying single-nucleotide variations (SNVs). Neighboring scaffolds tend to appear in the same barcoded pools, which helps to identify and orient linked scaffolds.
Combining 10× linked reads together with Illumina short reads, Zheng et al. 113 reconstructed a genome-wide haplotype of a known family sample, demonstrating the ability to identify SNVs, structural changes (deletions, insertions, and inversions), and phasing. Seo et al. 116 performed de novo assembly and haplotype phasing of a Korean genome, using the PacBio long reads, the Illumina short reads, the 10× Genomics linked reads, and bacterial artificial chromosome (BAC) to represent a single haplotype. Mostovoy et al. 114 performed de novo assembly and phasing of a human HapMap sample by combining 10× linked-reads, short reads from Illumina sequencing, and long reads from the Bionano Genomics (BNG, San Diego, CA) mapping system. These studies suggest that a hybrid approach achieves results similar to ideal long reads but at an affordable cost.
Digital detection of pathogens in blood serum
As a final application, digital cell assays also demonstrate strong clinical potential in detecting rare cells in blood. Kang et al. 117 introduced “comprehensive digital droplet detection” (IC 3D), which can detect single bacteria in milliliters of diluted blood. Detecting such low levels is difficult with conventional cell culture or PCR because the high levels of background lead to false positives or inhibition of the PCR reaction (see part I). Droplet partitioning circumvents this issue by increasing the effective concentration of a single bacterium and enriching it from background (see part I of this review). Detection was accomplished using enzymatic amplification by DNAzymes, RNA/DNA hybrid probes, which release fluorescence upon binding with crude extracellular matrix (CEM) secreted by E. coli cells ( Fig. 5H ). Droplet fluorescence was detected using a rotational scanning confocal microscope 118 in a cuvette, achieving rates of 100,000 droplets per second. As a result of the high throughput, the authors were able to analyze mL-scale clinical samples, whereas other droplet systems are typically limited to <100 µL. The system could detect <10 bacteria to as many as 10,000 per sample in ~4 h. A modified version of the system has also been used for miRNA detection in purified blood plasma, 119 replacing the DNAzyme sensor with reagents for isothermal exponential amplification (EXPAR) to amplify and detect specific miRNAs. The IC 3D system is being commercialized by Velox Biosystems (Irvine, CA), a startup company spun out of UC Irvine.
Conclusions
It has been said that significant advances in biology and medicine are accompanied by enabling advances in measurement technology, and this is certainly true of digital assays. Like many scientific advances, the concept of a digital assay is relatively simple but has proved to be powerful in many contexts. In a relatively short time, digital PCR has been commercialized and used for detecting viral and tumor DNA in serum at levels that enable better patient monitoring. A similar story is true for digital ELISA and its ability to detect more than 50 low-abundance serum protein biomarkers with unprecedented levels of sensitivity. Digital cell assays have yielded fundamental insights in the transcription rates within single cells, enabled rapid directed evolution to create high-efficiency enzymes, and helped quantify single-cell metabolic activity. Perhaps the most exciting recent development is single-cell RNA sequencing, which probes the single-cell transcriptomes of thousands of cells in a single run, providing a powerful tool for life scientists to understand cell diversity and their role in disease. Like digital PCR and digital ELISA, single-cell RNA-seq and linked-read genomic sequencing are being commercialized. Extrapolating their rapid adoption, it is likely these tools will soon become commonplace in research and clinical labs, providing a powerful combination of discovery tools (scRNA-seq, linked-read genomics) with clinical diagnostics (digital ELISA, digital PCR). Together with other expected innovations, these tools will accelerate the ever-present push for bench-to-bedside translation of basic knowledge, leading to improved patient care in diseases like cancer, HIV, and neurological disorders.
Footnotes
Acknowledgements
The author thanks Priyan Weerappuli for manuscript review.
Declaration of Conflicting Interests
The author declared no potential conflicts of interest with respect to the research, authorship, and/or publication of this article.
Funding
The author disclosed receipt of the following financial support for the research, authorship, and/or publication of this article: The author gratefully acknowledges support from the National Science Foundation Division of Chemical, Bioengineering, Environmental, and Transport Systems (CBET) award numbers 1236764 and 1512544, and from the Division of Electrical, Communications and Cyber Systems (ECCS) award number 1232226.