
Abstract
While c-MYC is well established as a proto-oncogene, its structure and function as a transcription factor have made c-MYC a difficult therapeutic target. To identify small-molecule inhibitors targeting c-MYC for anticancer therapy, we designed a high-throughput screening (HTS) strategy utilizing cellular assays. The novel approach for the HTS was based on the detection of cellular c-MYC protein, with active molecules defined as those that specifically decreased c-MYC protein levels in cancer cells. The assay was based on a dual antibody detection system using Förster/fluorescence resonance energy transfer (FRET) and was utilized to detect endogenous c-MYC protein in the MYC amplified cancer cell lines DMS273 and Colo320 HSR. The assays were miniaturized to 1536-well plate format and utilized to screen the GlaxoSmithKline small-molecule collection of approximately 2 million compounds. In addition to the HTS assay, follow-up assays were developed and used to triage and qualify compounds. Two cellular assays used to eliminate false-positive compounds from the initially selected HTS hits were (1) a cellular toxicity assay and (2) an unstable protein reporter assay. Three positive selection assays were subsequently used to qualify compounds: (1) 384-well cell cycle flow cytometry, (2) 384-well cell growth, and (3) c-MYC gene signature reverse transcription quantitative PCR (RT-qPCR). The HTS and follow-up assays successfully identified three compounds that specifically decreased c-MYC protein levels in cancer cells and phenocopied c-MYC siRNA in terms of cell growth inhibition and gene signatures. The HTS, triage, and three compounds identified are described.
Introduction
The c-MYC proto-oncogene functions as a master regulator of cell growth, proliferation, and metabolism in normal cells. However, it drives deregulated cell growth in cancer, where it is commonly overexpressed.1,2 With its discovery more than 40 years ago, c-MYC represents an attractive and sought-after therapeutic target for cancer treatment. While attractive as a drug target, the undruggable nature of the c-MYC protein has also been well described and attributed, at least in part, to its structure and function as a transcription factor.3,4 With no enzymatic function to inhibit and no well-defined surface binding pockets for drug action, c-MYC has remained elusive in terms of the identification of c-MYC inhibitors as anticancer drugs.
Some efforts have been aimed at interfering with c-MYC protein binding to its functional partner MAX or to transcriptional promoter regions on DNA or DNA structures that mimic promoter regions such as G quadruplexes.5,6 In addition, c-MYC transcript and protein levels are highly regulated in cells, and various targets and pathways have been shown to be involved. For example, inhibition of BRD4 can result in reduced c-MYC transcripts in cells, 7 and c-MYC protein stability has been shown to be tightly regulated by phosphorylation and the ubiquitin–proteasome system.8,9
A method for direct detection of c-MYC protein could capture transcriptional, translational, and posttranslational mechanisms, all of which have been shown to ultimately impact c-MYC protein levels. A mechanism agonistic screen would also provide multiple pathway targets for small-molecule intervention, increasing the chances of identifying hits that could specifically regulate c-MYC. In addition, such a screen would directly target the defective phenotype in c-MYC-driven cancer cells, namely, the increased level of c-MYC protein.
The observation that both c-MYC protein and RNA transcripts have been shown to have short half-lives in cells10 –12 offered an advantage in terms of screening for small molecules. A short half-life allows dynamic changes in protein levels to be observed in a relatively short period of time. For cellular assays designed to detect signal inhibition, shorter compound incubation times can help mitigate a high number of false-positive hits caused by general cell toxicity mechanisms. While desirable active compounds should ultimately inhibit cell growth in c-MYC-driven cancer cells, growth effects generally require several days of growth to observe measurable differences in cell number using high-throughput homogeneous assays. The time points chosen for the c-MYC screening assays were thus selected to be long enough to observe a change in the protein level but short enough to have minimal effects on cell growth. With these considerations in mind, a straightforward screening approach was used, where HTS hits were identified as small molecules that reduced c-MYC protein levels in cancer cells in less than 24 h.
To ensure specificity, other assays were also developed and used to eliminate compounds that exhibited general effects on cells that were not c-MYC specific. Assays that could detect acute toxicity and general effects on protein translation or RNA transcription were used to eliminate compounds showing these effects. Positive qualification assays were also developed and used to characterize and select compounds that showed desirable effects. These were based on cell cycle blockade or growth inhibition in c-MYC-amplified cell lines, compared with a lesser effect in cell lines not amplified for c-MYC.
As a known transcription factor, c-MYC has been shown to regulate transcriptional programs that are involved in cell growth and metabolism. 13 Because of this known critical function in cells, gene signature panels specific to c-MYC function were identified based on the gene expression changes in response to c-MYC knockdown by siRNA in the cell lines used for the HTSs (data not shown). Genes that showed either increased or decreased expression with siRNA knockdown of c-MYC were selected for panels. Specific reverse transcription quantitative PCR (RT-qPCR) assays were developed for mRNA transcript quantification so that compounds could be tested for their ability to phenocopy MYC knockdown in terms of the gene signature.
DMS273 and Colo320 HSR are characterized cancer cell lines that have been shown to express increased levels of c-MYC through amplification.14,15 In this manuscript, the development of the HTS assays for these two cell lines and the assays that were used subsequently to triage and qualify compounds for further study are described. The key data and chemical structures for the three qualified hits from the two HTSs are revealed.
Materials and Methods
Materials
From Greiner Bio-One North America (Monroe, NC) we obtained 384-well low-volume plates (Greiner cat. 784080), 1536-well plates (cat. 782073), flow cytometry plates, black clear-bottom 384-well plates (cat. 781090), and 384-well CTG assays (cat. 781073). From Thermo Fisher Scientific (Waltham, MA) we obtained RPMI media (cat. 61870127) and GlutaMAX (cat. 35050079). From Cisbio (Bedford, MA) we obtained Kinase lysis buffer (cat. 64KL1FDF), protease inhibitors (cat. 64KB1AAC), and a Cisbio c-MYC detection kit (63ADK053PEC). From Mediatech (parent company Corning, Manassas, VA) we obtained sodium pyruvate (cat. 25-000-CI). From Promega (Madison, WI) we obtained CellTiter-Glo (CTG) reagent (cat. G7573) and Steady-Glo reagent (cat. E2550). From Gibco (Thermo Fisher Scientific brand) we obtained fetal bovine serum (FBS) (cat. 10099-141), TrypLe (1×) (cat. 12563-029), and TrypLe (10×) (cat. A12177-01). From Life Technologies (Carlsbad, CA), we obtained propidium iodide (cat. P3566), RNAi max (cat. 13778-150), and Opti-MEM (cat. 31985-070). From Bio-Rad Labs (Hercules, CA) we obtained Tris Base (cat. 161-0716). From Sigma-Aldrich (St. Louis, MO) we obtained protease inhibitor (cat. P8340), cycloheximide (cat. C4859), DMSO (cat. D8418), trisodium citrate dihydrate (cat. S1804), Spermine (cat. S-1141), NP-40 (cat. I-3021), ribonuclease A (cat. R6513), trypsin (cat. T7409), trypsin inhibitor (cat. T9003), nocodazole (cat. 487928), actinomycin D (cat. A9415), and lovastatin (cat. 438185). From Roche (Basel, Switzerland) we obtained protease inhibitor tablets (cat. 11 836 170 001), and phosphostop phosphatase inhibitors (cat. 04 906 837 001). From Teknova (Hollister, CA) we obtained RIPA buffer (cat. R3792). From Qiagen (Hilden, Germany) we obtained the Turbocapture 384mRNA kit (cat. 72271).
Cell Lines
DMS273 was acquired from the European Collection of Authenticated Cell Cultures (ECACC), Colo320 HSR from the American Type Culture Collection (ATCC), and NCI-H1155 from ATCC (under license, acknowledging A. F. Gazdar and J. D. Minna 16 ) and were maintained in RPMI 1640 plus 10% FBS, 1% sodium pyruvate, and 1% GlutaMAX utilizing standard tissue culture procedures.
Antibody Pair Testing
c-MYC antibodies were custom labeled at Cisbio with europium cryptate and D2 fluorophores. Antibody 1 (see Suppl. Table S1 ), clone Y69 rabbit monoclonal, was purchased from Epitomics (Burlingame, CA; cat. 1472-1). Antibody 2, mouse monoclonal 9E10, was purchased from Becton Dickinson (Franklin Lakes, NJ; cat. 551102). Antibody 3, mouse monoclonal clone 3C7, was purchased from Millipore (Burlington, MA; cat. CBL434). Antibody 4, mouse monoclonal clone CT14.G4, was purchased from Thermo Fisher Scientific (cat. MA1-80579). From Santa Cruz Biotechnology (Dallas, TX) were purchased antibodies 5, mouse monoclonal clone C33 (cat. SC-42), and 6, rabbit polyclonal (cat. SC-764) (see Suppl. Table S1 for information on the c-MYC epitopes against which they were raised and the antibody type). Antibodies were diluted to 1.5– 20 ng/well, based on recommendations after labeling with fluorophores. Two microliters per well of each of the donor and acceptor antibodies plus 10 µL of lysate was added to each well and incubated for 4 h at room temperature in the dark. Plates were read on an Envision reader (PerkinElmer) equipped with 665 acceptor/615 donor filters.
Lysates
Lysates for Western blots and antibody pair testing were prepared by harvesting cells by centrifugation, washing in phosphate-buffered saline (PBS), resuspending in RIPA buffer with protease (Roche protease inhibitor tablets) and phosphatase inhibitors, and incubated for 45 min at room temperature before centrifugation at 15,000g for 10 min at 4 °C. Supernatant was transferred to a fresh tube and used or frozen at −80 °C until use. For Western blot, standard methods for protein gel and transfer to nitrocellulose were used. C-MYC and tubulin were detected on the blot with 1:2000 c-MYC Epitomics antibody (cat. 1472-1), and 1:10,000 anti-tubulin antibody (Sigma; cat. T9026). Licor secondary anti-rabbit (cat. 926-68071) and anti-mouse (cat. 926-32210) antibodies were diluted 1:10,000 before scanning the blot on a Licor Odyssey instrument.
Homogeneous c-MYC Detection Assays
Compounds, cells, and reagents were added to 384-well plates with a Multidrop Combi (Thermo Fisher Scientific) or multichannel pipettor and incubated at 37 °C in 5% CO2 conditions for the indicated times. Lysis buffer with protease inhibitors was added and incubated for 1 h at room temperature, and then labeled antibodies were added and incubated for 4 h in the dark before the plates were read on an Envision or Viewlux (PerkinElmer) plate reader. Low-volume 384-well assay volumes were 10−17 µL cell assay volumes. For 1536-well assays, compounds were predispensed at 100× in DMSO for a final screening concentration of 10 µM and 1% DMSO with the GlaxoSmithKline (GSK) automated compound dispensing system. Five thousand (DMS273) or 4000 (Colo320 HSR) cells in 3 µL were plated and incubated for 4−24 h before 2 µL lysis reagent was added, and plates were incubated for 1 h at room temperature. Then 2 µL of combined antibody detection reagents was added, and plates were incubated for 4 h before reading on a Viewlux plate reader. The DMS273 HTS was run with cells plated in 0% FBS + 0.01% CHAPS and 50 µM cycloheximide as the low control, with a compound incubation time of 4 h and 0.9 ng of europium cryptate-labeled antibody #1 and 10 ng D2-labeled antibody #2 per well. The Colo320 HSR HTS was run with 10% FBS in the media and a compound incubation time of 24 h with commercial reagents at a 1:100 dilution.
CTG Assays
Cells were prepared, plated, and treated the same as for the c-MYC detection assay.
The CTG was prepared as directed by the vendor, aliquoted, and stored at −20 °C. Reagent was added to cells at 60%−100% volume equivalent to cell volume and incubated at room temperature as directed before being read on a Viewlux or Envision plate reader.
Unstable Luciferase Assay
The luciferase reporter construct was prepared using the luc2P gene from Promega vector pGL4.15(luc2P/Hygro), which was cloned into a vector backbone that could be used to generate BacMam virus (Invitrogen’s Bac to Bac system). BacMam viruses were prepared using standard virus protocols 17 and were used to transduce DMS273 cells in cell culture flasks. For the DMS273 screen triage, cells were incubated overnight, harvested, and prepared at 2 × 10⁶ cells/mL in cell medium plus 0.01% CHAPS, and 5 µL/well was plated into 384-well assay plates containing 50 nL of compound in DMSO. Plates were spun briefly at 500 rpm, incubated at room temperature for 30 min, and then incubated overnight in a tissue culture incubator at 37 °C. Steady Glo reagents from Promega were prepared as described by the vendor, and 5 µL/well was added to assay plate wells with a Multidrop Combi, incubated for 5 min at room temperature, and luminescence detected on a Viewlux instrument.
Cell Cycle Assay
Five thousand cells per well in 384-well plates were treated in 50 µL overnight at 37 °C, plates were spun to pellet cells, and media was aspirated with a Biotek washer. TrypLe was added to the wells and incubated for 10 min, and then the plates were shaken using the Hypercyt instrument (Intellicyt, a Sartorius company, Gottingen, Germany). Plates were centrifuged to pellet cells, the TrypLe was removed, and then 6 µL of each of the following solutions A, B, and C were added: A (0.03 mg/mL trypsin), B (0.05 mg/mL trypsin inhibitor, 0.1 mg/mL RNAse A), and C (21% propidium iodide solution, 1.1 mg/mL spermine). Solutions A, B, and C were all made up in 3.4 mM trisodium citrate, 0.06 mg/mL Tris base, 0.5 mg/mL spermine, and 0.1% NP-40. Solution C was prepared right before use, protected from light, and stored on ice. Plates were shaken and incubated for 15 min at room temperature after each addition and before reading on the Hypercyt (Intellicyt).
siRNA
c-MYC knockdown was performed in 96-well plates at 100 µL total volume with 4000 cells/well using Opti-MEM, RNAi Max, and siRNAs at the concentrations shown above each lane in the Western blot. The following siRNAs were from Qiagen: nontargeting AllStars cat. 1027281; c-MYC siRNA-5, target sequence GAT CCC GGA GTT GGA AAA CAA, sense sequence UCC CGG AGU UGG AAA ACA ATT, antisense sequence UUG UUU UCC AAC UCC GGG ATC; and c-MYC siRNA-7, target sequence CTC GGT GCA GCC GTA TTT CTA, sense sequence CGG UGC AGC CGU AUU UCU ATT, and antisense sequence UAG AAU ACG GCU GCA CCG AG.
RT-qPCR
For
Calculations and Data Handling
GraphPad Prism or ABASE (IDBS) was used to calculate the concentration−response curves (CRCs). Spotfire (PerkinElmer) and ABASE (IDBS) were used to handle HTS data and high-throughput pIC50 values and pivots. Excel was used for simple mathematical calculations such as averages and standard deviations. Instrument software was used for flow cytometry data analyses before secondary analyses in Excel and/or GraphPad Prism. The RT-qPCR ∆∆ct calculations for Figure 3D were calculated using GAPDH as a reference gene, and the relative gene expression values for Figure 6D were calculated utilizing GAPDH as a reference for GSK1897970A in the left panel, and a geometric mean of ACTB, GAPDH, and B2M samples as the reference for GSK2343183A in the right panel (see Livak and Schmittgen 18 for ∆∆ct and relative expression calculation methods).
The hybrid means smoothing calculation for plate pattern correction was performed to eliminate systematic errors, using a radius of 2 (5 × 5 wells) as described. 19 Pattern-corrected responses were then used in subsequent hit selection and compound triage. Robust Z′ refers to a Z′ calculation 20 where up to one in eight outlier data points of replicate wells was eliminated from the calculation.
Results
HTS Strategy
The overall high-throughput screening (HTS) strategy ( Fig. 1 ) was designed to identify small molecules that decreased c-MYC protein levels in the c-MYC-amplified cell lines DMS273 (lung cancer) and Colo320 HSR (colon cancer). The general scheme that was adopted for hit identification and triage is shown, with a c-MYC detection assay at the top of the screening path. The method chosen for protein detection was an antibody-based method known as time-resolved fluorescence (or Förster) resonance energy transfer (TR-FRET). To apply this technique for c-MYC protein detection, two different c-MYC antibodies were labeled with fluorescent probes that worked together as donor and acceptor fluorophores. The fluorescent molecules chosen for this purpose were europium cryptate as the donor and D2 as the acceptor. FRET between the fluorophores occurs when c-MYC protein is present and the two antibodies bind to the target, resulting in physical proximity of the donor and acceptor fluorophores on the antibodies. FRET-based detection systems are amenable to small volumes and homogeneous assay formats and have been commonly used for HTS assays. 21
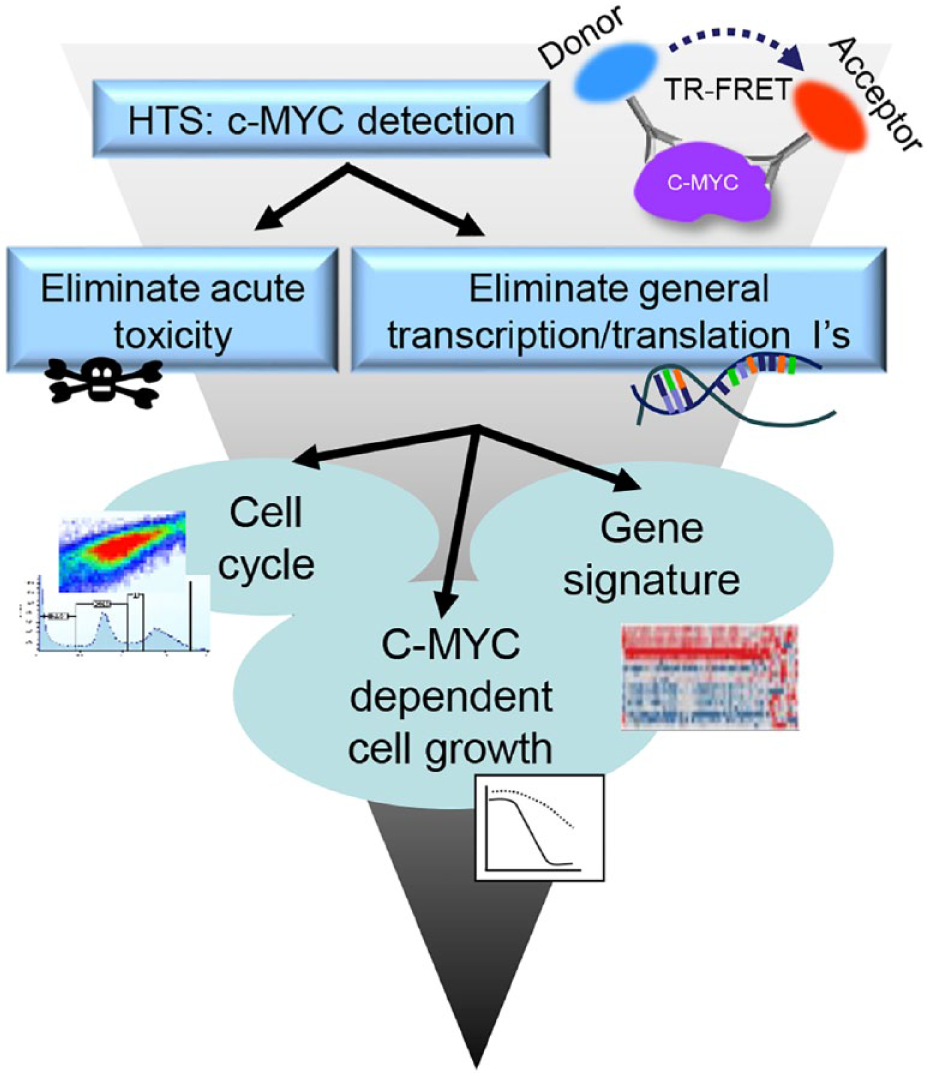
c-MYC HTS and triage strategy. The overall screening strategy was to identify small molecules that reduced the c-MYC protein levels. In addition to the primary screening assay for c-MYC detection, assays were used to eliminate compounds showing general toxicity, transcription, and translation effects. The final steps in hit triage and qualification were to test compounds in cell cycle, c-MYC-dependent growth, and gene signature assays.
As with many cellular inhibition assays, there was a need to eliminate small molecules identified in the initial screen that caused a lower level of c-MYC due to general cellular toxicity. A cellular ATP detection assay known as CTG was used to detect this undesired acute toxicity. Compounds acutely reducing ATP would be eliminated from the list of compounds for further study. Considering the very short half-lives of MYC mRNA and protein, expected nuisance hits would be compounds that inhibit general transcription or translation. For this purpose, a short half-life reporter assay was developed utilizing a luciferase reporter gene containing the PEST sequence, which confers the short half-life. 22
Once the most common nuisance mechanisms could be eliminated, three additional assays were developed and used to assess compound effects on cell growth and transcription. First, a high-throughput 384-well cell cycle assay based on DNA quantification was developed and used to determine the cell cycle and the growth arrest phenotype of compounds. The second assay was a cell growth assay, where the cell lines used in the HTS were grown for more than one doubling time, to assess the effect of compounds on c-MYC-dependent cell growth. The HTS cell lines were known to express high c-MYC protein levels, and c-MYC knockdown by siRNA inhibited cell proliferation by arresting the cells at the G0/G1 phase of the cell cycle, as expected. The cell lines independent of c-MYC for proliferation, based on the knockdown studies conducted, were included as the specificity control for the growth assays. Desired compound profiles would be compounds that showed growth inhibition in c-MYC-dependent cell lines but would not inhibit growth in the control cell lines. The third positive selection assay used to qualify compounds was a gene signature assay. In this assay, panels of genes for each cell line were chosen based on the siRNA knockdown of c-MYC. c-MYC is known to cause both up- and downregulation of other genes; therefore, a panel of genes that included up- and downregulated genes as assessed by c-MYC siRNA knockdown were included. The varying transcriptional programs driven by c-MYC in different tumors and cell types have been described,23,24 prompting the development of unique gene signature panels for each of the two cell lines utilized in these studies. With this overall screening and triage strategy in mind, two different HTS campaigns were undertaken to identify compounds uniquely affecting c-MYC protein levels and c-MYC-driven biology.
Development of a 1536-Well Antibody-Based Cellular Assay for the Detection of c-MYC
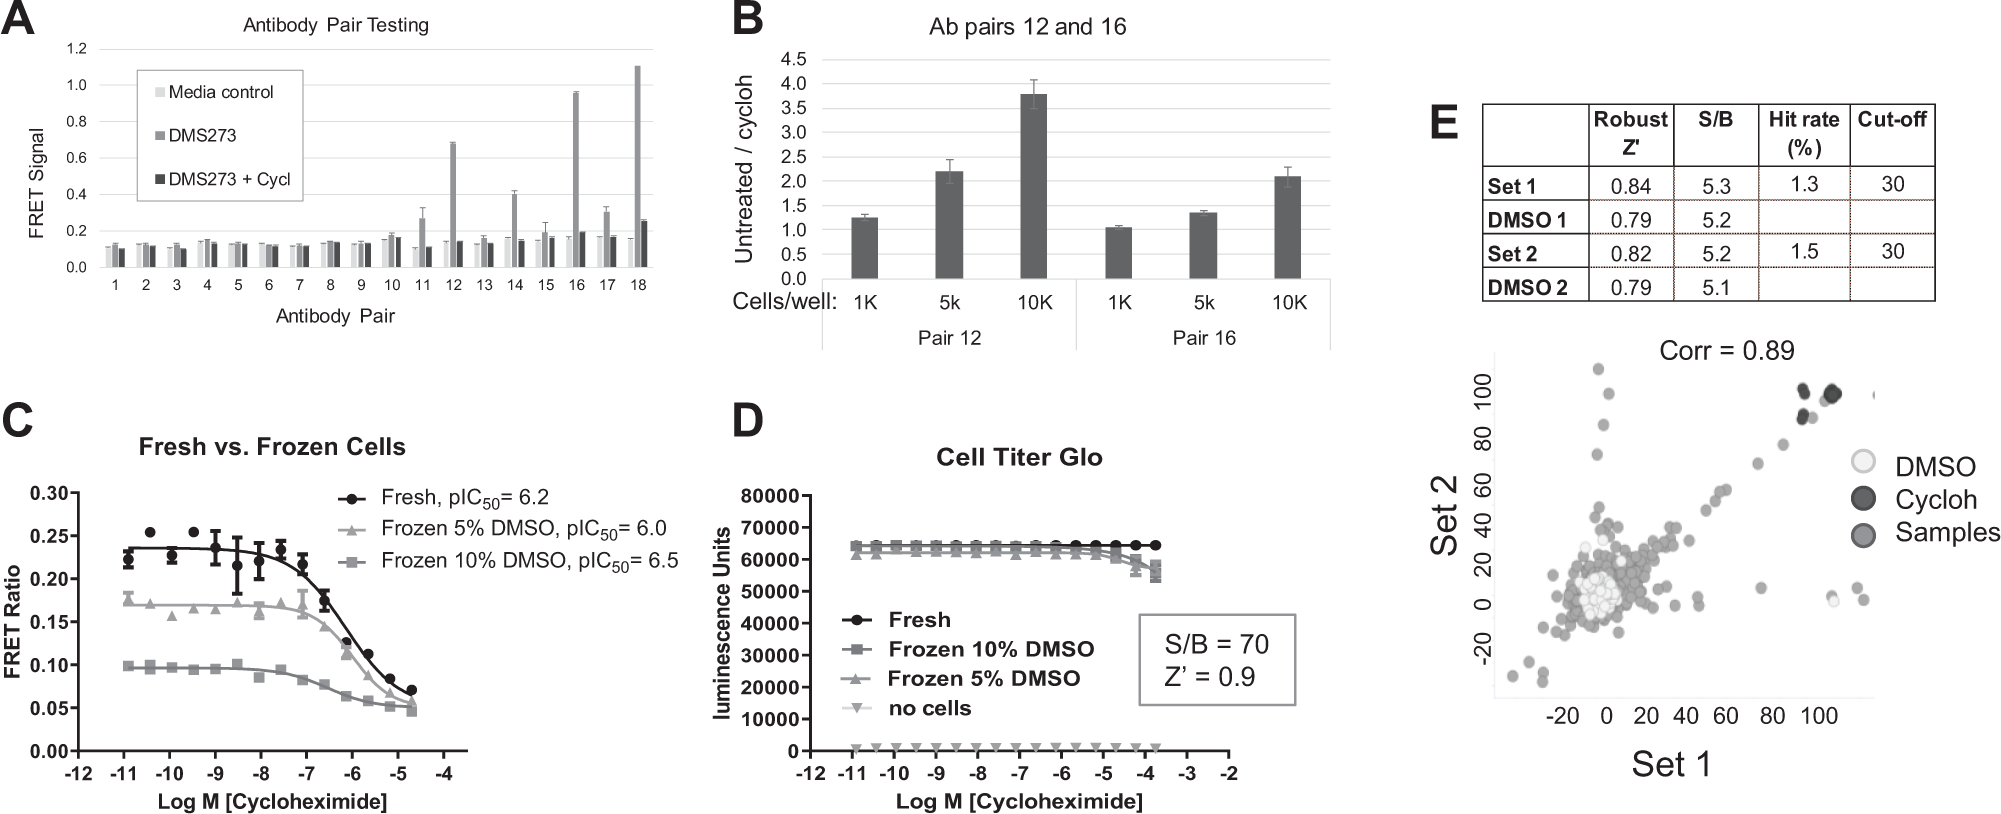
At the time the work was initiated on the DMS273 cell assay, there were no ready-made kits on the market. To build the FRET assay, various commercially available c-MYC antibodies were purchased, custom labeled, and tested in pairwise combination. To test six commercially available antibodies, each was labeled with both the donor europium–cryptate and acceptor D2 fluorophores. Not all possible combinations of antibodies were tested, since identical antibodies were not desired as pairs, and the choices were biased to combine antibodies that were raised against different epitopes. Figure 2A shows data from 384-well experiments where 18 different antibody combinations were tested. Since the final assay conditions could potentially require optimization of cell lysis conditions, antibodies were initially tested in cell-free lysates that were prepared in advance of the experiment. Lysates from both untreated and cycloheximide-treated DMS273 cells were prepared; DMS273 cells treated with the protein synthesis inhibitor cycloheximide were expected to lack c-MYC protein, due to the short half-life of c-MYC. The untreated cell lysate control was expected to contain high c-MYC protein levels because of the amplification of c-MYC in this cell line. Of the 18 different antibody pairs tested, pairs 10, 13, 15, and 17 showed weak c-MYC-specific signals, and pairs 12, 16, and 18 showed stronger c-MYC-specific signals. In these antibody combinations, a higher FRET signal in untreated DMS273 lysate was observed, compared with the cycloheximide-treated lysate. The higher background signal observed in the DMS273 cycloheximide-treated sample and the fact that the antibodies were both directed against the N-terminus of c-MYC were reasons for eliminating antibody pair 18. Figure 2B shows signal/background (S/B) calculations from an experiment with DMS273-untreated/cycloheximide samples for favored antibody pairs 12 and 16, at several different cell densities. The highest S/B values for the DMS273 lysates were observed with antibody pair 12, and therefore, this antibody pair was selected for the HTS. The positive and robust FRET signal observed with the untreated DMS273 cell samples compared with the cycloheximide-treated samples indicated that there was sufficient endogenous c-MYC present in the DMS273 cell line for screening. In addition, the experiments shown in Figure 2B were performed with the cell lysis and antibody incubation steps within the wells of the 384-well plates in a homogeneous format. These results were critical in showing that cell engineering approaches for the overexpression of c-MYC could be avoided.
(
Figure 2C shows a comparison of frozen cells and freshly growing cells in the c-MYC detection assay. The use of assay-ready frozen cells in an HTS can simplify the process and increase throughput in terms of the number of plates screened per day because the separation of the cell preparation step from the assay steps saves time on the morning of a screening day. The data showed a significant reduction in the amount of c-MYC present in cells that had been frozen previously and thawed right before plating into the assay plates compared with cells maintained in continuous culture and harvested fresh from flasks. While the cells frozen in the presence of 5% DMSO contained higher levels of c-MYC than the cells frozen in the presence of 10% DMSO, there was still a significantly higher c-MYC FRET signal in the fresh cell samples. Figure 2D shows the results from a CTG assay, indicating that there was no significant loss of cell viability upon treatment with cycloheximide. These experiments showed that there were similar numbers of viable cells in all samples, suggesting that the reduced c-MYC levels in the frozen cells were truly a reflection of reduced c-MYC levels and were not a reflection of lower cell numbers in those samples. Due to the lower level of c-MYC observed in the frozen cell samples, the decision was made to run the DMS273 cell line HTS with cells maintained in flasks and harvested on each screening day.
Figure 2E shows results from 1536-well plate experiments with a small random set of 1408 compounds that was tested in duplicate to assess assay performance. All plates contained cycloheximide control wells and DMSO control wells for S/B and Z′ calculations. The Z′ statistics of both buffer control plates (shown as DMSO only) and the duplicate 1408 sample compound plates ranged from 0.79 to 0.84, which were above the GSK screening department’s minimum desired Z′ of 0.6 for an HTS assay. A correlation scatterplot is shown in Figure 2E where the correlation coefficient for replicates was 0.89, and the average hit rate was 1.4% at a 30% inhibition cutoff. The Z′ and hit rate results met the desired screening criteria, making the DMS273 cell assay fit for purpose for HTS.
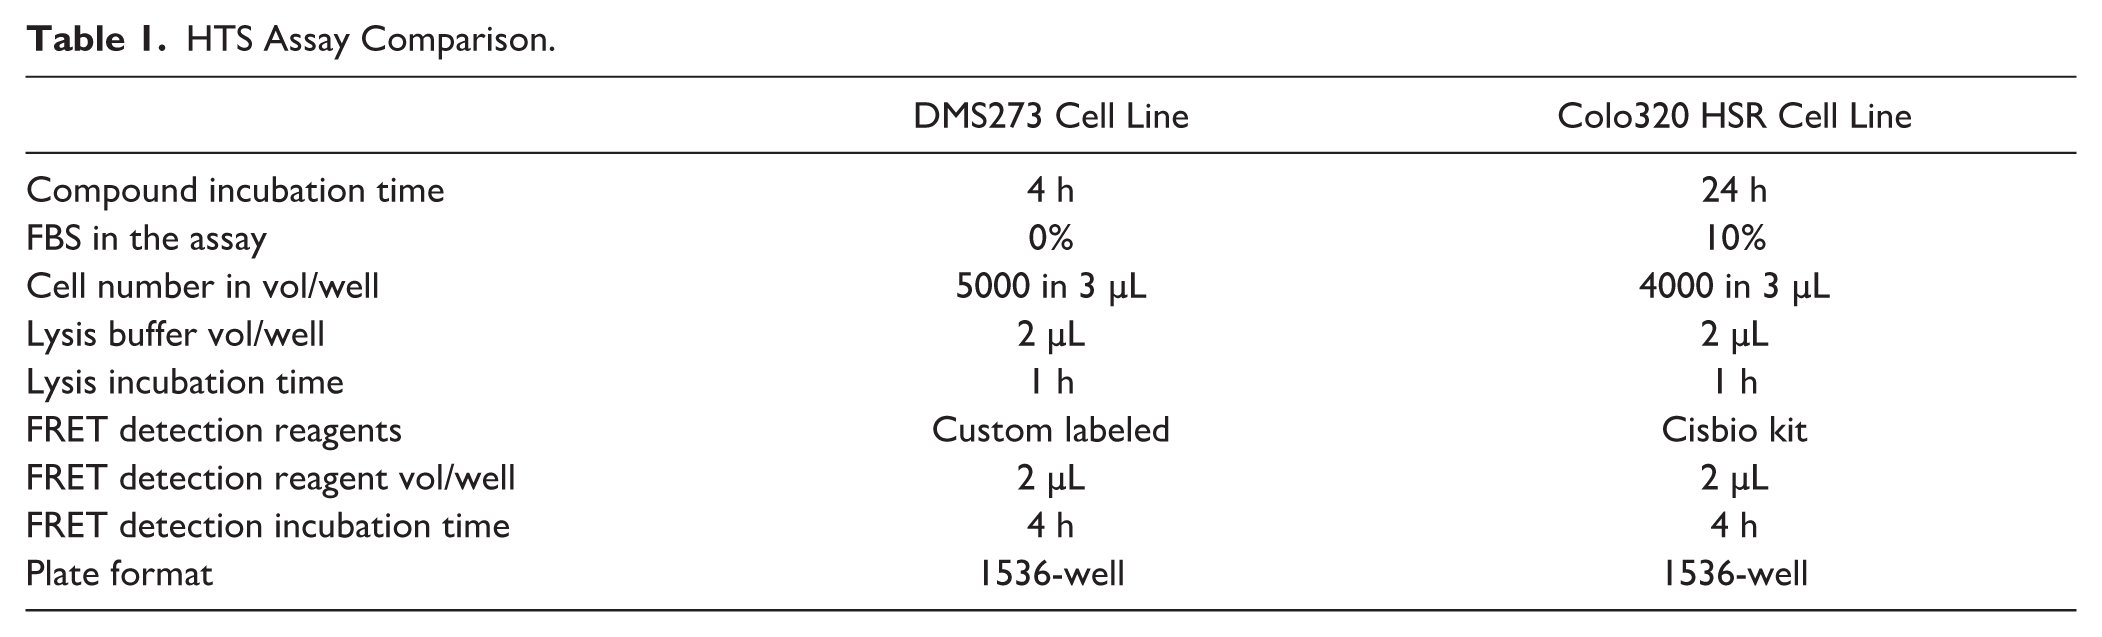
As discussed in the introduction, c-MYC drives cancer in many different tissue types. To increase the possibility of capturing multiple small molecules targeting c-MYC, a 1536-well c-MYC detection assay with a second cell line was developed. Lessons learned from the DMS273 lung cancer cell line experiments were applied to the assay development steps for the colon cancer cell line Colo320 HSR, streamlining the process. In addition, at the time work was initiated with the Colo320 HSR cell line, a FRET-based kit for c-MYC detection had become commercially available and was utilized for c-MYC detection in the Colo320 HSR HTS (see Suppl. Fig. S1 for an assay comparison between the custom reagents developed in house and the commercial reagents). Both assays were run with the same assay volumes and number of addition steps in 1536-well plates, but some changes to the assay conditions for the Colo320 HSR cell screen were made (see Table 1 ). The incubation time with compounds was extended to overnight, and the cells were plated for screening in assay buffer that consisted of complete media with 10% FBS, in contrast with the 4 h time point and 0% FBS conditions used in the DMS273 HTS. It was reasoned that some mechanisms involved in the regulation of c-MYC protein levels could take longer than several hours to be manifested, potentially expanding the mechanisms accessed and allowing the identification of different compounds in each HTS.
HTS Assay Comparison.
Hit Triage Assays for General Toxicity, Cell Growth, and Protein Translation Mechanisms
The CTG assay discussed previously in Figure 2D was used as a measure of acute toxicity. From the data shown, the cycloheximide treatments did not produce significant reductions in the assay signal, and the S/B and Z′ statistical measurements of 70 and 0.9, respectively, showed that this assay was suitable as a screen triage assay, where a Z′ of above 0.6 was desired. This assay was also adapted to longer time points and utilized with other cell lines to observe compound effects on cell growth over the course of 72 h (see later section on the characterization of selected hits).
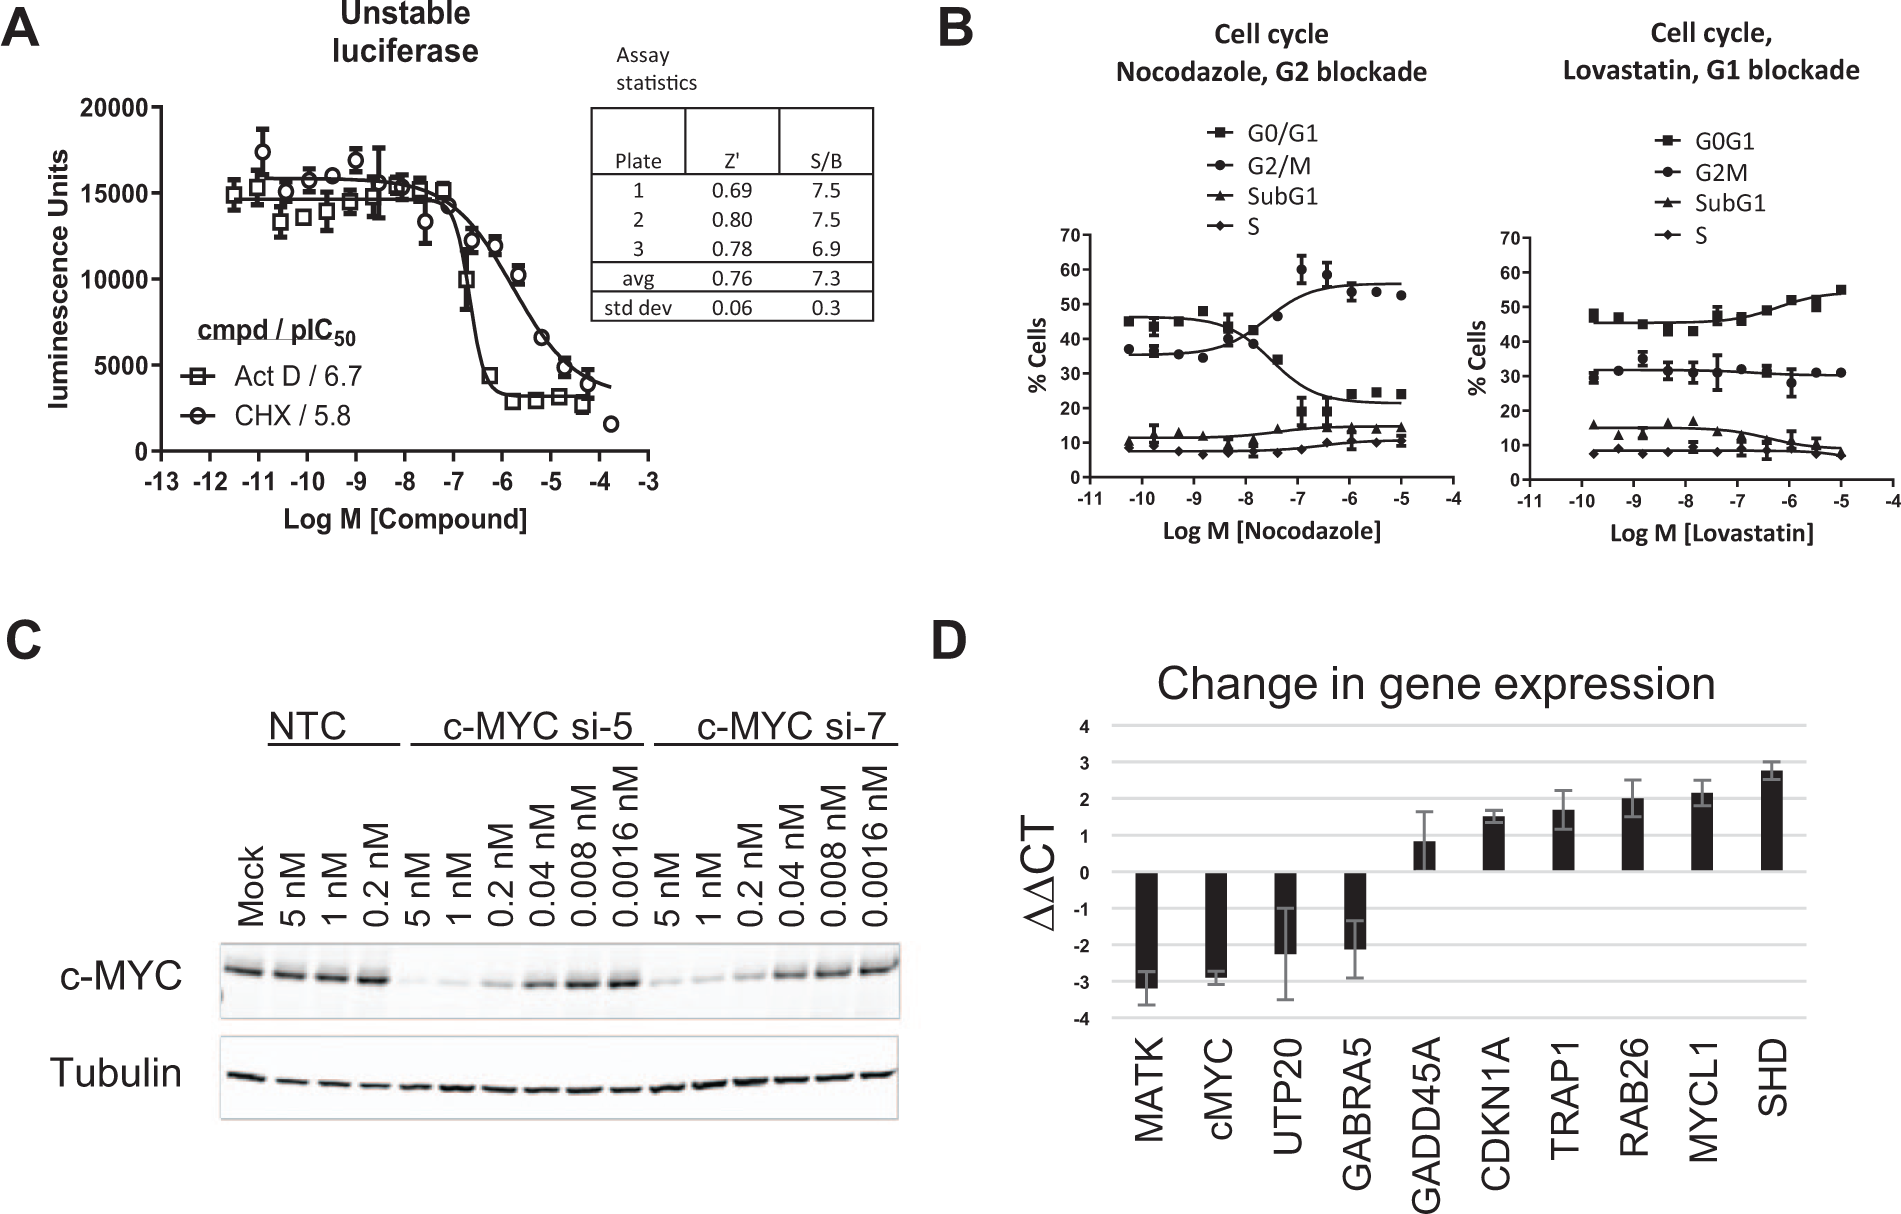
An assay that could detect nonspecific effects on protein transcription and translation was also developed for hit triage. The luc2P luciferase reporter contains the PEST sequence that drives increased protein degradation and reduces protein half-life in cells. This reporter was chosen to provide a reporter assay with a short protein half-life similar to that of the c-MYC protein, so that the same compound incubation times utilized in the c-MYC detection assay could be applied to this specificity assay. As with c-MYC, this short half-life luciferase reporter gene was sensitive to the protein synthesis inhibitor cycloheximide. Figure 3A shows results from a luciferase assay where DMS273 cells were transduced with a BacMam construct containing the unstable luciferase reporter gene and treated with the protein translation inhibitor cycloheximide for 4 h. During this treatment time, a reduction of the reporter signal was observed as expected. Also shown is an assay with the RNA transcription inhibitor actinomycin D, showing a similar reduction in the reporter assay signal. Together, these results showed that the assay could be used to detect both general transcription inhibition and general translation inhibition, presumably because the RNA transcript was also unstable and was degraded once transcription was inhibited. These results indicated that there was no need to develop a separate assay to detect general cellular transcription inhibition. The assay was statistically robust with an average Z′ of 0.76, which was above a minimum desired value of 0.6. The assay was thus deemed fit for purpose for use in compound triage activities.
(
384-Well Cell Cycle Assay
With the ultimate desire to identify compounds that would inhibit c-MYC-driven cell growth, but did not cause generalized nonspecific cell toxicity, a cell cycle arrest assay was developed. If compounds inhibited cell growth in a c-MYC-dependent manner, the hypothesis was that the cell cycle arrest would occur in a manner similar to cells treated with siRNA knockdown of c-MYC. For the DMS273 cell line, siRNA knockdown of c-MYC and assessment of the cell cycle blockade had shown that cells were blocked at G0/G1 of the cell cycle for this cell line (data not shown). Figure 3B shows 384-well flow cytometry experiments utilizing propidium iodide staining of cellular DNA to categorize cells based on DNA content. The G2/M and G0/G1 cell cycle inhibitors nocodazole and lovastatin, respectively, were used as benchmark compounds. The left panel shows results for nocodazole, where a G2/M blockade resulted in an increase in the G2/M population and a concurrent decrease in the G0/G1 population. The right panel shows results for lovastatin, where the effects of lovastatin on the G1/G0 block of the cell cycle were more subtle in terms of observable changes in the DNA content redistribution. In analyzing results, it was determined that the selection and qualification of compounds of interest would be based more heavily on the lack of an obvious G2/M blockade of the cell cycle than on a discernable increase in the proportion of cells accumulated in G0/G1.
RT-qPCR Gene Signature Assay
To develop a c-MYC gene signature assay that could be used to characterize selected hits coming out of the HTSs, siRNA knockdown of c-MYC in the DMS273 and Colo320 cells followed by RNA-seq or microarray analyses (not shown) had identified potential genes that could be used in a gene signature assay. After testing and confirming candidate genes by RT-qPCR, a small gene panel was selected for each cell line. Figure 3C shows a Western blot where DMS273 cells were treated with c-MYC siRNAs to knock down c-MYC, and Figure 3D shows quantification of selected gene RNAs. Genes that robustly increased and decreased in the c-MYC knockdown experiments were used to define a c-MYC gene signature. In the example shown, c-MYC, MATK, UPT20, and GABRA5 showed decreased transcript levels, and GADD45A, CDKN1A, TRAP1, RAB26, MYCL, and SHD showed increased transcript levels upon c-MYC knockdown. Similar experiments were performed in the Colo320 HSR cell line to define c-MYC knockdown gene signatures (see Suppl. Fig. S2 ).
HTS and Triage for the DMS273 and Colo320 HSR Screens
Approximately 1.7 million (DMS273 cells) and 1.9 million (Colo320 HSR cells) compounds were screened utilizing the c-MYC detection assay, representing the HTS compound collection at the time of each screen. The small-molecule screening collection undergoes continuous flux as compounds get depleted and are replenished (with compounds that may be different than those depleted) such that the collection screened against Colo320 HSR cells contained 72.6% overlap with the collection that was screened against DMS273 cells. Both screens were run in 1536-well plates utilizing cells that were continuously cultured, harvested on screening days, and then plated into plates containing prestamped compounds. After cells were incubated with compounds, lysis and antibody reagents were added before reading the plates to quantify the signal. Each plate contained untreated (no compound) and cycloheximide-treated wells (100% inhibition control) that were used for quality control and to calculate plate statistics and call hits.
Figure 4A–D shows data analysis strategies employed to examine data and select hits from each HTS, using DMS273 data as an example. In addition, a hybrid median plate correction strategy 19 was applied to all plates in both HTSs (see Suppl. Fig. S3 ). This strategy addresses a commonly observed phenomenon known as “edge effect,” where the signal generated around the periphery of the 1536-well plate was reduced compared with the wells at the center of the plate. This strategy also corrected other patterns, such as those observed with repeated liquid handling errors due to instrumentation, or plate reader effects.
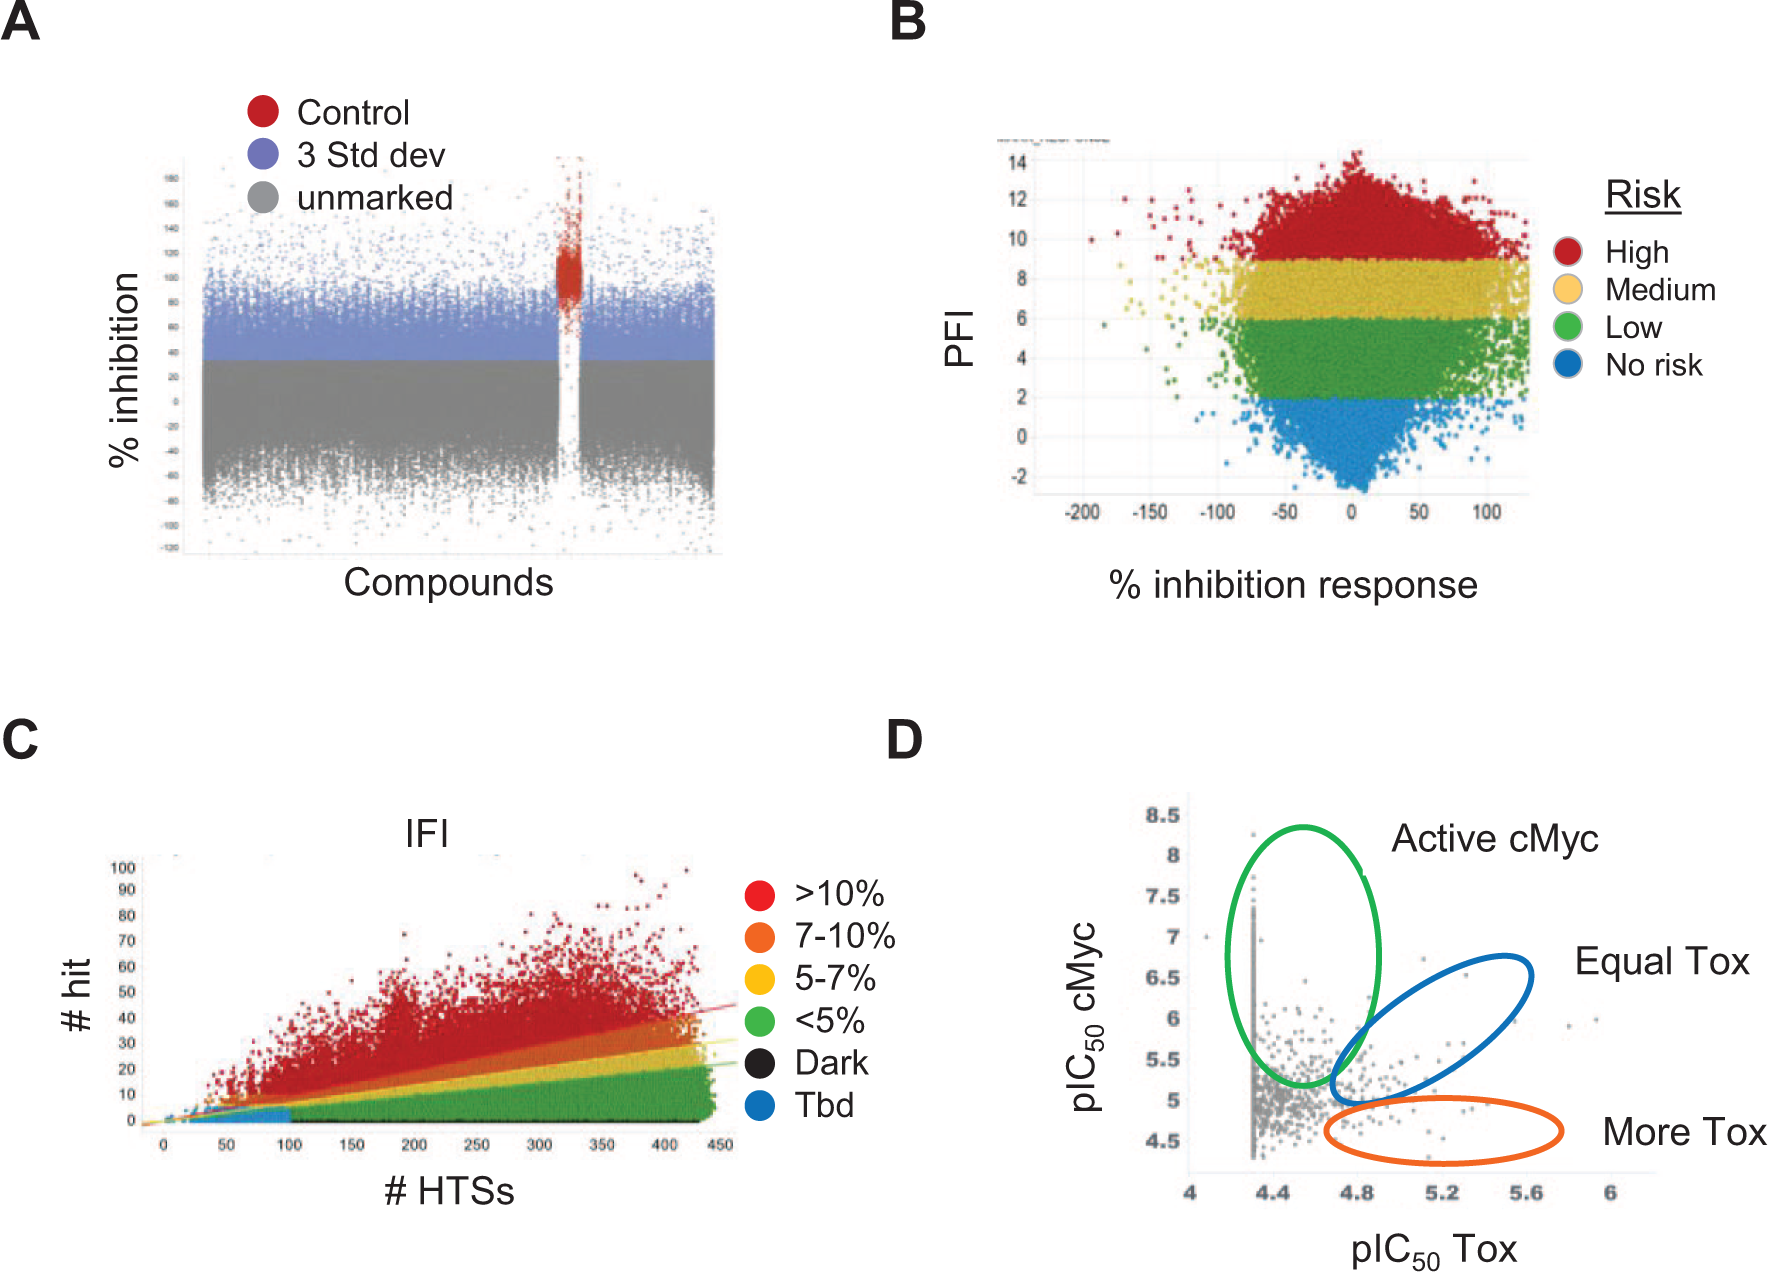
Screening data analysis strategies. (
Hits were initially selected based on the percent inhibition value calculated in the c-MYC detection assay. Figure 4A shows a scatterplot of the approximately 1.7 million data points from the DMS273 c-MYC screen. Cycloheximide controls are shown in red, and HTS “hits” with responses of ≥3 standard deviations above the untreated (0% inhibition) samples are shown in blue. In the data set shown, more than 52,000 hits were marked, which defined a cutoff of greater than 34% inhibition, with cycloheximide wells defined as 100% inhibition. With the large number of hits observed, additional hit triage strategies were applied to select the most desirable compounds and reduce the numbers of compounds selected for subsequent testing. Figure 4B shows a scatterplot of the Property Forecast Index (PFI) for hits, a measure of lipophilicity (ChromLogD + aromatic rings 25 ). High- to low-risk bins were identified and used along with other criteria to select the most desired compounds. Figure 4C shows an in-house HTS frequent-hitter metric (Inhibition Frequency Index [IFI]), which was also used to filter out likely nuisance/nonspecific hits. The IFI calculation was based on the frequency with which a compound was identified as a hit in all HTSs in which it has been tested. Compounds that have not been selected as hits in any HTSs are shown in black (dark matter), and those compounds that had not seen enough HTSs to make an assessment are shown in blue as “Tbd.” Chemical diversity selection (Chemaxon chemical fingerprints) was also used to triage the hit pool by mitigating chemical redundancy. Overall, these combined criteria were used to select hits for progression to the next step in the screening cascade shown in Figure 5 . Compound selection in the c-MYC HTSs were compounds that showed greater than approximately 30% inhibition, less than 5% IFI, and equal or less than a PFI of 8 (Colo320 HSR) or 9 (DMS273). The number of compounds selected for progression to the confirmation step in each screen was 21,790 compounds for the DMS273 screen and 34,500 compounds for the Colo320 HSR screen. Strategies to compare and pivot pIC50 values from CRC assays were also used, with an example shown in Figure 4D . Compounds showing higher potency in the reduction of c-MYC protein levels than in acute toxicity (circled in green) indicate the most desirable compounds, while those showing similar potencies or higher potency in the acute toxicity assay (circled in blue and red, respectively) were eliminated.
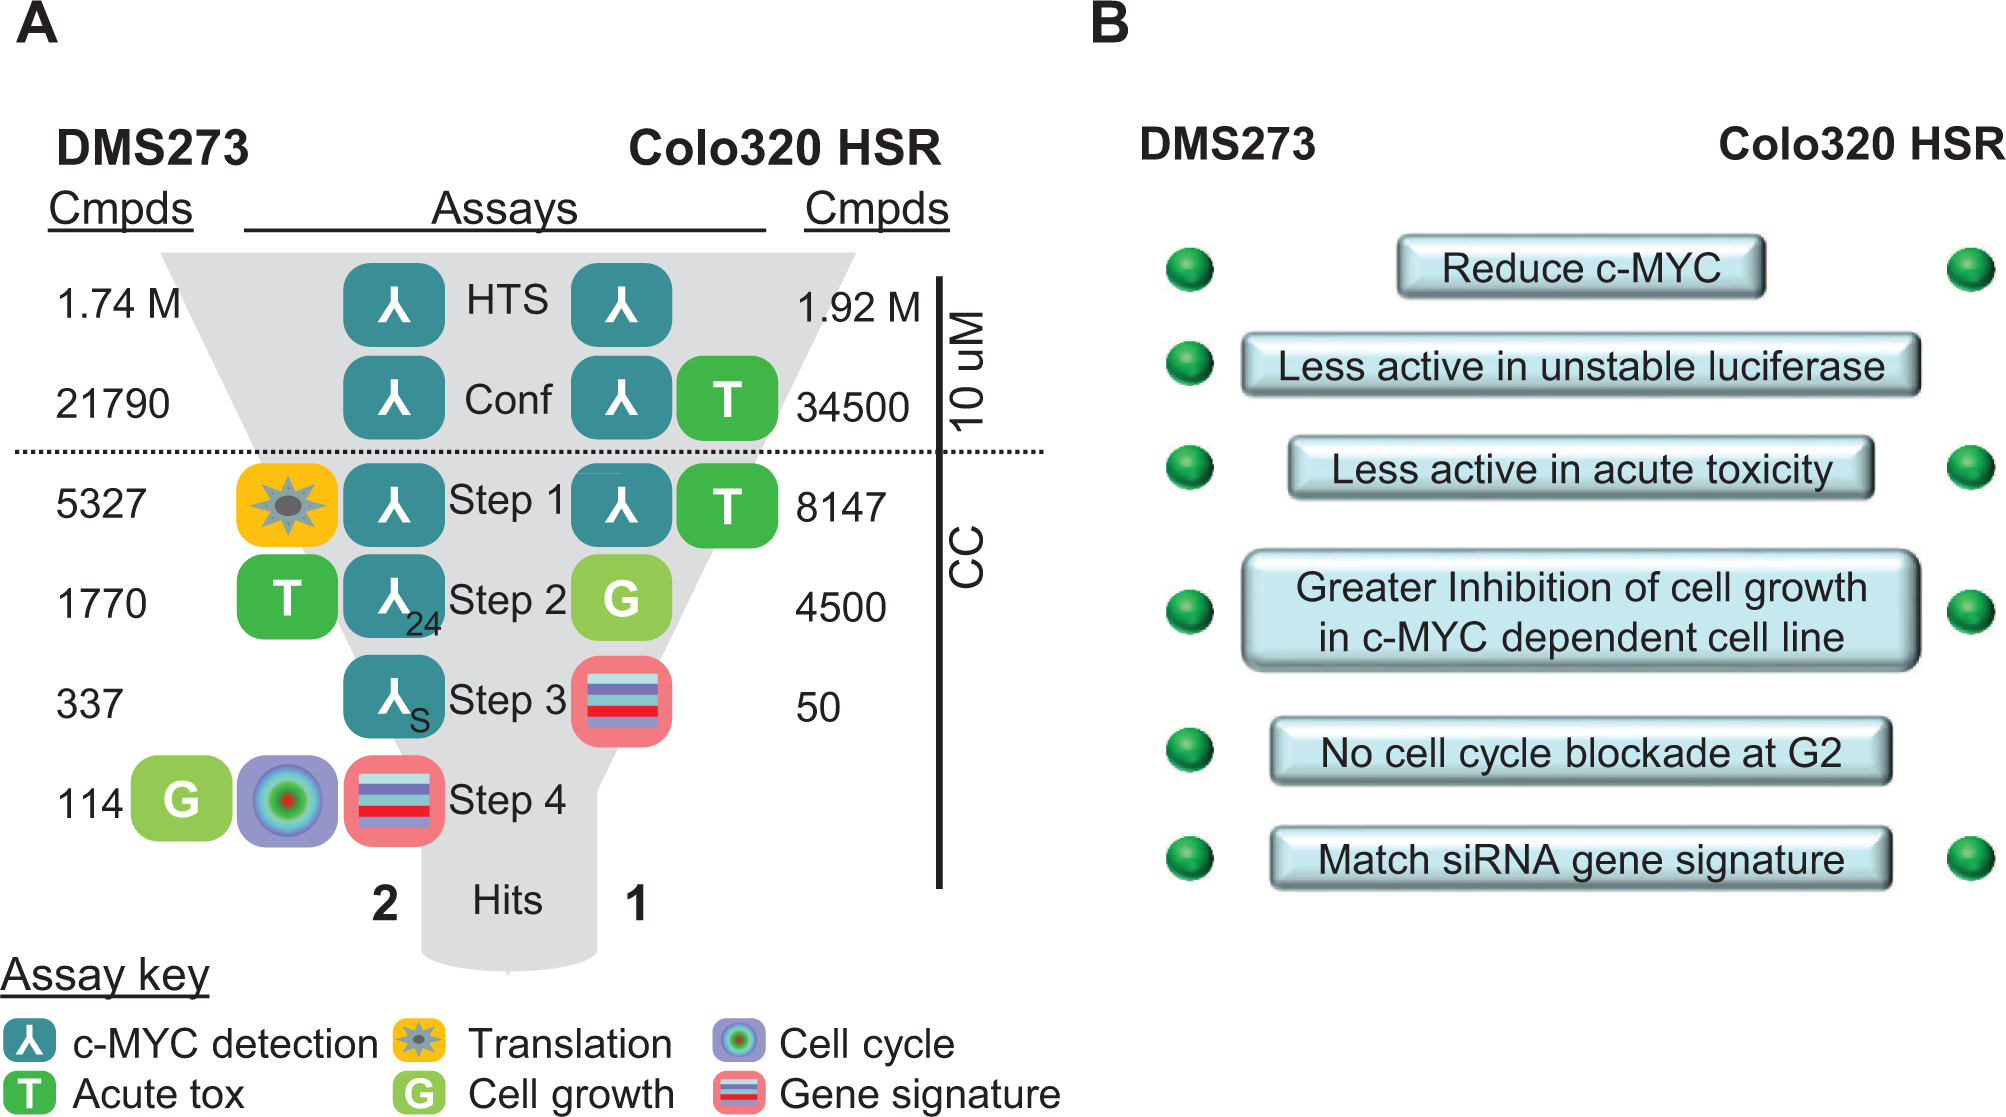
HTS and triage summary. The small-molecule screening in the DMS273 and Colo320 HSR cell lines were run using slightly different hit triage strategies. The left panel shows a summary of the assays and numbers of compounds screened at each step; the right panel shows the criteria used for decision-making. The 10 µM and CRC designations indicate that compounds were run at one concentration of 10 µM or CRCs. The assay icons indicate which assays were used at each step, and the numbers in the “Cmpds” columns indicate how many compounds were screened. The 24 and S designations in the DMS273 c-MYC detection assay icons at steps 2 and 3 indicate different conditions for those assays compared with the assay used in the primary screen, namely, 24 h incubation and 10% FBS (compared with 4 h and 0%).
Figure 5A
shows a summary of the assays used in the HTSs and triage for both cell lines, with the number of compounds screened in each assay shown under “Cmpds.”
Figure 5B
shows the hit selection criteria in terms of the desired activity in each of the assays that was used. For DMS273, the confirmation step involved retesting the selected compounds in the c-MYC detection assay in duplicate at 10 µM using the same assay that was used for the HTS. A total of 5327 compounds that showed correlating percent inhibition values in the two replicates were selected and progressed for testing in full CRCs in the next step in compound triage. The two CRC assays at step 1 (
For the Colo320 HSR cell line, the 34,500 initially selected compounds were progressed to the confirmation stage, where they were tested in the c-MYC detection assay and the acute toxicity assays in duplicate at a single concentration of 10 µM. The acute toxicity assay was used at the confirmation stage of the Colo320 HSR screen because of prior observations with the DMS273 screening campaign, where the acute toxicity assay had identified a significant number of compounds that had passed through the unstable luciferase assay filter in the DMS273 screen. In addition, the elimination of the unstable luciferase assay from the triage path streamlined the screening follow-up process and shortened timelines. A higher percent inhibition in the c-MYC detection assay compared with the acute toxicity assay was used as a criterion to select the 8147 compounds that were advanced to CRC testing in step 1 of the triage. At this stage, the c-MYC detection and acute toxicity assays were used in full serial dilution format instead of single concentration to obtain potency values that were used in the selection of the 4500 compounds for step 2. Again, using learnings from the DMS273 screen, which had shown that the desired compound activities were most robustly identified in the cell growth and gene signature assays, the flow cytometry cell cycle assay was eliminated from the triage path in the Colo320 HSR screen. Since the cell growth assay was simpler and less labor-intensive than the gene signature assay, the 4500 compounds were first tested in cell growth assays. Two cell lines were tested, the c-MYC-dependent Colo320 HSR cell line used in screening and NCI-H1155, a cell line independent of c-MYC for proliferation. The results allowed the selection of 50 compounds that showed selective growth inhibition against the c-MYC-dependent Colo320 HSR cell line over the NCI-H1155 cell line. The 50 compounds were progressed to the final step (step 3 testing) in the gene signature assay. With the gene signature assay, only one compound showed the desired profile.
Data and Structures for the Three Small-Molecule Compound Hits
Only three compounds tested in the 2 HTSs met the desired criteria after all triage and qualification assays were completed. Namely, the two compounds identified in the DMS273 screen specifically reduced c-MYC in cells, arrested cells at G0/G1 of the cell cycle, inhibited growth more strongly in a c-MYC-amplified cell line compared with a cell line with no c-MYC amplification, and showed at least 75% compliance with a c-MYC siRNA gene signature. For the Colo320 HSR screen, the compound decreased c-MYC protein in cells, inhibited growth more strongly in a c-MYC-dependent cell line compared with a c-MYC-independent cell line, and showed at least 75% compliance with a c-MYC siRNA gene signature. Key data and structures for the three small molecules identified are shown in Figure 6 .
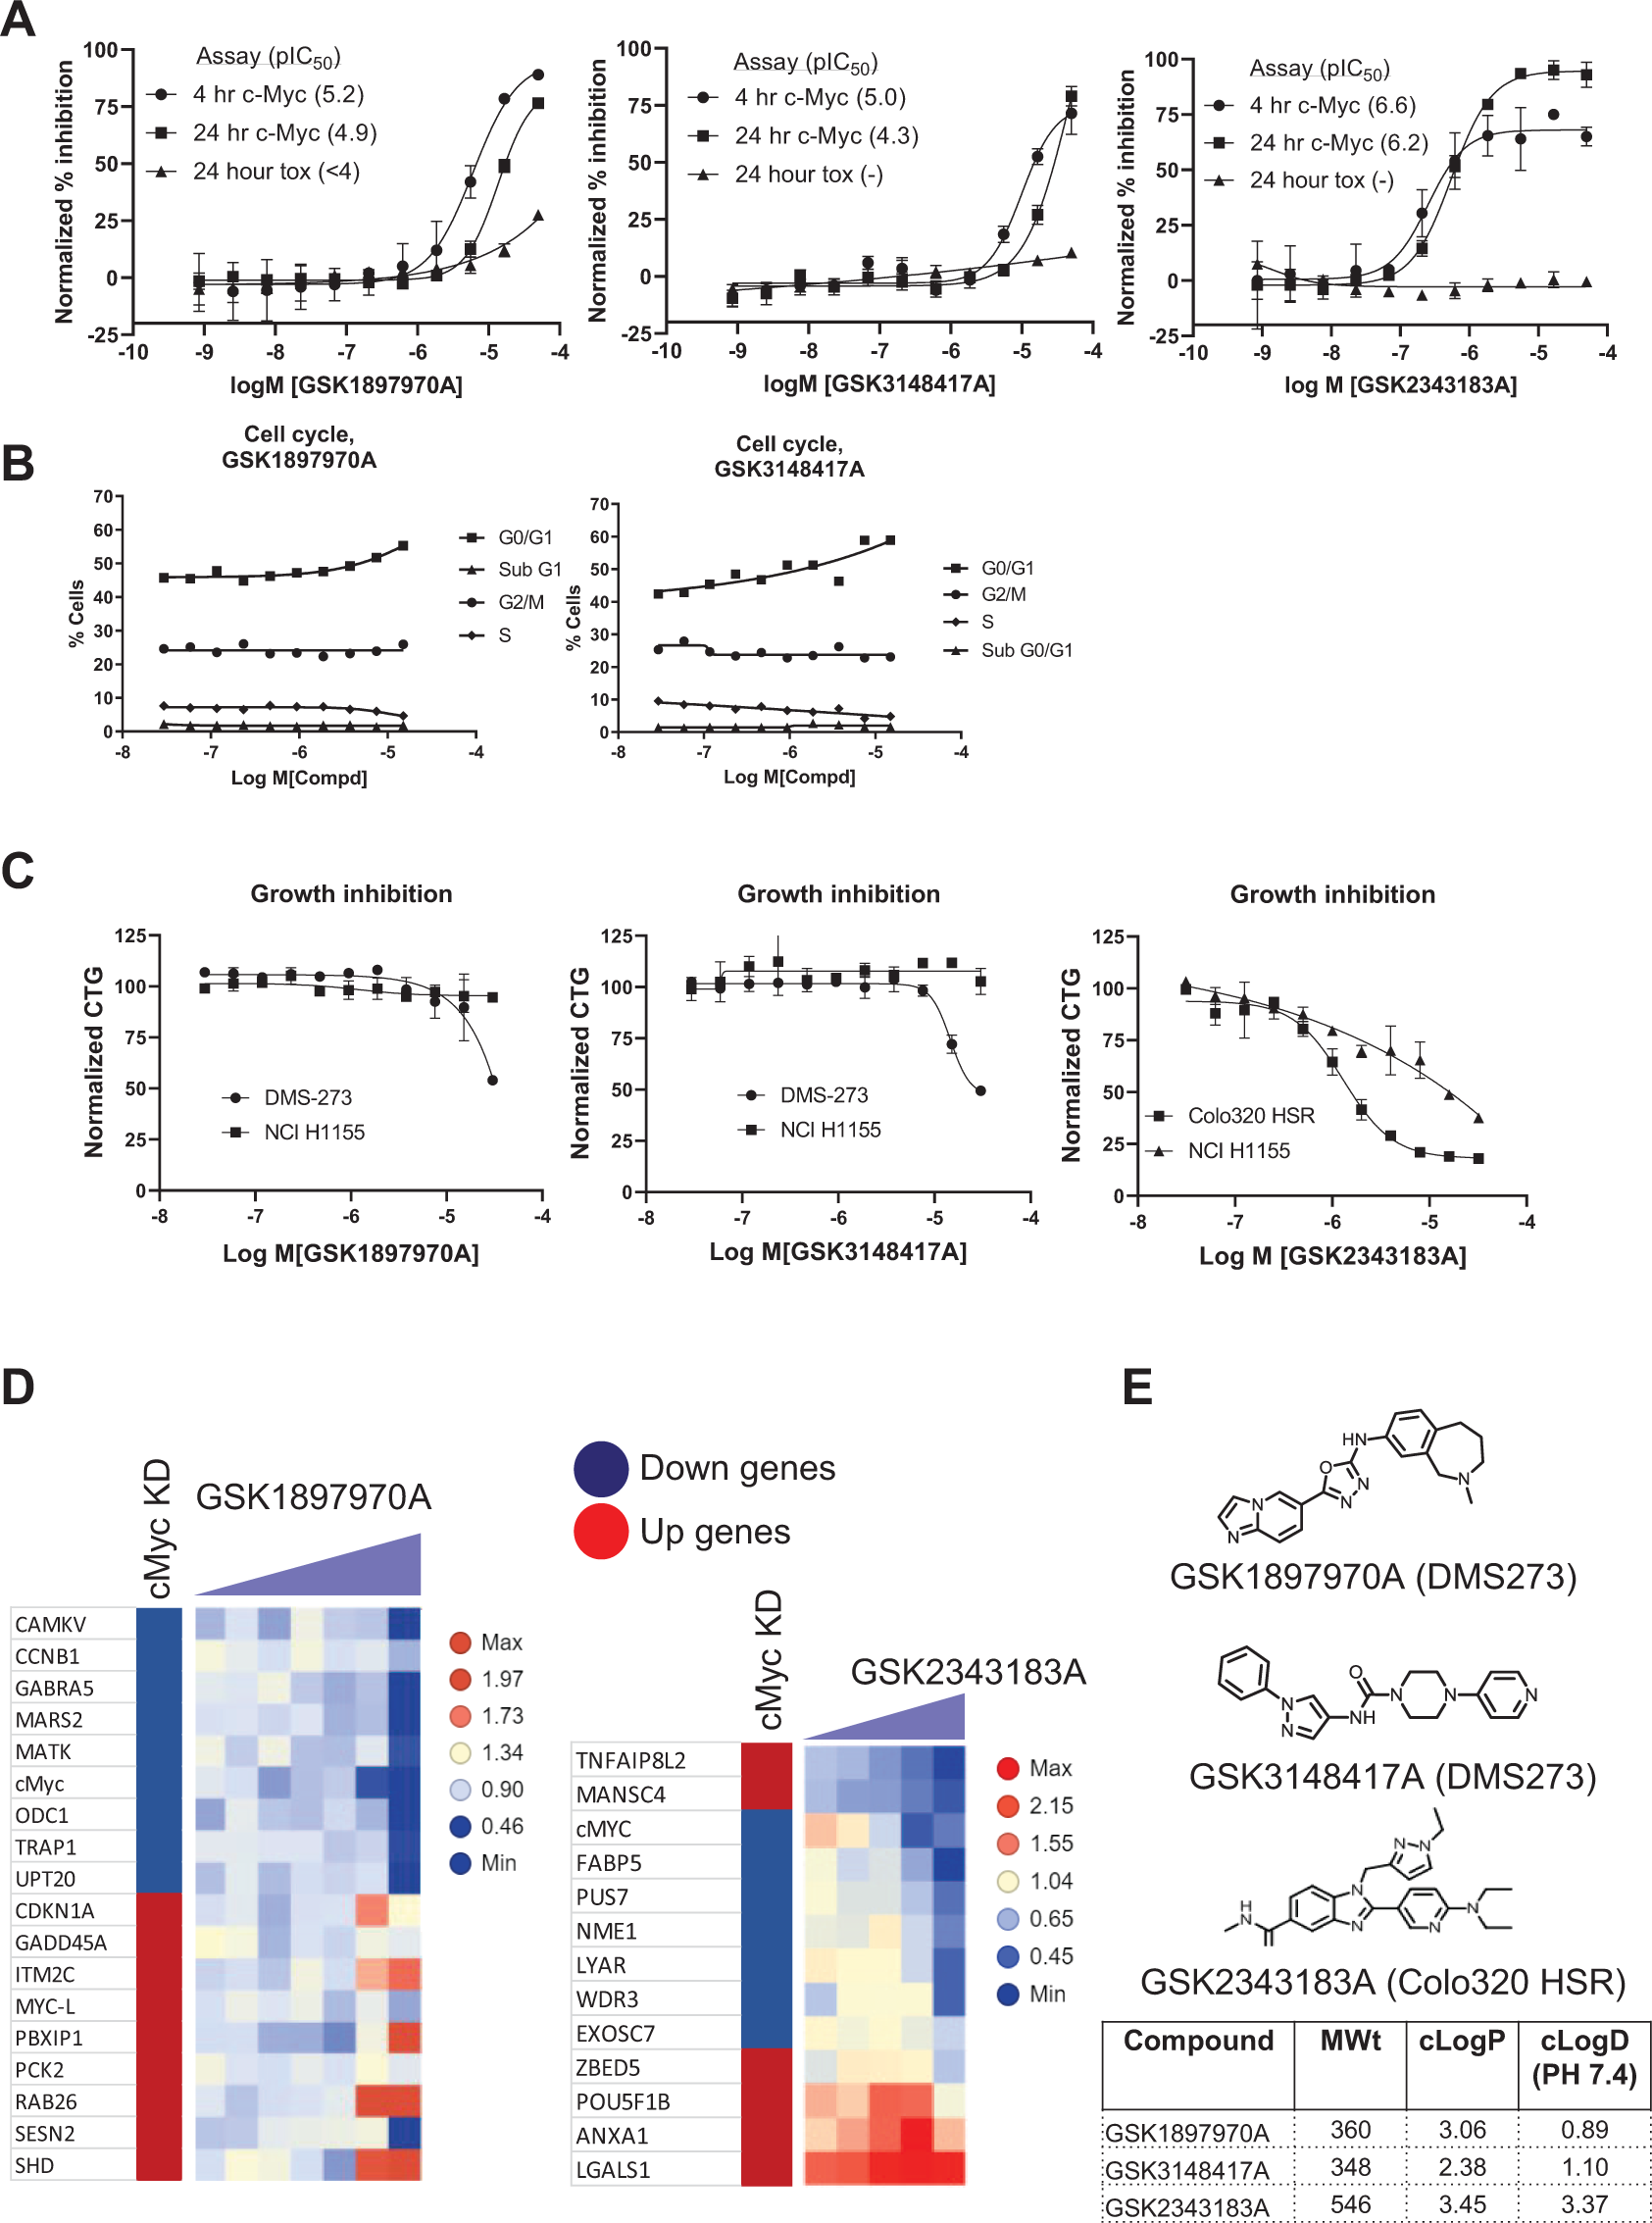
Critical data for HTS hit compounds. (
Figure 6A shows c-MYC detection and acute toxicity results for the three HTS hits. All three compounds effectively reduced c-MYC levels in cells at both 4 and 24 h time points and showed minimal acute toxicity in the CTG assays. Figure 6B shows flow cytometry cell cycle characterization of the two hits identified in the DMS273 HTS. The left panel shows data for compound GSK1897970A, and the right panel for compound GSK3148417A. Both compounds showed the desired cell cycle phenotype with a blockade at G0/G1 of the cell cycle, and no blockade at the G2/M phase of the cell cycle. The results of cell growth experiments for the three compounds identified are shown in Figure 6C . For the two hits identified in the DMS273 screen (left and middle panels), the compounds were tested against the DMS273 (c-MYC-dependent) and NCI-H1155 (c-MYC-independent) cell lines. Data for the Colo320 HSR hit GSK2343183A in the panel on the right are shown for the Colo320 HSR and NCI-H1155 cell lines. For all three compounds, greater growth inhibition was observed in the c-MYC-dependent cell line compared with that observed in the c-MYC-independent cell line. Figure 6D shows gene signature data for two of the compounds identified. As shown in the left panel for the GSK1897970A compound, all transcripts assessed followed the upregulation or downregulation pattern of the c-MYC siRNA knockdown except for the SESN2 transcript, giving a 94% compliance with the gene signature panel tested. The GSK3148417A compound showed a similar gene signature to the GSK1897970A compound, but with a weaker response in terms of potency (not shown). Shown in Figure 6D on the right are the gene signature results for the GSK2343183A compound. A profile similar to the c-MYC siRNA knockdown in the Colo320 HSR cell line was obtained, with 10 out of the 13 transcripts or 77% phenocopying the c-MYC siRNA knockdown (outliers were TNFAIP8L2, MANSC4, and ZBED5). Since the c-MYC transcript itself was included in the gene signature, the reduction of the c-MYC transcript caused by all three compounds indicated that these compounds regulated c-MYC at the mRNA level. Figure 6E shows compound structures for the three HTS hits.
Discussion
The two HTSs described identified three compounds that were able to reduce c-MYC protein levels in cells. Since the screens were black box in nature, there was no expectation that the small molecules would act via any particular mechanism of action. As mentioned in the introduction, c-MYC is a highly regulated and dynamic protein with a short half-life in cells. Based on the gene signature results where the c-MYC transcript itself was included, all three compounds identified reduced c-MYC RNA transcript levels, which were ultimately manifested as the lower protein levels detected in the HTSs. It is not clear why protein-level mechanisms were not uncovered in the screening.
Because the DMS273 screen was performed before the Colo320 HSR screen, learnings from the first HTS were applied to the second. Observations around the difficulty in interpreting the flow cytometry cell cycle results, for example, led the team to decide not to use this assay during the second screening campaign. There was also the consideration that even if compounds arrested cells at G0/G1 of the cell cycle in the screening cell line, there would be a need to show specificity in terms of the lack of that cell cycle arrest in a c-MYC-independent cell line. Any specific growth arrest in the c-MYC-dependent cell line would theoretically be observed in the cell growth assays, therefore precluding the need for testing compounds separately in the cell cycle assay. It should be noted that a much more manual approach for the examination of the growth inhibition and flow cytometry data was required. This was due to the fact that many of the CRCs could not be fit with curve fitting software to define a pIC50 value because of the weak potencies of the compounds in the assays. Curves and data points were examined visually utilizing overlaid data for the c-MYC screening cell line and the control cell line (NCI-H1155), and compounds were selected based on the visual inspections.
A comparison of compounds active in the acute toxicity assay and the unstable luciferase assay with DMS273 cell line data had shown that most nuisance compounds that showed inhibition in the unstable luciferase assay also showed inhibition in the acute toxicity CTG assay. In addition, some compounds showed an increase in the unstable luciferase assay signal (not shown). They could have represented compounds that increased the luciferase reporter protein’s stability, affected the detection reagents, or increased the signal for some other unknown reason. Interference with luciferase assays has been reported on, 26 and this type of small-molecule nuisance activity has been previously observed in other luciferase screening activities at GSK. Since only the compounds showing a reduction of signal in the unstable luciferase assay could be eliminated for further study, the data for compounds that showed an increase in this assay were not useful, supporting the decision to eliminate this assay from the Colo320 HSR screen triage.
The differences observed in the gene signature panels between c-MYC siRNA knockdown and the compound treatments were not unexpected. With a loss of c-MYC protein by siRNA, a compound reducing c-MYC protein levels would likely do so via a different mechanism, thereby not reproducing the siRNA effect exactly. The 77%–94% compliance with the gene signature panels observed with the three compounds, along with the other criteria used to select them, was only demonstrated by these three compounds out of the more than 3.6 million compound wells screened across the two HTSs. With the numbers of compounds tested and the stringent criteria used to select the hits, the gene signature responses for the three compounds were deemed highly unique and specific. The compounds identified were chemically distinct, and there was no structure−activity relationship (SAR) that could be derived from the HTS hits. Since the GSK HTS collection was designed for chemical diversity rather than depth in terms of chemical clusters and redundancy, this was not an unexpected outcome. The two compounds identified in the DMS273 cell line screen and the one compound identified in the Colo320HSR screen were tested for effects in the opposite cell line in which they were identified. The compounds were weaker or inactive when tested in the other cell line in terms of c-MYC inhibition and growth inhibition (not shown). The reasons for this are not clear but could be due to differences in genetic backgrounds of the cell lines; future experiments may help explain these observations.
Thus far, we are not aware of any other published reports where the same approach was used to identify small molecules targeting c-MYC. The two screening campaigns described successfully identified three compounds that were able to phenocopy c-MYC siRNA knockdown. The molecules uniquely impacted c-MYC-specific cell functions such as cell growth and transcriptional regulation. Further elucidation of the mechanism of action of these compounds will be the subject of future publications.
Supplemental Material
sj-pdf-1-jbx-10.1177_2472555220985457 – Supplemental material for High-Throughput Screening and Triage Assays Identify Small Molecules Targeting c-MYC in Cancer Cells
Supplemental material, sj-pdf-1-jbx-10.1177_2472555220985457 for High-Throughput Screening and Triage Assays Identify Small Molecules Targeting c-MYC in Cancer Cells by Lorena A. Kallal, Anna Waszkiewicz, Jon-Paul Jaworski, Anthony Della Pietra, Tom Berrodin, Pat Brady, Anthony J. Jurewicz, Xin Zeng, Lisa Payne, Jes�s R. Medina, Carolyn Doepner-Buser and Biju Mangatt in SLAS Discovery
Footnotes
Acknowledgements
We thank Genaro Scavello for RT-qPCR data analyses, members of the Protein and Cell Sciences department at GSK for BacMam constructs, the Sample Management group at GSK for compound dispensing, and A. F. Gazdar and J. D. Minna 16 for the NCI-H1155 cell line.
Declaration of Conflicting Interests
The authors declared no potential conflicts of interest with respect to the research, authorship, and/or publication of this article.
Funding
The authors received no financial support for the research, authorship, and/or publication of this article.
Supplemental material is available online with this article.
References
Supplementary Material
Please find the following supplemental material available below.
For Open Access articles published under a Creative Commons License, all supplemental material carries the same license as the article it is associated with.
For non-Open Access articles published, all supplemental material carries a non-exclusive license, and permission requests for re-use of supplemental material or any part of supplemental material shall be sent directly to the copyright owner as specified in the copyright notice associated with the article.