
Abstract
Enzymes represent a significant proportion of the druggable genome and constitute a rich source of drug targets. Delivery of a successful program for developing a modulator of enzyme activity requires an understanding of the enzyme’s mechanism and the mode of interaction of compounds. This allows an understanding of how physiological conditions in disease-relevant cells will affect inhibitor potency. As a result, there is increasing interest in evaluating hit compounds from high-throughput screens to determine their mode of interaction with the target. This work revisits the common inhibition modalities and illustrates the impact of substrate concentration relative to Km upon the pattern of changes in IC50 that are expected for increasing substrate concentration. It proposes a new, high-throughput approach for assessing mode of inhibition, incorporating analyses based on a minimal descriptive model, to deliver a workflow that allows rapid and earlier compound classification immediately after high-throughput screening.
Introduction
High-throughput screening (HTS) of large (often millions of compounds), diverse chemical libraries is commonly used to identify chemical starting points for drug discovery. 1 Enzymes represent a key class of drug targets, as they often catalyze reactions with specific disease relevance and historically have been shown to be susceptible to inhibition by small-molecule drugs.2,3 Often, HTS enzyme assays are configured so that the substrate concentration is equal to the value of Km for that substrate.4,5 The rationale for this approach is that under these often called balanced conditions, the assay has a roughly equal probability of identifying inhibitors with different modes of inhibition versus the target enzyme. Following an HTS, it is important to characterize the identified hit compounds with respect to several criteria, which define the suitability for further follow-up and potentially the investment in chemical optimization. These criteria include the reproducibility, chemical structure, purity, as well as other chemical and physical attributes that may not be desirable, some of which can be identified in further experimental approaches. Often, these sorts of downstream triage assays, such as identification of metal contamination or redox activity, that may reveal hits having undesired mechanisms, including so-called PAINs, 6 are increasingly brought in earlier after HTS. 7 Alongside this chemical and physical characterization, it is also desirable to gain an earlier understanding of the mode of interaction between the inhibitor and the target enzyme. 8
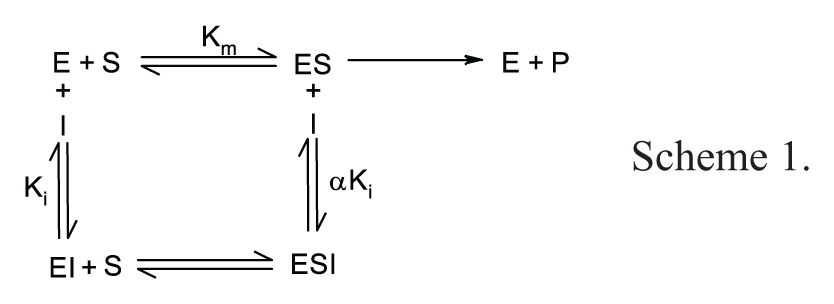
The common inhibition modalities (competitive, mixed, noncompetitive, and uncompetitive) are defined by whether the inhibitor can bind before or only after the varied substrate has bound and by the affinity with which it binds to those enzyme species on the reaction coordinate. 9
Competitive inhibition occurs when the inhibitor binds only before the varied substrate and does not bind to the enzyme-substrate (E.S.) complex. The name derives from the fact that both the inhibitor and the substrate compete for binding to the same form of the enzyme and binding of the inhibitor is mutually exclusive with the substrate.
Uncompetitive inhibition arises when the inhibitor binds only after the varied substrate and so binds only to the E.S. complex and not to the free enzyme.
Noncompetitive inhibition occurs when the inhibitor may bind before or after the varied substrate, with the same affinity, so that the affinity for binding to E is the same as for binding to E.S.
Mixed inhibition is described for those compounds that bind before and after the varied substrate but with different affinities for the two enzyme forms, E and E.S. The inhibitor may show preferential binding (greater affinity) to one or other form and so depending upon the relative affinities the inhibition profile may tend toward one of the other mechanisms.
Although it is sometimes tempting to draw conclusions about the nature of the binding site for inhibitors displaying particular types of inhibition profiles, caution must be used in drawing conclusions regarding the binding location from the steady-state kinetic data alone. Often, structural data and other mechanistic insights can help to provide increased confidence as to where a particular compound is binding to a target protein. 10
Inhibition modality may be determined in two ways: (1) by analysis of the impact of the inhibitor concentration on the steady-state parameters of the enzymatic reaction, Km and Vmax, and (2) by analysis of the effect of substrate concentration on the measured IC50.
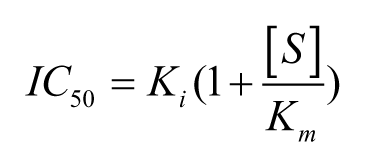
Theoretically, a 5.5-fold increase in IC50 should be observed for a competitive compound when [S] is raised to 10-fold above Km as compared to the IC50 at [S] = Km, according to scheme 1 and the predicted changes in IC50 from the Cheng-Prusoff relationship below.
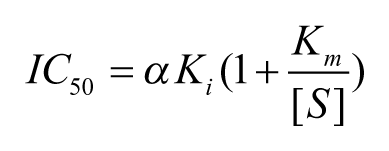
For uncompetitive compounds in which the inhibitor binds more tightly at higher substrate concentrations, a fivefold increase in [S] above Km yields a theoretical decrease in IC50 of less than twofold (1.67-fold), according to the following relationship:
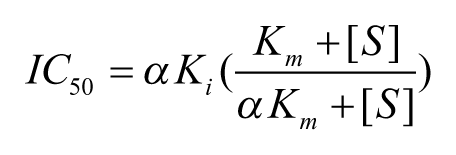
For mixed noncompetitive compounds, in which inhibitors bind before and after substrate with different affinities, Ki values can only be calculated from the measured IC50 once the mechanism and the value of α are known. Therefore, mechanism of inhibition (MoI) studies need to be carried out by measuring the IC50 at various substrate concentrations and then fitting to a global model below, using nonlinear least-squares regression equation:
To characterize the different modes of inhibition, traditionally, a 10- to 12-point titration of compound, covering the observed IC50 under the balanced conditions, is performed at 7 to 12 concentrations of substrate, covering a range of about 0.1 × Km to 10 × Km. 11 However, this is not practical for characterizing the number of hits after the primary screen or for the initial concentration response follow-up, and compromises must be made on the number of concentrations and so potentially the range of concentrations around IC50 and Km. This work highlights a matrix-based approach to reduce the number of concentrations of both substrate and inhibitor required and to automate the data analysis so that earlier meaningful high-throughput mode-of-inhibition studies may be carried out immediately after HTS as part of the initial triage cascade. The approach is illustrated with examples of where this methodology has been implemented in recent drug discovery projects.
Materials and Methods
IC50 Testing of Compounds across Varying Substrate Concentrations
Assay-ready plates were used for screening of all compounds, which are stored in 100% DMSO in a climate-controlled environment. An Echo 555 acoustic dispenser (Labcyte, Sunnyvale, CA) was used to dispense nanoliter volumes of compounds into assay plates.
To measure IC50 concentration responses, different volumes of each compound were dispensed to create a concentration curve of each compound in the plate, backfilling with DMSO to keep this consistent for all compound concentrations. Multiple copies of identical plates with each compound at the desired concentration range were created in this way, and each copy was screened at a different concentration of substrate to produce a matrix of substrate and inhibitor concentrations. The Km for the varied substrate for each target was measured, and the substrate concentrations used for the MoI experiments were selected at concentrations above and below Km. The concentrations used are described below for each target. Each assay was optimized to ensure that at each substrate concentration, enzyme concentration and incubation time result in an increase in product that is linear with respect to both time and enzyme concentration.
KITm Screening
KITm[Ex11delD816H] protein was expressed in baculovirus insect cells and purified by Ni-NTA affinity chromatography (GE Healthcare, Chicago, IL). Fractions enriched for the target protein were pooled and subjected to a subsequent high-resolution purification using a FLAG tag. The final protein samples were analyzed and confirmed as the correct identity using analytical size-exclusion chromatography and liquid chromatography–mass spectrometry analysis.
Various combinations of substrate inhibitor matrix experiments were completed using the ADP-Glo Kinase Assay Kit (Promega, Madison, WI). This luminescent-based assay method for ADP detection is used to provide a universal, HTS approach to measuring kinase activity. The technology is transferable to virtually all ADP-generating enzymes. KITm[Ex11delD816H] assays were undertaken using the GGMEDIYFEFMGGKKK-amide 1835 Mr peptide (HERtide; Cambridge Research Biochemicals, Billingham, UK). The incubation of enzyme and peptide in 20 mM HEPES (pH 7.5), 10 mM magnesium chloride, 100 mM sodium acetate, 1 mM DL-dithiothreitol (DTT), and 0.1% (w/v) pluronic F-127 occurred for 90 min before being stopped with ADP-Glo reagent. Data were collected using both an EnVision Multimode Plate Reader (PerkinElmer, Waltham, MA) and PHERAStar FSX Microplate Reader (BMG Labtech, Ortenberg, Germany).
HSD17b13 Screening
The 6HN-TEV-hHSD17b13 (N2-K300) target protein was expressed in baculovirus insect cells and initially purified by Ni-NTA affinity chromatography (GE Healthcare) and subsequently using size-exclusion chromatography in 50 mM Tris (pH 7.4), 200 mM NaCl, 5% glycerol, 1 mM TCEP. The correct identity of the target protein was confirmed using sodium dodecyl sulfate– polyacrylamide gel electrophoresis (SDS-PAGE) and analytical mass spectrometry.
The mass change observed by the conversion of substrate LTB4 to oxo-LTB4 by hHSD17b13 (N2-K300) was measured using acoustic mist ionization mass spectrometry (AMI-MS). 12 The enzyme assay reaction proceeded in 10 mM bis-tris propane (pH 7.4), 0.03% n-dodecyl β-D-maltoside, and 1 mM EDTA. The assay was completed for 10 min to maintain linearity of detection, using a concentration of substrate equal to that of the measured Km and concentrations 5- and 10-fold above and below Km. An enzyme concentration and incubation time were selected in which the increase in product was linear with respect to both time and enzyme concentration for all substrate concentrations.
HER2 Screening
pFastBac-GST-thrombin-AVI-TEV-HER2 (676-1255) A775_G776insYVMA protein was expressed in baculovirus insect cells and concentrated using a 30k molecular weight cutoff Centricon. The concentrated target protein was subsequently purified on a size-exclusion column. Elution fractions were tested by SDS-PAGE, and HER2 (676-1255) A775_G776insYVMA enriched fractions were pooled and concentrated. Several batches were expressed and pooled, and the final sample was adjusted to 0.5 mg/mL.
HER2 experiments were also carried out using the ADP-Glo Kinase Assay Kit. The HERtide GGMEDIYFEFMGGKKK-amide (Cambridge Research Biochemicals) peptide was used for these assays, with a buffer composed of 50 mM Tris (pH 7.4), 1 mM DTT, 10 mM MgCl2 and 0.005% Tween 20. The assay was incubated for 30 min, and data were collected using a PHERAStar FSX microplate reader (BMG Labtech).
Data analysis
Characterizing mechanism: Traditional nonlinear curve-fitting approaches
Data from the substrate inhibitor matrices were analyzed using unweighted nonlinear least squares regression using GraFit (Erithacus software) employing the equations for competitive, uncompetitive, noncompetitive, and mixed noncompetitive inhibition. Following convergence, the best-fit parameter values were recorded. Identification of the most suitable model to fit the experimental data was assisted by an F test. 13
Characterizing mechanism: The matrix approach described by Auld et al
The previously described approach from Auld et al., 14 which uses a small matrix of four substrates and four inhibitor concentrations (4s × 4i) to deduce each compound’s MoI was tested for profiling some of the compounds as described below, for comparison with the minimal descriptive model (MDM) method. This method involves using modified versions of the Cheng and Prusoff equations 15 normalized for percentage inhibition. The matrix data are used to generate percentage inhibition gradients at each inhibitor concentration as substrate concentration increases, which are described as S-gradients. These S-gradients, when taken together from all point-to-point activity data, are used to calculate four average gradients (one at each [I]), known as J values. This set of J values then define a signature of the plot that is used to classify the MoI.
Characterizing mechanism: MDM approach
In a similar approach to traditional MoI determination, the MDM method uses a generalized least squares function to fit nonlinear models for each MoI to the compound matrices. MDM uses an Occam’s razor approach to identify the simplest model that adequately describes the data. Percentage inhibition values were capped to ensure that they were between 0% and 100%. Initially, competitive, noncompetitive, uncompetitive, and flat models were used. We compare these models using the Akaike information criterion (AIC), which penalizes models with larger numbers of parameters to prevent overfitting,16,17 and the best-fitting model was taken forward.
Following this, the equation for mixed noncompetitive inhibition was fitted and compared:
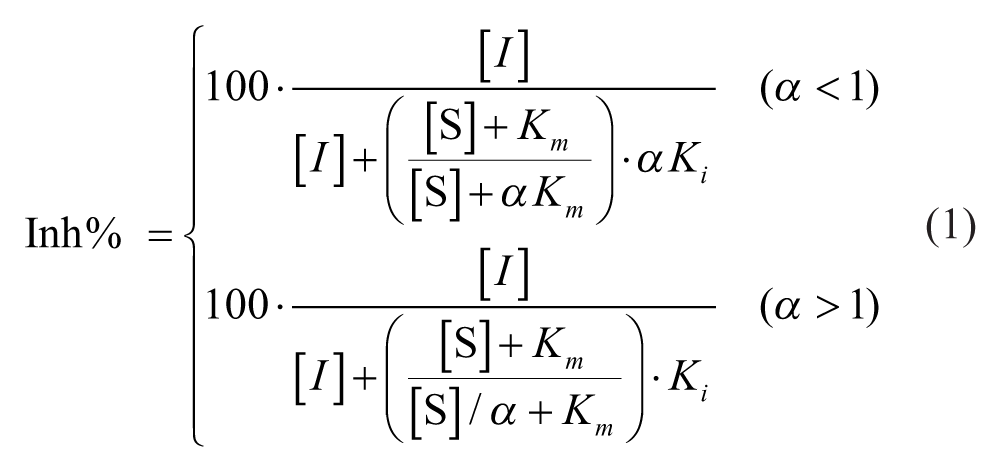
To improve the algorithm’s convergence, we reparametrized the top equation in terms of Kii = α × Ki when fitting the model. The parameter α must be nonnegative (i.e., α > 0). Hence, for convenience, we parametrize the equation in terms of log(α) in all calculations, which guarantees that the condition is satisfied provided log(α) is a real number.
In this fitting, the Km parameter was fixed at the experimental Km value (determined using the neutral control data at each substrate concentration tested), and the Ki and log(α) terms were varied from 33 different starting points in the algorithm to allow for convergence of the model.
If the mixed model did not converge, it was assumed that the optimal fit occurs at an infinite value of log(α), and hence the best-fitting model (i.e., competitive, noncompetitive, uncompetitive, or flat) was assumed. If successful, an F test was then used to compare between the two fits (where H_0 = best simple model and H_1 = mixed model). Where P < 0.05, the mixed model was accepted. Note that we did not use the AIC to make this comparison, because the log(α) parameter provides a great deal of flexibility, which can lead to a large improvement in likelihood that is insufficiently penalized by AIC.
All compounds were mechanistically profiled using the MDM method, and various matrix sizes were tested; the full 7s × 10i, the 4s × 4i matrix employed by Auld et al., and a 3s × 8i matrix whereby the three substrate concentrations chosen bracketed the known Km values of each enzyme (0.2.Km, Km, and 5.Km).
Results and Discussion
A high-throughput primary screen was completed for all drug discovery targets described in this article, where testing of up to 2 million compounds occurred for each target within the AstraZeneca UK Centre for Lead Discovery. With a growing interest in obtaining MoI information early and to enable project teams to incorporate this information into the selection of initial chemical series, we were challenged to provide efficient analysis methods that would enable the hit compounds identified from these screening campaigns to be tested immediately after HTS as part of a triage cascade and deliver MoI information in an efficient manner. We explored the following methods to elucidate the MoI of sets of hit compounds for the drug targets, which will be discussed.
KITm
KITm is a well-studied kinase in drug discovery, with several examples present in the literature of inhibitors in late stages (typically where mechanistic studies occur) targeting varying MoI. We used KITm as our initial test system, as a full HTS campaign had previously been completed, and extensive data already existed in our in-house databases. A cell homogeneous time-resolved fluorescence assay had been used for the HTS, in which 584,394 compounds were tested in the primary screen and 5605 compounds were followed up in IC50 screening. The mechanistic follow-up assay was configured using the ADP-Glo (Promega) assay technology, which is a simple, routine technology for kinase targets and a robust method for screening large numbers of compounds and is amenable to the MoI studies that will be discussed.
A set of 35 inhibitors from the internal project and from the literature were selected for mechanistic profiling, using the various methods of determining MoI described previously. Of these 35 compounds, 12 compounds were fully profiled using each of the three methods: the traditional curve fitting, the Auld method, and the MDM method. The compounds were tested at 10 different inhibitor concentrations and 7 substrate concentrations, spanning the measured Km. Typically, substrate concentrations used in the experiments were 5-fold or 10-fold above and below the measured Km. Data were then fitted to each method, providing useful mechanistic understanding of compound inhibition while allowing us to compare the suitability of these techniques.
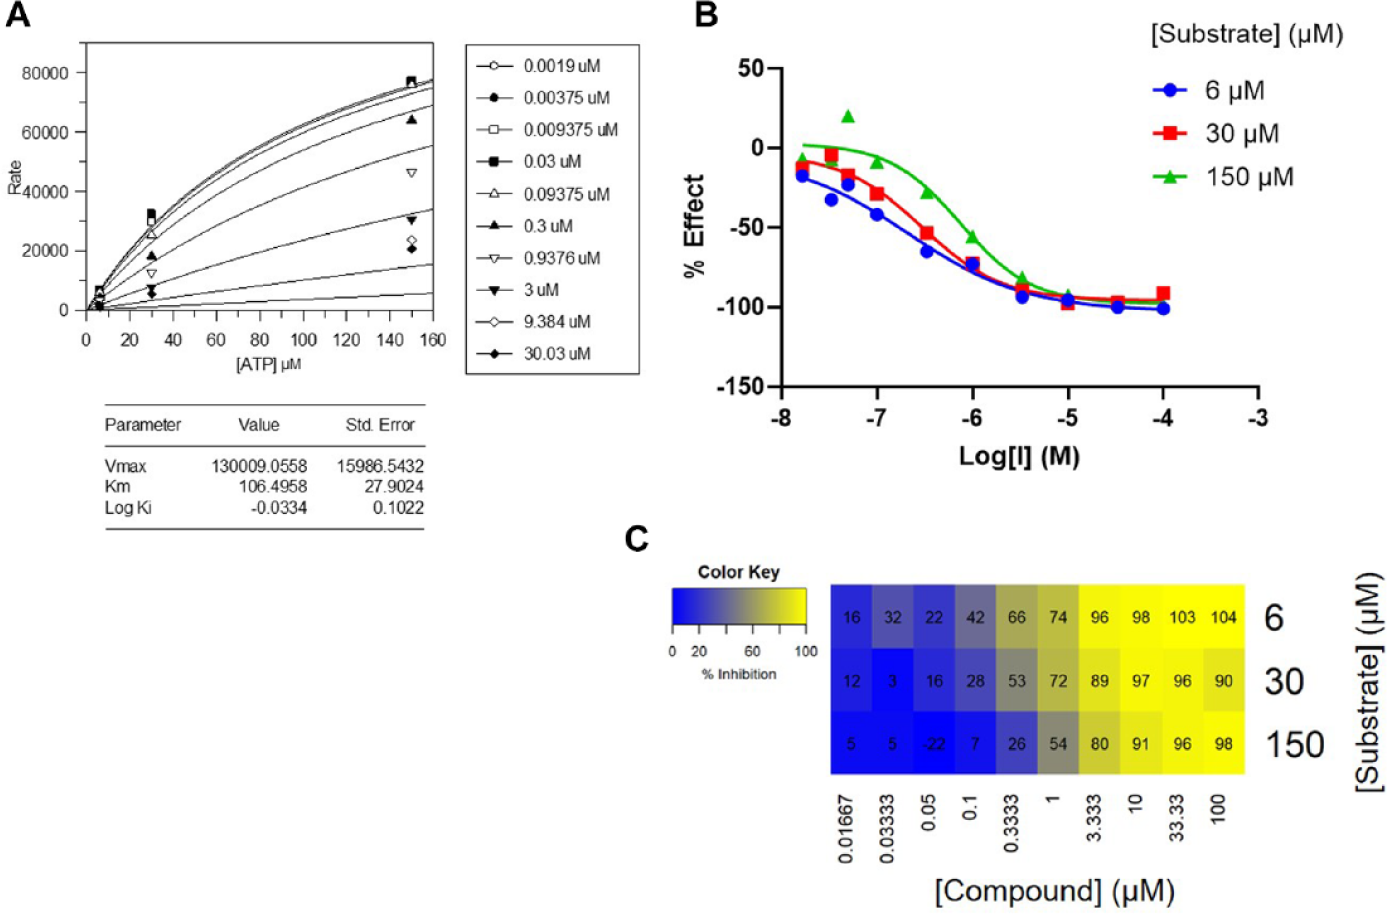
Figure 1 summarizes the data collected for sunitinib, a classic ATP-competitive kinase inhibitor, known to bind in the purine site. 18 For this compound, every model (GraFit curve fitting, Auld, and MDM) concludes this is a competitive MoI. However, of the 12 compounds profiled in every approach, there was only 33% agreement of MoI of the Auld approach to the traditional curve-fitting approach, 83% agreement of the 7s × 10i matrix MDM method with the traditional approach and 66% agreement of the 3s × 8i matrix MDM method. These results suggest that for a pure competitive compound with high-quality data and low variability, the Auld method can be used effectively; however, when extended to a wider set of test compounds, the method is limited by data variability, especially when using smaller matrix sizes. This can be seen in Figure 2, which displays typical results obtained from an MDM analysis of data fitting to various S × I matrices. This novel hit compound identified in screening approaches displays a competitive MoI with respect to ATP. Figure 2a shows the traditional fit of the equation for competitive inhibition to the data generated using the 7s × 10i matrix for the compound using GraFit (Erithacus Software, West Sussex, UK). The figure also shows the results of the F test, which strongly suggests that the increase in the quality of fit resulting from the nested mixed noncompetitive model (having one extra parameter), compared with that for the competitive inhibition, results only from chance and not from the need for an additional parameter to describe the data.
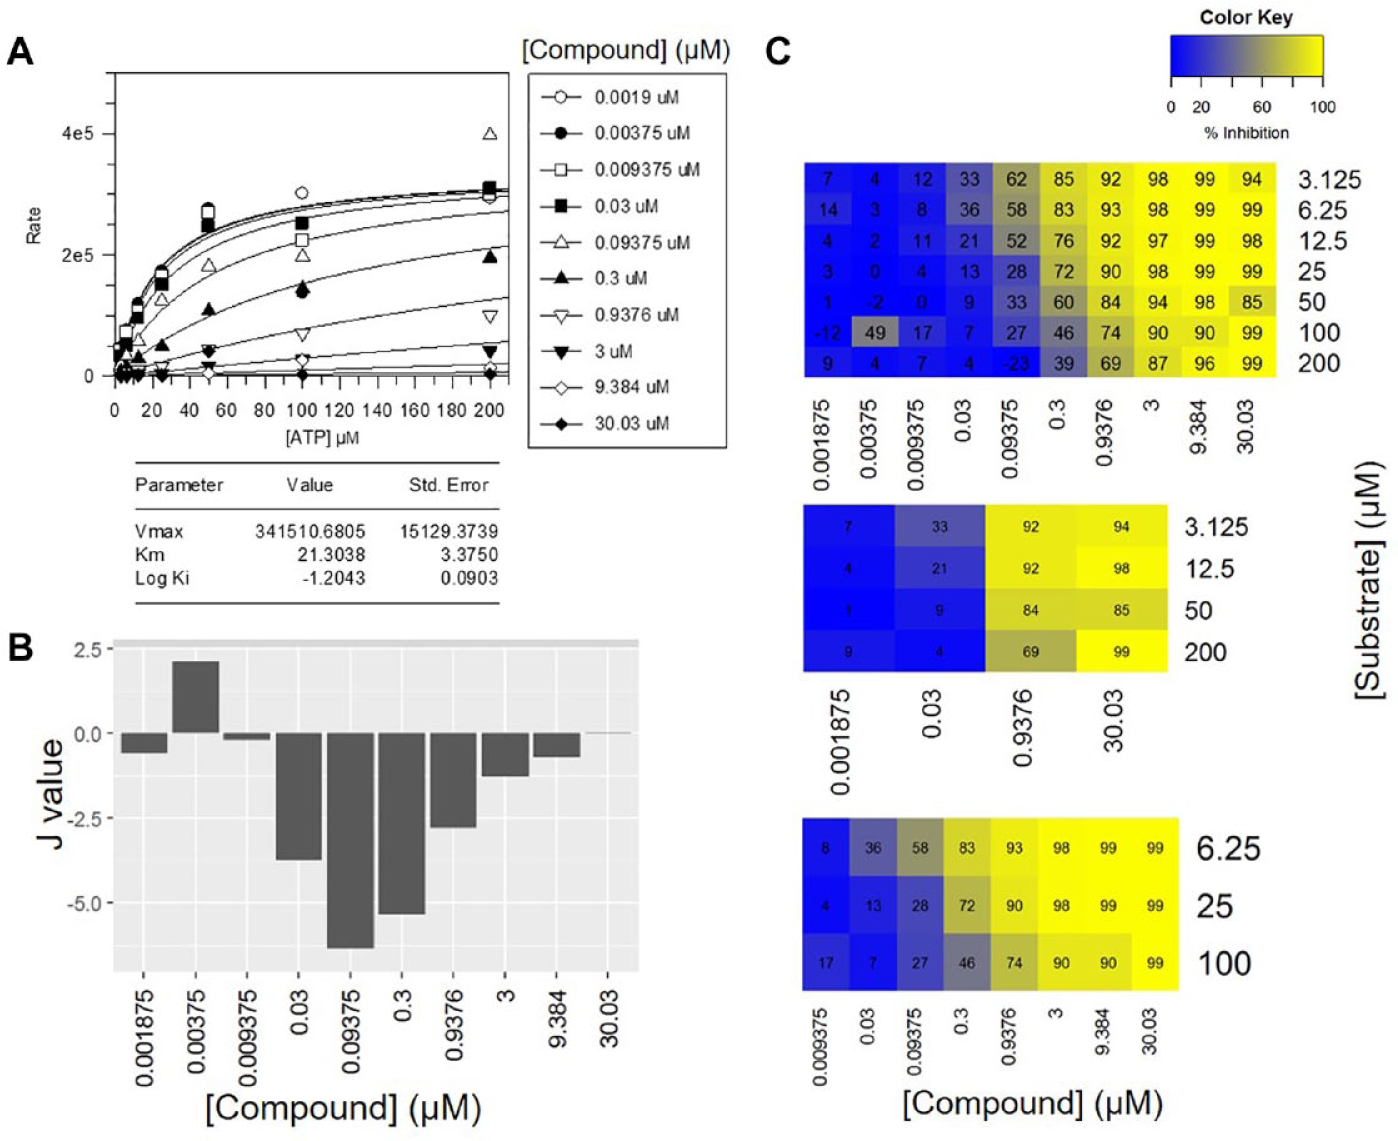
Profiling the mode of inhibition of sunitinib versus KITm enzyme using various techniques. (A) The traditional curve-fitting approach. (B) The J value approach described by Auld et al. (C) The minimal descriptive model (MDM) method. Every model (GraFit curve fitting, Auld [all matrix sizes], and MDM [all matrix sizes]) concludes this compound acts via a competitive MoI.
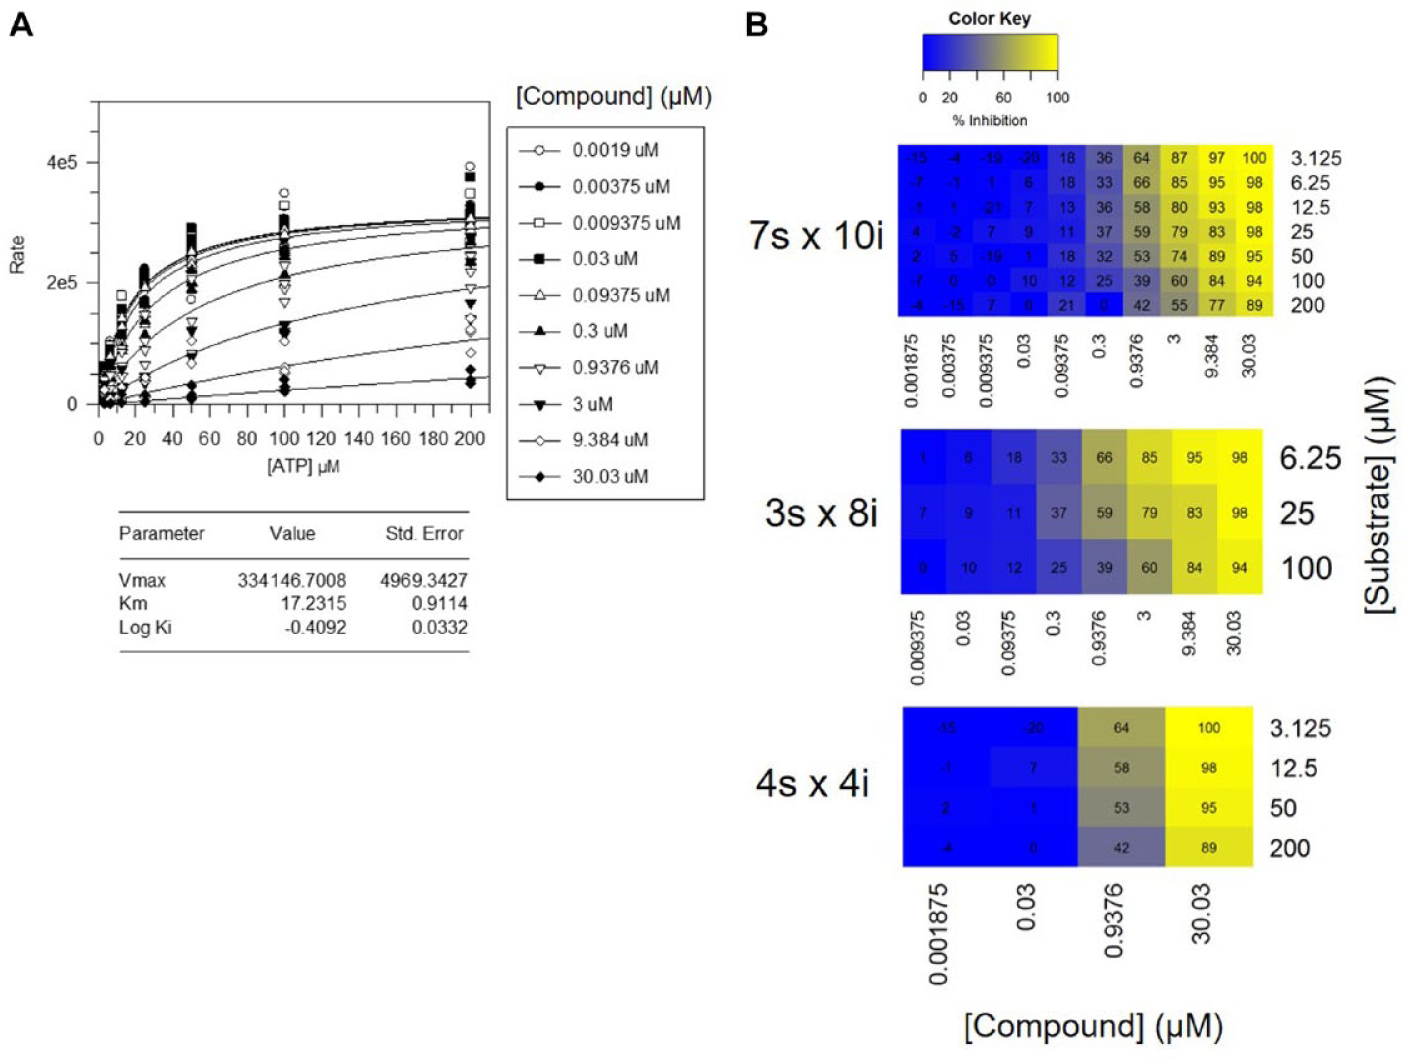
Mechanistic data obtained for an inhibitor of KITm. (A) Data analyzed in GraFit software (traditional curve-fitting approach). The F test concludes that the increase in goodness of fit for the mixed model does not justify the extra parameter, as the P value is >0.05 when compared with the competitive model. Therefore, this compound is best described as competitive. (B) The same experimental data was analyzed in the minimal descriptive model (MDM) method using various matrix sizes. The compound was also classified as competitive using the MDM method.
Various matrix sizes were compared to determine the number of data points required to accurately determine the MoI. Figure 2b displays the percentage inhibition matrix visualizations for each matrix size. The increase in Km value with increasing compound concentration can be clearly observed in these figures. In this case, all matrix sizes conclude that the compound is competitive with respect to the substrate, as determined by the AIC being lowest when fitting to the competitive model (smaller AIC represents a better fitting model).
Fitting to the Auld method misclassifies the compound as mixed when using 4s × 4i data; however, the MDM method does classify the compound as competitive when using any matrix size. This suggests that although these approaches are suitable methods of determining the MoI of a compound in a high-throughput manner, they are limited by matrix size. The lack of confidence for the fit when using a 4s × 4i matrix is likely due to the fact that if there is one outlier in the 16 data points, this will have a significant effect on the fitting of the model to the data. In this way, one outlier due to experimental error or equipment failure could wrongly classify a compound. By including more data points in the analysis, the introduction of an outlier will have less impact on data fitting. In most cases where there was disagreement between the two matrices, the discrepancies were due to data variability. However, overall, the 4s × 4i matrix size was capable of determining the mechanism and could be appropriate if the data were of high quality. In most circumstances, however, we found that a 3s × 10i matrix size performs either equally or better and that this matrix size is simpler as a workflow in our HTS process, as concentration-response experiments are run in 10-pt dose curves. These same plates can be created as three copies and run simply with the three substrate concentrations. From the comparisons shown of the different matrix sizes in our data analysis, it is clear that either the Auld or the MDM method can be applied to a variety of matrix sizes, and increasing the matrix size improves the quality of the analysis and prediction of MoI. However, using larger matrices involves higher levels of resources and has greater cost implications. Our application of nonlinear regression fitting models in the MDM analysis provides a statistical basis for a robust discrimination between MoI, alongside the high-throughput visualization.
HSD17β13
Following the initial validation of the MoI analysis approaches using this kinase system, it was important to investigate the viability of using the same technique with a different assay technology. For this purpose, a dehydrogenase target was selected, which had been screened using AMI-MS. The assay measures the mass change of the substrate, LTB4 to Oxo-LTB4, which is catalyzed by the HSD enzyme. Experimental data were normalized by the calculation Oxo-LTB4/(Oxo-LTB4 + LTB4), which is in line with our internal methods for AMI-MS data processing. A primary screen of 1 million compounds was executed, testing each compound at a single concentration of 10 µM. This yielded 33,000 active compounds, of which a selection of 6000 compounds was made, which were then tested in 10-point dose-response curves. A selection of ~80 hit compounds with the most interesting chemistry was subsequently made for the determination of MoI.
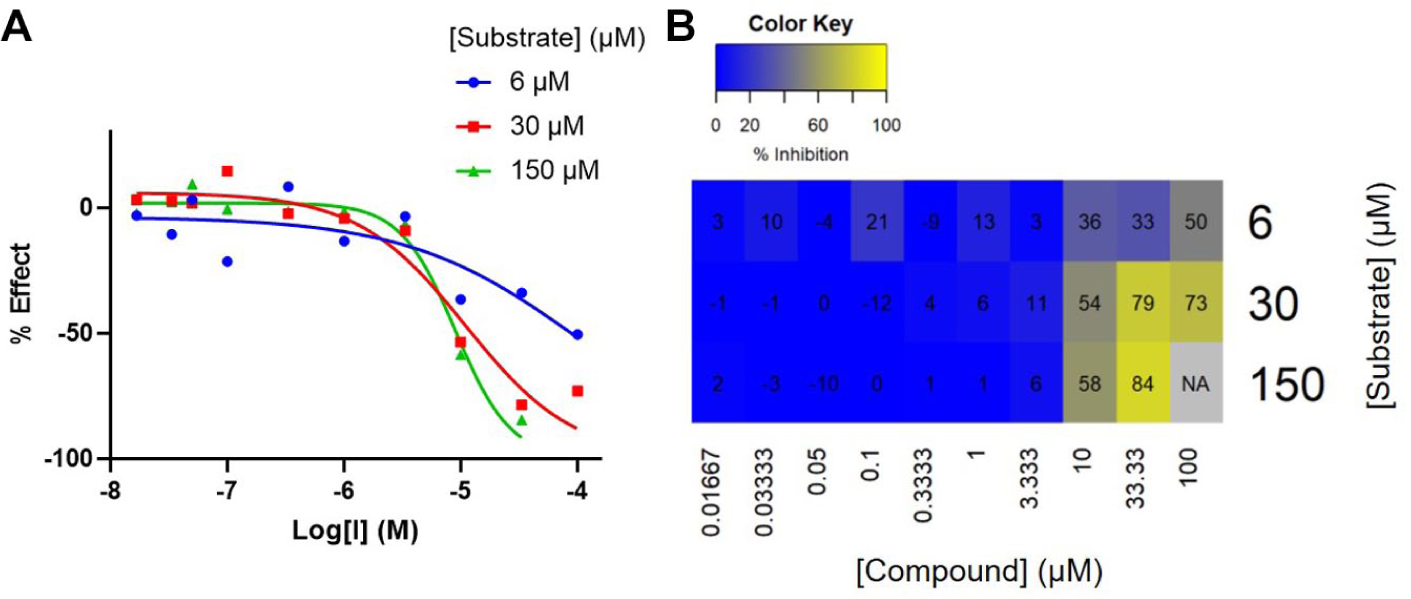
The resulting IC50 curves were analyzed in Genedata Screener. An example compound is shown in Figure 3a, in which a decrease in potency is observed with increasing substrate concentration, indicative of the MoI for a competitive compound. Testing these data in the MDM approach also classifies the compound as competitive with respect to the substrate LTB4 (10 inhibitor and 5 substrate concentrations; Figure 3b), further validating the MDM method as appropriate for these studies and confirming that the approach is suitable for alternative technologies in addition to ADP-Glo. For the 86 compounds tested here, the MDM approach determined 5 compounds to be competitive, 20 compounds as mixed tending toward noncompetitive, 4 compounds as mixed tending toward uncompetitive, and 57 compounds as noncompetitive.
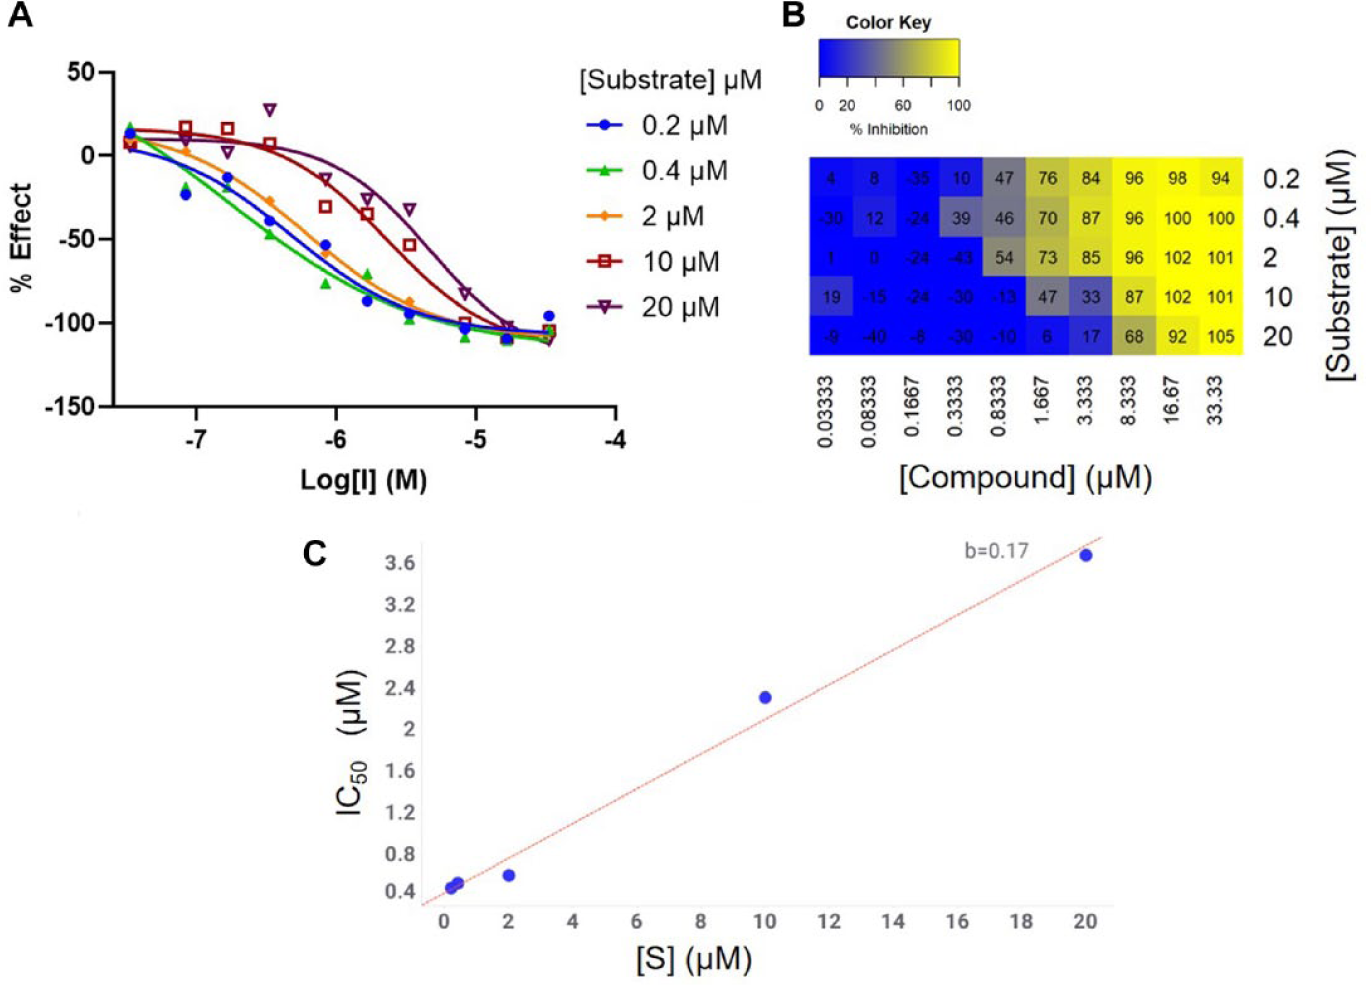
Classification of mechanism of inhibition for an inhibitor of HSD17b13. (A) IC50 curves for one compound at five substrate concentrations above and below Km (2 µM). The compound shows higher potency at lower substrate concentrations, which suggests this compound is acting by a competitive mechanism. (B) Percentage inhibition matrix for the same data. The minimal descriptive model approach also classifies this compound as competitive with respect to substrate. (C) IC50 plotted against [S]. The positive slope (0.17) also shows that this compound is competitive and provides a rapid visualization and indication of mechanism.
The IC50 values were then obtained from our analysis package, Genedata Screener, and simply plotted against the substrate concentration used. Fitting a linear regression model to this data gave plots clearly showing changes in IC50 at varying [S] (Figure 3c). In doing so, this provides a simple and rapid method for identifying this change in potency and therefore provides early indications of MoI. For competitive compounds, the expected slope of the line is Ki/Km. Negative slopes or slopes that are not significantly different from zero will tend to highlight compounds with potentially uncompetitive or noncompetitive MoI.
This work also prompted the incorporation of the simple visual method for assessing potential shifts in IC50 with varying substrate concentrations as an early qualitative indication of MoI immediately after an HTS.
HER2
Further evaluation of the method was required to investigate whether implementation on a larger number of compounds was feasible, from both the practical experimental and data analysis perspectives. For this purpose, another kinase target was selected. The most promising hit compounds, selected from a chemistry perspective, from the 2 million compound primary screen that were progressed to the IC50 screening stage (~1300 compounds) were also tested at varying substrate concentrations and analyzed using these MoI methods. Of these compounds, 312 produced high-quality curves for all three substrate concentrations tested according to our internal classification system of slope (n.Hill) equals 1 for a 1:1 binding stoichiometry, log 95% confidence interval of less than 0.3, and a full span dose response between uninhibited rate and maximum inhibition. Many of the other compounds showed weak inhibition or more variable data; therefore, it was difficult to reliably measure curve shift, so these were not included in the method comparison.
We compared the IC50 shift method to the MDM method and found that there were 281 competitive compounds according to the MDM method. Eighty-seven compounds showed a significant observable positive increase in slope, with 83 of these classified as competitive in the MDM analysis and 4 as mixed noncompetitive. There were 225 compounds classified as not significantly different to a slope of zero; therefore, these could be noncompetitive, but this would need follow up to confirm. These compounds also have lower Ki values and so are likely to be of more interest. There were 11 compounds classified as pure noncompetitive in the MDM analysis. All of these had slopes that were not significantly different from zero in the IC50 shift method.
Although we observe broad agreement between the MDM and the IC50 curve shift method, the MDM method is more robust for MoI analysis, as the IC50 would propagate errors through the two curve-fit analysis procedure. Relying on observations of slopes is likely not the most robust analysis but can provide visual indication of MoI. Fitting the data globally using the MDM approach is a significant improvement.
Figure 4 shows some typical data from the HER2 compound screening and MoI analysis. A 3s × 10i matrix was used for simplicity of testing because of the high throughput required for this target. ATP concentrations used were 0.2 × Km, Km, and 5 × Km. Many of the compounds tested were classified as competitive, as expected for this kinase target. Because the [substrate] range was narrower than that used for other targets, the observed shift in potency was less distinguishable. However, the concentrations used did clearly elucidate the MoI for many compounds in different inhibitor series.
Data for one example of 1300 compounds profiled versus Her2. These were tested in a 3s × 10i matrix to simplify testing at high throughput. (A) The GraFit curve-fitting analysis for this compound designated a competitive mechanism of inhibition (MoI). (B) The observed potency shift in IC50 curve with varying [substrate]. This shift appears less significant than those observed for inhibitors of other targets because of the smaller range of substrate concentration used. (C) Minimal descriptive model visualization of the same data, which also concluded that this inhibitor acts via a competitive MoI.
Despite an uncompetitive mechanism being very rarely identified, although clearly a preferred MoI, this method identified three possible uncompetitive compounds, an example of which is highlighted in Figure 5. The MDM method reported this compound as uncompetitive, and upon observation of the concentration-response curves, there is a tendency toward more potent inhibition at the higher concentration of substrate. This concentration-response data show increased variability when using a substrate concentration of 0.2 × Km, also suggestive of weaker binding. Despite this, the model selection is able to identify uncompetitive inhibition as the most likely mechanism, consistent with the IC50 shift graph. This early indication of usually rare types of MoI are likely of interest to project teams.
An example of an uncompetitive compound identified in the Her2 screen. The minimal descriptive model method categorized this compound as uncompetitive, and observing the dose-response curve, this compound is clearly more potent when screened at higher [substrate].
A considerable number of the hit compounds from this HTS had weak potency, which makes it more challenging to discern the mechanism, as was also the case in the method described by Auld et al. 14 (Figure 6). Compounds with varying potency will always be observed in a screening output, and to circumvent this issue, the compounds should be screened in different compound concentration ranges. However, in an HTS setting, it is not feasible to screen at a large enough concentration range to cover all potencies, as the number of data points would be too large. An alternative would be to screen all compounds at the standard concentration range and then to screen the selected compounds that were too potent or too weak to obtain a full concentration-response curve at the alternate concentration ranges. Again, in an HTS setting, this would normally be beyond the resource demand due to the increased volume of reagents and time required. Therefore, a compromise needs to be made in which compounds are screened at a standard concentration range, which is likely to cover most of the compound potencies. Unfortunately, this compromise results in a lack of MoI data being acquired for some weak compounds.
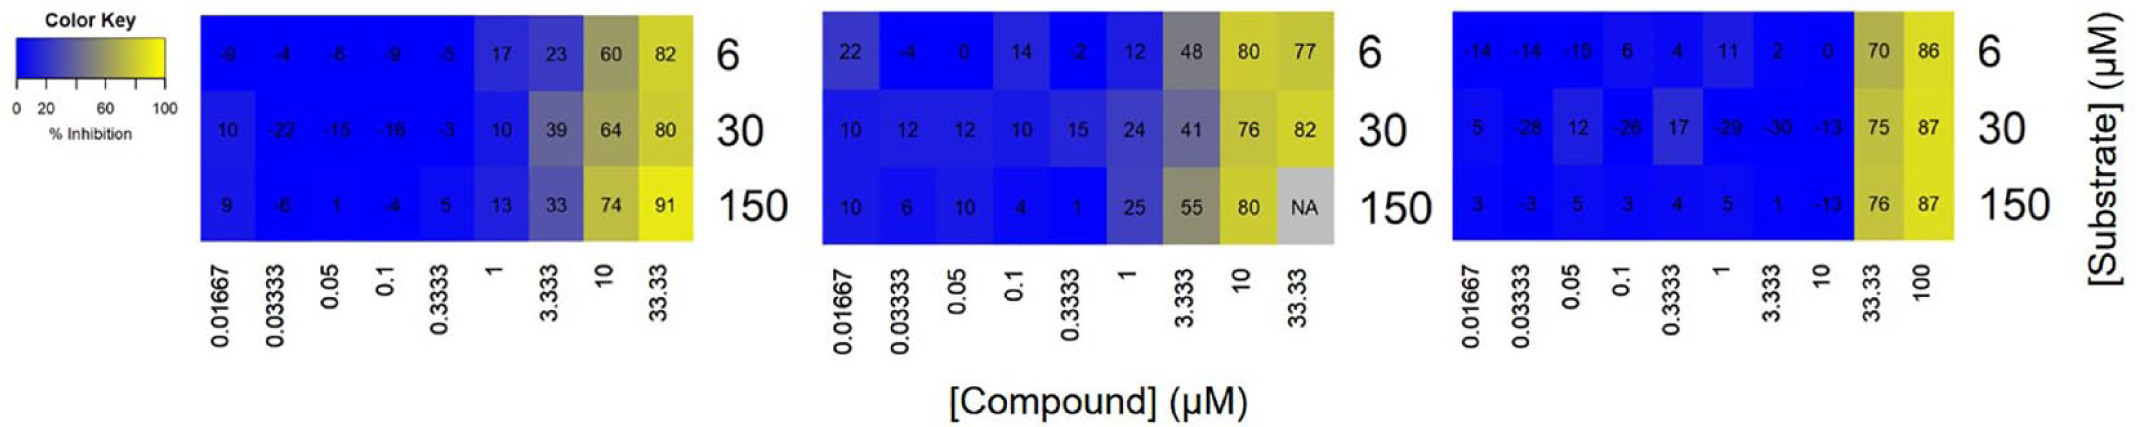
A significant proportion of the Her2 screening output demonstrated weak potency. These three exemplar compounds highlight that low affinity results in difficulty in reliably determining mechanism of inhibition.
By testing this large number of compounds, it was concluded that although this level of throughput is feasible for the workflow, the data are most valuable for key compounds from series of interest rather than testing all compounds. These key compounds can be selected using chemist input, allowing us to focus on compounds that are of interest and removing the testing of frequent hitters and inactive compounds, as these can provide misleading information. To do this, a confirmation assay should be run (preferably the concentration-response assay with the substrate concentration that is equal to Km). By doing this, and removing frequent hitter compounds, a limited number of compounds can be selected that are of most interest to the chemist, with two or three examples that are closely related in chemical structure selected and tested using the MoI methodology. This provides a more focused data set, which is of much higher value to a drug project, allowing for the selection of a hit series with different modes of action immediately after HTS to prioritize differentiated chemistry.
We have described and assessed various methods for determining MoI that have enabled us to use parameters in a high-throughput manner to rapidly confirm compounds with distinct MoI. These incorporate analyses based on a MDM to deliver a workflow that allows rapid and earlier compound classification immediately after HTS. We have shown the applicability of our methods across several target classes, assay technologies, and scale of compound sets. The combination of small matrices coupled with visual plots of IC50 shifts provides powerful guidance on the span of mechanisms identified in HTS outputs. These recommendations could assist the decisions of chemists regarding which compound clusters to progress to further workup after HTS.
Footnotes
Acknowledgements
We would like to acknowledge our colleagues David Murray, Ian Sinclair, and Martin Packer for their technical experimental expertise and fruitful discussions on the subject matter.
Declaration of Conflicting Interests
The authors declared the following potential conflicts of interest with respect to the research, authorship, and/or publication of this article: All authors are employed by AstraZeneca, and their research and authorship of this article was completed within the scope of their employment with AstraZeneca.
Funding
The authors received no financial support for the research, authorship, and/or publication of this article.