
Abstract
LpxA, the first enzyme in the biosynthetic pathway for the Lipid A component of the outer membrane lipopolysaccharide in Gram-negative bacteria, is a potential target for novel antibacterial drug discovery. A fluorescence polarization assay was developed to facilitate high-throughput screening for competitive inhibitors of LpxA. The assay detects displacement of a fluorescently labeled peptide inhibitor, based on the previously reported inhibitor peptide 920, by active site ligands. The affinity of the fluorescent ligand was increased ~10-fold by acyl carrier protein (ACP). Competition with peptide binding was observed with UDP-N-acetylglucosamine (IC50 ~6 mM), UDP-3-O-(R-3-hydroxymyristoyl)-N-acetylglucosamine (IC50 ~200 nM), and DL-3-hydroxymyristic acid (IC50 ~50 µM) and peptide 920 (IC50 ~600 nM). The IC50s were not significantly affected by the presence of ACP.
Keywords
Introduction
Lipopolysaccharide (LPS; endotoxin) is a primary constituent of the outer leaflet of the outer membrane of Gram-negative bacteria. The outer membrane is a barrier to the entry of many antibacterial compounds. 1 Perturbations of LPS biogenesis by genetic mutation or inhibition of biosynthetic enzymes, as well as physical disruption of the outer membrane, 2 can enhance the efficacy of these compounds. Moreover, in many Gram-negative pathogens, the cytoplasmic enzymes involved in the early stages of LPS biosynthesis are themselves essential for bacterial survival and have no human homologs. Therefore, the enzymes required for LPS biosynthesis are potential targets for the discovery of novel antibacterial compounds. (See Nikaido 1 for a description of the cytoplasmic steps in LPS biosynthesis.) Potent inhibitors of the second enzyme in the pathway for biosynthesis of the lipid A moiety of LPS, UDP-3-O-(R-3-hydroxymyristoyl)-N-acetylglucosamine deacetylase (EC 3.5.1.108, LpxC), have been reported. 3 With the exception of oligopeptides,4,5 however, no inhibitors of the first enzyme in the pathway, UDP-N-acetylglucosamine acyltransferase (EC 2.3.1.129, LpxA), have been reported.
The reaction catalyzed by LpxA is shown in Figure 1 . Anderson et al. 6 reported that the forward reaction is thermodynamically unfavorable (Keq ≈ 0.01), so the deacetylation of the product by LpxC ( Fig. 1 ) is considered to be the first committed step. LpxA is well conserved among Gram-negative pathogens responsible for serious bacterial infections, such as Escherichia coli, Pseudomonas aeruginosa, and Klebsiella pneumoniae, and has been shown to be essential in several species, including E. coli, 7 P. aeruginosa, 8 and Salmonella enterica serovar Typhi. 9
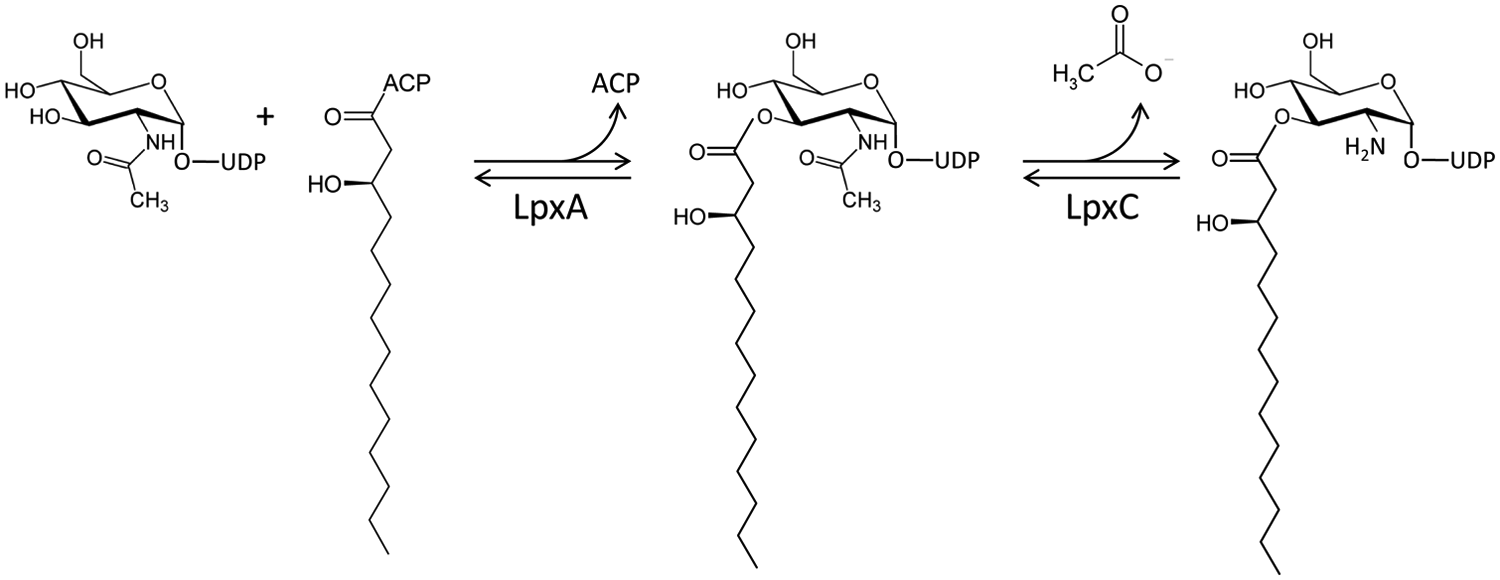
The first two reactions in the biosynthesis of lipopolysaccharide in Escherichia coli. LpxA catalyzes the condensation of UDP-N-acetylglucosamine with R-3-hydroxymyristic acid from R-3-hydroxymyristoyl-acyl carrier protein (ACP). LpxC catalyzes deacetylation of UDP-3-O-(R-3-hydroxymyristoyl)-N-acetylglucosamine.
A hindrance to identifying LpxA inhibitors is the absence of a suitable high-throughput–compatible assay that would allow screening of a large number of compounds for inhibitory activity. High-throughput screens of more than 1 000 000 compounds are not unusual. The first such assay, capable of continuous, fluorescence-based measurement of the forward reaction, was recently described. 10 Here we describe a high-throughput–compatible, fluorescence anisotropy–based biochemical assay that can be used to screen for inhibitors of E. coli LpxA by measuring the displacement of a fluorescent ligand from the active site. The fluorescent ligand is a derivative of peptide 920, an inhibitor of E. coli LpxA discovered by phage display 4 that binds with high affinity in the active site (Ki = 50 nM). 11 Displacement of the peptide from the protein by another ligand, such as the forward reaction product UDP-3-O-(R-3-hydroxymyristoyl)-N-acetylglucosamine, results in a substantial decrease in fluorescence anisotropy. An advantage of this assay is that it does not require the use of substrates that are difficult to obtain in large amounts, such as UDP-3-O-(R-3-hydroxymyristoyl)-N-acetylglucosamine or R-3-hydroxymyristoyl-acyl carrier protein (ACP).
Materials and Methods
Chemicals
TAMRA-peptide and peptide 920 were from Biopeptide Co. Inc. (San Diego, CA). UDP-3-O-(R-3-hydroxymyristoyl)-N-acetylglucosamine was from Alberta Innovates NuRx Services (Edmonton, Alberta, Canada). DL-3-hydroxymyristic acid and UDP-N-acetylglucosamine were from Sigma-Aldrich (St. Louis, MO). HEPES-NaOH (pH 8.0) solution was from Boston Bioproducts (Worcester, MA). Triton X-100 (Surfact-Amps-100) was from Thermo-Fisher (Pittsburgh, PA).
The methods for cloning, expression, and purification of the proteins used in this study are described in the
LC-MS/MS assay for LpxA catalysis
Catalytic assays were performed in buffer consisting of 50 mM HEPES-NaOH (pH 7.0) + 0.01% Triton X-100. The neutral pH was selected to minimize spontaneous hydrolysis of the substrate UDP-3-O-(R-3-hydroxymyristoyl)-N-acetylglucosamine (HM-UNAG). Assay samples were analyzed by LC/MS/MS on an AB/Sciex 4000 mass spectrometer (Concord, Ontario, Canada) interfaced to a Shimadzu LC-20 high-performance liquid chromatography (HPLC) system. Separate methods were used to analyze the appearance of UDP-N-acetylglucosamine (UNAG) and consumption of HM-UNAG in reactions catalyzed by LpxA. A YMC-Pack Pro C18 column (YMC, Allentown PA, 50 × 4 mm, 3 µm particle size, 120 Å pore size) was used for detection and quantification of UNAG. This solvent system consisted of 10 mM ammonium acetate (pH 6.5; solvent A) and 5 mM ammonium acetate in 1:1 (v:v) acetonitrile:methanol (solvent B) at a flow rate of 0.7 mL/min. After a 0.9 min equilibration at 4% solvent B, UNAG was eluted using a two-step gradient from 4% to 40% solvent B in 0.7 min, then to 95% solvent B for 0.3 min. The composition was held at 95% solvent B for 0.4 min, then dropped to 4% again for a total run time of 3.5 min. UNAG was monitored by negative ion MS/MS in MRM mode, where the m/z 606–272.9 fragmentation was monitored at −50 eV with a source temperature of 550 °C and a spray voltage of −550 V. A standard curve, prepared in triplicate in assay buffer, showed quantitation of UNAG was linear from 20 nM to 1 µM. The standard curve was used to calculate product concentrations in assay samples.
Fluorescence anisotropy measurement
A Pherastar plate reader (BMG Labtech, Cary, NC) equipped with optics for fluorescence polarization measurements using 540 nm excitation and 590 nm emission was used. The focal height was 10.9 mm. Each reading averaged 50 flashes. The gains of the parallel and perpendicular emission channels were adjusted to give an anisotropy reading of approximately 0.03 for free TAMRA-peptide in 50 mM HEPES-NaOH (pH 8.0) + 0.01% Triton X-100, to avoid negative values. In most cases, the sample volume was either 8 or 9 µL, depending on whether there were two additions of 4 µL or three additions of 3 µL, in a black, low-volume, 384-well, polystyrene plate (Thermo-Fisher). Assays were conducted in 50 mM HEPES-NaOH (pH 8.0) + 0.01% Triton X-100 unless stated otherwise. The pH was selected as the middle of the range of pH (7.5 to 8.5) that results in the lowest TAMRA-peptide Kd (see below).
Z′ measurement
For each LpxA concentration, 4 µL of 2X LpxA solution was mixed with 4 µL of a 2X solution of holo-ACP and TAMRA-peptide containing 40 nM TAMRA-peptide and 60 nM holo-ACP in a low-volume 384-well assay plate. The buffer consisted of 50 mM HEPES-NaOH (pH 8.0) + 0.01% Triton X-100. There were 24 replicate wells for each LpxA concentration. Reagents were dispensed with a handheld electronic pipettor. Anisotropy was measured after 5 min.
Curve fitting
Nonlinear least-squares regression was done with XLfit (ID Business Solutions Ltd., Burlington, MA).
The Langmuir binding isotherm for Kd calculations is

where
The Hill equation for IC50 calculations is

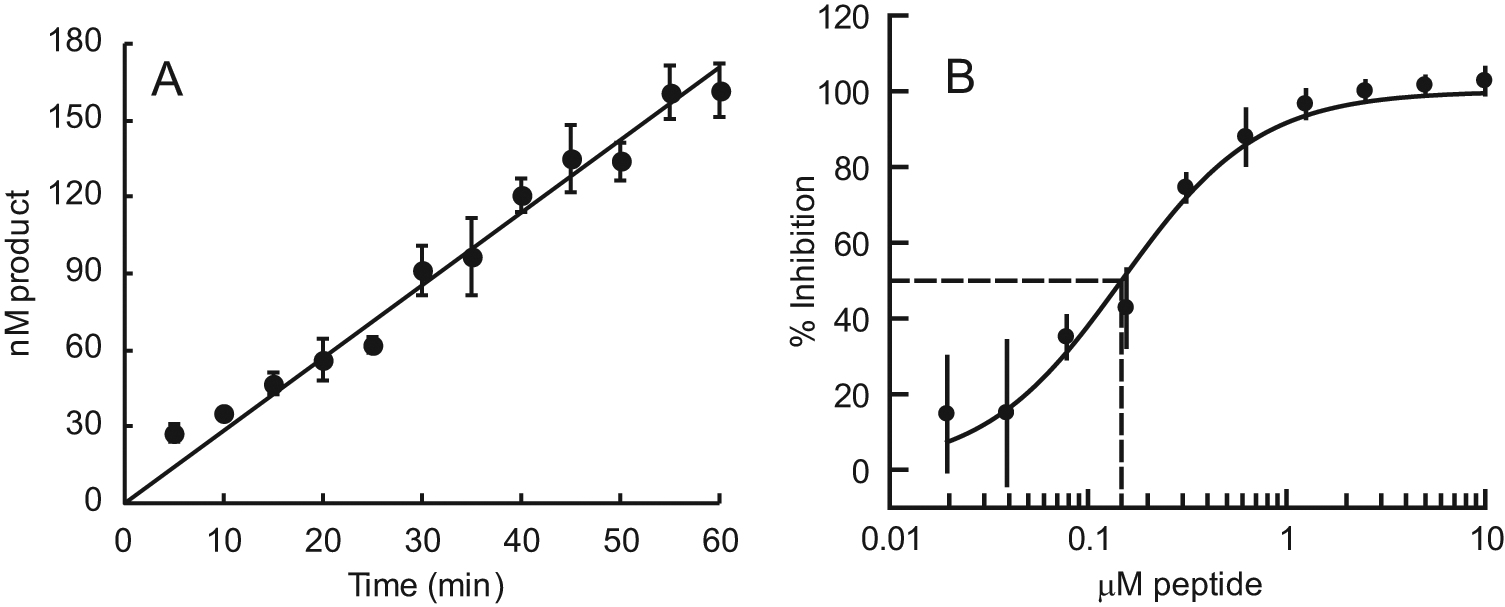
where [I] is the inhibitor concentration and b is the Hill slope. The values of % inhibition were calculated using the equation
where [P]i is the concentration of product in the presence of inhibitor concentration i, MAX is the product concentration in the uninhibited state, and MIN is the product concentration in the fully inhibited state.
Results and Discussion
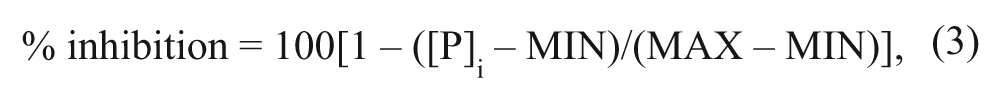
The x-ray crystal structure of E. coli LpxA with the inhibitory pentadecapeptide 920 bound resolved only the C-terminal 12 residues, 11 suggesting that the N-terminus of the peptide does not make strong interactions with the protein. We therefore used the C-terminal 12 residues of peptide 920, WMLDPIAGKWSR, for our fluorescence anisotropy assay ligand. A lysine residue was added to the C-terminus, allowing a TAMRA label to be attached to the ϵ-amino group. The affinity of the interaction between E. coli LpxA and the TAMRA-labeled peptide, and the binding-dependent changes in fluorescence intensity and anisotropy, were measured by titrating LpxA with 10 nM TAMRA-peptide. The peptide showed LpxA binding-dependent increases in fluorescence intensity and anisotropy after a 5 min incubation at room temperature (~21 °C; Fig. 2 ). The dissociation constant (Kd), based on the approximately twofold fluorescence intensity increase, was 282 nM. The apparent Kd based on the fluorescence anisotropy increase was 147 nM. The lower apparent Kd measured by anisotropy resulted from the higher fluorescence intensity of bound versus free peptide. The change in anisotropy of the peptide upon binding was 0.15. The fluorescence intensity increase of TAMRA-peptide upon binding to LpxA could be due to an interaction of the TAMRA fluorophore with the protein or to reorientation of the fluorophore with respect to quenching interactions with the peptide.
Binding of TAMRA-peptide to E. coli LpxA measured by (
Slight degradation of the peptide ligand by peptidases contaminating the LpxA protein preparation was observed. Approximately 4% of the 60 nM peptide was cleaved to a more hydrophilic, TAMRA-containing product by 200 nM E. coli LpxA after a 2.5 h incubation, as measured by reverse-phase HPLC with fluorescence detection. Nevertheless, the effect of this degradative activity could be observed as a time-dependent increase in the Kd as measured by fluorescence anisotropy. In the experiment discussed above, the Kd increased from 147 nM at 5 min to 298 nM at 75 min. Treatment of the LpxA protein with complete protease inhibitor cocktail (Roche Diagnostics) prevented the time-dependent change in the Kd. Subsequent binding measurements were made after a standard incubation time of 5 min without protease inhibitors. In a high-throughput screening environment, in which reagents may be stored for several hours and plates may be read after incubation times longer than 5 min, inclusion of protease inhibitors should be considered.
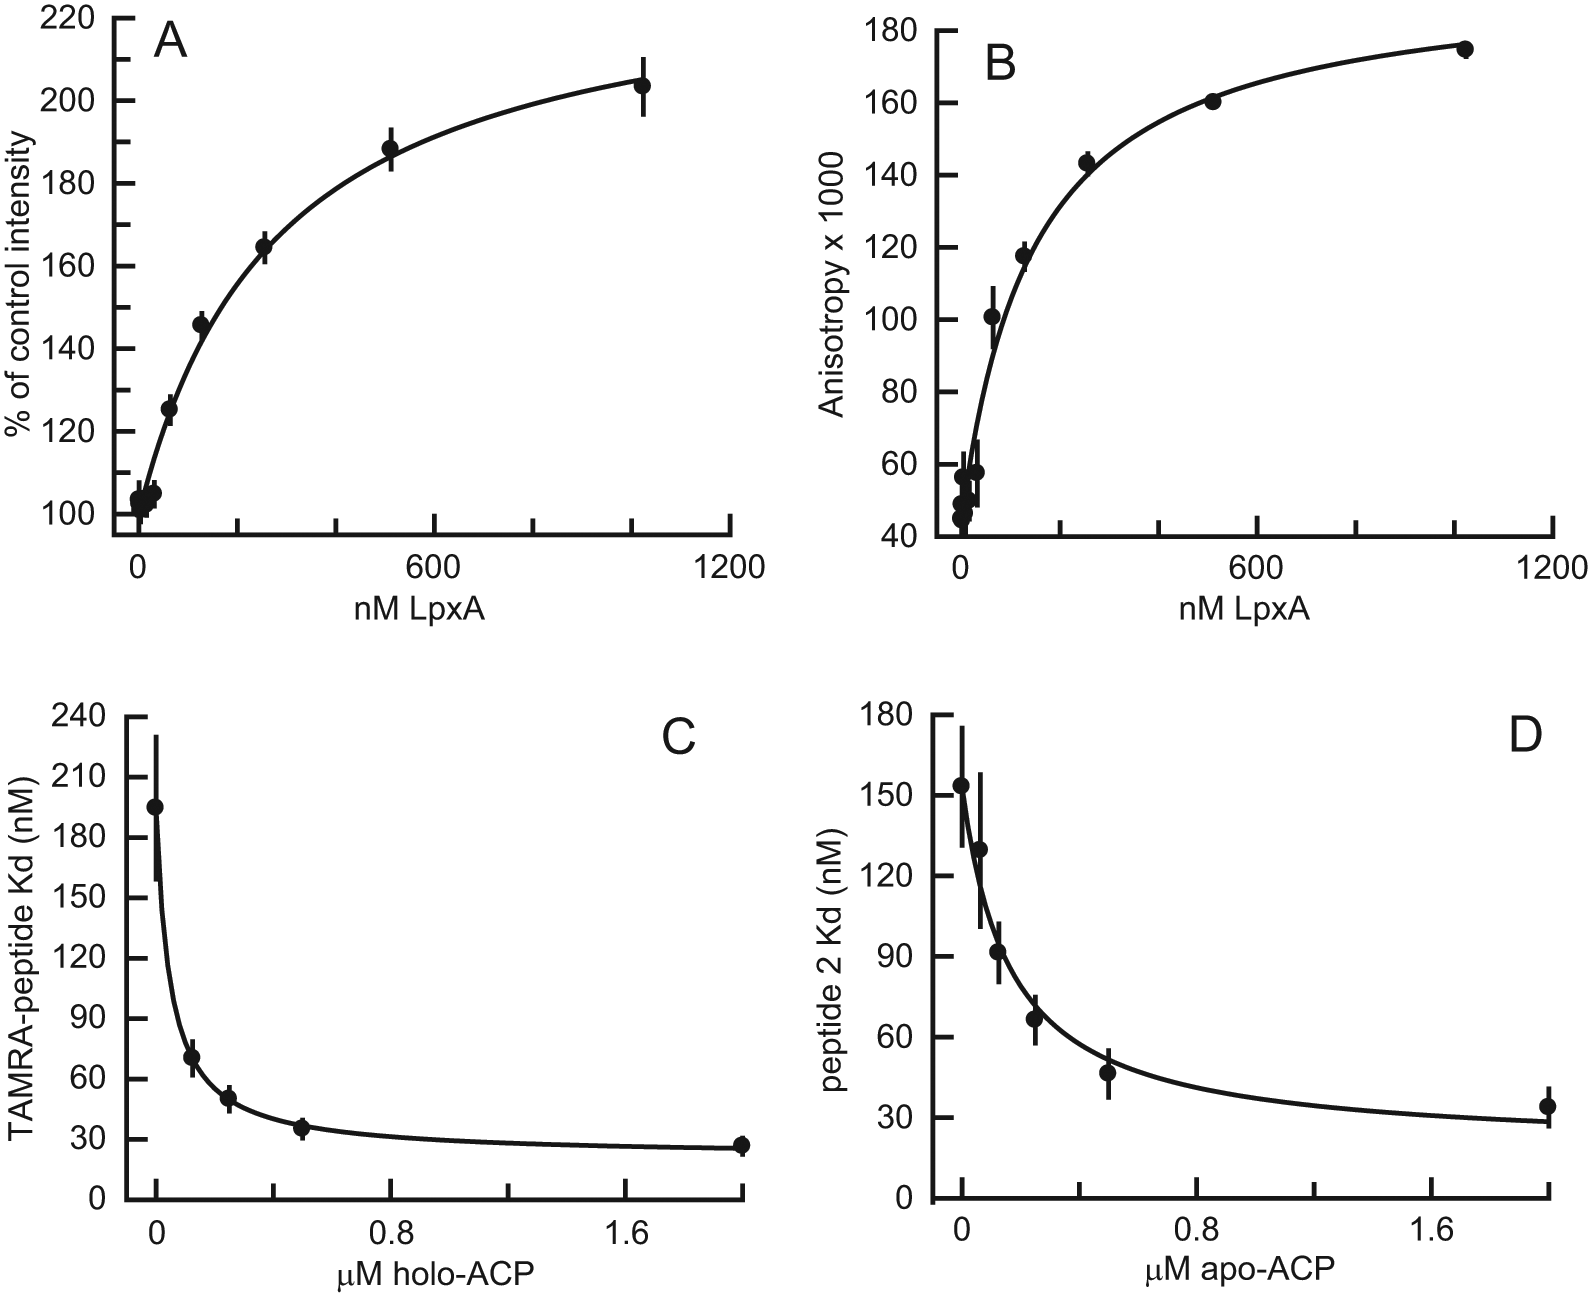
The ability of the TAMRA-peptide to inhibit the catalytic activity of E. coli LpxA like its parent, peptide 920, was demonstrated using an LC-MS assay to monitor the production of UNAG in the thermodynamically favored reverse reaction ( Fig. 3 ). A reaction progress curve for the uninhibited enzyme is shown in Figure 3A , and an IC50 curve for TAMRA-peptide is shown in Figure 3B . The uninhibited reaction progressed at a constant rate for at least 1 h, during which about 60% of 250 nM substrate was consumed. The peptide had an IC50 of 150 nM, similar to the 60 nM IC50 reported for peptide 920 in the forward reaction. 11 Note that the catalytic reaction was performed at pH 7 to minimize spontaneous hydrolysis of the substrate, whereas binding measurements were performed at pH 8. The effect of the pH on inhibition of the catalytic reaction by peptide 920 has not been investigated.
Inhibition of E. coli LpxA catalysis in the reverse reaction by TAMRA-peptide. (
The effects of buffer, pH, salt, and Triton X-100 detergent concentration on the affinity of E. coli LpxA for TAMRA-peptide were investigated. The pH, but not the identity, of the buffer had a substantial effect (
The effects of various salts on the affinity of E. coli LpxA for TAMRA-peptide were measured by fluorescence anisotropy in 50 mM HEPES-NaOH (pH 8.0) + 0.01% Triton X-100 with 20 nM TAMRA-peptide and 0 or 150 nM LpxA. The salts tested were ammonium acetate, ammonium chloride, ammonium sulfate, ammonium glutamate, sodium acetate, sodium chloride, sodium sulfate, sodium glutamate, potassium acetate, potassium chloride, potassium glutamate, and magnesium chloride at concentrations between 12.5 and 200 mM. The acetate, chloride, and glutamate salts of ammonium, sodium, and potassium had no significant effect; that is, the anisotropy difference between samples with and without LpxA changed by ≤±0.01. The sulfate salts increased the anisotropy difference between 0 and 150 nM LpxA in a concentration-dependent manner, by about 30% at 200 mM, suggesting a slightly increased affinity of LpxA for TAMRA-peptide in the presence of 200 mM sulfate salt. Magnesium chloride decreased the anisotropy difference by a maximum of about 22% at 100 mM, suggesting a slightly decreased affinity. No changes of more than ±5% in total fluorescence intensity were observed as an effect of the presence of salts, with the exception of a reduction of 13% by 200 mM ammonium acetate. Subsequent investigations omitted additional salts because of their minimal effects.
Triton X-100 detergent was included in the assay to prevent adsorption of the protein and peptide ligand to the assay plate surface. There was no substantial effect of Triton X-100 concentrations between 0.004% and 0.01% on the affinity of E. coli LpxA for TAMRA-peptide, as measured by fluorescence anisotropy. The Kd values ranged unsystematically between 105 and 133 nM. The buffer generally contained 0.01% Triton X-100 to take full advantage of the surface blocking capability without exceeding the critical micellar concentration of 0.0155%.
The affinity of E. coli LpxA for TAMRA-peptide, as measured by fluorescence anisotropy, was substantially enhanced by the reverse reaction substrate holo-ACP ( Fig. 2C ). The Kd decreased from 195 ± 35 nM (best-fit value ± standard error of fitting) without holo-ACP to an extrapolated value of 21 nM at theoretical saturation with holo-ACP. By fitting the curve in Figure 2C to a binding isotherm (see the Materials and Methods section), the Kd of holo-ACP was determined to be 49 ± 2 nM. Apo-ACP (i.e., ACP lacking the 4′-phosphopantetheine prosthetic group) also enhanced the affinity of E. coli LpxA for TAMRA-peptide ( Fig. 2D ). The Kd decreased from 153 ± 22 nM without apo-ACP to an extrapolated value of 18 nM at saturation with apo-ACP. The Kd of apo-ACP was determined by this method to be 163 ± 38 nM. In the absence of LpxA, there was no effect of either holo-ACP or apo-ACP on the anisotropy of TAMRA-peptide.
The abilities of several ligands to compete with TAMRA-peptide for binding to E. coli LpxA were evaluated by fluorescence anisotropy with and without holo-ACP ( Table 1 ). There was little effect of holo-ACP. Hill slopes were close to unity, indicating little or no cooperativity of binding of the ligands to the three binding sites per LpxA trimer. The IC50 of UNAG, one of the substrates of the forward reaction, was several mM, somewhat higher than the Km of 0.82 mM reported by Wyckoff and Raetz. 12 In contrast, Williams et al. 11 reported a lack of competition between peptide 920 (SSGWMLDPIAGKWSR), on which the TAMRA-peptide is based, and UNAG. This result was based on the lack of effect of the UNAG concentration on peptide 920 IC50s in forward-direction reactions containing 50 µM R-3-hydroxymyristoyl-ACP and 1 µM to 5 mM UNAG. The peptide 920 IC50 was reported to be 700 ± 65 nM at 1 µM UNAG and 923 ± 230 nM at 5 mM UNAG. Given the uncertainty in the estimates of the peptide 920 IC50s, however, it is possible that there was a trend toward higher IC50s with increasing UNAG concentration, consistent with the relatively low affinity of UNAG. Moreover, the x-ray crystallographic data demonstrate an overlap between the binding sites of UNAG and peptide 920 ([PDB 2JF3] 13 and [PDB 2AQ9] 11 ). UDP-3-O-(R-3-hydroxymyristoyl)-N-acetylglucosamine, the product of the forward reaction of LpxA, showed strong competition with TAMRA-peptide in the fluorescence anisotropy assay, with an IC50 of 510 nM in the presence of holo-ACP and 730 nM in its absence. Consistent with this result, Williams et al. 11 calculated the Ki for the competition of peptide 920 with UDP-3-O-(R-3-hydroxymyristoyl)-N-acetylglucosamine to be 50 nM. A fragment of this product, DL-3-hydroxymyristic acid, the acyl chain component of the LpxA forward reaction product in racemic form, had an IC50 of 63 µM in the presence of holo-ACP and 47 µM in its absence. Peptide 920 itself competed with the closely related TAMRA-peptide with an IC50 in the high-nM range. Interestingly, there was no significant effect of holo-ACP on the IC50 of peptide 920, despite the observation that holo-ACP increased the affinity of TAMRA-peptide. A likely explanation for this discrepancy is that the effect of ACP on the affinity of TAMRA-peptide is due to an interaction of ACP with the TAMRA moiety. These results show that the fluorescence anisotropy assay is capable of detecting compounds that occupy the catalytic site of E. coli LpxA. Compounds that lower the affinity of TAMRA-peptide allosterically by binding at a site apart from the active site may also be detectable. The measurement can be made with or without apo- or holo-ACP. Including ACP allows a lower LpxA concentration to be used if the availability of LpxA is a limiting factor. On the other hand, the ability to perform a screen without ACP could substantially reduce the effort needed to prepare the reagents for the screen if the availability of LpxA is not a limitation.
Competition by Ligands with TAMRA-Peptide Binding to E. coli LpxA a
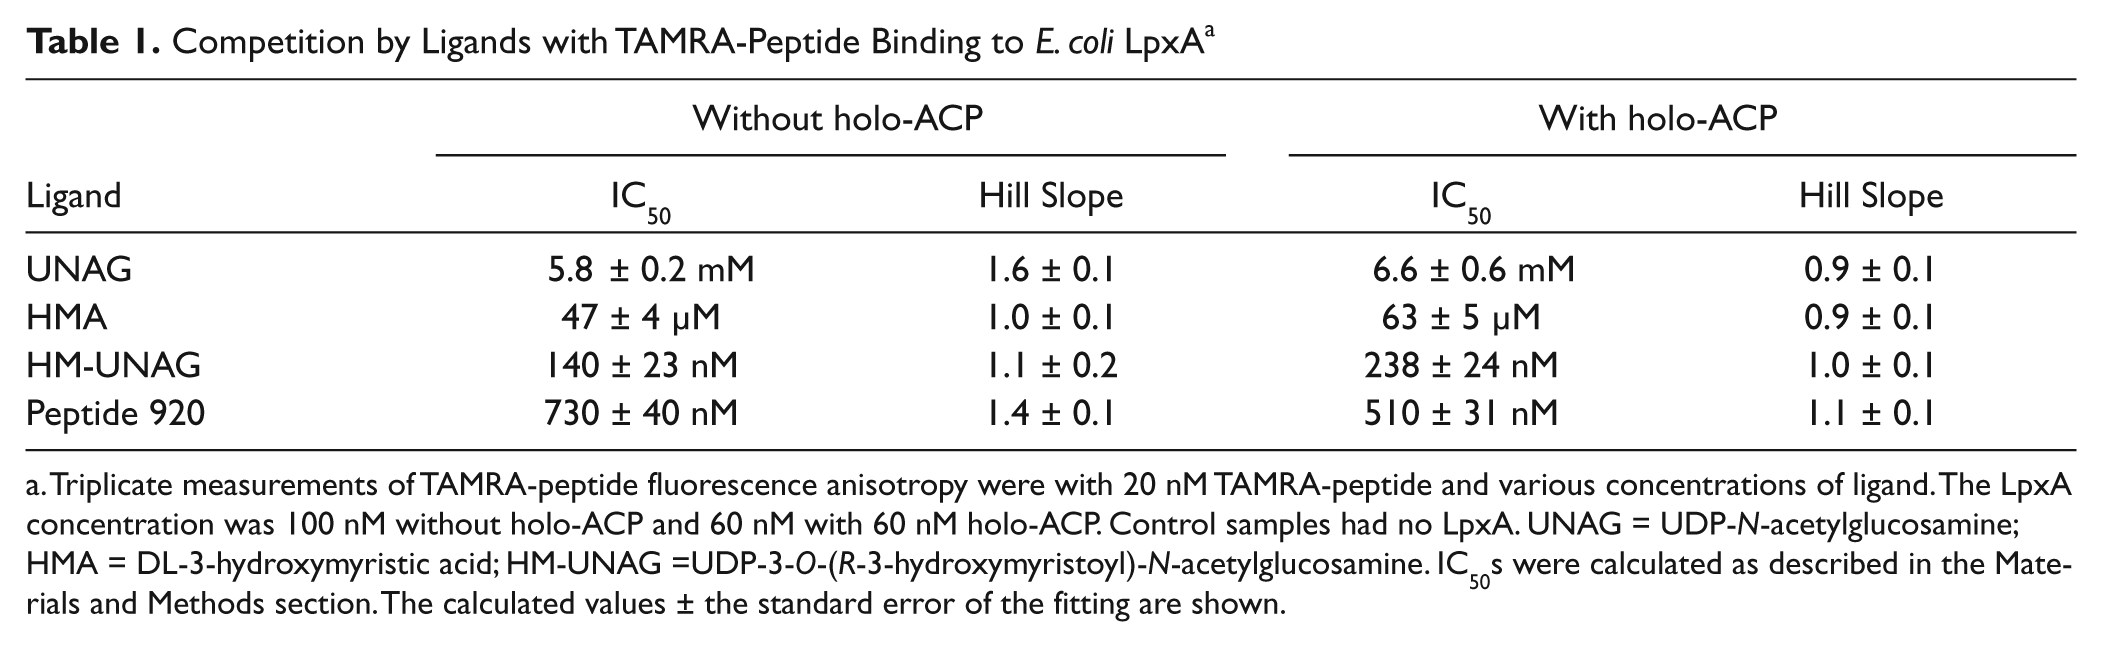
Triplicate measurements of TAMRA-peptide fluorescence anisotropy were with 20 nM TAMRA-peptide and various concentrations of ligand. The LpxA concentration was 100 nM without holo-ACP and 60 nM with 60 nM holo-ACP. Control samples had no LpxA. UNAG = UDP-N-acetylglucosamine; HMA = DL-3-hydroxymyristic acid; HM-UNAG =UDP-3-O-(R-3-hydroxymyristoyl)-N-acetylglucosamine. IC50s were calculated as described in the Materials and Methods section. The calculated values ± the standard error of the fitting are shown.
The Z′ statistic
14
for the assay was measured as a function of the LpxA concentration at a fixed concentration of holo-ACP, 60 nM, approximately equal to its Kd for binding LpxA. As shown in
The stability of the dilute 2X reagents for the assay, one containing 0 or 90 nM LpxA and the other containing 40 nM TAMRA-peptide and 60 nM holo-ACP, was investigated. There was no substantial change in either the minimum anisotropy (without LpxA; 0.032 ± 0.003 at 0 h and 0.031 ± 0.005 at 8 h) or the maximal anisotropy (with LpxA; 0.146 ± 0.002 at 0 h and 0.140 ± 0.003 at 8 h) when the 2X solutions were mixed after storage in polypropylene tubes in the dark for up to 8 h at room temperature (n = 6 in each case).
Because compound samples to be screened are usually dissolved in DMSO, the sensitivity of the assay to DMSO was investigated (
The first high-throughput–compatible enzymatic assay for the forward reaction of LpxA was recently reported. 10 The assay detects the free thiol in the 4′-phosphopantetheine prosthetic group of holo-ACP following the removal of the acyl chain in the forward reaction. One advantage of this method is that it can be generalized to other enzyme reactions catalyzing acyl transfer from ACP. Another is that the fluorescence readout allows it readily to be miniaturized. Because the reverse reaction of LpxA is thermodynamically favored, 6 the assay should include the next enzyme in the pathway, LpxC, to force the LpxA reaction forward by removing the product as it forms. This assay method has some important limitations. First, the sensitivity of thiol detection by ThioGlo requires product concentration in the low-µM range, resulting in the requirement for large amounts of substrates. For E. coli LpxA, a large quantity of R-3-hydroxylmyristoyl-ACP would have to be prepared. Second, the ultraviolet excitation wavelength of ThioGlo (<400 nm) has the disadvantage that it effectively excites the intrinsic fluorescence of many compounds present in screening libraries, resulting in a large amount of fluorescence interference. 15 Third, the detection system is incompatible with thiol-containing reducing agents, such as dithiothreitol, that are often added to buffers to preserve cysteine residues in the reduced state.
The fluorescence polarization–based LpxA assay described in this article does not require any substrates because it measures competitive displacement of an inhibitory fluorescent ligand, TAMRA-peptide, from the active site. Although the affinity of this ligand was enhanced by ACP, the presence or absence of ACP had a negligible effect on the sensitivity of the assay to competitive ligands when the TAMRA-peptide concentration was near its Kd. The assay is capable of detecting ligands occupying the binding sites for UDP-N-acetylglucosamine and R-3-hydroxymyristic acid. The fluorescence anisotropy readout allows the assay to be performed in no more than 8 µL, conserving reagents. A limitation of the assay is that it can be used only with LpxA isozymes that have a high affinity for the TAMRA-peptide. Because the assay does not measure the catalytic activity of the enzyme, a follow-up assay is needed to ensure that active samples identified by screening actually inhibit the enzymatic activity. An LC-MS assay for the reverse reaction was described that can be used for this purpose. The LC-MS assay had a sufficient signal-to-background ratio to allow the use of as little as 250 nM UDP-3-O-(R-3-hydroxymyristoyl)-N-acetylglucosamine.
Footnotes
Acknowledgements
We wish to thank Olga Rivin for assistance with HPLC and Rong-Fang Gu for assistance with LC-MS. Cell pastes for purification of LpxA and ACP were prepared by Gary Wells and Jim Whiteaker, respectively. DNA sequencing was performed by Kathy MacCormack.
Declaration of Conflicting Interests
The authors declared no potential conflicts of interest with respect to the research, authorship, and/or publication of this article.
Funding
The authors received no financial support for the research, authorship, and/or publication of this article.
References
Supplementary Material
Please find the following supplemental material available below.
For Open Access articles published under a Creative Commons License, all supplemental material carries the same license as the article it is associated with.
For non-Open Access articles published, all supplemental material carries a non-exclusive license, and permission requests for re-use of supplemental material or any part of supplemental material shall be sent directly to the copyright owner as specified in the copyright notice associated with the article.