
Abstract
For nearly two decades mass spectrometry has been used as a label-free, direct-detection method for both functional and affinity-based screening of a wide range of therapeutically relevant target classes. Here, we present an overview of several established and emerging mass spectrometry platforms and summarize the unique strengths and performance characteristics of each as they apply to high-throughput screening. Multiple examples from the recent literature are highlighted in order to illustrate the power of each individual technique, with special emphasis given to cases where the use of mass spectrometry was found to be differentiating when compared with other detection formats. Indeed, as many of these examples will demonstrate, the inherent strengths of mass spectrometry—sensitivity, specificity, wide dynamic range, and amenability to complex matrices—can be leveraged to enhance the discriminating power and physiological relevance of assays included in screening cascades. It is our hope that this review will serve as a useful guide to readers of all backgrounds and experience levels on the applicability and benefits of mass spectrometry in the search for hits, leads, and, ultimately, drugs.
Introduction
As readers of this journal are well aware, the primary goal of high-throughput screening (HTS) is to rapidly survey a broad collection of compounds (generally numbering between tens of thousands and millions of members) and to identify those that bind to and/or modulate the activity of a therapeutic target of interest. The very nature of this task is inherently challenging given the diverse properties of the targets we seek to modulate and the compounds in HTS collections that we hope will serve as starting points for the discovery of a new drug. Indeed, addressing the difficulties that can be associated with developing assays and discriminating true hits from those generating false or misleading signals requires constant vigilance and diligence on the part of the drug-hunter. One persistent challenge is the susceptibility of assays to interferences, based alternatively on the nature of the target being screened, the detection format being employed, or a combination of both. Strategies to identify, overcome, and even avoid these interferences have been well annotated over the years,1–4 and it remains a priority for those engaged in the practice of HTS to design experimental approaches that minimize the chances of obtaining confounding results. Mass spectrometry (MS), in which biomolecules of interest are ionized and subsequently measured and recorded based on their mass-to-charge (m/z) ratios, possesses a number of characteristics that make it an advantageous technology with which to conduct HTS. Owing to its high sensitivity, specificity, and the fact that it directly interrogates the target of interest under conditions as close to native as possible, MS is generally viewed as being less susceptible than optical methods to a variety of common interferences, including compound autofluorescence, light scattering, fluorescence quenching, and inhibition of coupled enzymes. Conversely, there are some mechanisms of interference that are unique to MS that practitioners must remain aware of, including isobaric mass interference (where the mass to charge of a compound being screened overlaps with the mass to charge of an analyte) and matrix suppression (where a component present in the sample suppresses ionization of the analyte being measured). Furthermore, a review of privileged protein classes, that is, those that can be successfully modulated pharmacologically and which account for a large proportion of the molecular targets of marketed drugs,5,6 shows that many of these are accessible to HTS using MS as the analytical method, a concept that we will return to later within this review. These concepts are summarized in Figure 1 .
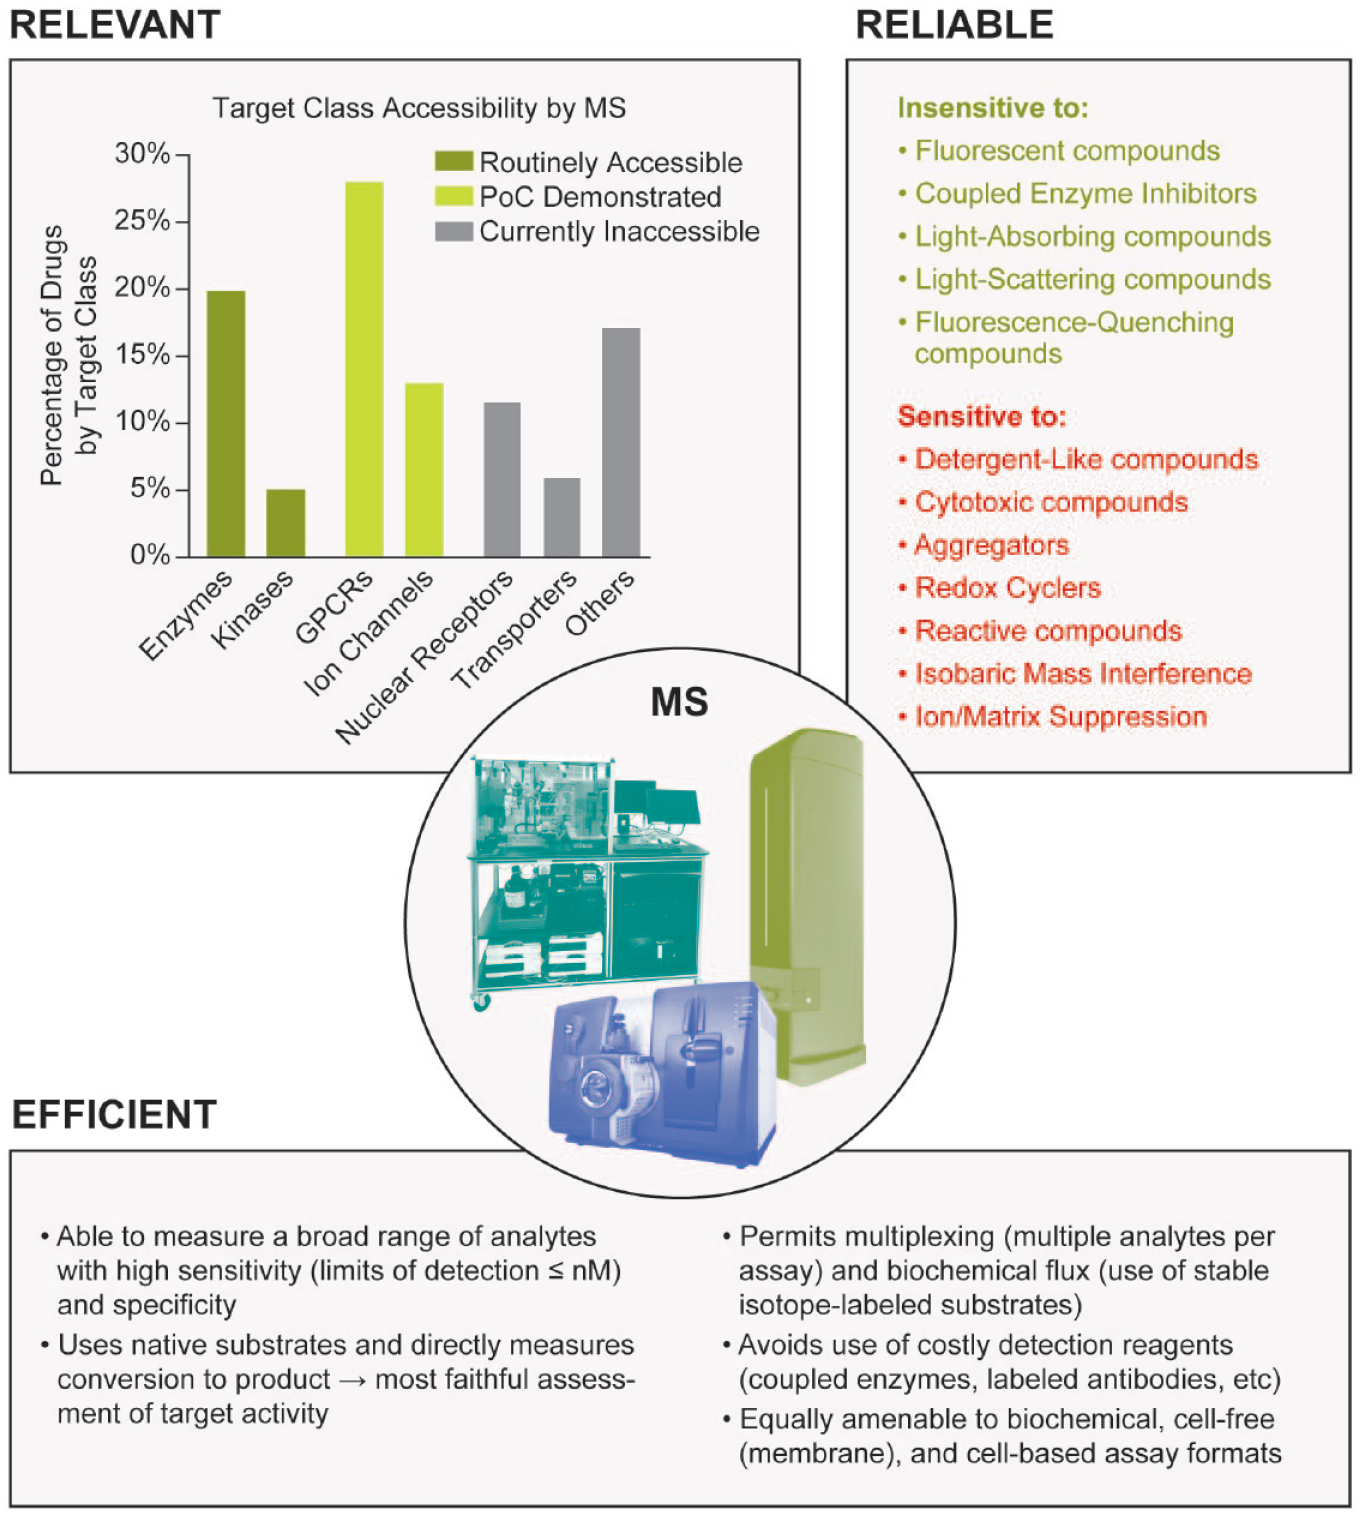
Strengths of MS for hit identification. Several privileged target classes are accessible to MS as a means for primary hit identification (data adapted from Santos et al. 6 and color-coded by target class based on the examples enumerated in this review). Furthermore, MS is insensitive to a number of interferences that can appear as false-positive or false-negative signals in other assay formats (adapted from Thorne et al. 4 ) and also possesses several inherent advantages relevant to HTS.
In light of these features, it is not surprising that MS has carved out a valuable niche among practitioners of HTS. Even so, MS is still applied in HTS campaigns less frequently than many other assay formats (e.g., fluorescence and luminescence) that interrogate similar target classes. Indeed, at the time of this writing a search for “mass spectrometry” in the title or abstract of reports published in this journal between 2010 and 2020 returned twofold fewer articles than a similar search for fluorescent techniques (inclusive of the terms “fluorescence” and “FRET”). The historical availability, broad applicability, and long track record of success for optical techniques are no doubt contributing factors to their significant representation in HTS campaigns when compared with MS. However, it is also likely that the specialized skills required for the practitioner and the relatively lower throughput of MS have also contributed to the historical underrepresentation of this technique in the HTS laboratory. Encouragingly, recent trends suggest that MS is on the rise in this discipline. Interestingly, if the same search is conducted for articles appearing in 2015 or later, MS appears slightly more frequently than fluorescence (~40 vs ~30 records retrieved). This has no doubt been driven in part by a renaissance of sorts in the technology, which has seen significant increases in throughput —up to three to six samples per second for certain MS platforms—and increasingly widespread deployment among pharmaceutical, academic, and contract research screening centers within this same time frame.
We undertook the present review in order to survey and report on the historical development and current landscape of high-throughput MS platforms and to acquaint the reader with each as they pertain to their suitability for HTS. We have aspired to address both established and emerging MS platforms, within two constraints: (1) the technique must have demonstrated sufficient throughput to process 10,000 samples per day or greater, and (2) the platform should ideally be broadly available to practitioners involved in HTS without the need for specialized adaptation or custom software solutions, that is, be either commercially available or accessible through established contract research organizations. In the sections that follow, we have attempted to summarize and compare the strengths and performance characteristics of each platform meeting these criteria, but this should in no way be construed as a recommendation for one approach over any other. Indeed, professionals practicing the disciplines of analytical chemistry and HTS recognize the need for a variety of tools with which to pursue success. As we hope the reader will come to appreciate by the end of this review, the time is certainly ripe for MS to be considered a primary tool in the arsenal of screening technologies.
Multiplexed LC-MS/MS
Since the introduction of the first commercial system three decades ago, liquid chromatography (LC)–MS has increasingly been recognized as a rapid, sensitive, and directly quantitative approach for drug discovery. For hit identification, LC-MS appeared to be particularly advantageous early on with respect to its ease of use (no special label or coupling system needed), high selectivity, reproducibility, quantitative attributes, and inherent advantages of MS as described previously for limiting susceptibility to interferences. However, the major limitation of the platform was its relatively low throughput of minutes per sample, which was not compatible with the sheer size of libraries that need to be screened for lead discovery. Modern MS instruments have very fast scanning speeds, and it was instead the time required for LC separation that posed the first and foremost limitation to achieving high throughput. Over time, LC separation has been significantly improved via advances in column chemistry, packing technology, and ultra-high-pressure pumping systems, and as a result, LC separation times have been effectively shortened from minutes with conventional high-performance LC (HPLC) to subminutes with ultra-performance LC (UPLC). With ballistic gradient approaches (or trap-and-elute mode), analysis speeds of 5–15 s per sample have become achievable. 7 Despite these significant gains in shortening the overall LC separation, there is still typically much more time spent waiting for analytes to elute from the column than is spent actually measuring the analyte(s) of interest in the MS. There is also a nontrivial amount of additional overhead time associated with each LC run, including the injection time, needle wash time, and column reequilibration time. Stated another way, the useful time for quantitation is effectively only the time when the analyte elutes from the column and is measured by the MS; all other contributions to the overall LC cycle time should be minimized to enhance throughput. Toward that goal, a variety of efforts have been pursued, including multiplexed sample introduction and parallel staggered LC.
Multiplexed sample analysis employs a mass spectrometer equipped with several ESI spray probes, with each probe connected to one LC column/separation stream. One prototype 8 was built with a four-channel multiplexed electrospray interface to the mass spectrometer ( Fig. 2A ), effectively improving the throughput by fourfold compared with the conventional single LC stream approach. To overcome the limitation of the relatively slow scanning speed on triple quadrupole instruments at the time, a time-of-flight (ToF) mass spectrometer was employed to achieve fast scanning speeds and enable full-scan profile acquisition of the chromatographic peaks from the four parallel LC streams. Other researchers tried more highly condensed sprayer designs 9 (up to eight channels) and with very precise control, equivalent sensitivities to individual channels (within 10% error) were demonstrated. Despite the advantage that these multiple sprayer approaches conferred with regard to throughput, the main challenge with the fundamental design was the potential for crosstalk to occur between different sprayers. It was not easy to achieve robust and consistent MS detection from each individual LC inlet without the acquisition being compromised by the adjacent sprayer(s).
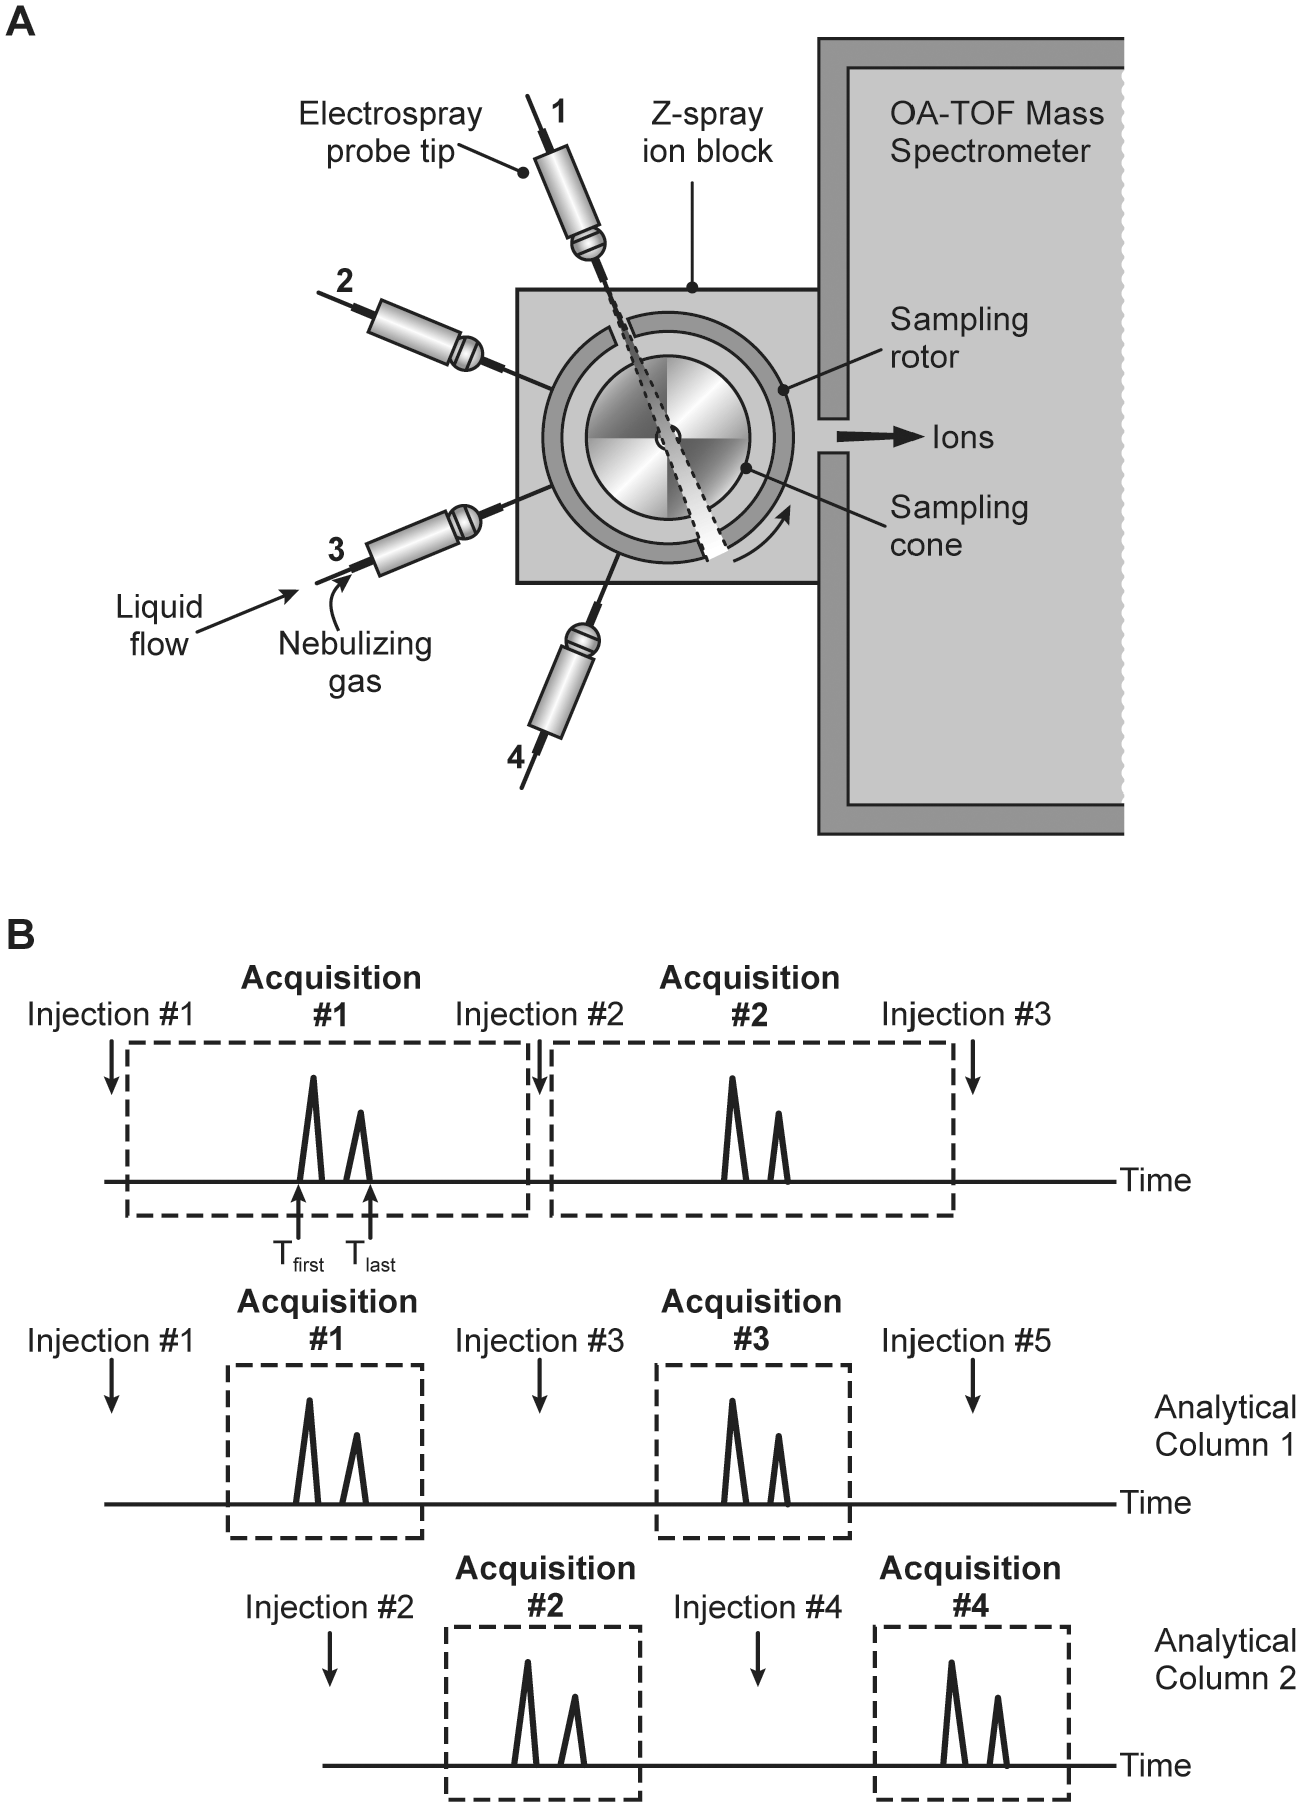
Illustration of different approaches of multistream LC-MS. (
A different approach to multiplexing, parallel staggered LC, capitalizes on the same fundamental strategy of pairing multiple LC streams with a single mass spectrometer but does so without the need for multiple sprayers. In the parallel staggered approach, the same gradient and column are used on multiple LC lines, but the injection times are staggered such that the outflow from individual columns can be directed by a valve controller to a single mass spectrometer at different times. Effectively, only the narrow chromatographic window of interest from each individual column is acquired, and the remaining void time can be directed to waste while the analytes from another stream are captured; in this fashion, the duty cycle of the mass spectrometer is maximized. 10 Depending on the relative elution window versus total gradient time required for analysis, multiple LC streams can be staggered. 11 However, due to the advancements in fast separation with UPLC or on-line solid-phase extraction (SPE), and the need to balance complexity with the robustness of the hardware, the most common approach involves the staggering of two separate LC streams only. Several groups have developed two-stream systems, and several instruments have been commercialized that are widely used in the pharmaceutical industry. For example, researchers at Pfizer have developed and implemented three generations of such instruments over the past two decades. The first-generation instrument was a homemade dual-arm auto sampler (DAAS) 7 and featured two independent arms, each capable of delivering samples into short, individual 5 mm trap columns running in on-line SPE mode. Cycle times were 30 s per stream or 15 s total when staggered. Also featured with DAAS was homemade data reviewing software that enabled data processing of 3840 samples (10 × 384-well plates) within <30 min. The second-generation system, Apricot Designs Dual Arm Autosampler (ADDA)12,13 was commercialized in 2010. The major advancement over DAAS was the addition of fast-gradient UPLC capability in addition to the on-line SPE mode, as well as fast multiple reaction monitoring (MRM) method-building capability on the same instrument. The latest model, LeadScape-1 (LS-1), 14 was introduced in 2016 and is capable of multiplexing dual-stream LC separations with a single autosampler arm instead of the dual-arm configuration. In addition, microflow LC capability was introduced to meet the higher demands of separation with complex matrices. The evolution of this platform over time is represented in Supplemental Figure S1 . An analogous, staggered LC system was also introduced by Cohesive and later rebranded as the Thermo Fisher Transcend LC-MS system.
Both the multiplexed and parallel staggered LC approaches have successfully been used in HTS campaigns. In one report, Roddy et al. applied both techniques to screen 175,000 compounds in a search for inhibitors of lipid synthesis. 15 While the multiplexed approach provided a slight edge in throughput over parallel staggered LC, with per-sample analysis times of 18 versus 22.5 s, respectively, it also suffered from lower signal-to-background ratio (S/B), being approximately eightfold less sensitive for the analyte studied. Assays developed on either platform were reported to be quite robust, with average Z′ values >0.7. In a separate report, the same group conducted an HTS of 800,000 compounds against the enzyme diacylglycerol acyltransferase 1 using the multiplexed approach with four parallel sprayers. 16 In order to achieve the required throughput for a screen of this size, the authors also utilized a cassette approach where compounds were screened in pools of 10; each compound was present in two separate pools on the same plate and was only considered a hit if it was found to be active in both pools. In this fashion, the primary HTS was successfully conducted over a period of 8 weeks using two instruments with typical Z′ values between 0.7 and 0.8 on individual plates. While these examples clearly highlight the capability of high-throughput LC-MS systems for large-scale primary HTS, the platforms have generally found wider application for approaches that involve smaller, focused libraries or as an orthogonal means to triage hits from higher-throughput assays. As one example, Choudhary et al. used their ADDA LC-MS platform to support a functional screen in searching for modulators of choline transporter (CHT). 17 A specially curated chemogenomic library was used for the primary screen, and additional dose–response follow-up assays were successfully carried out.
RapidFire-MS
The RapidFire system, first described in 2004, 18 combines in-line SPE sample preparation with flow injection analysis by MS. Early publications on the platform describe in detail the careful consideration given to all aspects of the instrumental design, including the rapid autosampler, SPE cartridge volume and packing material, optimization of the flow path to minimize dead volume and carryover, and fast-actuating rotary valves to maintain a stable spray in the source of the mass spectrometer.19–21 Each of these innovations plays an important part in a carefully choreographed and robust sample introduction process. Typically, sample is directly aspirated from 96- or 384-well plates into a sample loop for 500 ms, subsequently flushed onto the SPE cartridge and desalted for approximately 3 s using a weak mobile phase flowing at a rate of ~1.25 mL/min, and ultimately eluted with a strong mobile phase flowing at a rate of up to ~1 mL/min for an additional 3+ s. This allows cycle times on the order of 6–10 s per sample and total analysis times <1 h per 384-well plate to be routinely achieved.
The impressive speed of the RapidFire platform has made it a very attractive approach for accessing the sensitivity, selectivity, and specificity of MS on a timescale that is compatible with HTS. Indeed, several reports have demonstrated the ability of RapidFire to serve as a robust platform for primary screening. Hutchinson and colleagues screened a collection of more than 100,000 compounds against the histone lysine demethylase JMJD2C in 10 days using two instruments. 22 The assay performed well over the course of the screen, yielding a mean Z′ value of 0.81 and a hit rate of 1.7%. It is notable that a screen against the related enzyme JMJD2E using a fluorescent, coupled assay yielded a substantially higher hit rate of 10.7%, only for it to be later determined that >90% of the hits identified were false positives arising from compound autofluorescence. Leveridge et al. performed a comparable screen (>100,000 compounds in ~2 weeks on two instruments) against the LRRK2 enzyme and successfully identified a number of validated chemotypes among the hits. 23 RapidFire has also been applied to the primary screening of libraries as large as 500,000 compounds, with concurrent reports detailing successful campaigns to identify inhibitors of S-adenosylhomocysteine hydrolase (AHCY) 24 and poly(ADP-ribose) polymerase (PARP14). 25 In both cases, selected hits identified in the primary RapidFire assays were successfully co-crystalized and x-ray structures were solved, confirming substrate-competitive modes of interaction with the enzymes.
A number of novel ways to accelerate primary screening using the RapidFire platform have also been demonstrated. In an early example, Langsdorf et al. pooled compounds in orthogonal mixtures and successfully screened 700,000 compounds against the enzyme UDP-3-O-(R-3-hydroxymyristoyl)-N-acetylglucosamine deacetylase (LpxC), which is involved in the synthesis of the outer membrane of gram-negative bacteria. 26 Prior to the screen, compounds were combined in pools of eight, with each individual member being present at a concentration of 2 µg/mL in two different, unique pools on the same source plate. Compounds were considered to be true primary hits if the percent inhibition of the enzyme observed was >50% in both pools in which the compound was present; compounds crossing this threshold in only one out of the two pools were considered false positives. Although this strategy allowed the authors to rapidly complete the primary screen, they did note that the pooling strategy led to an apparent reduction of overall enzyme activity across all plates. On average, the enzyme activity in wells containing pools of inactive compounds was 13% lower than in uninhibited controls. The authors ascribed this observation to the possibility for multiple compound–compound or compound–protein interactions to occur within the pools, which may have affected enzyme activity, but also allowed for the possibility of increased ion suppression on the analyte signal due to the higher concentration of organic compounds. Another unique approach to increasing assay throughput, pioneered by Leveridge et al. in 2014, uses a multiplexing strategy where samples from separate reactions employing mass-encoded substrates are pooled together before analysis. 28 Using the enzyme JmjD2d H3K9Me3 demethylase as a model system, the authors evaluated seven different peptide substrates, each of which possessed a unique mass due to differences in amino acid sequence. Four substrates were ultimately selected based on a variety of factors, including non-overlap in m/z for the pseudotransitions. The authors developed assays for both single and pooled-reaction samples and tested 110 known inhibitors of the enzyme in each format. The correlation between pIC50 values was found to be 0.98, demonstrating nearly identical performance between the two approaches. Thus, by running reactions on separate plates with four different substrates and then pooling these together prior to analysis, the authors were able to achieve a fourfold increase in throughput thanks to the mass-discriminating power of the platform. A variation on this same multiplexing approach was subsequently employed by McManus et al. to screen for inhibitors of CD73, which promotes the conversion of adenine phosphates to adenosine and contributes to an immunosuppressive environment in tumor cells. 28 Here, the authors used four different stable isotope-labeled versions of adenine monophosphate as substrates and then pooled the quenched, mass-encoded reactions together prior to RapidFire analysis. Not only did they successfully complete a screen of a 762,400-member library using this approach, but they also demonstrated that the RapidFire assay was superior to other detection formats, including luminescence, absorbance, and Transcreener, in a variety of ways. Importantly, the authors found that only the mass spectrometry-based method had sufficient sensitivity to run the enzymatic reactions near Km for the AMP substrate, and they also demonstrated that the approach of using stable isotope-labeled substrate was directly extensible from their biochemical assay format to measuring the activity of the enzyme in a cellular context as well (a concept to which we will return shortly).
Recently, Bretschneider et al. described a new RapidFire assay format with increased throughput, which they term “BLAZE-mode.” 29 In this format, the typical SPE cartridge is omitted, converting the RapidFire to a direct, flow-injection system. Notably, this adaptation can be made quite simply on any existing RapidFire instrument without the need for extensive modification or specialized software and allows throughputs of 2.5 s per sample to be achieved and a 384-well plate to be analyzed in just 16 min. In their report, the authors demonstrated the applicability of BLAZE-mode to measure IC50 values for a panel of 81 compounds known to inhibit the bacterial conversion of choline to trimethylamine (TMA) and to perform primary screening for autotaxin inhibitors. In each case, the data acquired in BLAZE-mode compared very well to data collected using standard RapidFire assays but enabled significantly higher throughputs. Other approaches to achieving efficiency gains in primary screening by RapidFire have also been reported wherein the throughput of the analysis is not improved, but the screening set is curated and focused to achieve a desirable hit rate with a smaller library. Such approaches were found to be successful for identifying inhibitors of lysine-specific demethylase 1 starting from a 56,000-member library and performing subsequent rounds of iterative screening, 30 as well as inhibitors of arginase II via a high-concentration screen of an 18,000-member fragment library. 31
RapidFire has also found broad application as a means for confirming the activity of hits identified using more conventional primary screening approaches, such as fluorescence intensity (FLINT), time-resolved or standard fluorescence resonance energy transfer (FRET), luminescence, and AlphaScreen. Indeed, multiple examples of where RapidFire-MS was successfully employed to triage hits from light-based primary screens have been published and uniformly confirm the power of the approach to quickly eliminate false positives. These examples span a range of therapeutically relevant targets, including prostaglandin E synthase, 32 HIV-1 protease, 33 Elovl6, 34 and isocitrate dehydrogenase 1, 35 and highlight the ability of the RapidFire platform to reduce false-positive rates by as much as 83%. In a very comprehensive study, Adam et al. applied RapidFire as a confirmatory technique to validate hits from primary screening campaigns against four different proteases. 36 Each individual target was first screened against a sample collection containing more than 106 compounds using optical techniques including TR-FRET, FRET, or luminescence, and the hits identified were subsequently evaluated using novel RapidFire assays developed for each target. Despite excellent technical performance of the primary light-based assays (Z′ > 0.75), in each case a high proportion of the initial hits were ultimately determined to be false positives, with <20% being confirmed by RapidFire. This power of MS to eliminate signal artifacts was nicely summarized in the original report and has been reproduced here as Supplemental Figure S2 . While these and other examples highlight that MS is insensitive to many sources of interference that complicate light-based assays, it must be noted that it is susceptible to others. In an interesting example, Lowe et al. screened 78,000 compounds against the enzyme kynurenine 3-monooxygenase (KMO) using a RapidFire–MS assay and reported a cluster of 13 hits (out of a total of 608) that were later determined to be false positives. 37 As is often done in RapidFire assays, the data collected during the primary screen were reported as the ratio of product peak area (P) divided by the sum of product and substrate peak areas (P + S), which approximates percent conversion. The 13 false-positive hits happened to share the same nominal mass as the substrate kynurenine and to also share the same product ion fragment. This had the effect of artificially inflating the denominator in the commonly used (P/P + S) equation and simulating inhibition of the enzyme. While this is an interesting case of compound interference specific to MS, it was relatively simple to triage by comparing the product-only peak area to uninhibited controls and required no reanalysis of samples.
Finally, there have also been multiple reports where RapidFire assays have been successfully adapted to enable screening of highly complex samples, including cells,38,39 plasma, and whole blood. 40 In a particularly interesting example, Bretschneider et al. demonstrated the ability to measure the activity of autotaxin, an enzyme that catalyzes the hydrolysis of lysophosphatidylcholines into lysophosphatidic acids, and which is believed to play a pathophysiological role in the development of diseases such as cancer, fibrosis, arthritis, and multiple sclerosis. In this report, a single RapidFire method that monitored the conversion of multiple endogenous phosphatidylcholines to their corresponding lysophosphatidic acids was used to quantify autotaxin activity in vitro using recombinant protein, ex vivo in whole blood, or in vivo from plasma. 41 As part of their analytical approach to handle samples covering this range of complexity, the authors described an elegant, in-well sample partitioning strategy where the lipids of interest were extracted from the aqueous biological samples into an immiscible butanol phase. Due to its lower density, the butanol floats on top of the aqueous sample, and this allowed the lipid-containing organic phase to be selectively aspirated into the RapidFire sample loop by adjusting the height of autosampler. This approach allowed the authors to reduce the salt content in the samples, permitting retention of the polar lipids on a HILIC cartridge while simultaneously achieving good peak shapes and robust performance (Z′ = 0.7–0.85). Importantly, the authors also demonstrated that the IC50 values determined from the ex vivo whole-blood assay were predictive of the levels of inhibition achieved in their rat in vivo model. This is notable because it provides additional experimental evidence for two important concepts: (1) that MS methods developed for in vitro screening can also be applied to efforts later in the drug discovery process, for example, to support ex vivo and in vivo pharmacodynamic assays, and (2) that measurement of native substrate conversion by MS in vitro can allow for stronger in vitro–in vivo correlations to be developed, ultimately identifying ligands with greater translational value.
Acoustic Sample Introduction Coupled with MS
Acoustic manipulation, in which pulses of high-frequency sound waves are used to create movement within a fluid, has recently been harnessed as a way to directly introduce liquid samples into a mass spectrometer for high-throughput analysis. To date, two separate approaches have been taken to generate droplets from these acoustically manipulated samples: acoustic mist ionization (AMI) and acoustic droplet ejection into an open port interface (ADE-OPI). In both techniques, the ionization process is remarkably soft, imparting little to no energy to the ions and resulting in higher charge states than atmospheric pressure chemical ionization (APCI), where gas-phase collisions form ions.
AMI is a novel technique pioneered by a collaboration between AstraZeneca, Labcyte, and Waters.42–46 AMI can be described as the combination of ADE and field-induced droplet ionization (FIDI), a process where strong electric fields induce charge on neutral parent droplets. 47 The fluid sample in the wells of a microplate is conditioned in preparation for acoustic ejection; centrifugation stabilizes the fluid meniscus and deionization eliminates static charge on the microplate plastic. A high voltage applied to a charging nozzle aligned to the source well applies an electric field that induces charge at the fluid surface. The electric field strength of ~2 × 10⁵ is well below the critical field for the formation of a Taylor cone in ESI. As in standard ADE (see below), focused ultrasound perturbs the quiescent fluid surface to form a fluid mound when a precisely timed high-power acoustic pulse generates a burst of droplets at the apex of the mound with a typical droplet diameter distribution full width at half maximum of 4 µm and a mean droplet diameter of 5 µm. At the typical repetition rate of 1400 Hz (mist bursts per second), the mist volume flow rate is 2.1 µL/min. These charged mist droplets initially fly upward with an average initial velocity near 2 m/s, carrying some of the charge from the meniscus. Trajectories are initially determined by the external electric field and space charge effects. The AMI transfer line operates with a continuous flow of ambient air and the nozzle closely spaced above the microplate to aspirate mist droplets exiting the microplate via airflow entrainment and transfer these to the MS inlet. This process is illustrated schematically in Supplemental Figure S3 , alongside an annotated photograph of the instrument itself. The heated AMI transfer line evaporates solvent and droplets shrink. As in conventional ESI, when surface charge overcomes surface tension, droplet fission produces multiple progeny droplets, ultimately yielding residual charged analyte that enters the MS detector. In contrast to ESI, uncharged mist droplets will form in the absence of an electric field because the acoustic power is sufficient for droplet generation. With the high voltage turned off in conventional ESI, there is no Taylor cone and thus no generation of droplets.
The suitability of AMI-MS for high-throughput analysis was first described by Sinclair et al., where sample acquisition rates approaching 3 Hz were demonstrated on standard samples and this allowed for up to 10,000 data points to be collected per hour. 45 Subsequently, this same technique was used to conduct an HTS campaign on more than 2 million compounds searching for inhibitors of histone deacetylase. 43 Over the course of that campaign, the authors demonstrated that they were able to process 100,000 samples per day with good performance of the assay, exemplified by a robust mean Z′ value >0.6 across more than 7000 plates. The HTS yielded a primary hit rate of ~0.3% with a high confirmation rate (77%) when hits were evaluated in concentration–response. More recently, Belov et al. developed an HTS-compatible assay that measures inhibition of histone acetyltransferase activity. 48 The authors developed an AMI-MS assay using a 21-amino-acid peptide substrate derived from the human histone H3 protein and used this to screen 43,742 compounds at a single concentration. In their report, Belov et al. noted that optimization of the buffer and quench solution compositions were effective at mitigating the effects of ion suppression, and indeed this careful buffer engineering yielded a 40-fold improvement in limit of detection for the acetylated peptide and internal standard relative to the starting conditions without any change in enzymatic activity. With this sensitivity improvement, starting reagent concentrations were identical to those of a previously developed RapidFire–MS assay. The label-free AMI-MS assay was found to yield a lower hit rate and a threefold lower cost per well in comparison with a labeled scintillation proximity assay (SPA) readout. The average Z′ value for the AMI-MS experiments was 0.66, compared with 0.74 for the SPA assay. Though the two assay platforms were not found to have completely overlapping coverage, there were 193 hits common to both assays (~55%), with a majority being robust hits at pIC50 >5. Concordance between pIC50 values determined by SPA and AMI-MS was found to be 91% for 141 compounds, and the values determined by AMI-MS also correlated well with pIC50 values determined by RapidFire–MS (R2 = 0.896 for 100 compounds). This demonstrates that AMI-MS is compatible with the demands of a large-format HTS, with the caveat that direct injection without sample cleanup demands careful engineering of buffer composition during assay development.
Distinct from AMI, the process of ADE forms discrete, nanoliter-sized droplets in the time span of microseconds. 49 Starting with a quiescent fluid surface at the meniscus of a microplate source well, acoustic pressure from a focused beam of ultrasound generates a mound. When there is sufficient acoustic power, a droplet will pinch off the mound and fly to the target. The mound relaxes after droplet ejection, generating capillary waves on the fluid surface, and after a brief delay, this entire process can repeat to generate a train of ultra-monodisperse droplets. The frequency of droplet ejection, known as the repetition rate, determines the volume flow rate for ADE (typically in the range of 15–75 µL/min for 2.5 nL droplets with a diameter of 168 µm and repetition rates in the range of 100–500 Hz). This droplet generation approach has recently been harnessed as a distinct way to introduce sample into a mass spectrometer, via an OPI. 50 Termed ADE-OPI-MS, this approach has been used for various drug discovery assays, including HTS, 51 high-throughput ADME, 52 bioanalysis, 51 synthetic medicinal chemistry, 53 and compound quality control (QC). 54 The OPI acts as a bridge carrying acoustically ejected droplets to a standard electrospray ionization–mass spectrometer. 55 In contrast to AMI, this system utilizes conventional ADE with precisely controlled nanoliter volume droplets, as commercialized in Echo and ATS systems for compound management. Droplets are ejected into the capture region of the OPI aligned above the sample plate, as shown in Figure 3 . The nebulizer gas of the standard ESI ion source creates a Venturi aspiration force through the ESI electrode, which is connected to the transfer capillary. A continuous flow of carrier solvent is delivered through the tubing annulus to the capture region and then aspirated to the ESI ion source for MS detection. The flow rate of the carrier solvent is optimized to balance the aspiration into the transfer capillary, generating a stable vortex in the capture region.
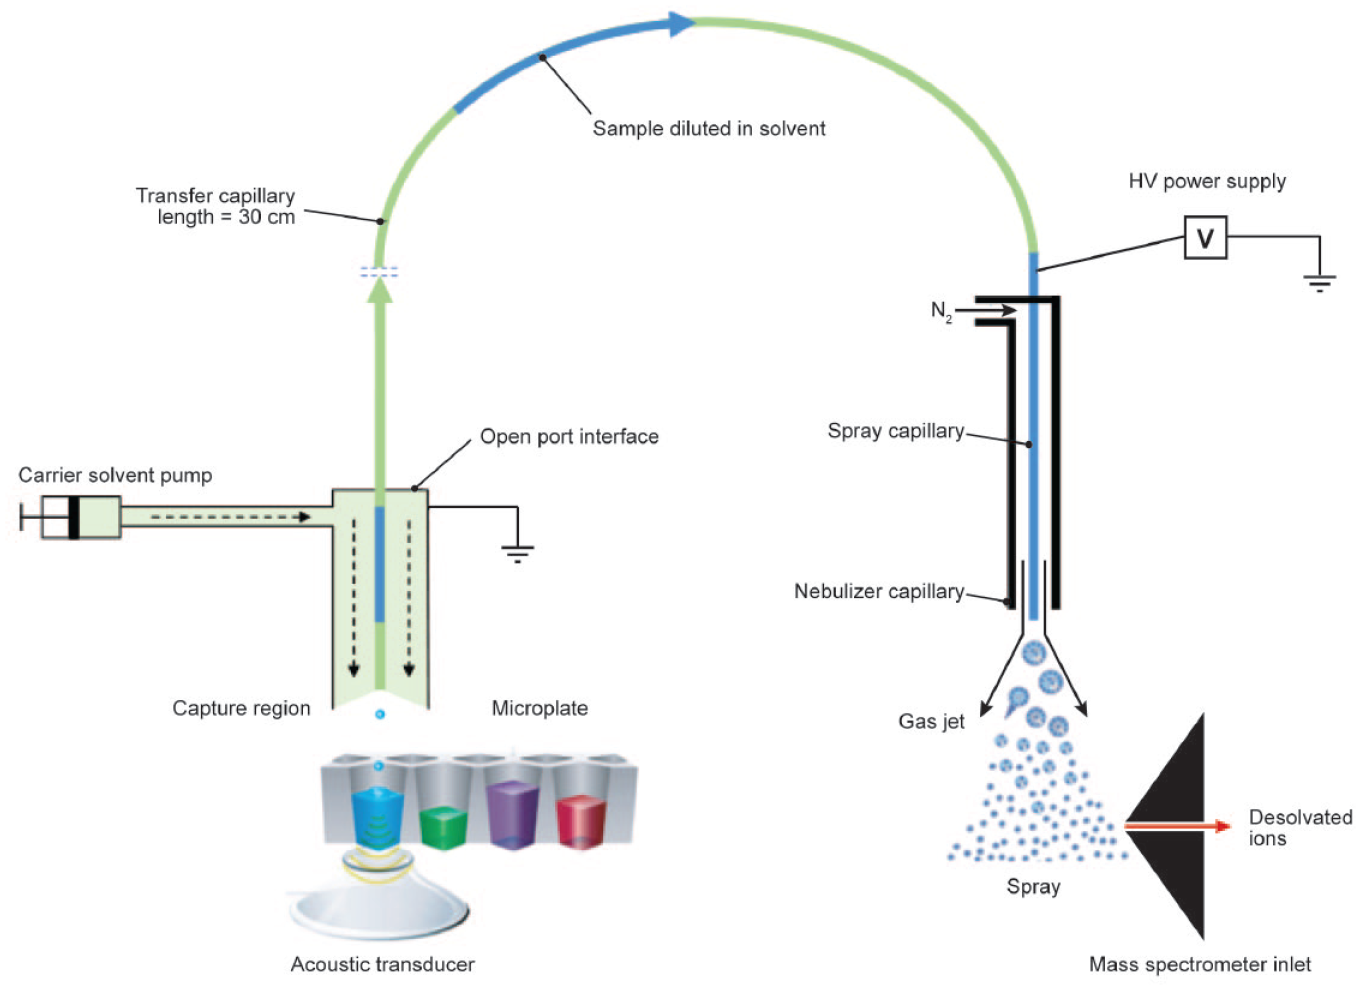
Schematic of an ADE-OPI-MS system. A pulse of acoustic energy ejects sample droplets (2.5 nL) upward at a velocity of 1 m/s into the inverted OPI. A fluid pump delivers carrier solvent (200–500 µL/min) to a sample capture region that has a flow-stabilized vortex interface; sample is captured and diluted into a vortex of flowing carrier solvent. A high-voltage (HV) supply and nebulizing gas (nitrogen or air) at the spray capillary drive conventional ESI.
The OPI separates sampling from ionization, yielding benefits such as high sampling speed, less sample preparation, high reproducibility, good sensitivity, and the wide compound coverage of conventional ESI. 51 Analytical throughputs of up to three samples per second for a single analyte and six samples per second when quantifying different target analytes from adjacent wells have been reported. 56 In both cases, reproducibility was reported to be better than 8% for the whole-plate coefficient of variation (CV) of the raw peak area without an internal standard for signal normalization. With sample volumes in the nanoliter range, the absolute sensitivity is not as high as in conventional LC-MS, which operates in the microliter range. However, the low nanomolar lower limits of quantitation (LLOQs) typically reported for ADE-OPI-MS and the more than three orders of magnitude linear dynamic range that can be achieved without an internal standard are sufficient to meet the requirements of most in vitro assays. 52 With touchless ADE and a continuous flow of carrier solvent in the OPI, carryover between samples is not observed. A significant feature of the ADE-OPI-MS system is the tolerance for complex matrices. Nanoliter-level sampling and significant dilution of the sample matrix (~1000-fold) within the OPI capture zone before ionization mitigate ionization suppression for many complex matrices. The ADE-OPI-MS system has been demonstrated for direct analysis of samples containing detergent, high protein/salts, and untreated biological samples such as plasma and urine.51,57 This feature simplifies the sample preparation workflow, and buffer engineering is typically not required.
In 2018, Zhang reported two examples illustrating the utility of ADE-OPI-MS for hit identification, a peptide-based demethylase assay and an acetyltransferase assay.58,59 Both substrate and product were monitored simultaneously by direct ejection without sample preparation. Robust Z′ values of 0.72 and 0.84 were reported for the two assays, respectively, and the EC50 values determined by ADE-OPI-MS were found to be in good concordance with those determined by LC-MS. Prior to the hit identification campaign for the acetyltransferase assay, the ADE-OPI-MS system was used to study reaction kinetics for optimization of assay conditions. Using an in situ kinetics workflow in which the samples were ejected at different time points from the same well while the reaction occurred, full kinetic information for different enzyme and substrate concentrations could be read on the fly, allowing the authors to determine Km and Vmax for the assay. 57 As part of these explorations, the authors reported that the ADE-OPI-MS system was found to be more than 10 times faster and to consume 1000-fold less sample than both parallel LC-MS and RapidFire–MS while simplifying sample preparation and method development. The authors also demonstrated the compatibility of ADE-OPI-MS with the 1536-well microplate format. Samples in a standard 1536-well plate can be directly ejected acoustically and quantitively captured by OPI for high-throughput MS analysis. In addition to these biochemical assays, Hua and colleagues have also reported on the application of the ADE-OPI-MS platform to a cell-based CHT assay. 60 In that application, the sample in the cellular matrix was directly analyzed without any sample preparation. No ionization suppression was observed, as demonstrated by overlapping standard curves in buffer and cell matrix, without the use of an internal standard for normalization.
More recently, Wen and colleagues reported on their characterization of an ADE-OPI-MS system for the identification of diacylglycerol O-acyltransferase 2 (DGAT2) inhibitors and compared the results to those of the orthogonal fluorescent and LC-MS assay formats. 61 The initial effort utilizing ADE-OPI-MS for the assay suffered from a stability challenge where the triglyceride reaction product nonspecifically adsorbed to the well plate surface. To address this issue, the authors developed an in-well liquid–liquid extraction (LLE) method, adding a pentanol layer on top of the aqueous sample solution. In this manner, the target analyte was able to be extracted into the immiscible pentanol phase, which was followed by direct acoustic ejection to the OPI-MS. This LLE approach was reported to resolve the stability issue and to also clean up the sample matrix. The ADE-OPI-MS system was used for a single-concentration screen of 6400 compounds across forty 384-well plates. The authors reported a robust, mean Z′ value of 0.69, together with a 30-fold signal window over the course of that effort. Interestingly, the ADE-OPI-MS method was found to generate a higher primary hit rate when compared with the fluorescent assay format. Though the explicit reason for this higher hit rate is not known, it was noted that differences in plate density (384 wells for the ADE-OPI-MS assay vs 1536 wells for the fluorescent assay) and the presence of phospholipid liposomes in the substrate formulation for the fluorescent assay represent important differences that may have been contributing factors specific to this study. When the IC50 values for 40 compounds were analyzed using the ADE-OPI-MS method, the authors found that the data correlated very well with data generated in an LC-MS assay (R2 = 0.82), but with the advantage of more than a 10-fold improvement in throughput.
Both AMI-MS and ADE-OPI-MS represent exciting new developments in the field of MS. Though the platforms share some outward similarities in the use of acoustic power to transfer samples to the MS, subtle differences in how practitioners should approach the development and execution of assays for HTS can be gleaned from the reports made to date: (1) It has been observed that matrix ion suppression can be severe with AMI, and direct ejection without a separation or dilution step can require buffer engineering. (2) The variability of the raw ion signal is typically higher with AMI when compared with the ESI process of ADE-OPI-MS, ranging up to 40%. Nonetheless, this can be effectively addressed with ratiometric analysis utilizing internal standards, in which case the CV is typically in the 10% range. In contrast, the variability of the raw ion signal with ADE-OPI-MS is typically better than 10%, offering the analyst a choice of whether to make use of an internal standard or not. This is due to the inherent accuracy and precision of ADE technology working with mature and robust ESI technology. (3) The high temperature (~300 °C) and atmospheric pressure within the AMI transfer line lead to in-source collision-induced dissociation. Analytes are subject to fragmentation, and thus analyte coverage ranges from small molecules up to approximately 20 kDa. Soft ionization in the conventional ESI of ADE-OPI-MS provides analyte coverage ranging all the way up to intact antibodies at 150 kDa. (4) ADE-OPI-MS is compatible with both 384-well and 1536-well microplates because this approach utilizes robust, commercialized 2.5 nL droplet ADE technology, whereas AMI-MS is currently constrained to 384-well microplates fundamentally because mist droplet generation and droplet charging are combined into a single step.
Maldi-Ms
The technique of matrix-assisted laser desorption ionization (MALDI) was originally developed by Karas et al. in 1985, 62 and since then, it has been widely applied to the analysis of a variety of molecules. The basic process driving MALDI is co-crystallization of sample with a suitable matrix, which then serves to absorb laser energy and transfer it to the analyte molecules. The fundamental ionization mechanism is desorption, followed by ionization via proton transfer reaction between analytes and the matrix ( Fig. 4 ). MALDI is a soft ionization technique generating predominantly intact, singly charged molecules that makes identification of analytes straightforward. Additionally, it is suitable for analyzing molecules spanning a wide mass range, from quite small (~100 Da) up to very large (~500 kDa), and a range of biological matrices, from simple biochemical reactions to imaging of tissue samples. While compatible with a variety of mass analyzers, MALDI is most often coupled with ToF-MS, and in this case, the ionized analyte and matrix molecules are accelerated in the ToF region by an electric field. In the field-free drift region of the ToF tube, ions are separated according to their m/z ratio and mass is determined by the ToF to a detector.
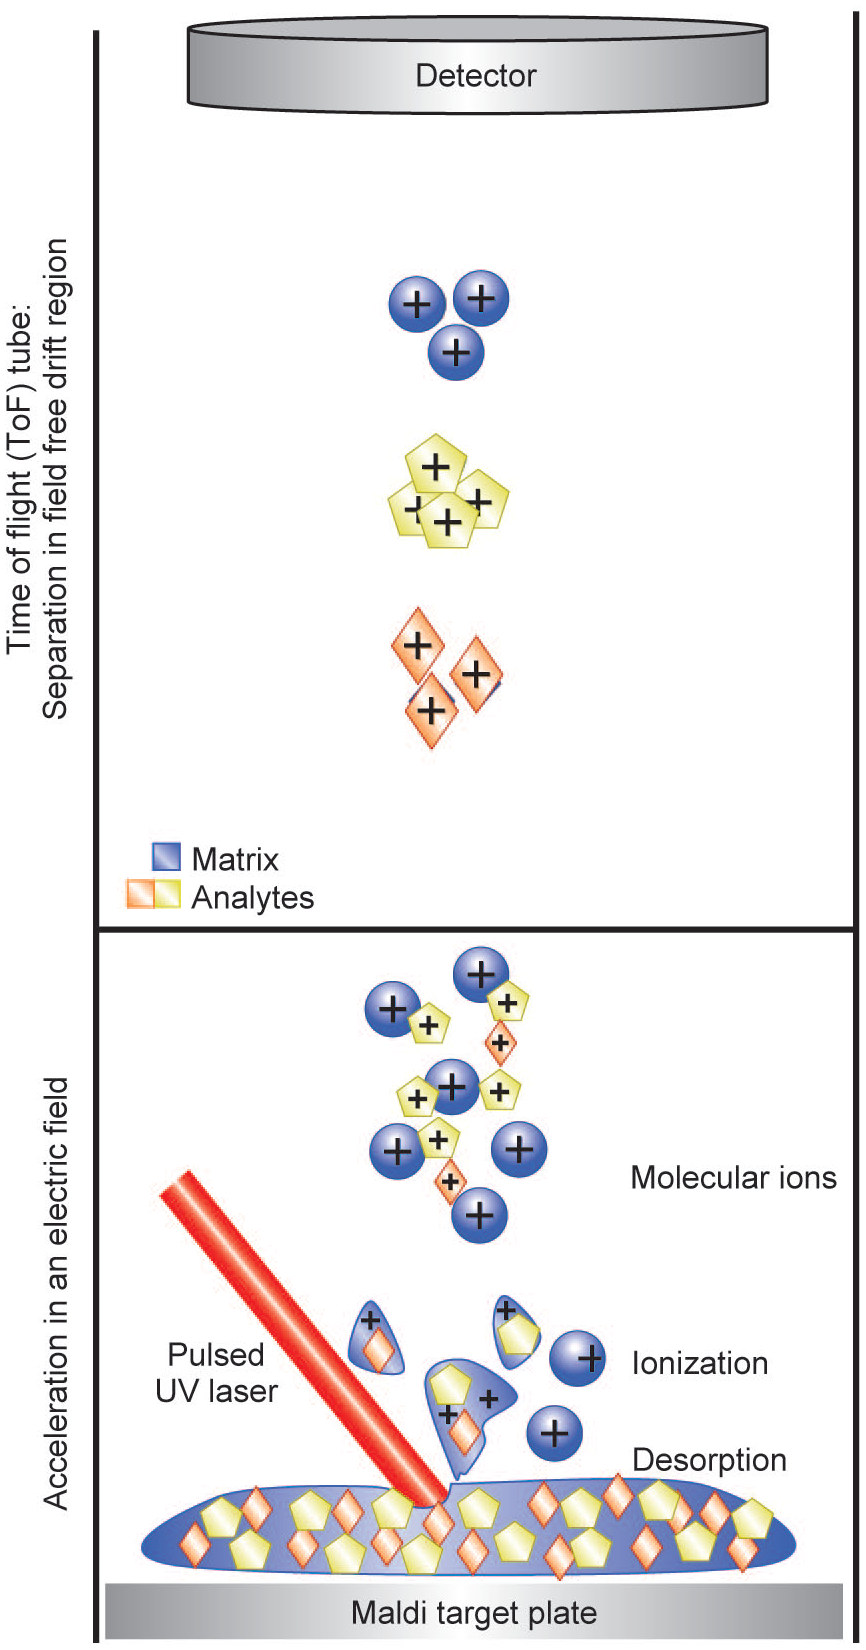
Schematic representation of the MALDI process. Sample is co-crystallized with a suitable matrix that then serves to absorb laser energy and transfer it to the analyte molecules. The fundamental mechanism is desorption followed by ionization via a proton transfer reaction between analytes and the matrix.
Multiple groups have evaluated the suitability of the technique for monitoring enzyme activity by direct measurement of substrate and its conversion to product. In one of the earliest reports, Hsieh et al. showed the utility of MALDI-ToF for simultaneously identifying molecules with activity against multiple enzyme targets, including the angiotensin-converting enzyme (ACE), N-myristoyltransferase (NMT), and protein tyrosine phosphatase (PTP).
63
In their report, the authors prepared ~4000 samples in a single 4.5 × 4.5 cm MALDI plate, with a data acquisition time of 10 s per sample. Bungert et al. demonstrated the applicability of MALDI-ToF for monitoring glucose oxidase-catalyzed conversion of glucose to gluconolactone, as well as cleavage of hippuryl-
In the period that followed these initial publications, a number of foundational studies were performed that illustrated the potential of MALDI for truly high-throughput analysis. Zovo et al. established a MALDI-MS assay screening for inhibitors of amyloid-β peptide (Aβ) aggregation by monitoring the loss of Aβ42 monomer from the solution. 67 The authors tested 80 known inhibitors of Aβ aggregation and compared the results against a well-established thioflavin (ThT) assay. They identified several false-positive responses in the ThT assay, confirming other studies that reported that compounds such as curcumin and quercetin can interfere with ThT binding and fluorescence. For compounds such as these, the IC50 values reported in the ThT assay were significantly more potent than those measured in the MALDI assay, leading to low confirmation rates. For compounds that did not interfere with ThT binding and fluorescence, the MALDI-MS assay yielded comparable apparent IC50 values. While this study did not look at large numbers of compounds, it is another nice demonstration of the utility of MS-based assays to find compounds with bona fide activity against their target mechanism. Separately, Manna et al. reported significant improvements in assay throughput utilizing MALDI-MS (~6 h) when compared with LC-MS/MS analysis, which took >3 days. 68 In this study, they derivatized prostaglandins with positively charged hydrazines, resulting in hydrazones that were quantified by MALDI-MS. In a recombinant murine COX-2 (mCOX-2) inhibitor assay, the ability of COX-2 to oxygenate arachidonic acid (AA) and 2-arichidonoylglycerol (2-AG) to PGE2 or PGE2-G was measured. The IC50 values obtained using the label-free MALDI-MS/MS assay were comparable to a gold standard, radioactive 14C-TLC method. Lastly, Chin et al. demonstrated the utility of MALDI-MS for high-throughput QC of compound libraries. 69 In their report, the authors took advantage of acoustic transfer of matrix and library compounds onto a glass slide that was subsequently analyzed by MALDI-MS at <1 s per sample. This approach allows for the potential to deposit samples from four 1536 plates onto a single glass slide, with up to four glass slides fitting onto a single MALDI target carrier. In this fashion, the authors proposed that up to ~25,000 compounds could be checked for quality during a typical working day.
While the studies described above clearly illustrated the potential of MALDI-MS for HTS, they either relied on high sample volumes in nonstandard formats or used the relatively low-density 96- or 384-well format with only a small number of compounds tested. Extending the applicability of MALDI-MS, Heap et al. described a screen utilizing 2648 compounds from a small-molecule kinase library to identify inhibitors of salt-inducible kinase (SIK). 70 The MALDI-MS assay directly monitored the CHKtide substrate and its phosphorylated product peptide, and the results were compared with an ADP Hunter assay in which a coupled enzyme system detects production of the resorufin fluorophore. The enzymatic reaction was carried out in 384-well plates and analyzed either by ADP Hunter directly or by MALDI-MS following transfer of the samples to a 1536-well target plate. Both assays were demonstrated to be robust methods for screening (MALDI-MS Z′ = 0.5, S/B = 3.0 vs ADP Hunter = 0.9, S/B = 2.8); however, there was only a moderate correlation (R2 = 0.44) between the assays for compounds producing >40% inhibition, although the potency of standard molecules was found to be comparable between the two formats. In a slightly different but novel approach, Ritorto et al. described an assay for measuring the activity of deubiquitylating enzymes (DUBs) in which they quantified the amount of monoubiquitin generated by the in vitro cleavage of specific diubiquitin topoisomers. 71 They evaluated the specificity of 42 human DUBs and characterized the potency and selectivity of 11 DUB inhibitors against a panel of 32 DUBs. As part of their studies, the authors evaluated DUB activity at five different enzyme concentrations against eight diubiquitin isomers as substrates and performed more than 5520 enzymatic reactions; this remains the largest published resource for DUB specificity and activity. In comparing DUB activity measured using MALDI-MS to the ubiquitin-rohodamine110-glycine assay frequently used in the field, they found 10 DUBs to be active only in the MALDI assay. Furthermore, four DUBs with low activity in the fluorescence assay were found to be significantly more in the MALDI assay. In particular, members of the JAMM family displayed high activity in the MALDI assay, suggesting that this might be a preferred technology to screen these specific metalloproteases. Conversely and quite interestingly, seven DUBs were found to be active only in the fluorescence assay. These were UCH DUBs which had been previously shown to cleave ubiquitin moieties from protein substrates but not to directly hydrolyze ubiquitin.
In one of the first reports on a MALDI-ToF workflow capable of supporting the throughput necessary for true HTS, Haslam, Leveridge et al. reported on two model assays: an acetylcholinesterase (ACHe) assay, in which formation of the low-molecular-weight product choline and depletion of the substrate acetylcholine were monitored, and a JMD2C histone demethylase assay in which disappearance of the H3K9Me3 histone peptide substrate and formation of the H3K9Me2 peptide product were followed. 72 By making use of a mosquito liquid handler to dispense nanoliter-sized samples, the authors were able to routinely prepare target plates in the 1536-well format on a timescale that was comparable to the MALDI-MS analysis step. No patterns were observed across plates at this density, and Z′ values of 0.87 and 0.83 were obtained for the JMJD2c and ACHe assays, respectively. Furthermore, the IC50 values obtained for known inhibitors of JMJD2c (n = 105) and ACHe (n = 23) were in good rank-order agreement with values reported in the literature. The performance of the MALDI-MS workflow was further pressure tested by screening 10,000 compounds against both targets in the 1536-well format. The authors reported analysis speeds of 1.2 s per sample, resulting in a read time of ~1 h for a 1536 plate, which included a laser source clean performed after every plate as well as the time required to physically move the plate in and out of the system. In an attempt to reduce analysis times, the authors also increased the spotting density to 6144 samples per target using the same liquid handler. Although the assay characteristics were not as robust when compared with the 1536 format, the IC50 values were still found to correlate well and demonstrated the potential of the approach. In a quest to improve MALDI plate preparation time, Beeman et al. utilized a 3D-printed, lightweight adapter to facilitate acoustic sample transfer using Echo550 from Labcyte in a 1536-well format. 73 This approach allowed spotting of a complete target plate in <8 min, much faster than was achieved by sequential transfer using the mosquito system reported earlier. For a receptor tyrosine kinase c-MET assay, the authors reported high reproducibility between experiments using MALDI-MS, as well as good correlation of IC50 values obtained from an orthogonal, fluorescence-based capillary electrophoresis (CE) readout.
In two back-to-back reports, Winter et al. reported on the first use of the multichannel CyBio Well Vario pipettor to simultaneously spot samples in the 1536 format, achieving preparation times of 12 min per target plate that were very well matched to the ~15 min MALDI read time for the analysis.74,75 In their initial report, the authors established assay conditions for screening inhibitors of PTP 1 B (PTP1B) that were equally compatible with MALDI-MS, as well as a chemiluminescence-based AlphaScreen assay. The IC50 values for 103 compounds tested were comparable between the two assay formats, and excellent Z′ values were reported with both technologies. As part of that investigation, the technique of on-target sample washing was shown to reduce the amounts of certain assay components in the spotted sample and to increase sensitivity without affecting assay precision. A variation on the MALDI-ToF assay was also used to exclude compounds that inhibited PTP1B activity via an undesired mode of action (covalent modification or oxidation of the catalytic site Cys215), which was tracked by tryptic digestion of the enzyme and analysis of peptides containing the catalytic cysteine. In their follow-up study, the authors reported on a mock screen to generate evidence that the multichannel target-spotting workflow was capable of supporting a 1-million-compound screen. A total of 4896 compounds arrayed on five 1536 plates were analyzed before and after analysis of 1 million spots to document comparability in the results. The end-to-end process described used integrated robotics to run the enzymatic reaction in 384-well plates and to reformat samples for spotting onto 1536 MALDI target plates (i.e., four 384-well assay plates per target); once prepared, the target plates were analyzed by an off-line MALDI-MS system. Following this protocol, cycle times of 0.6 s per sample for automated spotting and 0.4 s per sample for MS analysis were achieved, bringing the throughput of the MALDI workflow very close to those of traditional, optical HTS techniques.
More recently, and building on their success, the same group reported on screening for inhibitors of TMA generating enzymes in gut bacteria. 76 They developed a MALDI-ToF assay for quantification of secreted TMA levels within bacterial cultures to assess microbial TMA-lyase activity. A key element of the assay was derivatization of the sample generated in microbial assay using biotin polyethylneoxide iodoacetamide (BPI) in order to increase the molecular weight of the analyte and thus avoid interference from matrix and other background ions. A subset of 10,229 diverse compounds, representing the major classes of the full deck library of >1 million compounds, was successfully screened in the assay; a mean Z′ value of 0.73 was reported, and hits were successfully carried through concentration–response experiments.
Recently, the same group published a report on successful implementation of what is perhaps the largest MALDI-ToF-based screen attempted to date, a campaign covering >1 million compounds searching for inhibitors of the cytosolic DNA sensor cGAS (cyclic GMP-AMP synthase). 77 Conditions for the MALDI-ToF assay were optimized to substantially reduce reagent consumption compared with previously reported cGAS screening assays, while still achieving a robust Z′ value of 0.88, high interday reproducibility, and good performance for known inhibitors of the enzyme. Over the course of the campaign, up to forty-five 1536-well target plates containing ~60,000 compounds were analyzed per day, allowing the screen to be completed in 20 working days and bringing the timeline of this MS assay close to that of other well-established HTS technologies. All plates analyzed passed the predefined quality threshold of Z′ value >0.5, and the IC50 value of the reference compound was highly reproducible. Concentration–response experiments for a subset of 40 compounds correlated well when compared with results obtained from an orthogonal RapidFire–MS method.
Collectively, these studies have helped to establish MALDI-ToF as an attractive option for MS-based HTS. Indeed, when compared with other ionization techniques, there are several unique advantages of MALDI that predispose it to high-throughput bioanalysis. Being a direct-sample introduction technique, the throughput of MALDI-ToF analysis is not constrained by chromatographic run times. Furthermore, owing to the availability of high-frequency lasers and the rapid measurement times of the ToF-MS, the speed of analysis can be extremely fast with per-sample analysis times on the scale of 1 s or less. Additionally, the technique is highly sensitive (low attomole-to-femtomole detection limits) and typically requires small sample volumes (typically nanoliter range), which facilitates miniaturization and analysis of samples from high-density well plates. As noted, however, there are some drawbacks to the technique that must be managed for successful assay development. MALDI tends to be more variable than other techniques, such as ESI, and as such, it has more often been used for qualitative and semiquantitative analyses. Nonetheless, this issue can be overcome by use of stable isotope-labeled or structural analogs of the target analyte(s) as an internal standard. Additionally, there is generally significant background coming from co-ionization of matrix molecules that can interfere with analysis, and this is especially prevalent for low-mass analytes (below ~800 Da). For these reasons, MALDI has been more widely adopted for the analysis of larger molecules, such as peptides, nucleotides, proteins, and antibodies. However, small-molecule analysis is becoming more feasible due to the recent development of novel organic MALDI matrices, 78 use of alternative nonorganic matrices, 79 and even through selective derivatization of small molecules, which can increase the mass of the target analyte(s), thereby moving them away from interfering background ions (with the added benefit that this can also increase ionization efficiency).
The significant developments that have occurred with respect to integration of commercially available MALDI-MS instrumentation, high-density liquid handling systems, and flexible robotics have already resulted in increased uptake of the technique within HTS laboratories. In order to further accelerate adoption of the technique, we look forward to improvements in commercial software and data analysis capabilities that could allow for simplified identification of isobaric compound interferences, commoditized workflows for evaluating mechanism of action (e.g., covalent peptide modification), and compatibility of HTS assays with MS/MS analysis.
Samdi-Ms
The use of self-assembled monolayers for MALDI-ToF-MS (SAMDI-ToF-MS) was first introduced in 2002 by Su and Mrksich. 80 The technique involves immobilization of functionalized alkanethiolates on a gold surface, which can then be used to capture or present a range of biomolecules. A unique feature of this approach is that once the desired analytes are immobilized, other components in the sample (buffer, detergent, interfering compounds, etc.) can be washed away, resulting in a clean sample for subsequent MS analysis. A general schematic of the SAMDI experiment is shown in Figure 5 . In their pioneering work, the authors demonstrated the ability to capture peptides (via reaction of C-terminal cysteine thiols with SAMs functionalized with oligo(ethyleneglycol)-maleimide) and proteins (via binding of lectin to SAMs presenting α-mannose). In both cases, sensitive and specific detection of the captured biomolecule was achieved using MALDI analysis. In the same report, the authors demonstrated the ability of the SAMDI technique to measure enzymatic reactions on immobilized substrates. Here, immobilized N-acetylglucosamine was treated with a HEPES buffer containing β-1,4-galactosyltransferase enzyme and uridine diphosphogalactose. After 1 h of reaction, quantitative conversion of the N-acetylglucosamine substrate to N-acetyllactosamine product was observed.
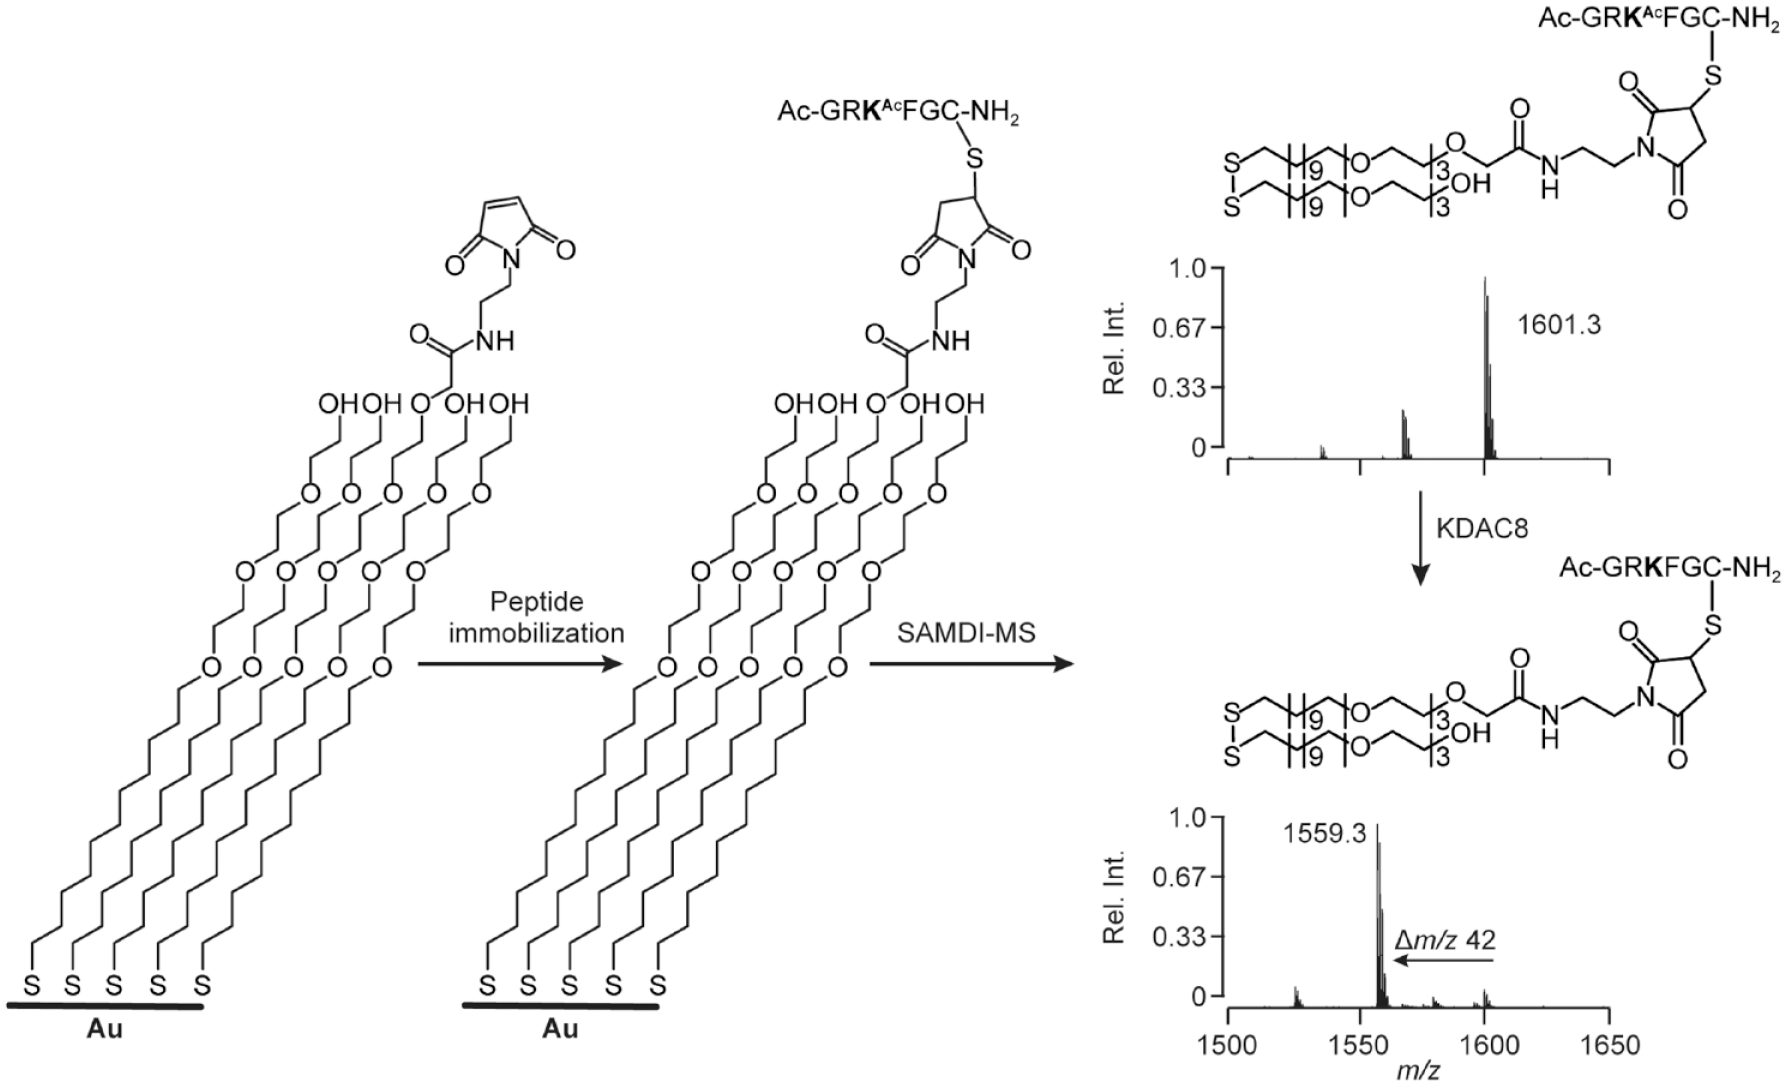
Schematic illustration of the SAMDI assay. Maleimide-terminated self-assembled monolayers are used to covalently capture the peptide substrates and products through reaction with the cysteine thiol group. Laser irradiation of the monolayer results in cleavage of the thiolategold bond and efficient desorption and ionization of the chains, as either disulfides or alkanethiolates. The starting peptide substrate used in the screen gives rise to the peak at an m/z of 1601.3, and the deacetylated products are shifted by an m/z of 42 to a peak at an m/z of 1559.3. Reproduced with permission from Gurard-Levin et al. 81 Copyright American Chemical Society.
Since that initial report, multiple examples have been published demonstrating the applicability of SAMDI for the measurement of enzyme activities in a biochemical (i.e., purified enzyme) format, many of which have focused on the conversion of peptide substrates that are immobilized to the SAMDI surface prior to the enzymatic reaction. In a novel application of this strategy, Gurard-Levin et al. generated an array of 361 hexapeptides of varying sequences to profile the substrate reactivity of multiple recombinant lysine deacetylases. 82 Alternatively, the substrates and products of enzymes can be captured using the same monolayer chemistry after the reaction has been carried out in free solution, as exemplified in a separate study on the activity of lysine deacetylase 8. 81 SAMDI is not constrained to analysis of purified enzyme reactions, however, with a number of reports demonstrating its applicability to cell-based assays as well. Su et al. measured the endogenous activity of caspase enzymes in lysates from SKW6.4 cells by presenting native peptides immobilized to SAMs via their C-terminal cysteine residues. 83 Prior identification of peptide sequences selective for caspase 3 versus caspase 8 activity allowed the authors to estimate the differential activity of the individual enzymes in the SKW6.4 cells and showed that the activity of caspase 3 lags that of caspase 8 following induction of apoptosis. This differential enzyme activity was not observed when the same cell lysates were analyzed using a fluorescent “Fluor de Lys” assay, which the authors attributed to the dependency of that assay format on an artificial peptide substrate. Kuo et al. later demonstrated the applicability of the SAMDI format to measuring activities in cell lysates without the need for substrate immobilization prior to reaction. 84 Here, lysates from CHRF megakaryocytic (Mk) cells were profiled for endogenous sirtuin and lysine deacetylase activities by incubation in free solution with a hexapeptide substrate containing an acetylated lysine residue. Following the lysate reaction, the deacetylated product and residual substrate were captured via the peptides’ C-terminal cysteine using maleimide-presenting monolayers and analyzed. Subsequent reports have further demonstrated the applicability of SAMDI to a variety of cellular assay formats, including monitoring of PTP activity in HeLa cells cultured directly on SAMDI plates,85,86 PTP activity in lysates from five different mammalian cell lines, 87 and isocitrate dehydrogenase 1 activity in lysates from LN382 cells. 88
In the majority of the reports described to date, the substrate includes some feature conferring compatibility with the immobilization chemistry of the SAM surface (examples being peptide C-terminal cysteine residues for capture via maleimide functionalization, biotinylation for capture on neutravidin, 89 or azide functionalities on small molecules for capture via alkyne-terminated monolayers 90 ). Recently, a truly label-free application of the SAMDI technique called traceless immobilization (TI-SAMDI) was reported. 91 In this configuration, a 3-trifluoromethyl-3-phenyl-diazarine (TPD) warhead is coupled with the alkanethiolate monolayer via a trimethylammonium (TMA) lysine linker. Upon irradiation with light near 365 nm, the diazirine is converted to a highly reactive carbene that can subsequently react nonspecifically with a variety of chemical bonds to covalently capture analytes of interest. The TMA–lysine linker helps to promote intense MALDI ionization and simultaneously normalizes the response, enabling sensitive quantitation regardless of the inherent properties of the target analyte. In this initial disclosure, the TI-SAMDI technique was shown to be broadly applicable to measuring a range of analytes, including glucose, short- and medium-chain fatty acids, peptides, and small molecules. The technique was also applied to measuring the hydroxylation of tolbutamide by Cyp2C9 and to characterization (Km, kcat, Vmax) of the enzymatic reaction. It should be noted that while the nonspecific capture of unmodified analytes via TI-SAMDI allows broad application of the technique to analysis of native reaction products, it comes at the cost of increased sample complexity that must ideally be reduced prior to analyte capture. Indeed, several additional sample preparation steps (including extraction, evaporation, and reconstitution) were carried out for the Cyp2C9 assay that are not typically required for other SAMDI approaches.
Execution of the SAMDI assay on high-density target plates (384 or 1536 spots) allows efficiency to be achieved via parallel sample processing. In one example, the time required for immobilization of the target analyte, rinsing of the target plate, matrix deposition, and drying for a 384-well plate was on the order of 1 h. 81 While early reports described instrumental analysis times on the order of ~5 s per sample for SAMDI analysis, more recent publications have documented speeds of up to 1–2 s per sample, 92 equivalent to a run time of approximately 20 min for a 384-well plate (this is, however, a reflection of the speed of the mass spectrometer and not a fundamental limit of the SAMDI technique per se). While a total preparation and analysis time of ~90 min per plate could be considered significant, the approach is still quite compatible with the needs of HTS due to the aforementioned efficiency of parallel processing. Indeed, Gurard-Levin et al. were able to carry out a high-throughput screen for small-molecule inhibitors of lysine deacetylase 8 using the SAMDI technique. 81 By pooling 8 compounds per well, the authors were able to complete analysis of forty 384-well plates containing 102,400 compounds in <24 h. Application of the SAMDI assay to seven hits identified from a Fluor de Lys assay revealed that six of these were false positives (i.e., showed no inhibition of the target enzyme). This is another compelling example of the advantage of directly monitoring enzymatic products of native substrates using MS in general, with the added benefit that the SAMDI assay demonstrated superior performance for primary hit identification (Z′ = 0.84, S/B = 468) when compared with the Fluor de Lys assay (Z′ = 0.75, S/B = 44). Additional examples where SAMDI was used to screen small-molecule libraries include the identification of inhibitors of the lysine demethylases KDM1A and KDM4C from a library of 10,000 compounds 89 and inhibitors of SIRT3 from a library of 100,000 compounds. 93 Recently, application of the SAMDI technique was extended to study RNA methylation (via inhibition of the RNA methyltransferase complex METTL3/METTL14), and while no compound library was screened, the performance of the assay was suggested to be suitable for HTS based on a Z′ value >0.7. 94
As mentioned above, the inherent immobilization of the reaction product(s) to be measured is a distinguishing feature of the SAMDI technique when compared with other MS approaches for HTS. A range of immobilization methods have been demonstrated, including His-tag capture, antibody capture, and biotin capture, allowing for significant flexibility in immobilization of the target analyte. For both biochemical and cell-based applications, once the reaction has been terminated, the SAMDI plate is rinsed to remove residual assay components that could otherwise interfere with the subsequent mass spectrometric analysis. This parallel processing is more efficient than sequential, sorbent-based techniques like RapidFire or LC-MS and can provide comparable, or even superior, sample cleanup. Furthermore, because the target ion measured in the SAMDI experiment is the alkanethiolate-linked product of the enzymatic reaction (or its dialkyldisulfide), analytes with molecular weights <500 Da generally yield ions in the range of 1000–2000 m/z, which are shifted away from low-mass interferences arising from the matrix that could otherwise complicate MALDI analysis. These elements of the SAMDI approach allow relatively clean spectra to be recorded at high mass resolution and no doubt contribute to the robust assay statistics often reported for the technique (Z′ ~ 0.7–0.9 in many cases).
ASMS
Since its first description in 1991, 95 affinity selection MS (ASMS) has become well established in the pharmaceutical industry, providing a powerful technique for the direct analysis of noncovalent protein–ligand complexes. As described below, the foundations of ASMS are relatively straightforward, and successful implementation does not require the development of target-specific assay conditions, or even explicit knowledge of the structure or function of the target (although this knowledge is unquestionably helpful when designing the screening approach).96,97 This contrasts with functional HTS, which requires differing levels of complexity for assay development and validation to optimize screening conditions for target, substrate(s), and readouts. A further benefit of ASMS is that being a binding detection technique, ligands can occupy multiple distinct sites on functionally active or inactive protein constructs. Consequently, affinity-based screening can identify a set of ligands exhibiting multiple mechanisms of action against the same target, including agonists/activators and antagonists/inhibitors. Targets can also be screened in a variety of permutations, for example, in a ligand-bound state with a known inhibitor or cofactor in order to discover new hits that bind to allosteric or distal sites, or as part of multimolecular complexes (such as protein–protein, protein–oligonucleotide, protein–peptide, or protein–antibody) in order to reveal novel small-molecule binding sites that are present only upon complex formation. Because of these unique advantages, ASMS has found a niche in hit and lead identification that complements functional-based biochemical and cellular high-throughput screening.
ASMS involves the following steps, which are schematically outlined in Figure 6 : (1) protein is equilibrated with ligands of interest that leads to the formation of a complex, (2) protein–ligand complexes are separated from nonbinding mixture components, and (3) bound ligands are dissociated and detected by MS. ASMS techniques fall under two broad categories, mainly differing in the affinity selection step. In one form, separation of bound and unbound ligands relies on the target of interest being immobilized to a solid support (such as beads), usually through an affinity tag. ASMS performed on affinity beads 98 or on SAMDI target plates 92 emulates other affinity selection HTS techniques, such as DNA-encoded library (DEL), 99 phage display, 100 or mRNA display. 101 As such, ASMS performed in this manner can be used to orthogonally confirm binders emerging from these affinity selection methods, with the benefit that the protocol for the ASMS selection is the same as that for the primary affinity screen. In another implementation of this technique, referred to as label-free ASMS, separation occurs in the solution with no need for a solid support. One clear advantage of being label-free is the avoidance of interference to ligand binding, either by the complex between the target and solid support or by the affinity tag (especially if the tag is added nonspecifically, such as labeling of lysine residues on the surface of a protein target). Multiple variants of in-solution protein–ligand separation have been described, including size exclusion chromatography, vacuum filtration, gel filtration, and ultrafiltration.101–103 Several pharmaceutical and biotechnology companies have developed ASMS protocols to perform HTS with mixture-based libraries, for example, the automated ligand identification system (ALIS) developed at NeoGenesis (acquired by Merck & Co., Inc., Kenilworth, NJ), SpeedScreen at Novartis Pharmaceutical Corporation, pulsed ultrafiltration–MS at Abbott Labs, gel permeation chromatography–spin columns coupled with LC-MS at Wyeth Pharmaceuticals (now Pfizer) and Amgen, and frontal affinity chromatography (FAC)–MS at Transition Therapeutics.104–110 Recently, researchers at Boehringer Ingelheim Pharma GmbH & Co. described their approach to ASMS on individual compounds, which involves separation of the protein–ligand complex using size exclusion chromatography in 384-well plates, followed by off-line detection of the bound ligand using high-throughput MALDI-MS. 111 Additionally, ASMS has also been implemented as a hit-finding tool in academia. 98
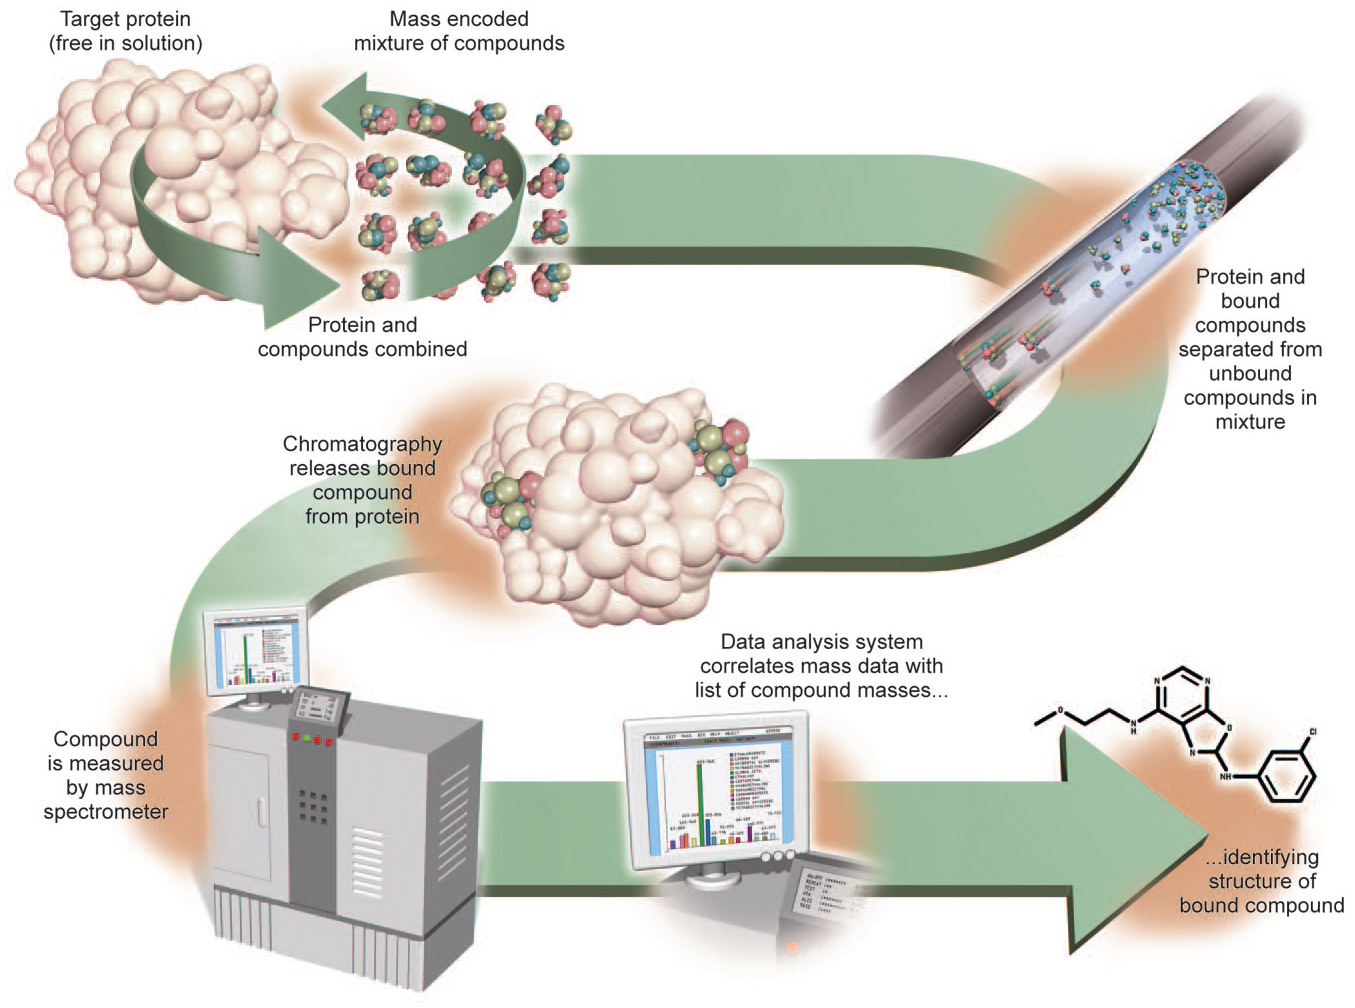
Schematic representation of the steps involved in ASMS. As described in the text, these include (1) equilibration of the protein target with ligands, leading to formation of a complex; (2) separation of protein–ligand complexes from nonbinding mixture components, and (3) dissociation and detection of bound ligands by MS.
Detection of the dissociated ligand by MS is a key element of the ASMS technique as it allows mixture libraries to be mass-encoded (i.e., pooled together based on differences in molecular weight), leading to a large diverse screening collection of molecules. The pooling of small-molecule mixture libraries (consisting of a few hundred to a few thousand molecules per well) leads to extraordinary efficiency with typical screening throughputs of 105 compounds per day, enabling the screening of a complete compound collection (e.g., more than 1 million compounds) on a single instrument within a month. Libraries can consist of either mixtures produced by parallel synthetic approaches such as combinatorial chemistry or mixtures produced by pooling individual compounds or natural product extracts. 112 Furthermore, the built-in QC feature of ASMS, that is, direct and unambiguous identification of the ligand based on its mass to charge, means that impurities in the compound library do not interfere with the analysis, as can be the case for functional activity assays.
The ALIS technique performed at Merck & Co., Inc. is suitable for HTS of the entire compound collection, as well as orthogonal binding confirmation of ligands identified from other HTS techniques (e.g., functional-HTS, DEL, mRNA display, and in silico and fragment-based screening). ALIS utilizes size exclusion chromatography for separation of target–ligand complexes from unbound mixture libraries, followed by target dissociation on a reversed-phase column. Detection of the liberated ligands is performed by high-resolution ESI-MS. Over the last two decades, multiple examples have been published that demonstrate the applicability of ASMS to successfully screen a wide variety of therapeutic targets with small drug-like compound mixtures, yielding novel ligands for soluble targets such as kinases, proteases, nuclear hormone receptors, and protein–protein interactions.105,112–119 ASMS has also been successfully applied to more challenging targets, such as integral membrane proteins. For example, Whitehurst et al. demonstrated the utility of ASMS to identify novel orthosteric and allosteric ligands to purified G-protein-coupled M2 acetylcholine receptor, which was enabled by extracting the receptor from overexpressing membranes using digitonin as a detergent. 120 Though quite successful in their application, the authors did note that screening of G-protein-coupled receptors (GPCRs) using the ALIS technique is dependent upon isolating a relatively pure (>70%), reasonably concentrated (0.5 µM) receptor preparation that maintains a relevant conformation in the detergent formulation. More recently, Lu et al. described an ASMS platform to screen 200,000 compounds against GPCR-expressing membranes. 98 Recently, Rizvi et al. used their ALIS platform to successfully demonstrate the applicability of ASMS to detect small-molecule binding to soluble RNA fragments. 121 Using FMN Riboswitch as a test case, they demonstrated that RNA is stable to screening and confirmed the binding of known ligands. Efforts were expanded to screen various small eukaryotic and prokaryotic RNA against 50,000 compounds and resulted in the identification of compounds with novel RNA binding motifs.
The nature and flexibility of ASMS lends utility to the technology beyond the initial hit identification screening paradigm. ALIS has been applied both to rank-ordering based on affinity and for affinity determination of ligands.92,122 In this approach, the target protein is first equilibrated with a mixture of compounds and then titrated with a serially increasing concentration of a known competitor ligand. The amount of each compound bound to the target protein is then analyzed by ALIS. The titrant concentration that displaces 50% of another ligand is defined as the affinity competition experiment 50% (ACE50) value of the ligand. A higher ACE50 value means that a higher concentration of titrant is required to compete off the specific ligand. Based on the determined ACE50 value, affinity rank-ordering of a compound in that mixture can be achieved.
ASMS also integrates with other HTS techniques for downstream orthogonal confirmation, including functional (both biochemical and cellular), in silico, binding (fragment based), and affinity selections (DEL, mRNA display, and phage display). In one notable example, Kutilek et al. demonstrated the value of linking ASMS to cell-based assays for phenotypic screening deconvolution, by simultaneously screening with arrays of up to 18 protein targets against 50,000 small molecules. 123 This was accomplished by mixing proteins into pools. Since the protein appears in two orthogonal pools with four uniquely different protein neighbors, target–ligand pairs can be identified. Furthermore, investigators at SeedSupply have developed a novel label-free target identification technology for small molecules, referred to as open reading frame (ORF) expression/ASMS. In ORF expression/ASMS, pooled library mixtures are screened against individual proteins. 124 The technology utilizes a human library consisting of more than 18,000 proteins (both soluble and membrane associated), greatly increasing the potential of identifying new target–ligand pairs. Investigators at SeedSupply have recently proposed using the robustness and simplicity of the ASMS technology to rapidly prescreen multiple targets prior to deciding on which target to commit to in a follow-up with an HTS campaign. ASMS also provides a valuable tool for triaging hits from other screening technologies. For example, it is feasible to test thousands of functional HTS hits by ASMS as a method to confirm direct binding of functional inhibitors. ASMS has also been utilized to complement other affinity selection screening platforms, such as DEL 125 and mRNA display technologies, where this orthogonal technique provides a rapid method for confirming hits resynthesized without the nucleic acid tag.
Emerging Technologies
We have thus far focused our review on MS platforms that have reached a level of maturity sufficient for routine application in the HTS laboratory. However, there are emerging techniques that are notable even if they have not yet made the transition from proof of concept/specialized application to a broader level of availability. For example, Wleklinski and colleagues recently demonstrated analysis of liquid-phase chemical reactions in 6144 arrays using desorption electrospray ionization (DESI) MS on a linear ion trap mass spectrometer at speeds of ~1 s per sample. 126 Samples (50 nL) were deposited on a porous PTFE surface prior to analysis using a commercial DESI source and software, and under these conditions the reproducibility of measurement was reported to be good. Another novel approach is segmented flow electrospray ionization, where aqueous reaction droplets are separated in a flowing stream by perfluorinated oil droplets and continuously introduced into a mass spectrometer via an ESI source. As with approaches such as AMI-MS and ADE-OPI-MS, this allows samples to be repeatedly analyzed from a single well and enables continuous assay formats. Sun and colleagues first demonstrated the potential of this approach for HTS using cathepsin B as a model enzyme; the authors achieved throughputs greater than one sample per second and Z′ values >0.7 for assays developed using AMC-labeled and unlabeled peptide substrates and demonstrated the ability to clearly identify inhibitors of the enzyme. 127 More recently, Diefenbach et al. increased the throughput of the technique to approximately three samples per second through instrumental adaptations, including the use of an ESI source designed for coupling of CE to the mass spectrometer. 128 Lastly, a recent report from Wei et al. described a novel apparatus for introducing quenched biochemical reaction samples from a 96-well plate into a linear ion trap mass spectrometer using multiplexed, custom-made, inductive nanoelectrospray emitters. 129 In their report, the authors demonstrated the ability of the apparatus to perform analyte enrichment and sample cleanup by field amplification microelectrophoresis within each emitter tip, leading to a significant improvement in the signal-to-noise ratio for the peptide analyte studied. The potential for applicability to biochemical reaction screening was demonstrated using BACE1 as a prototypical enzyme; the authors achieved throughputs of approximately 2–4 s per sample and demonstrated the ability to faithfully recapitulate the IC50 of a known inhibitor of the enzyme.
While these methodologies may not be practical tools for the HTS practitioner today, advancements in the future may see these and other platforms expand the utility of MS for hit identification even further beyond the level currently enjoyed.
Summary and Future Directions
As the reader will now appreciate, a variety of MS platforms are available to the HTS practitioner that permit appropriately scaled functional and/or affinity-based screening. Selected characteristics of each of the platforms examined in this review are collected in Table 1 to aid in comparing and contrasting them on figures of merit relevant to the discipline. It should be noted that several of the platforms continue to advance—in particular with regard to throughput29,130,131—and as this occurs, larger-scale screens will continue to become even more accessible. We have also attempted to summarize, in Table 2 , the applicability of each platform to the privileged protein classes mentioned in the introduction (and within Fig. 1 ). As can be seen, there is as yet no single MS platform that possesses a combination of speed and broad applicability that would make it uniquely superior to the others. As such, an aspirational goal of all HTS practitioners should be to find ways to avail themselves of access to as many of these techniques as possible and to integrate them into common practice. Toward this end, progress continues to be made against certain practical issues. For example, while each of the platforms reviewed has been married with sufficient sample handling automation to allow unattended instrumental analysis, not all have been successfully integrated with truly centralized automation, that is, where the mass spectrometer is co-localized with all peripheral equipment necessary to support the biochemical or cellular systems being studied and is directly presented with sample plates by robotics integrating these together. This is certainly achievable, however, and is presently being facilitated by collaboration between HTS practitioners, MS vendors, and specialists in robotic integration. The data informatics required to support handling of results generated by these MS platforms has also received consistent attention in order to avoid creating bottlenecks. At present, each of the platforms described in this review is supported with the software necessary to ensure successful experiments for conventional HTS applications measuring substrate-to-product conversion and for direct integration with laboratory information management systems. New efforts to extend software support to extraction of multiple m/z values per sample are ongoing in order to enable new applications such as chemical reactivity screening. 132 In some ways, these new tools address needs similar to those of affinity-based screening, where appropriate data analysis practices have already been successfully implemented. 133 Lastly, while it is unreasonable to assume that institutions practicing HTS on different scales/frequencies will necessarily have the space or resources available to house multiple MS platforms for their dedicated use, opportunities still exist to access the breadth of these capabilities. Several of the platforms described in this report can be accessed via contract research organizations, and this presents an opportunity for practitioners to match their needs with the appropriate platform. Hopefully, we have convinced the reader of the value and opportunity in making MS a routinely applied technology in the search for novel hits, leads, and ultimately drugs.
Characteristics of High-Throughput MS Platforms.
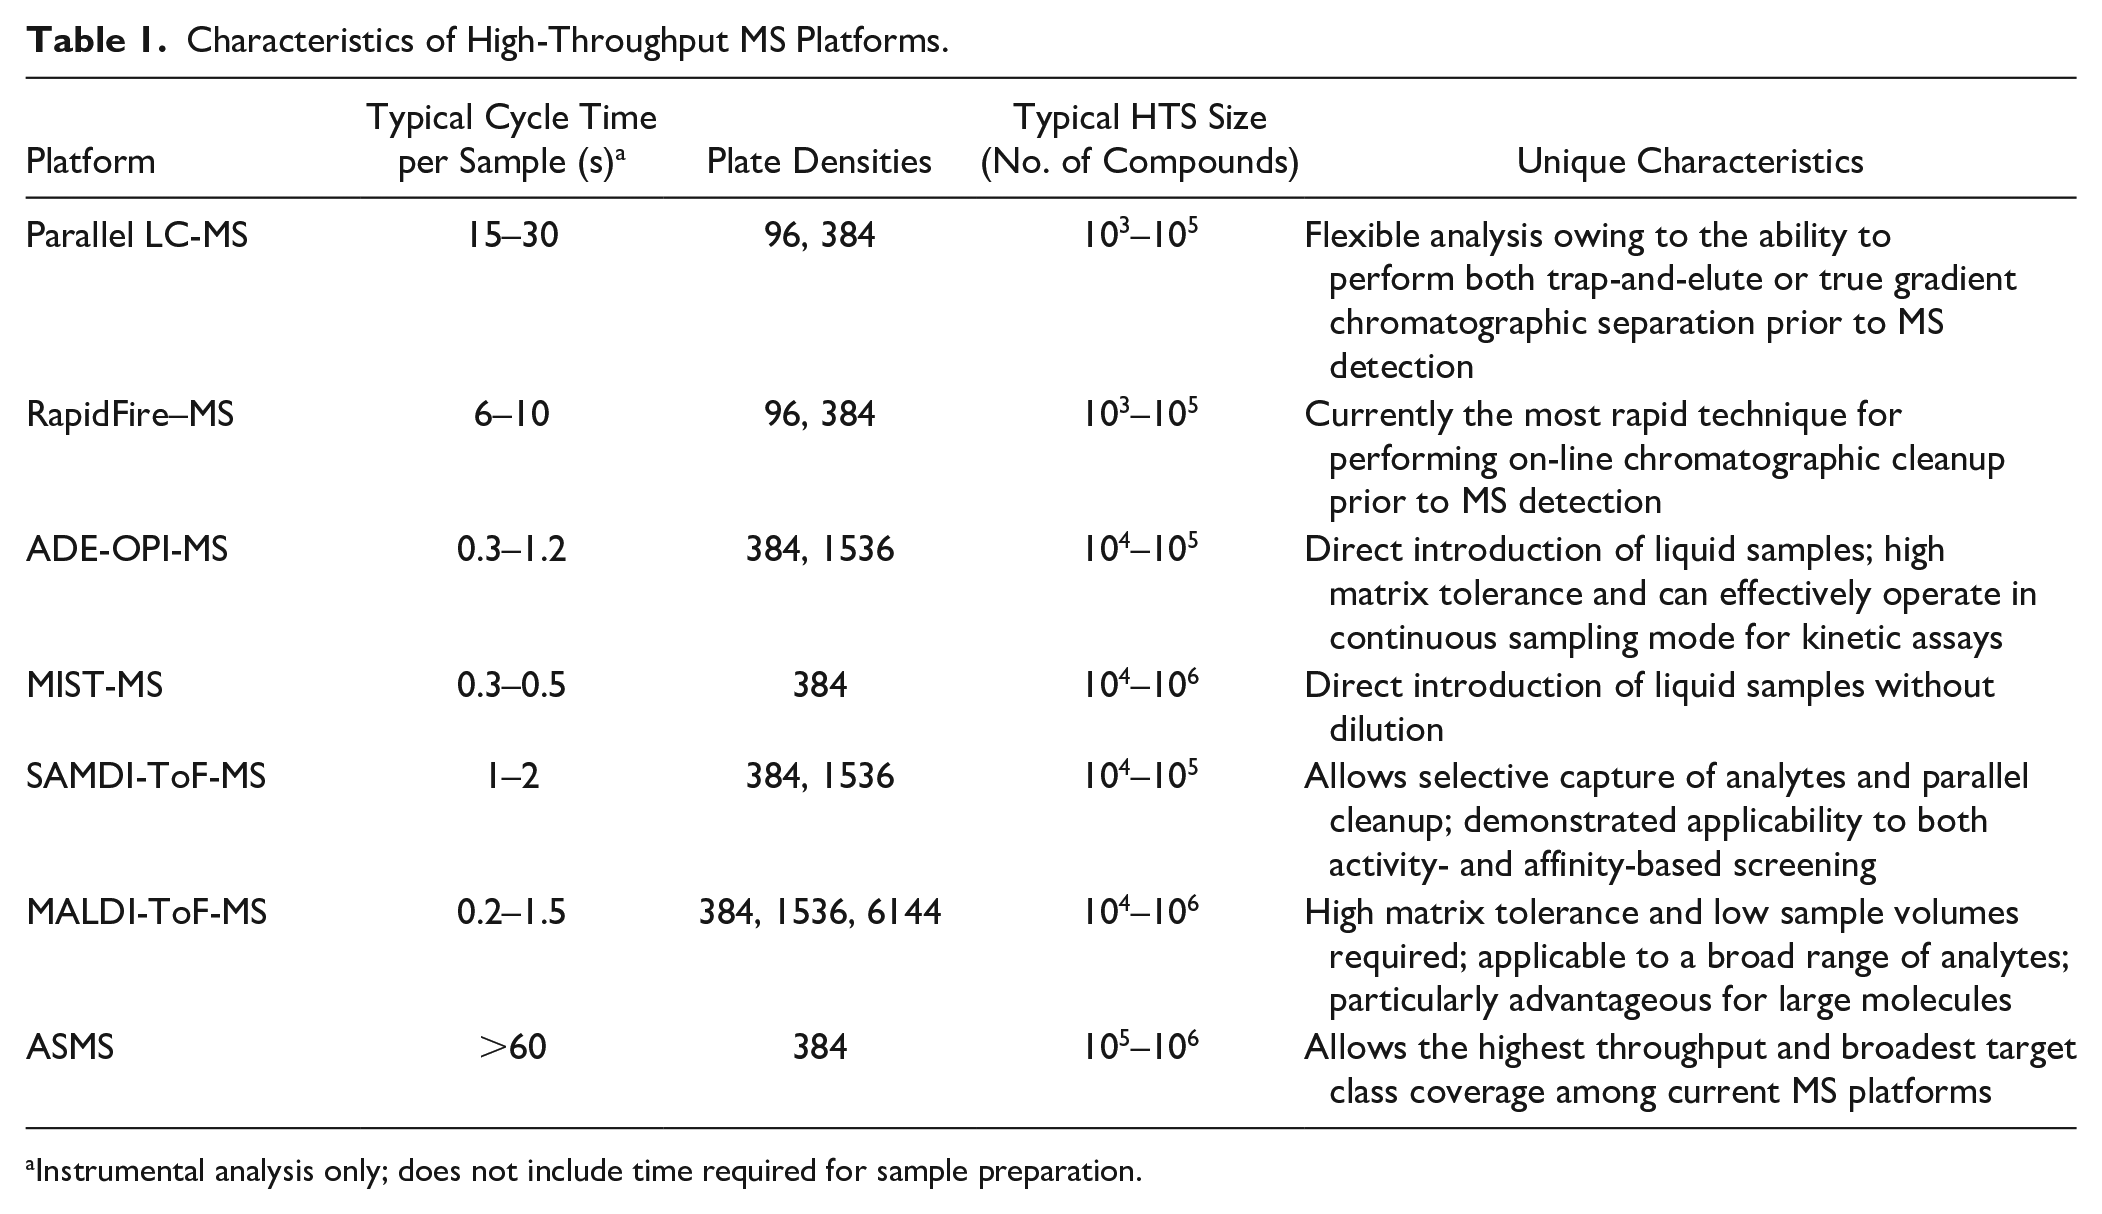
Instrumental analysis only; does not include time required for sample preparation.
Privileged Protein Classes Successfully Assayed by High-Throughput MS. a
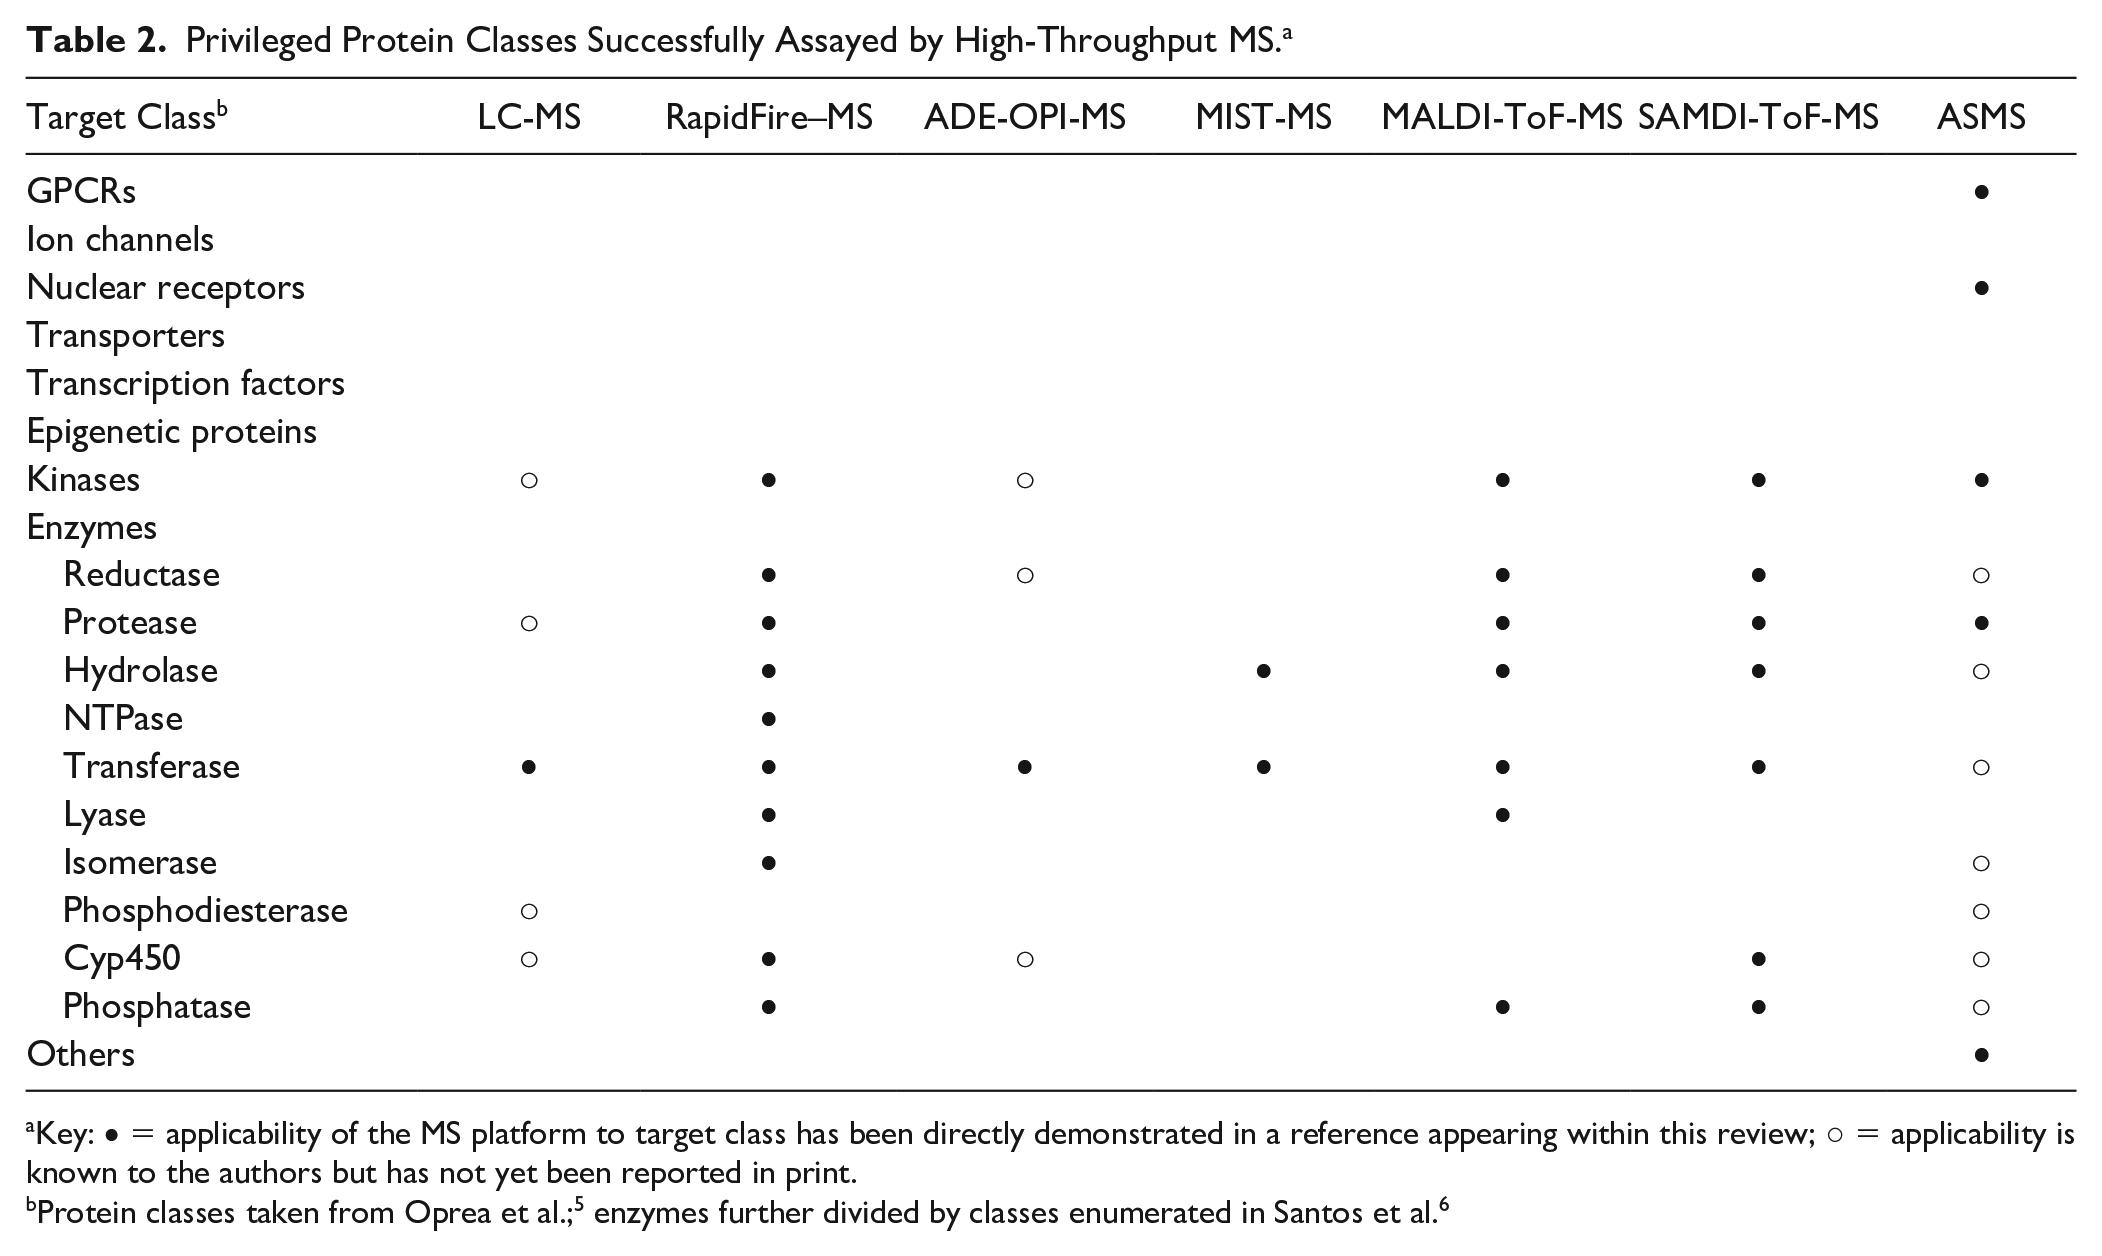
Key: • = applicability of the MS platform to target class has been directly demonstrated in a reference appearing within this review; ○ = applicability is known to the authors but has not yet been reported in print.
Supplemental Material
sj-pdf-1-jbx-10.1177_2472555220980696 – Supplemental material for High-Throughput Mass Spectrometry for Hit Identification: Current Landscape and Future Perspectives
Supplemental material, sj-pdf-1-jbx-10.1177_2472555220980696 for High-Throughput Mass Spectrometry for Hit Identification: Current Landscape and Future Perspectives by David G. McLaren, Vinit Shah, Thomas Wisniewski, Lucien Ghislain, Chang Liu, Hui Zhang and S. Adrian Saldanha in SLAS Discovery
Supplemental Material
sj-pdf-2-jbx-10.1177_2472555220980696 – Supplemental material for High-Throughput Mass Spectrometry for Hit Identification: Current Landscape and Future Perspectives
Supplemental material, sj-pdf-2-jbx-10.1177_2472555220980696 for High-Throughput Mass Spectrometry for Hit Identification: Current Landscape and Future Perspectives by David G. McLaren, Vinit Shah, Thomas Wisniewski, Lucien Ghislain, Chang Liu, Hui Zhang and S. Adrian Saldanha in SLAS Discovery
Supplemental Material
sj-pdf-3-jbx-10.1177_2472555220980696 – Supplemental material for High-Throughput Mass Spectrometry for Hit Identification: Current Landscape and Future Perspectives
Supplemental material, sj-pdf-3-jbx-10.1177_2472555220980696 for High-Throughput Mass Spectrometry for Hit Identification: Current Landscape and Future Perspectives by David G. McLaren, Vinit Shah, Thomas Wisniewski, Lucien Ghislain, Chang Liu, Hui Zhang and S. Adrian Saldanha in SLAS Discovery
Supplemental Material
sj-pdf-4-jbx-10.1177_2472555220980696 – Supplemental material for High-Throughput Mass Spectrometry for Hit Identification: Current Landscape and Future Perspectives
Supplemental material, sj-pdf-4-jbx-10.1177_2472555220980696 for High-Throughput Mass Spectrometry for Hit Identification: Current Landscape and Future Perspectives by David G. McLaren, Vinit Shah, Thomas Wisniewski, Lucien Ghislain, Chang Liu, Hui Zhang and S. Adrian Saldanha in SLAS Discovery
Supplemental Material
sj-pdf-5-jbx-10.1177_2472555220980696 – Supplemental material for High-Throughput Mass Spectrometry for Hit Identification: Current Landscape and Future Perspectives
Supplemental material, sj-pdf-5-jbx-10.1177_2472555220980696 for High-Throughput Mass Spectrometry for Hit Identification: Current Landscape and Future Perspectives by David G. McLaren, Vinit Shah, Thomas Wisniewski, Lucien Ghislain, Chang Liu, Hui Zhang and S. Adrian Saldanha in SLAS Discovery
Supplemental Material
sj-pdf-6-jbx-10.1177_2472555220980696 – Supplemental material for High-Throughput Mass Spectrometry for Hit Identification: Current Landscape and Future Perspectives
Supplemental material, sj-pdf-6-jbx-10.1177_2472555220980696 for High-Throughput Mass Spectrometry for Hit Identification: Current Landscape and Future Perspectives by David G. McLaren, Vinit Shah, Thomas Wisniewski, Lucien Ghislain, Chang Liu, Hui Zhang and S. Adrian Saldanha in SLAS Discovery
Supplemental Material
sj-pdf-7-jbx-10.1177_2472555220980696 – Supplemental material for High-Throughput Mass Spectrometry for Hit Identification: Current Landscape and Future Perspectives
Supplemental material, sj-pdf-7-jbx-10.1177_2472555220980696 for High-Throughput Mass Spectrometry for Hit Identification: Current Landscape and Future Perspectives by David G. McLaren, Vinit Shah, Thomas Wisniewski, Lucien Ghislain, Chang Liu, Hui Zhang and S. Adrian Saldanha in SLAS Discovery
Supplemental Material
sj-pdf-8-jbx-10.1177_2472555220980696 – Supplemental material for High-Throughput Mass Spectrometry for Hit Identification: Current Landscape and Future Perspectives
Supplemental material, sj-pdf-8-jbx-10.1177_2472555220980696 for High-Throughput Mass Spectrometry for Hit Identification: Current Landscape and Future Perspectives by David G. McLaren, Vinit Shah, Thomas Wisniewski, Lucien Ghislain, Chang Liu, Hui Zhang and S. Adrian Saldanha in SLAS Discovery
Footnotes
Acknowledgements
The authors gratefully acknowledge Dr. Nicholas Hastings and Dr. Mary Jo Wildey for their critical review and are appreciative of the many additional comments made by colleagues during preparation of the manuscript (BC-766708.20). We are also indebted to Ms. Sue Wilks for her expert assistance with graphical design.
Supplemental material is available online with this article.
Declaration of Conflicting Interests
The authors have declared the following potential conflicts of interest with respect to the research, authorship, and/or publication of this article: D.G.M., V.S., T.W., and A.S. are employed by Merck Sharp & Dohme Corp., and their research and authorship of this article was completed within the scope of their employment with Merck Sharp & Dohme Corp.
Funding
The authors received no financial support for the research, authorship, and/or publication of this article.
References
Supplementary Material
Please find the following supplemental material available below.
For Open Access articles published under a Creative Commons License, all supplemental material carries the same license as the article it is associated with.
For non-Open Access articles published, all supplemental material carries a non-exclusive license, and permission requests for re-use of supplemental material or any part of supplemental material shall be sent directly to the copyright owner as specified in the copyright notice associated with the article.