
Abstract
The pharmaceutical industry has been continually challenged by dwindling target diversity. To obviate this trend, phenotypic screens have been adopted, complementing target-centric screening approaches. Phenotypic screens identify drug leads using clinically relevant and translatable mechanisms, remaining agnostic to targets. While target anonymity is advantageous early in the drug discovery process, it poses challenges to hit progression, including the development of backup series, retaining desired pharmacology during optimization, discovery of markers, and understanding mechanism-driven toxicity. Consequently, significant effort has been expended to elaborate the targets and mechanisms at work for promising screening hits. Affinity capture is commonly leveraged, where the compounds are linked to beads and targets are abstracted from cell homogenates. This technique has proven effective for identifying targets of kinase, PARP, and HDAC inhibitors, and examples of new targets have been reported. Herein, a three-pronged approach to target deconvolution by affinity capture is described, including the implementation of a uniqueness index that helps discriminate between bona fide targets and background. The effectiveness of this approach is demonstrated using characterized compounds that act on known and noncanonical target classes. The platform is subsequently applied to phenotypic screening hits, identifying candidate targets. The success rate of bead-based affinity capture is discussed.
Introduction
Drug development organizations are facing reductions in drug approvals accompanied by rising costs of research and development.1–4 There are multiple culprits facilitating this trend, including poor clinical trial design and an incomplete understanding of target biology. A culprit that has gained significant attention is low target diversity in drug development pipelines.5–7 This has led many drug developers to implement “nontraditional” techniques to augment their portfolios with fresh targets. One practice is phenotypic screening, which may identify drug candidates that modify disease pathology in unique ways.8–10
Phenotypic screening has multiple advantages over target-based screens. When properly designed, phenotypic screens may produce hits that more often respond positively in animal models and the clinic since a live model was screened instead of an isolated recombinant protein. Additionally, remaining agnostic to the target liberates researchers from preconceived notions of “druggability,” permitting the relevant pathways to self-select. These advantages progress to liabilities when advancing the compound to later stages of the drug discovery process. If a general phenotypic endpoint is used, lead optimization campaigns become unreliable since structural alterations may result in divergent pharmacology while retaining phenotype. This convolutes marker identification, patient selection, and liability assessment. Consequently, the deconvolution of phenotype-driving targets is essential in progressing these drug candidates.11–14
A suite of technologies may be leveraged to deconvolute targets, including hybrid screens,15,16 display technologies,17,18 and protein arrays. 19 A widely used technique is affinity capture (AC), which provides direct evidence of drug–target interaction. 20 AC relies on the generation of affinity probes from the hit compounds using phenotypic structure–activity relationships. After the probes are incubated in lysates, targets bound to the probe are abstracted from the biological milieu and identified by mass spectrometry (MS). AC-based target identification has been successful in profiling kinases,21–23 PARPs, 24 and HDACs. 25 Recently, examples have emerged where AC successfully identified targets of compounds from phenotypic screens.26,27
Despite these successes, AC is hampered by nonspecifically associated proteins, which interfere with differentiation between bona fide targets and background.28,29 To address this liability, we have developed a three-pronged strategy that combines target displacement, reproducibility, and uniqueness to increase the probability of identifying phenotype-driving targets. We further apply this technique to phenotypic screening hits, identifying new target candidates.
Materials and Methods
Materials
2-(2-(2-Aminoethoxy)ethoxy)ethanol was obtained from Anichem (North Brunswick, NJ). Di-tert-butyl dicarbonate was obtained from Chem-Impex International (Wood Dale, IL). Trifluoroacetic acid was obtained from Oakwood Products (West Columbia, SC). 2,2-Dimethyl-4-oxo-3,8,11-trioxa-5-azatridecan-13-oic acid was obtained from Ark Pharm (Libertyville, IL). Affi-Gel resin and Bradford assay were obtained from Bio-Rad (Hercules, CA). Extract Clean SPE reservoirs, caps, and stopcocks were obtained from Grace Davison (Deerfield, IL). Millex filters were obtained from Millipore (Darmstadt, Germany). Trypsin was obtained from Promega (Madison, WI). C18AQ magic reversed-phase resin was obtained from Michrom Bioresources (Auburn, CA). EDTA-free protease inhibitor cocktail was obtained from Roche Diagnostics (Indianapolis, IN). All other reagents were obtained from Sigma-Aldrich (Milwaukee, WI).
Preparation of the Linked Compounds
Synthetic procedures to obtain compound precursors are in the supplemental information. Briefly, the phenolic compound (1 equiv.), dissolved in anhydrous dimethylformamide, was added to 2,2-dimethyl-4-oxo-3,8,11-trioxa-5-azatridecan-13-yl methanesulfonate (1.25 equiv.) and potassium carbonate (3 equiv.). The reaction was stirred at 60–80 °C and monitored by mass spectrometry. The reaction was filtered and the isolated solids washed with 9:1 DMSO/water. Samples were dissolved in 9:1 DMSO/water and purified using a Gilson HPLC with a Waters DeltaPak C18 radial compression column (200 × 25 mm, 15 μm). The products were lyophilized to dryness.
Preparation of Affinity Resins
The linked compounds were dissolved in trifluoroacetic acid (>1 mL/100 mg) and dried under nitrogen. Affi-Gel 10 resin (12.5 mL, 0.188 mmol) was placed in a 25 mL Extract Clean reservoir and drained before washing 5 × 12.5 mL in isopropanol and 2 × 12.5 mL DMSO. The compound (6.25 μmol, 0.033 equiv.) was dissolved in 10 mL of DMSO containing diisopropylethylamine (0.073 g, 3 equiv.) and added to the resin, gently shaking overnight. Loading was confirmed by verifying loss of compound in the supernatant by mass spectrometry and/or high-performance liquid chromatography (HPLC). The resin was washed with 12.5 mL 1 M ethanolamine in DMSO, followed by 2 × 12.5 mL DMSO and 5 × 12.5 mL isopropanol.
Cell and Tissue Lysate Preparation
One tablet of EDTA-free protease inhibitor cocktail was dissolved in 50 mL of lysis buffer (50 mM HEPES [pH 7.5]/150 mM NaCl/0.5% Triton X-100/1 mM EDTA/1 mM EGTA) and chilled to 4 °C. The volume of lysis buffer added to the cells/tissue was four times its mass. The preparations were gently agitated at 4 °C for 30–60 min, then centrifuged (~14 °C) at 20,000g for 30 min. The pooled supernatants were filtered through a Millex 0.45 µm filter and clarified by ultracentrifugation (100,000g, 60 min, ~12 °C). The lysate was divided into 1 mL aliquots prior to freezing. Total protein concentration was determined using Bradford assay.
Affinity Capture–Mass Spectrometry
Sixty microliters of 50% resin slurry was diluted in lysis buffer, mixed, and centrifuged to pellet the resin and remove the solution. The wash was repeated three times before adding 3–5 mg of lysate in 1 mL of lysis buffer. The sample was mixed for 3 h (4 °C) before centrifuging and removing the supernatant. The resin was washed three times in lysis buffer and five times in 50 mM ammonium bicarbonate, pH 7.2. The resin was suspended in 100 μL of ammonium bicarbonate with 0.01 mg/mL trypsin and permitted to digest for 12 h (37 °C) before centrifugation and collection of the supernatant. When conducting competition reactions, 10 μM parent compound was added to the lysate for 12 h (4 °C) prior to treatment with resin.
LC-MS/MS Analysis
The samples were dried in a SpeedVac and reconstituted in 10 µL of water in 0.1% formic acid; 9.5 µL were injected onto a 15 cm capillary column (ID 75 µm) packed with C18AQ magic reversed-phase resin (5 µ particle size, 200 Å pore size). The peptides were eluted using a Waters NanoAcquity in a 35 min linear gradient (15%–35% acetonitrile in 0.1% formic acid) at 0.25 µL/min. The eluent was directed into a LTQ-Velos Orbitrap Pro mass spectrometer. Data-dependent scans were collected in the Orbitrap with tandem mass spectra collected in the ion trap.
Data Reduction and Analysis
LC-MS/MS data files were searched using Mascot Daemon v2.2 (Matrix Science) against the NCBInr mammalian database (August 7, 2012). Search parameters included 2+ to 3+ charge states, two missed cleavages, oxidized methionine variable modification, and mass errors of ±20 ppm for intact spectra and ±0.8 Da for tandem mass spectra. Search results were compiled in Scaffold v2.0 (Proteome Software) and exported to Microsoft Excel. Gene identifications were assigned using in-house software with ambiguous protein entries subjected to BLAST searching against the SWISS-PROT database. All keratin, trypsin, and immunoglobulin proteins were eliminated from the datasets as exogenously introduced contaminants.
Results
Identification of Candidate Compounds from a Cell Viability Phenotypic Screen
The compounds used in this study were derived from a phenotypic screen using the Cell Titer Glo assay against nine non-small-cell lung carcinoma cell lines. The screening results are in preparation for publication and a brief treatment of compound selection follows. The cell lines included Calu-1, Calu-6, NCI-H2009, NCI-H358, NCI-H441, NCI-H1975, NCI-H446, NCI-H522, and NCI-H661 and were chosen based on driver gene status (i.e., Kras mutation, c-Myc amplification). Compounds (~116,000) were screened, and those inducing ≥70% growth inhibition at 5 μM were shortlisted. EC50 values were generated, and hits that reproduced were profiled in several in vitro panels (i.e., kinome). Compounds active in the in vitro panels were set aside in favor of hits driven by unknown targets. Compound analogues were phenotypically profiled to establish structure–activity relationships. Those that contained a site that tolerated chemical expansion with minimal phenotypic liability were transformed into affinity capture reagents. All affinity capture reagents were screened in the cellular panel to verify retention of activity.
An Affinity Capture Resin Matrix Defines the Background Profile in K562 Cell Lysate
When discriminating targets from background, it is useful to understand how often proteins are observed in the biological matrix of choice. This may be accomplished by profiling several affinity capture reagents and cataloging the observational frequency of the background proteins. These data may be compiled into a “uniqueness index,” where the enrichment propensity of proteins is expressed as a percent hit rate (%EPP). The construction of a uniqueness index constitutes the first prong of our approach.
Affinity capture resins typically consist of the compound linked to Affi-Gel 10 resin by an ethylene glycol linker. This linker configuration was found to be generalizable through the testing of many compounds (data not shown); however, background profiles may vary as the linker composition is altered. Nonreacted sections of the resin are capped with ethanolamide. While ethanolamide-capped Affi-Gel 10 resin will nonspecifically associate with protein on its own, its polar nature reduces interactions to nominal levels. The protein background observed in affinity capture experiments is largely governed by the physicochemical properties and linkage vector of the loaded compound in addition to the nature of its target profile. Therefore, to better approximate nonspecific interactions, five compounds of divergent chemotype identified from the cell viability phenotypic screen described above were made into affinity capture resins. Four of the compounds were coupled to resin using multiple linkage vectors, resulting in the production of 15 capture reagents. These reagents are referred to as 1a–1e, 2a–2c, 3a–3c, 4a–4c, and 5 in subsequent figures and supplemental information. No obvious target candidates were initially identified with these reagents when conducting affinity capture. The cellular activities of these compounds were later confirmed to be driven by mitotic arrest precipitated by disruption of microtubule formation (data not shown). Since polymerized microtubules are not commonly amenable to affinity capture methods, these compounds represent excellent tools to assess background since their primary targets will not be specifically enriched and mistaken as frequently observed background proteins.
Background binding was determined by mixing the resins in K562 cell lysate followed by resin isolation, washing, and proteolysis. Experiments were conducted in triplicate. After data compilation, proteins that were introduced contaminants (i.e., keratin) were removed, resulting in the identification of 414 proteins across all 15 resins.
Protein signal was measured in total spectral counts. Spectral counts are defined as the number of times peptides belonging to a protein were detected, isolated, and fragmented by the mass spectrometer. Since the number of observable peptides scales by molecular weight, larger proteins produce higher spectral count levels, rendering intra- and intersample comparisons between proteins of differing molecular weight unreliable. This phenomenon also produces a bias against lower-molecular-weight proteins since they proteolyze into fewer peptides. Since spectral counts also scale by protein abundance, counts may be reproducibly compared to the same protein across experiments within an error window. Examination of the spectral counts produced by the 414 proteins in the dataset revealed many proteins failing to display reproducibility between replicates. Since most of these proteins possessed low spectral counts and were predicted to be medium to high molecular weight, it is unlikely that the stochastic signal is due to a molecular weight signal bias. It is more likely that the lack of reproducibility is driven by the poor enrichment and/or low endogenous levels of the proteins. Consequently, a spectral count cutoff was implemented in order to focus on high-quality, reproducible hits, producing a more accurate uniqueness index. The cutoff was obtained by plotting the percent standard deviation of all proteins enriched from the 15 affinity capture resins against the average spectral count. The plot was funnel shaped (
Examination of the dataset yielded several common background themes across the 15 affinity capture reagents (
Examination of the dataset also revealed proteins whose enrichment profiles suggest preferred compound and/or linkage vector associations. These proteins are shown in Figure 1 . Notable among these proteins are the NAD(P)H quinone dehydrogenases (NQO1/2). The NQO family of dehydrogenases have been previously identified as off-targets for a variety of compounds, including the antioxidant resveratrol 30 and dasatinib. 31 It is possible that vector-specific enrichment of the NQO family, as well as the other proteins in Figure 1 , is indicative of actual binding events against promiscuous and lower-affinity off-targets. Further investigation of the binding mode for these proteins is required to verify their specificity.
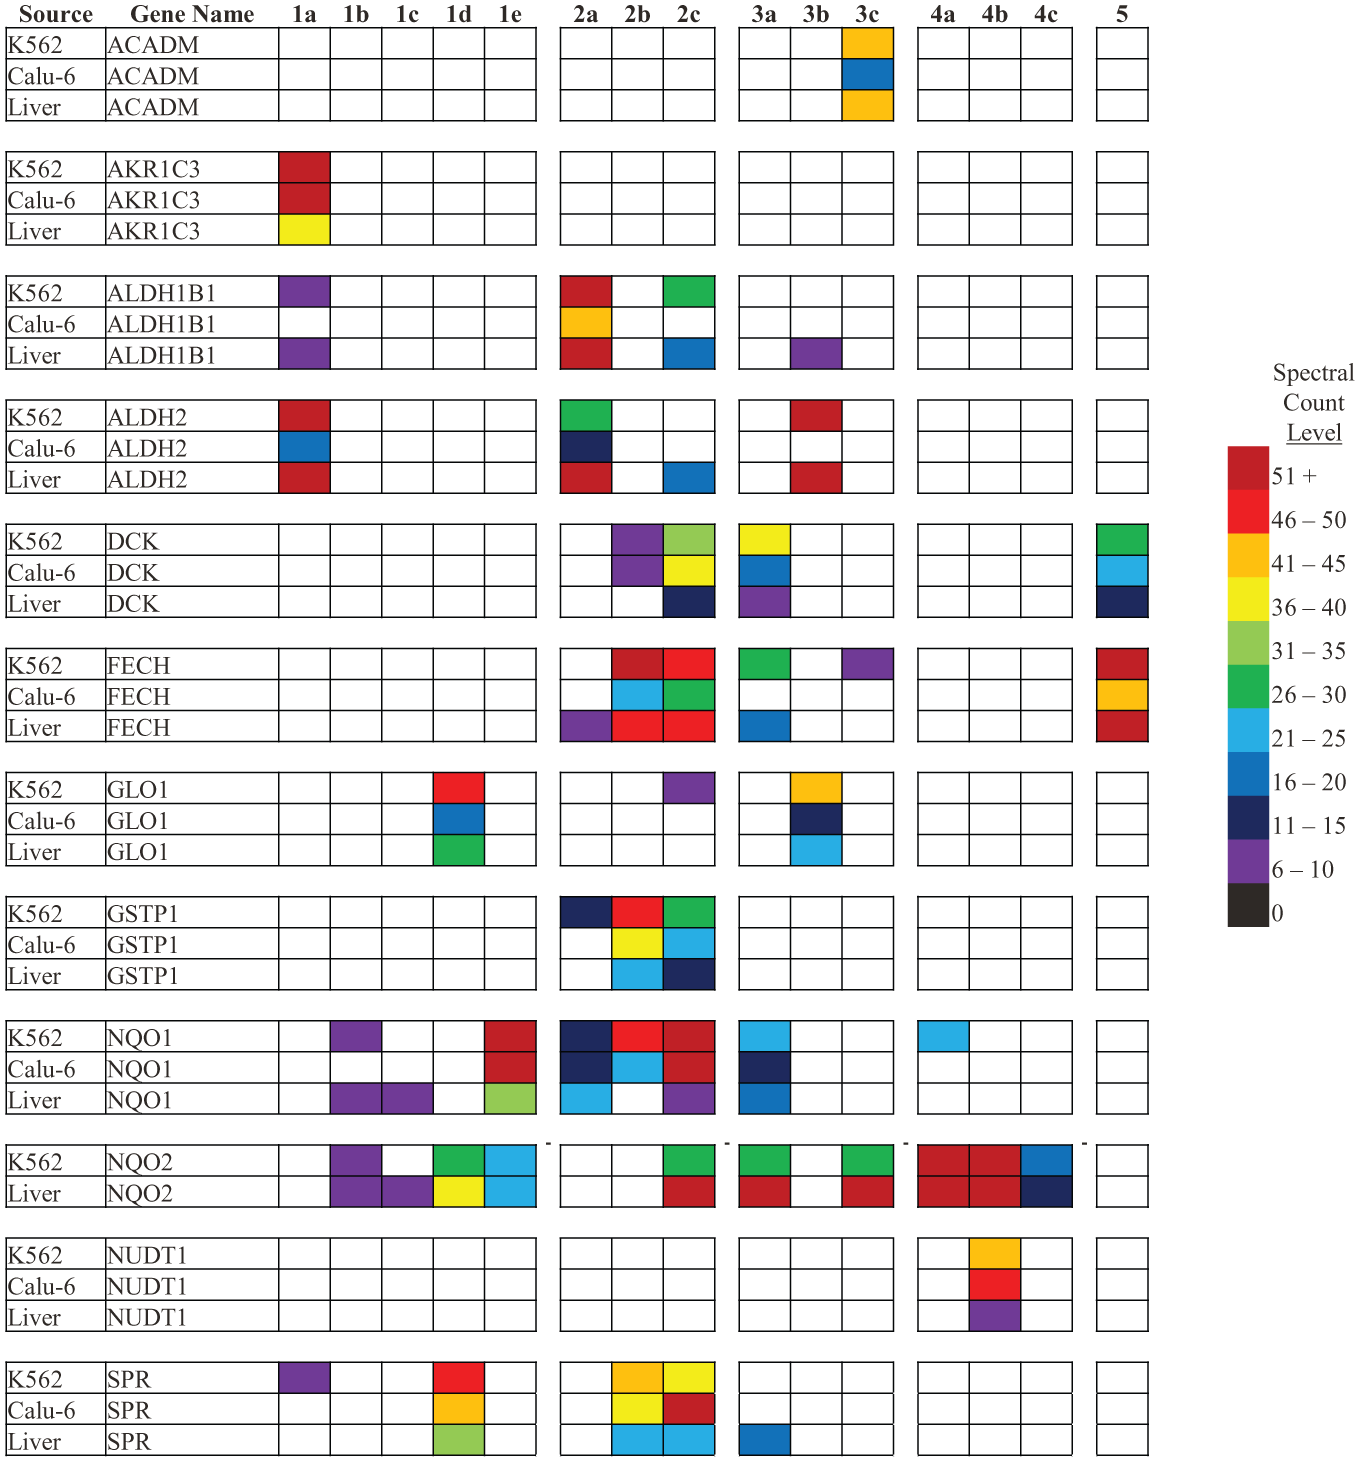
Commonly enriched proteins from K562, Calu-6, and human liver cell lysates that demonstrate compound and/or linkage vector binding specificity. Note that the specificity is largely conserved across cell types.
Background Profiles between Lysate Sources Are Similar
K562 cells are a myeloid leukemia cell line often used as an affinity capture medium since they can be bulked at scale and possess increased protein expression due to their oncogenic nature. Despite these logistical advantages, background profiles, when using other cell types, may not mirror the background observed with K562 cells. To explore this, the non-small-cell lung carcinoma cell line Calu-6 was subjected to affinity capture experiments identical to those described above. The list of protein identifications for the Calu-6 uniqueness index may be found in
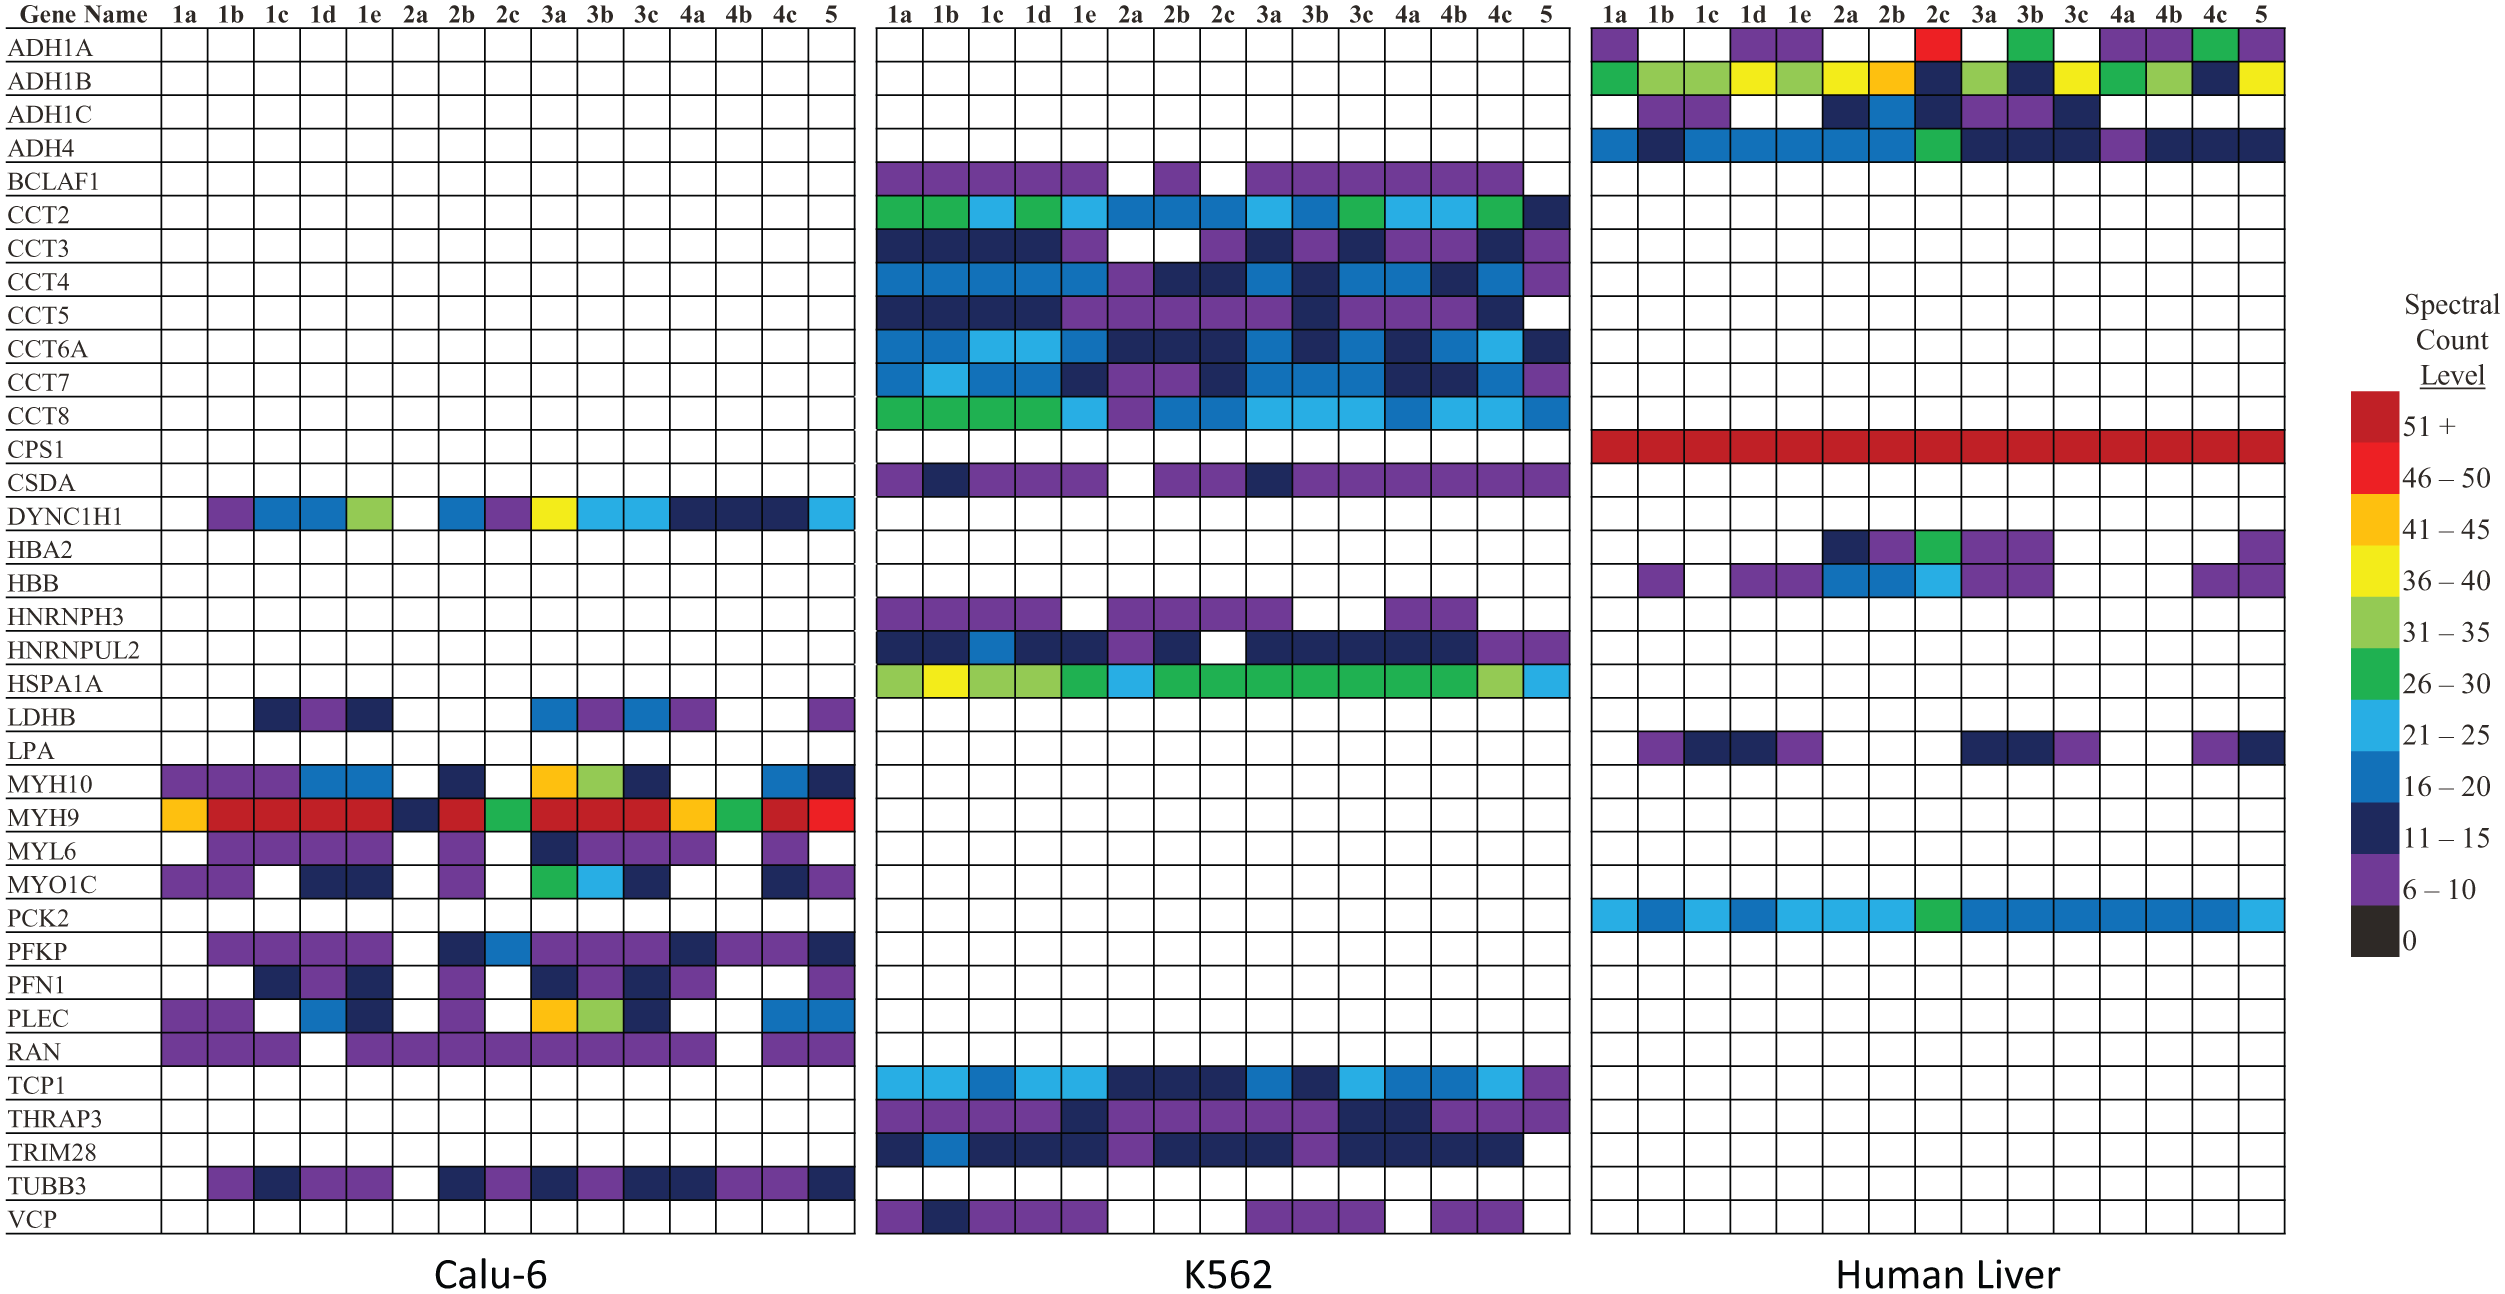
Background proteins broadly associated across all 15 affinity capture resins that are unique to a single cellular source.
Implementation of the Affinity Capture Workflow Deconvolutes Targets across Protein Classes
While the uniqueness index represents the first prong of the target deconvolution strategy, additional metrics reinforce target hypotheses. Affinity capture experiments may be set up in a competitive format, adding parent compound to the cell lysate before the capture reagent to block enrichment (
To examine the ability of displacement experiments to narrow datasets to the principal targets, three compounds of known target profile were examined: a broad-spectrum kinase inhibitor (
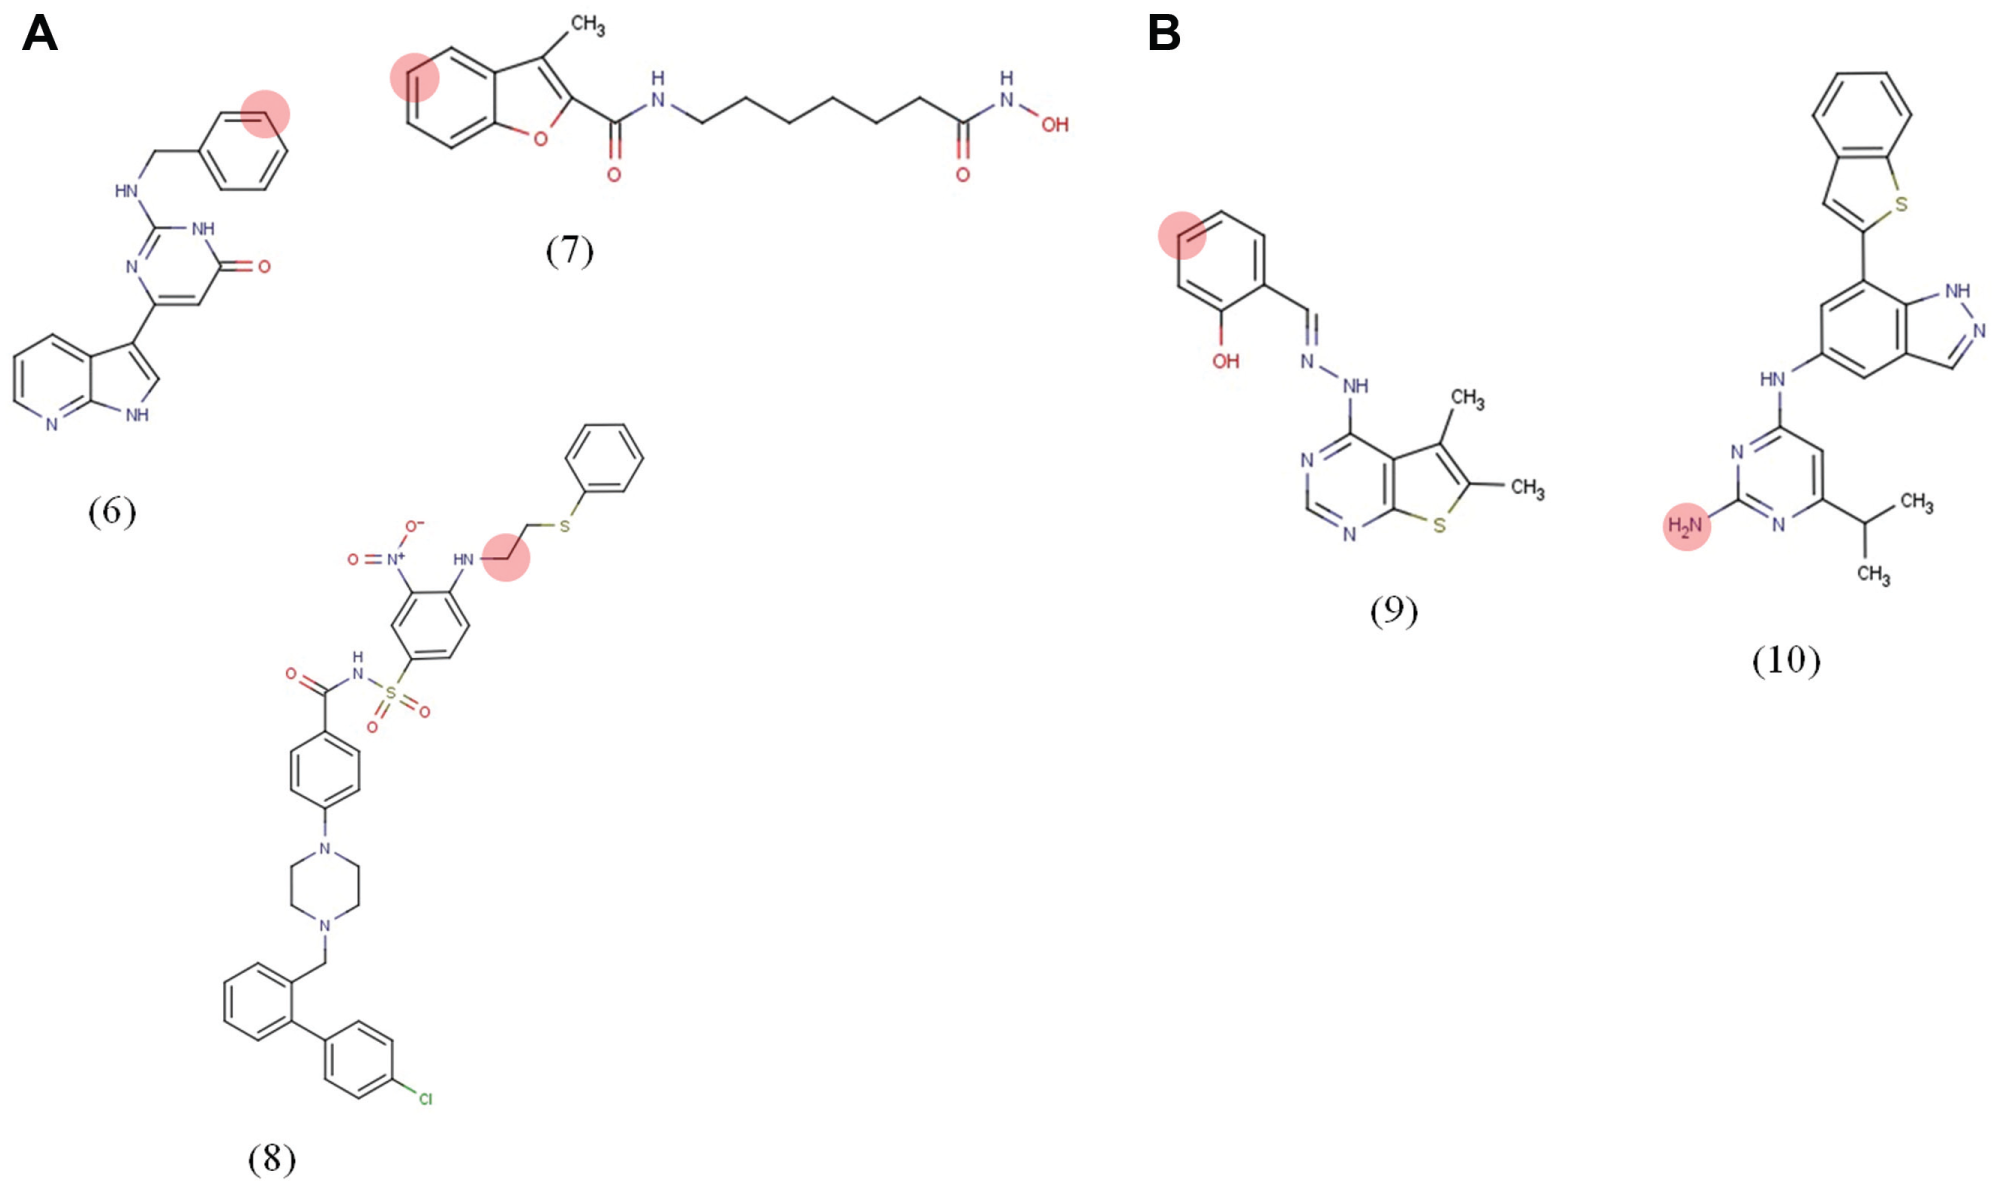
(
Proteins enriched using compounds
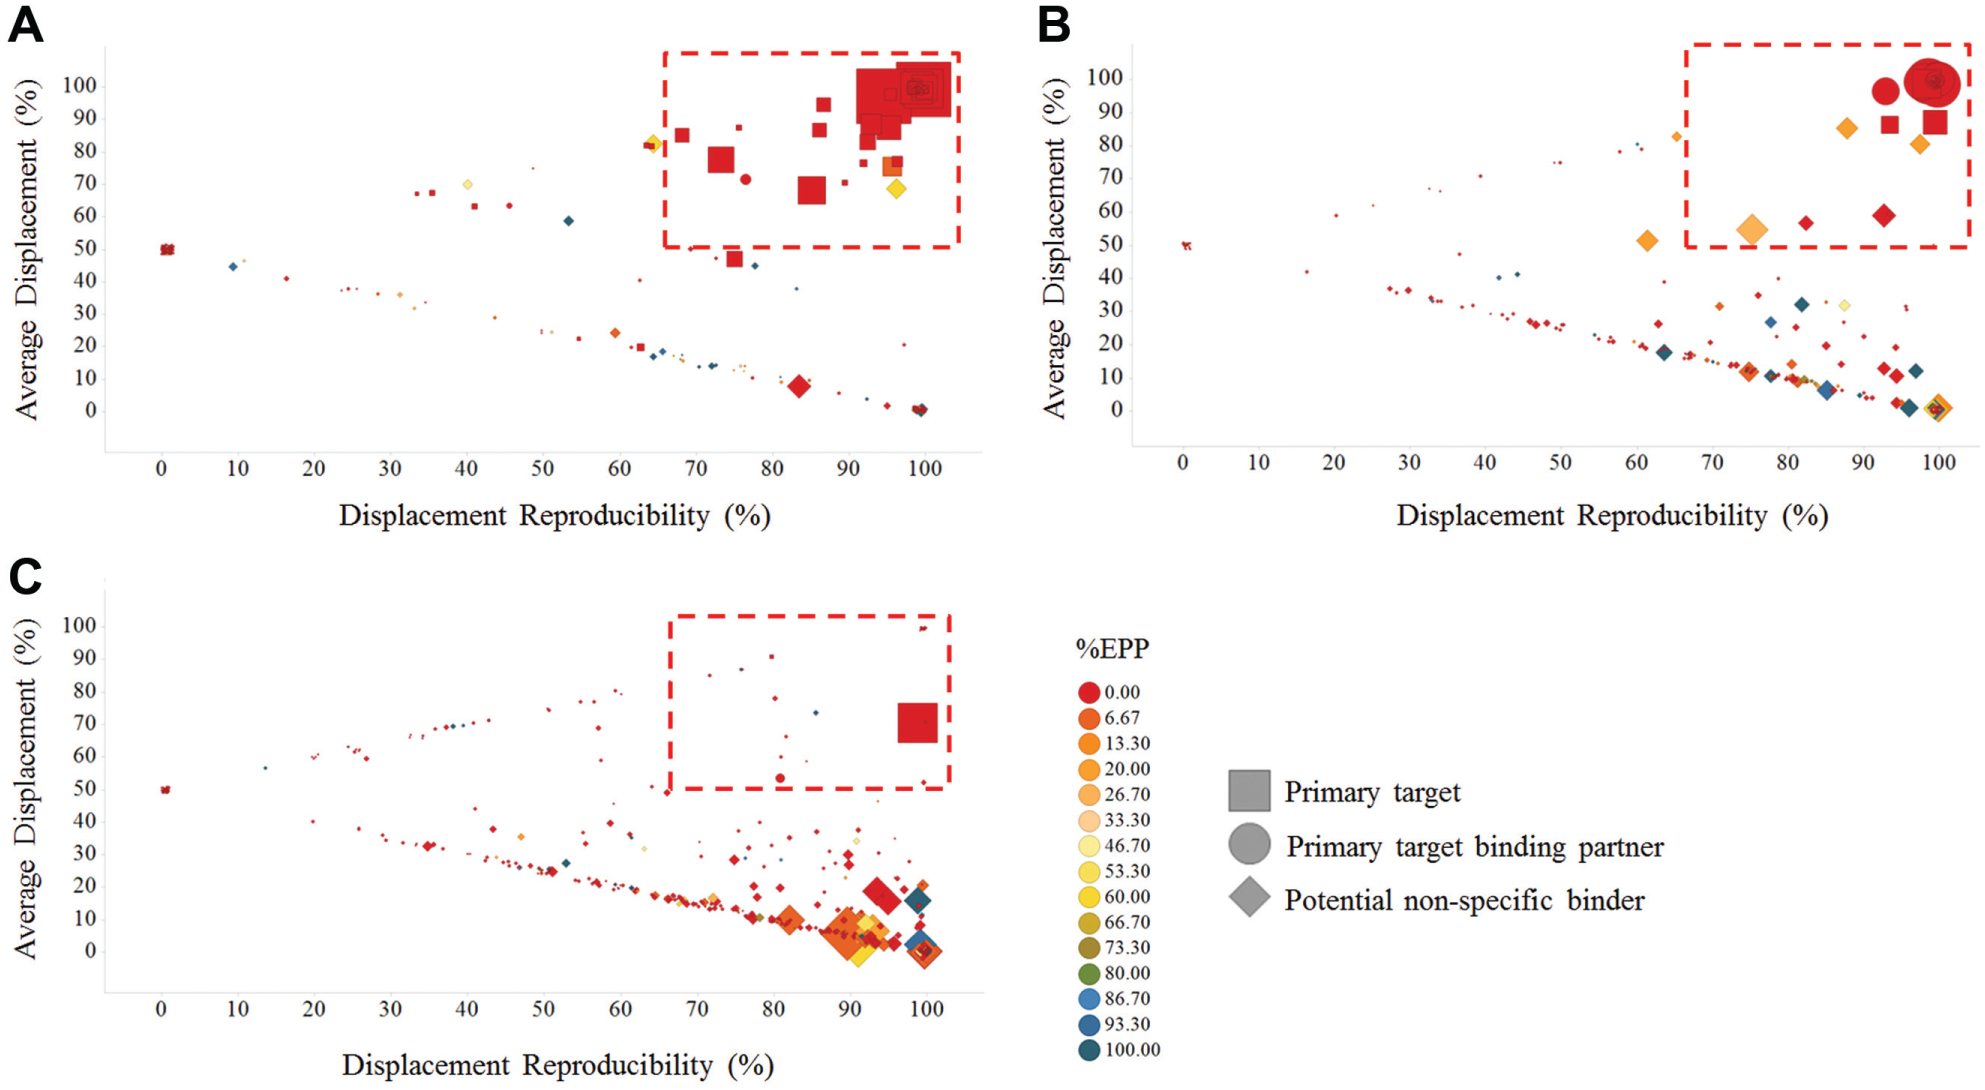
For all affinity capture reagents, the principal targets were successfully identified as highly and reproducibly displaced by parent compound pretreatment, in addition to a low %EPP in the K562 uniqueness index (
Identification of Unique Targets from Phenotypic Screening Hits
Given the successful proof-of-concept studies, the method was applied to two compounds derived from the aforementioned cell viability phenotypic screen (
Fig. 3b
). The sites of linkage were chosen by screening close analogues of the compounds in the cell viability assays and identifying modifications that failed to significantly alter activity. Upon appending a linker at these sites, the probes were rescreened in the cellular assays and shown to retain their activity prior to affinity capture resin generation (
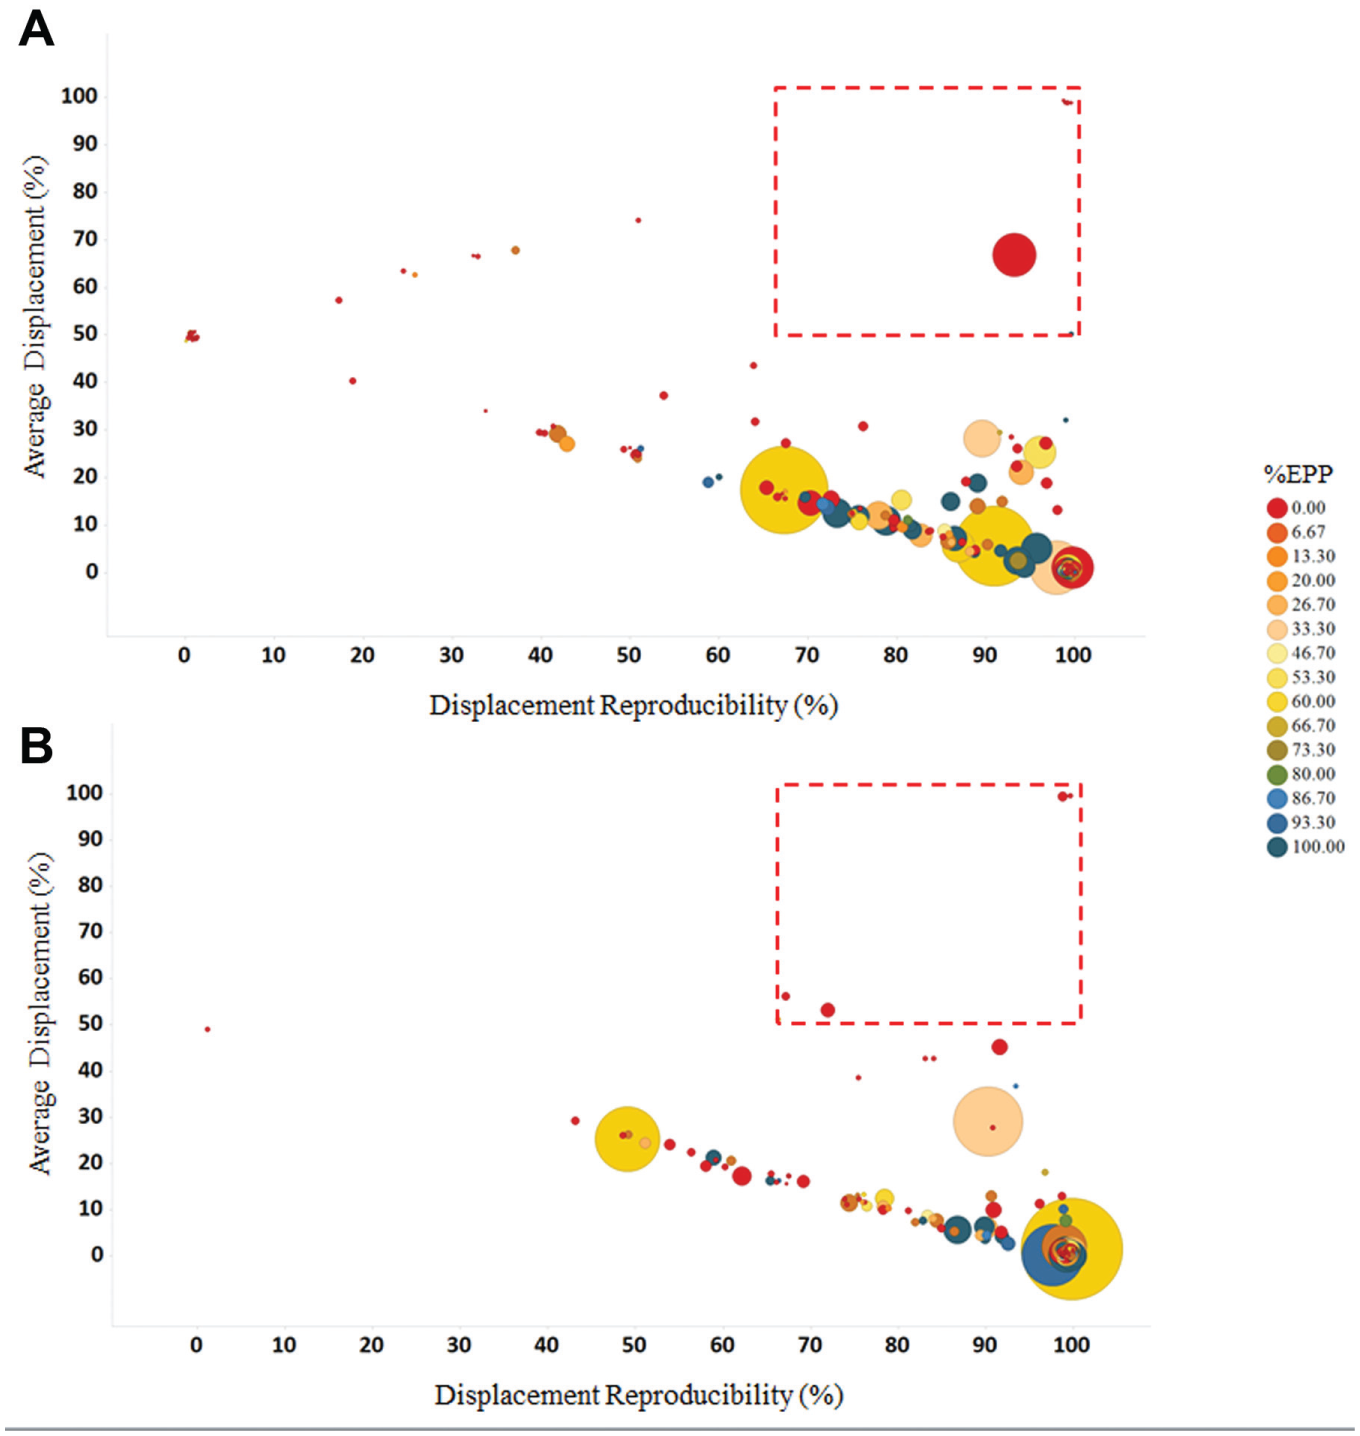
Proteins enriched using compounds
Target Candidates for Hit Compounds from the Cell Viability Screen.
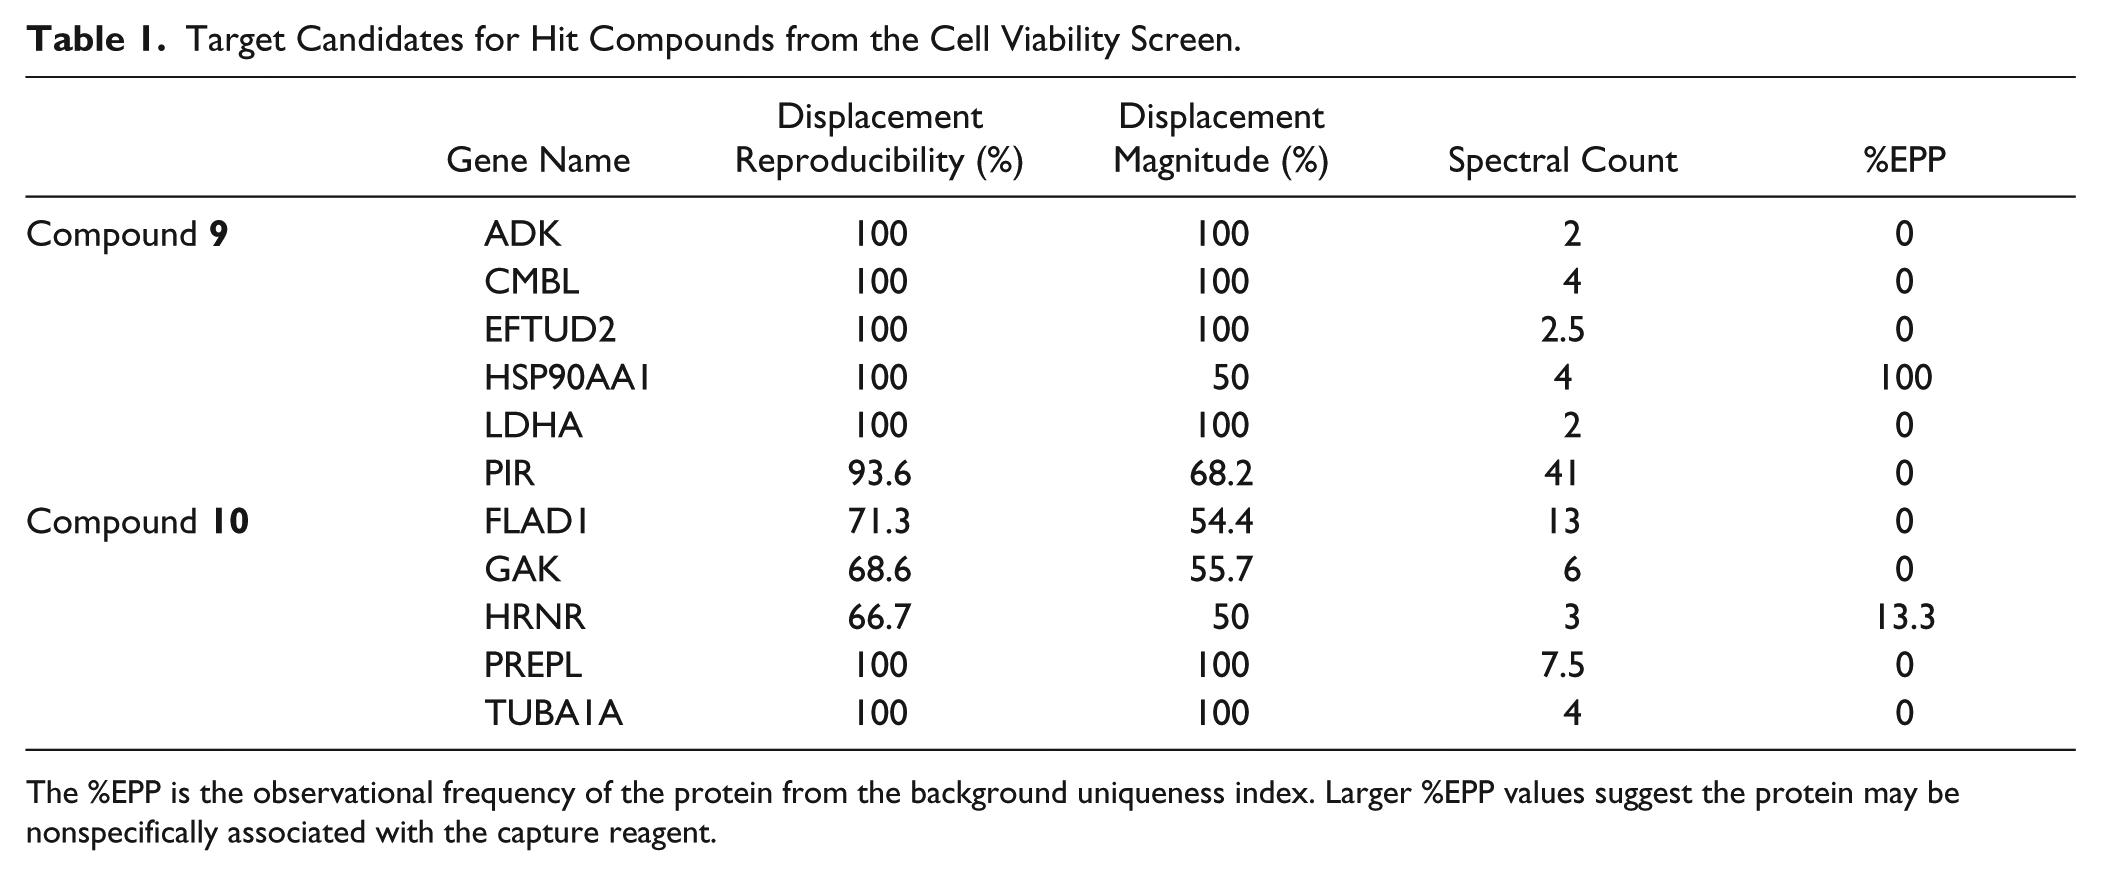
The %EPP is the observational frequency of the protein from the background uniqueness index. Larger %EPP values suggest the protein may be nonspecifically associated with the capture reagent.
Discussion
Phenotypic screening has become increasingly commonplace in modern drug discovery workflows, with the hope of impinging on unique therapeutic targets and mechanisms. The key bottleneck to hit progression in phenotypic screening is an adequate understanding of the molecular targets underpinning the desired phenotype. Affinity capture technologies have historically been relied upon to mitigate the problem; however, capture techniques suffer from several limitations. Before affinity capture experiments may be considered, phenotypic screening hits must be vetted to exclude compounds that work by generalized mechanisms such as metal ion chelation, membrane perforation, and DNA alkylation. Since these mechanisms do not involve the engagement of a target in the traditional sense, affinity capture experiments will fail at the expense of significant resource investment. In addition to vetting the mechanism, the compounds themselves require careful examination. A key consideration is if they display phenotypic structure–activity relationships, suggesting they can be modified into capture reagents without significant loss of activity. A further consideration is whether the compound acts as a prodrug, being cellularly metabolized into an active component. In these cases, affinity capture experiments conducted on beads in lysates may fail to produce the same transformation and, consequently, will not bind the target. Finally, not all target classes and structures are inherently amenable to affinity capture experiments. In particular, multiple-pass integral plasma membrane proteins such as ion channels and G protein–coupled receptors have proven difficult to enrich owing to their propensity to aggregate and precipitate upon cell lysis.
Despite the litany of challenges associated with affinity capture, a large number of targets and compounds remain amenable to the process provided due diligence is observed. In these cases, the key challenge to target identification resides in the discrimination of bona fide targets from background upon collection of the dataset. In some cases, such analyses are simple, requiring perhaps a single displacement experiment (
Examining a large scope of affinity capture data for protein uniqueness is highly useful, but not without fault. As shown in
Figure 4c
, despite extensive analysis of the background commonly observed in K562 lysate, compound
Footnotes
Acknowledgements
The authors would like to acknowledge members of AbbVie’s high-throughput screening and high-throughput biology teams, including Vivek Abraham, Myron Srikumaran, David Fontaine, Patrick Humphrey, Matthew Kurnick, Kenneth Comess, and Manisha Jhala.
Declaration of Conflicting Interests
All authors are employees of AbbVie. The authors declared no potential conflicts of interest with respect to the research, authorship, and/or publication of this article
Funding
The authors disclosed receipt of the following financial support for the research, authorship, and/or publication of this article: The design, study conduct, and financial support for the research were provided by AbbVie. AbbVie participated in the interpretation of data, review, and approval of the publication.
References
Supplementary Material
Please find the following supplemental material available below.
For Open Access articles published under a Creative Commons License, all supplemental material carries the same license as the article it is associated with.
For non-Open Access articles published, all supplemental material carries a non-exclusive license, and permission requests for re-use of supplemental material or any part of supplemental material shall be sent directly to the copyright owner as specified in the copyright notice associated with the article.