
Abstract
The move toward label-free screening in drug discovery has increased the demand for mass spectrometry (MS)–based analysis. Here we investigated the approach of coupling acoustic sample deposition (ASD) with laser diode thermal desorption (LDTD)–tandem mass spectrometry (MS/MS). We assessed its use in a cytochrome P450 (CYP) inhibition assay, where a decrease in metabolite formation signifies CYP inhibition. Metabolite levels for 3 CYP isoforms were measured as CYP3A4-1′-OH-midazolam, CYP2D6-dextrorphan, and CYP2C9-4′-OH-diclofenac. After incubation, samples (100 nL) were acoustically deposited onto a stainless steel 384-LazWell plate, then desorbed by an infrared laser directly from the plate surface into the gas phase, ionized by atmospheric pressure chemical ionization (APCI), and analyzed by MS/MS. Using this method, we achieved a sample analysis speed of 2.14 s/well, with bioanalytical performance comparable to the current online solid-phase extraction (SPE)–based MS method. An even faster readout speed was achieved when postreaction sample multiplexing was applied, where three reaction samples, one for each CYP, were transferred into the same well of the LazWell plate. In summary, LDTD coupled with acoustic sample deposition and multiplexing significantly decreased analysis time to 0.7 s/sample, making this MS-based approach feasible to support high-throughput screening (HTS) assays.
Keywords
Introduction
As part of early drug discovery efforts, high-throughput screening (HTS) plays a very important role in identifying active compounds against therapeutic targets of interest. Furthermore, optimization of the “hits” identified through HTS requires additional in vitro studies to assess ADME properties, as well as other potential liabilities, such as drug–drug interactions (DDIs). In order to identify lead compounds that have acceptable pharmacokinetic and toxicological profiles, attempts have been made to shift these profiling efforts to earlier in the drug discovery process.1,2 Since HTS and HT-ADME groups can generate thousands of samples on a daily basis, it is necessary to have high-throughput analytical platforms capable of processing these demands. Traditionally, these efforts have been undertaken using fluorescent or radiolabeled substrates, which offer very fast sample readout speeds. However, these assays rely on the availability of labeled substrates and often do not function similarly to label-free assays that use native substrates, occasionally resulting in false positives (compounds with active readout but no real activity) or false negatives (undetected active compounds). 3 Additionally, synthesis and handling of labeled substrates can be costly and time-consuming. For these reasons, label-free approaches are desired for their ability to use native, physiologically relevant substrates. Mass spectrometry (MS)–based analysis offers a robust, sensitive, and selective method for monitoring unlabeled substrates and products; however, it has been a challenge to achieve throughputs that approach those of plate-reader-type assays using this format. Since the mass spectrometer itself is capable of very fast detection speeds, the bottleneck for MS-based analysis has been the sample delivery platforms due to their limited throughput capabilities.
Many efforts have been made to increase MS-based throughput over the years, including “cocktail” approaches to assay incubations,4–6 sample pooling prior to analysis, 7 use of short columns, 8 parallel LC-MS, 9 online solid-phase extraction (SPE)–MS/MS, 10 matrix-assisted laser desorption/ionization (MALDI)–MS,11,12 and laser diode thermal desorption (LDTD)–MS/MS. 13 Cocktail incubations and cassette analysis could increase ion suppression due to coeluting compounds and may result in false positive or false negative results due to substrate/metabolite interference, while the parallel LC approach is still limited by time-consuming chromatographic separation and limited autosampler mechanics. MALDI-MS is capable of analysis speeds of around 1 s/well; however, it requires the addition of chemical matrix to samples prior to analysis and is susceptible to ion suppression from endogenous components in samples. Currently, some of the fastest MS-based readout times stand at around 10 s/sample using direct online SPE systems 10 or 3 s/sample using LDTD technology. 13
The RapidFire system is a fully automated front-end platform that couples high-speed online SPE with MS-based detection, and has been successfully used to support various in vitro high-throughput screening and liability assessment assays, which have been described previously.14–16 By combining an ultrafast microfluidic robotic system with custom micro-SPE cartridges, the RapidFire is capable of quickly desalting samples prior to their introduction into the mass spectrometer and is compatible with existing sample extraction procedures. However, sample volume requirements (~40–50 µL) prevent further miniaturization of existing protocols to accommodate increasing throughput demands (as is typical in a lead discovery/HTS environment), and at 10 s/sample, it is not comparable to the analysis speeds of fluorescence-based plate readers.
Laser diode thermal desorption (LDTD) technology has emerged as another ultrafast approach to label-free, MS-based analysis. The LDTD source uses an infrared laser to thermally desorb samples that have been dried onto a stainless steel surface of a multiwell LazWell plate (96 or 384). The neutral, gas-phase molecules then undergo atmospheric pressure chemical ionization (APCI) to generate ions for detection via tandem mass spectrometry (MS/MS). It is worth mentioning that because LDTD relies on APCI for ionization, the native probe substrate being monitored must be amenable to LDTD-APCI ionization in order to be analyzed using this approach. LDTD-MS/MS analysis allows for cycle times of 2–6 s/well and accommodates sample volumes below 10 µL/well, much lower than what is required for online SPE-MS/MS systems. Most current applications of this platform, however, require the use of manual or robotic tip-based liquid handling systems to deposit samples onto the stainless steel plates prior to LDTD analysis. 17 These tip-based sample deposition methods add significant time and cost to the sample preparation procedure. To overcome the limitations of tip-based systems and reduce the number of steps and cost of sample preparation for LDTD-MS/MS readout, a different (non-tip-based) sample deposition method should be employed, a method that would allow quick and accurate transfer of ultralow (submicroliter) sample volumes into the stainless steel LazWell plates. Ability to transfer submicroliter volumes would also reduce matrix content within the well and could potentially improve overall assay robustness. In addition, it would allow sample multiplexing (i.e., depositing the samples from multiple assays into the same well) for parallel LDTD-MS/MS analysis, thus significantly improving overall assay cycle times and reducing the assay cost.
Acoustic droplet ejection (ADE) or acoustic sample deposition (ASD) technology offers an elegant method of noncontact acoustic liquid transfer from one plate to another that is perfectly suited for sample delivery onto LazWell plates and achieves all of the aforementioned benefits of a non-tip-based sample deposition method. This is done by focusing ultrasonic energy at the meniscus of the fluid sample to eject small droplets of liquid from the surface of the open well. This technology allows an accurate transfer of nanoliter volumes (as 2.5 nL droplets) traveling upward from the source plate directly into the destination plate. 18 It has been shown to be very precise and eliminates many disadvantages of tip-based transfers, such as cross-contamination and leaching, and can reduce cost.
In this article, we describe a novel high-throughput MS-based approach that couples acoustic droplet ejection for sample deposition with LDTD for mass analysis. Three human liver microsome (HLM) cytochrome P450 (CYP) inhibition assays (CYP3A4, CYP2D6, and CYP2C9) were used to demonstrate the utility of this approach. The CYP superfamily of hemoproteins is responsible for oxidative metabolism of endogenous and exogenous compounds. Inhibition of CYP-mediated metabolism can affect clearance and efficacy of coadministered drugs and is the most common cause of clinical DDI. Therefore, estimation and subsequent reduction of DDI risk is essential to nomination and successful development of clinical candidates. Conventionally, HLM CYP inhibition assays utilize physiologically relevant substrates and typically involve liquid chromatography–tandem mass spectrometry (LC-MS/MS) analysis, which is time-consuming and would take several hours to analyze one 384-well plate. While the RapidFire system has been used to support CYP inhibition assays at a speed of 10 s/well, the large sample volume requirements (~40–50 µL) prevent further miniaturization of existing protocols to accommodate increasing throughput demands.
A method has been developed that employs ASD directly from assay plates onto the stainless steel (LazWell) LDTD-MS/MS plates. Metabolites of CYP3A4, CYP2D6, and CYP2C9 probe substrates from assay samples were analyzed using this approach, and the results were also compared to those obtained by RapidFire. To further reduce the overall sample analysis, we used the acoustic deposition method to enable postreaction sample multiplexing, by combining multiple samples into a single LazWell plate for simultaneous analysis. By combining acoustic sample deposition, postreaction sample multiplexing, and ultrafast LDTD-MS/MS analysis, it was possible to generate data at speeds below 1 s/assay sample, which approaches the speed of fluorescence-based plate readers. This methodology provides a feasible label-free screening alternative to support HTS and HT-ADME efforts in drug discovery.
Materials and Methods
Materials
Diclofenac, dextromethorphan, midazolam, 4′-OH-diclofenac, dextrorphan, 1′-OH-midazolam, clotrimazole, quinidine, ticlopidine, sulfaphenazole, ketoconazole, verapamil, furafylline, tienilic acid magnesium chloride, and ethylenediaminetetraacetic acid (EDTA) were purchased from Sigma-Aldrich (St. Louis, MO). Montelukast, paroxetine, fluvoxamine, and mibefradil were purchased from Toronto Research Chemicals, Inc. (North York, Ontario, Canada). Pooled human liver microsomes (HLMs), [13C6]-4′-OH-diclofenac, [2H3]-dextrorphan, and [13C3]-1′-OH-midazolam, were purchased from Corning Discovery Labware (Woburn, MA). NADPH was purchased from Akron Biotech (Boca Raton, FL). Echo-qualified 384-well low-dead-volume microplates and 384-well echo-qualified polypropylene microplates were purchased from LabCyte, Inc. (Sunnyvale, CA). LazWell 384-well plates were purchased from Phytronix Technologies, Inc. (Quebec, Canada). All other reagents and chemicals were purchased from commercial sources and were of analytical grade and of the highest purity available.
Inhibition Studies
Sample Preparation for Assay Incubation
Test compounds and their highest concentrations in the assays are listed in
Assay Incubations
Specific parameters of the incubations (e.g., substrate and protein concentrations, assay buffer, and incubation time) for each assay are shown in
Sample Preparation for Analysis
LDTD
Samples were transferred via acoustic sample deposition directly from the assay plate onto LazWell plates using the aqueous calibration (384PP_AQ_BP) on ECHO 550. The transfer volume was 100 nL. Samples were allowed to air-dry prior to LDTD-MS/MS analysis.
RapidFire
Microsomal fractions were precipitated by centrifugation at 2500 × g for 10 min prior to SPE-MS/MS analysis.
LDTD-MS/MS
The laser diode thermal desorption (LDTD)–MS/MS system included the LDTD S-3840 (Phytronix Technologies, Quebec, Canada) and a Sciex 4500 TripleQuad (Sciex, Foster City, CA) mass spectrometer. The LDTD source uses solvent-free atmospheric pressure chemical ionization (APCI) to generate ions from thermally desorbed neutral molecules. Analysis is performed using selected reaction monitoring (SRM) methods that follow mass transitions of the reaction product (metabolite) and those of the stable isotopically labeled (SIL) IS. The source temperature was set to 0 °C, curtain gas (CUR) was set at 10, nebulizer gas (GS1) was set at 60, collision gas (CAD) was set at 8, and the nebulizer current (NC) was 4 mA in the positive ionization mode. In-house compressed air was used as the source gas for all analytes, and the gas flow was set at 3.0 L/min. All other MS/MS parameters and conditions can be found in
RapidFire-MS/MS
The RapidFire-MS/MS system consisted of a RapidFire 300 HT System (Agilent Technologies, Santa Clara, CA), which performs high-throughput online solid-phase extraction (SPE) sample purification, and a Sciex 4500 TripleQuad mass spectrometer using a Turbo V ion source with an electrospray ionization (ESI) probe (Sciex). The Turbo V source temperature was maintained at 600 °C, and nitrogen was used as the source gas for all analytes. For all assays, positive ionization was used in the selected reaction monitoring (SRM) scan mode. For the CYP3A4 assay, the curtain gas (CUR) was set at 25, the nebulizer gas (GS1) was set at 60, the auxiliary gas (GS2) was set at 60, and the collision gas (CAD) was set at 10. The ionspray voltage used was 5500 V. For the CYP2D6 assay, CUR was set at 30, GS1 was set at 45, GS2 was set at 45, and CAD was set at 10. The ionspray voltage used was 4500 V. For the CYP2C9 assay, CUR was set at 30, GS1 was set at 40, GS2 was set at 40, and CAD was set at 10. The ionspray voltage used was 2750 V. For all other MS/MS parameters and conditions, refer to
Data Analysis
The signal intensity (peak area) of the metabolite was normalized to the signal of the IS in the same sample; thus, the sample signal intensity was expressed as a signal ratio. The sample signal ratio was then normalized to the signal ratio of the reactions performed in the absence of the test substance (solvent control, total signal, 0% inhibition) and the reactions performed in the absence of enzyme (background signal, 100% inhibition). These normalized results were expressed as the percentage of inhibition calculated as shown in eq 1:
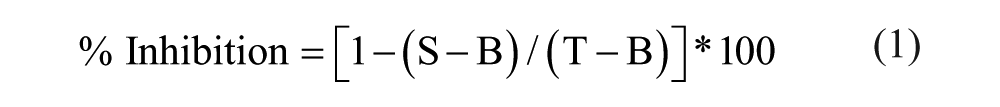
where S = sample signal, T = average total signal, and B = average background signal.
The results were then imported into custom curve-fitting software, which uses the MathIQ package (ID Business Solutions, Ltd., Guilford, England) to determine the IC50 values for each test compound. The IC50 was defined as the concentration corresponding to the 50% inhibition derived from the fitted 10-point curve using a four-parameter logistic regression model, as shown in eq 2:

where Y = response at a given concentration of inhibitor (X), A = minimum response, B = maximal response, D = Hill coefficient (slope), and C = X at which Y = A + [(B – A)/2].
Results and Discussion
Standard Curves of CYP Metabolites
HLM assays assess CYP inhibition through incubation of the test compound with pooled HLM, NADPH, and a probe substrate that is metabolized into a CYP isoform-specific metabolite. If the test compound causes inhibition, less of that specific metabolite is formed. LDTD-MS/MS quantifies the metabolite levels as well as the levels of an IS added postreaction, which is necessary for normalization of the metabolite peak to the injection volume and helps account for injection-to-injection MS variability. The initial proof-of-concept experiments were conducted to show that metabolites for all three chosen CYP–substrate pairs were detectable in a quenched assay matrix using LDTD after acoustic deposition of a 50 nL sample volume onto a LazWell plate. The standard curve plots of analyte concentration versus area ratio (linear regression with 1/x weighting) are shown in
Optimization of Assay Conditions
Sample incubation conditions were not altered during the optimization process. However, to improve acoustic transfer, as well as LDTD sensitivity, the quench solution was modified. Since empirical evidence indicates that even low acid concentration can have a negative impact on desorption, and Wu et al. 13 were successful in LDTD analysis of CYP inhibition samples using 0.05% acid concentration, the concentration of formic acid in our quench solution was reduced to 0.05%. This 10-fold reduction from the RapidFire methods meant that the acid concentration was no longer sufficient to completely terminate the enzymatic reaction; therefore, the low-acid quench solution required higher organic content. The usual acetonitrile concentration of 2.5% had to be increased sufficiently to stop the reaction, yet, at the same time, be kept low enough to minimize the splattering of the samples during acoustic deposition, an observed effect of increased organic content in a sample. Five acetonitrile concentrations were tested, ranging from 2.5% to 50%, to find the concentration that would be optimal for both LDTD and acoustic deposition. We found that an acetonitrile concentration of 2.5% resulted in increased data variability, while concentrations greater than 15% caused splatter during sample transfer. The final optimized acetonitrile concentration was 12.5%, which resulted in the most accurate acoustic deposition as well as most reproducible standard curve data.
Beattie et al. 17 identified certain compounds that showed a great deal of variability in the desorption process, which yielded a low signal and high percentage coefficient of variation (CV) with LDTD-MS/MS as opposed to LC-MS/MS analysis, and hypothesized that these compounds may be binding to the metal surface of the LazWell plate. In order to alleviate this phenomenon, it was suggested by the LDTD vendor that coating the plates with EDTA could improve the desorption of certain compounds. However, coating the surface of plates would be a cumbersome process for a high-throughput environment; thus, we investigated the addition of EDTA to the quench solution instead. Of the five EDTA concentrations (50–1000 µg/mL) that were tested, the 200 µg/mL concentration was chosen as the most advantageous for the CYP2C9 metabolite, improving the estimated LOQ for 4′-OH-diclofenac from 62.5 nM to 31 nM. No improvement of LOQ was seen in CYP2D6 and CYP3A4 metabolite detection; therefore, in further experiments, EDTA was not added to the quench solutions for these two assays.
Optimization of Acoustic Sample Deposition
The sample volume to be transferred from the assay plate into the LazWell plate was explored to balance the needs of three factors: speed of sample transfer, time needed for samples to air-dry prior to LDTD-MS/MS analysis, and effect of transferred volume on the signal intensity. The typical volume of the sample transfer using the traditional, tip-based pipetting methods is more than 1–2 µL. Although LDTD signals at these volumes were robust, the samples required extended drying times prior to LDTD analyses. In addition, it was reported by Beattie et al. 17 that microliter-volume deposits of samples, particularly those with high protein content, could cause uneven desorption of the analyte from the LazWell plate. Also, the microliter-volume deposits often resulted in split peaks from overloading the single well. In order to address this problem, an offline dilution step was used prior to sample deposition in order to prevent the suppression from overloading. Since acoustic sample deposition allows for accurate sample transfer at a volume as low as 2.5 nL, the need for sample dilution has been completely eliminated. We also observed that there was virtually no drying time required for deposited volumes up to 200 nL, and they could be analyzed as soon as transfer was completed. Our particular acoustic deposit instrument performs transfer in increments of 2.5 nL droplets; therefore, as the transfer volume increases, so does the time needed for the transfer. A transfer of 50 nL/well was completed in 2.22 min (including movement of plates in and out of the instrument) for a 384-well plate, whereas a 200 nL/well transfer took approximately twice as long. We chose to test three transfer volumes: 50 nL from our proof-of-concept experiment, 200 nL as the maximum volume to avoid the need for additional air-dry time, and 100 nL as a midrange volume. Heudi et al. 19 demonstrated that the amount of sample available for desorption from a well of the LazWell plate can affect the LDTD signal strength. We found that increasing the volume from 50 nL in our original experiments up to 100 nL resulted in a noticeable improvement in sample intensity. Increasing the volume up to 200 nL did not demonstrate any further significant improvement of the sample signal, compared to 100 nL, that would warrant an additional 1.25 min of sample transfer time (4.25 and 3 min, respectively) per plate. Therefore, the 100 nL transfer volume was used in all follow-up experiments.
Optimization of LDTD Conditions
The LDTD conditions were optimized to give the fastest sample readout possible while maintaining sufficient signal and optimal peak shape. The laser pattern controls the power of the laser diode radiation applied to the back of the LazWell plate over a period of time. Increasing the percentage of laser power applied to the back of the stainless steel well results in higher energy transfer to the sample for desorption. In most applications of LDTD-MS/MS analysis, the laser power was ramped over a period of a few seconds and then held long enough to desorb the entire contents of the well. However, because of the very low sample deposition volume (100 nL) used for our analysis, it was determined that the time required to desorb the contents of the well was significantly shorter than that of previous methods using sample volumes from 1 to 6 µL. The original laser pattern used for analysis of CYP3A4, CYP2D6, and CYP2C9 inhibition assays, as recommended by the manufacturer, involved ramping the laser power from 0% to 65% over a 3 s period and holding at 65% for 2 s, with a total cycle time of around 6 s/sample. A much shorter laser pattern was implemented, which consisted of a step from 0% laser power to 100% laser power at 0.4 s and a hold at 100% until 0.8 s. The resulting peaks were much sharper, measuring 0.39 s in width for each metabolite and IS, and the resulting signal intensity was comparable to that of the original method. Because of this, it was determined that the full contents of the well were being desorbed successfully during the much shorter laser pattern. The resulting increase in throughput enabled us to reduce cycle times for discrete analysis of CYP3A4, CYP2D6, and CYP2C9 metabolites from more than 6 s/well to 2.14 s/well.
Inhibition Assays
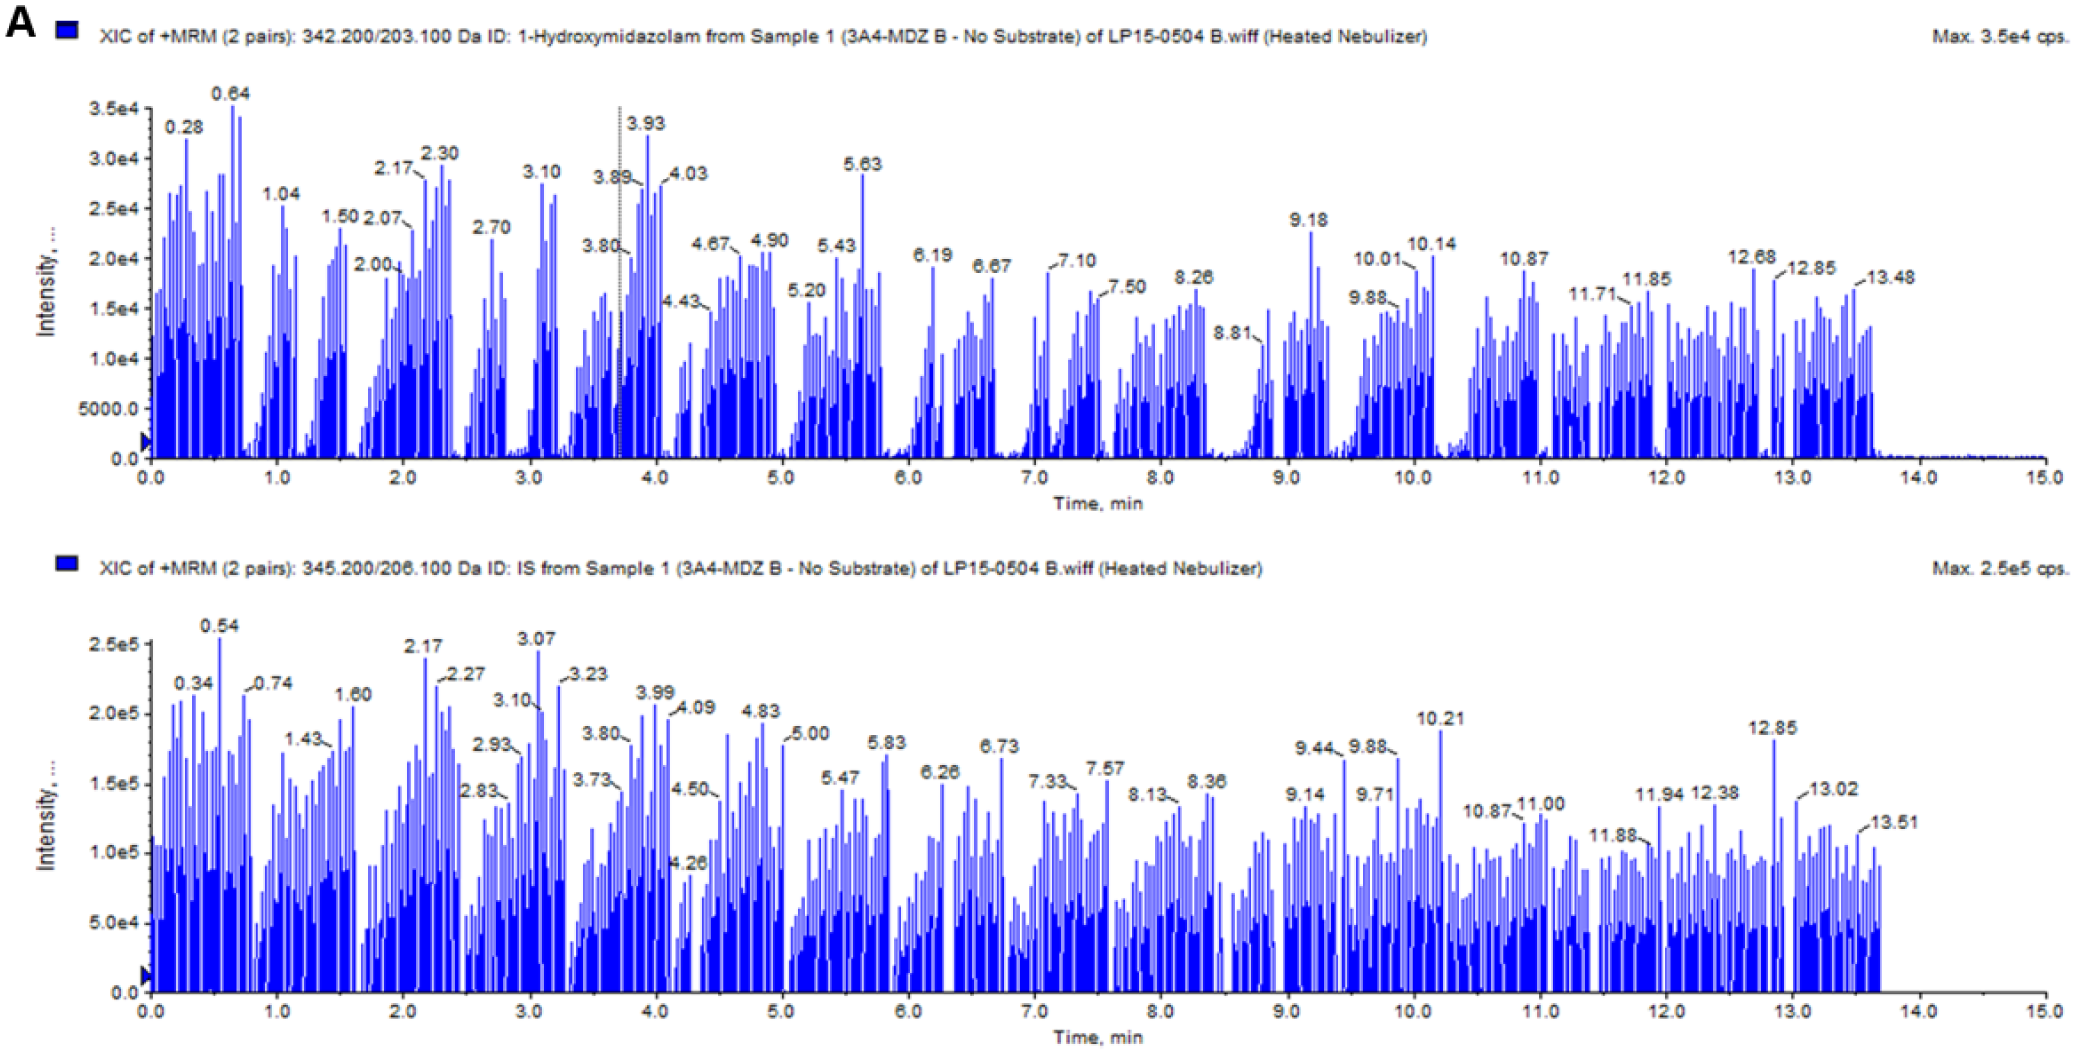
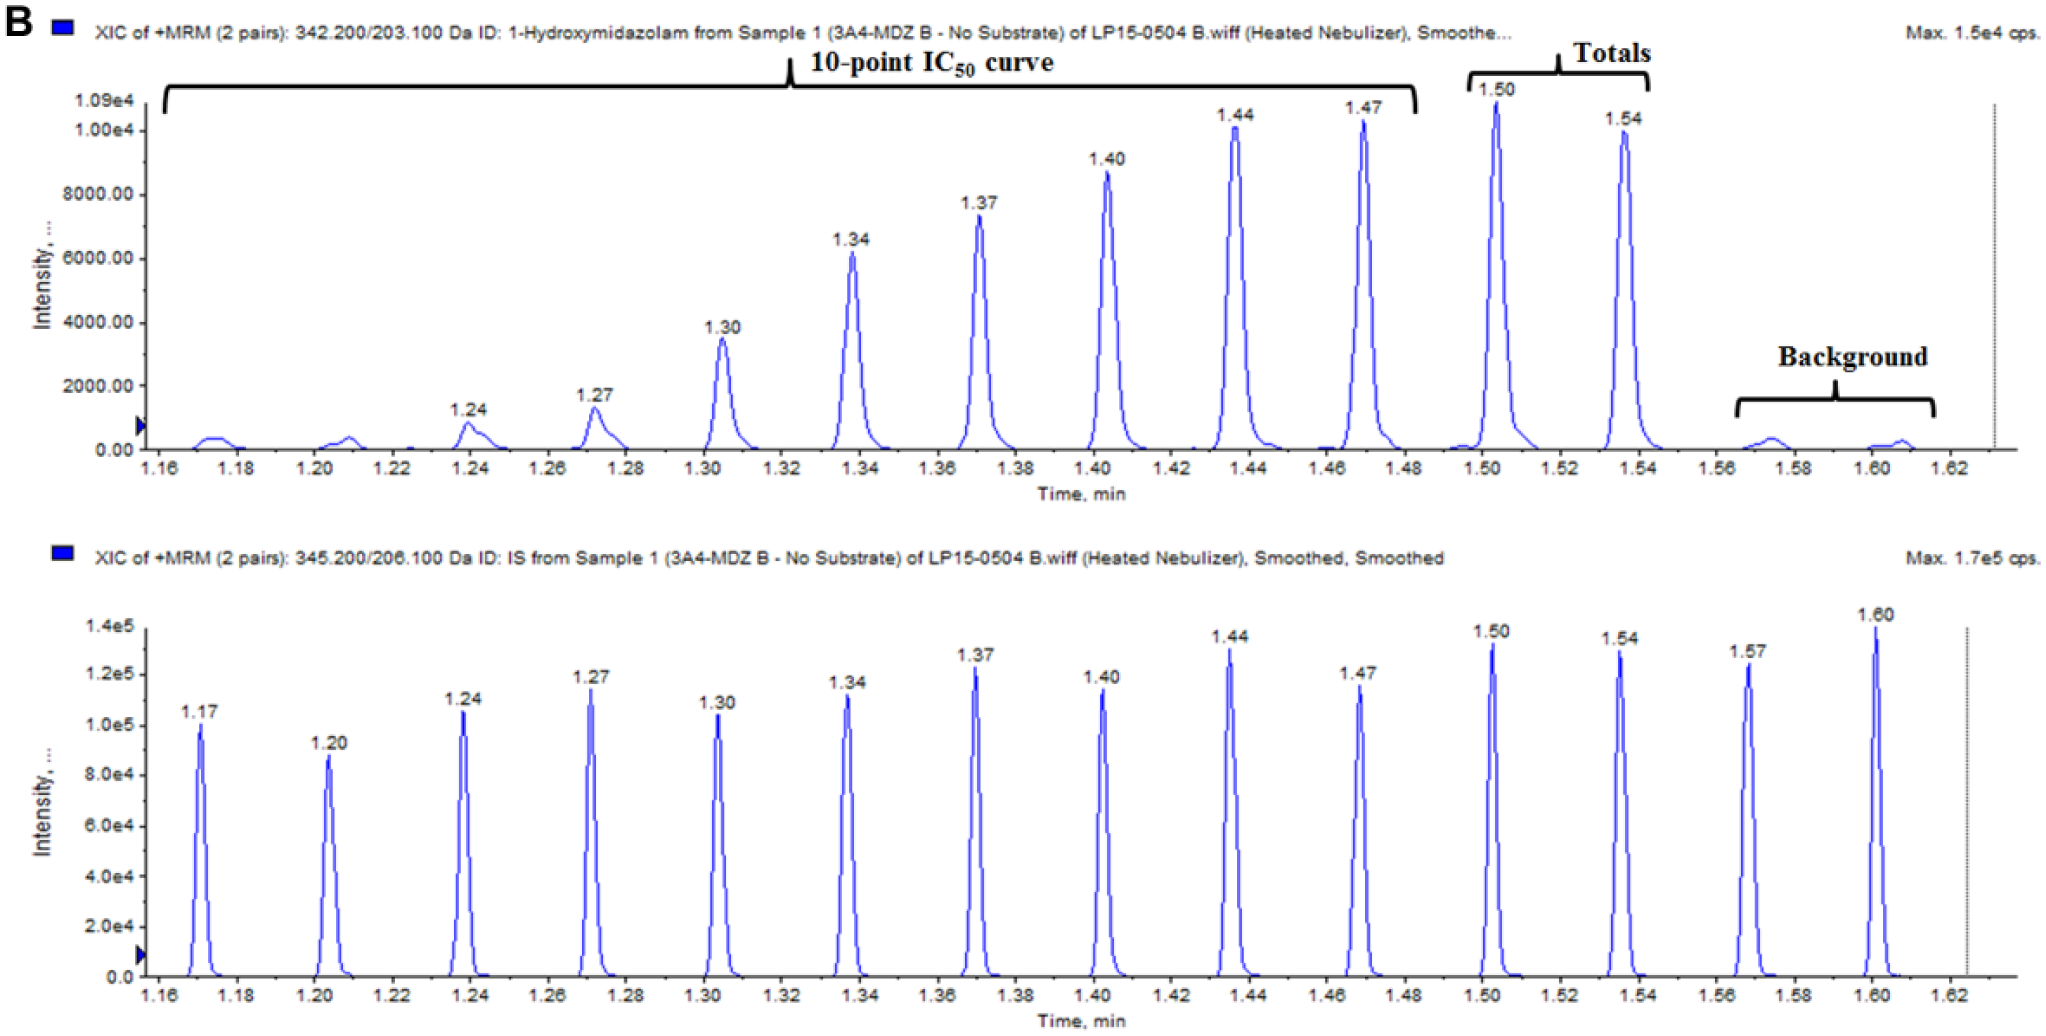
Twelve known inhibitors of various cytochrome P450 enzymes and DMSO (solvent control) were tested as positive and negative controls in the time-dependent inhibition assay using human liver microsomes. Following acoustic sample transfer onto a 384-well LazWell plate, quenched reaction samples were first analyzed by LDTD, and then the remainder of the sample volume in the original assay plates was analyzed using the RapidFire system to compare results. Figure 1A depicts LDTD-MS/MS intensity versus time plot for the analysis of a CYP3A4 384-well plate. The analyte peaks from the entire plate resulting in IC50 curves are clearly seen in the top view of the plot, while the bottom view shows a reasonably consistent signal of the IS used for normalization of the metabolite peak to the sample volume in the well. An enlarged version of both the analyte and IS is shown in Figure 1B . Here we can also see the significant difference between the total signal (solvent control) and background signal, where no metabolic reaction occurred. The timeline on the x axis indicates that approximately 28 s elapsed during the analysis of the 14 peaks, which calculates to ~2 s/sample. Overall, the entire 384-well plate was analyzed by LDTD in 13.68 min, giving us an analysis speed of 2.14 s/sample. In contrast, analysis times for metabolites of all 3 CYPs by the RapidFire system are in the 10 s/sample range ( Table 1 ). Therefore, LDTD-MS/MS reduced the analysis time for one 384-well plate by approximately 80%.
(
Comparison of Analysis Speed: RapidFire vs LDTD-MS/MS.
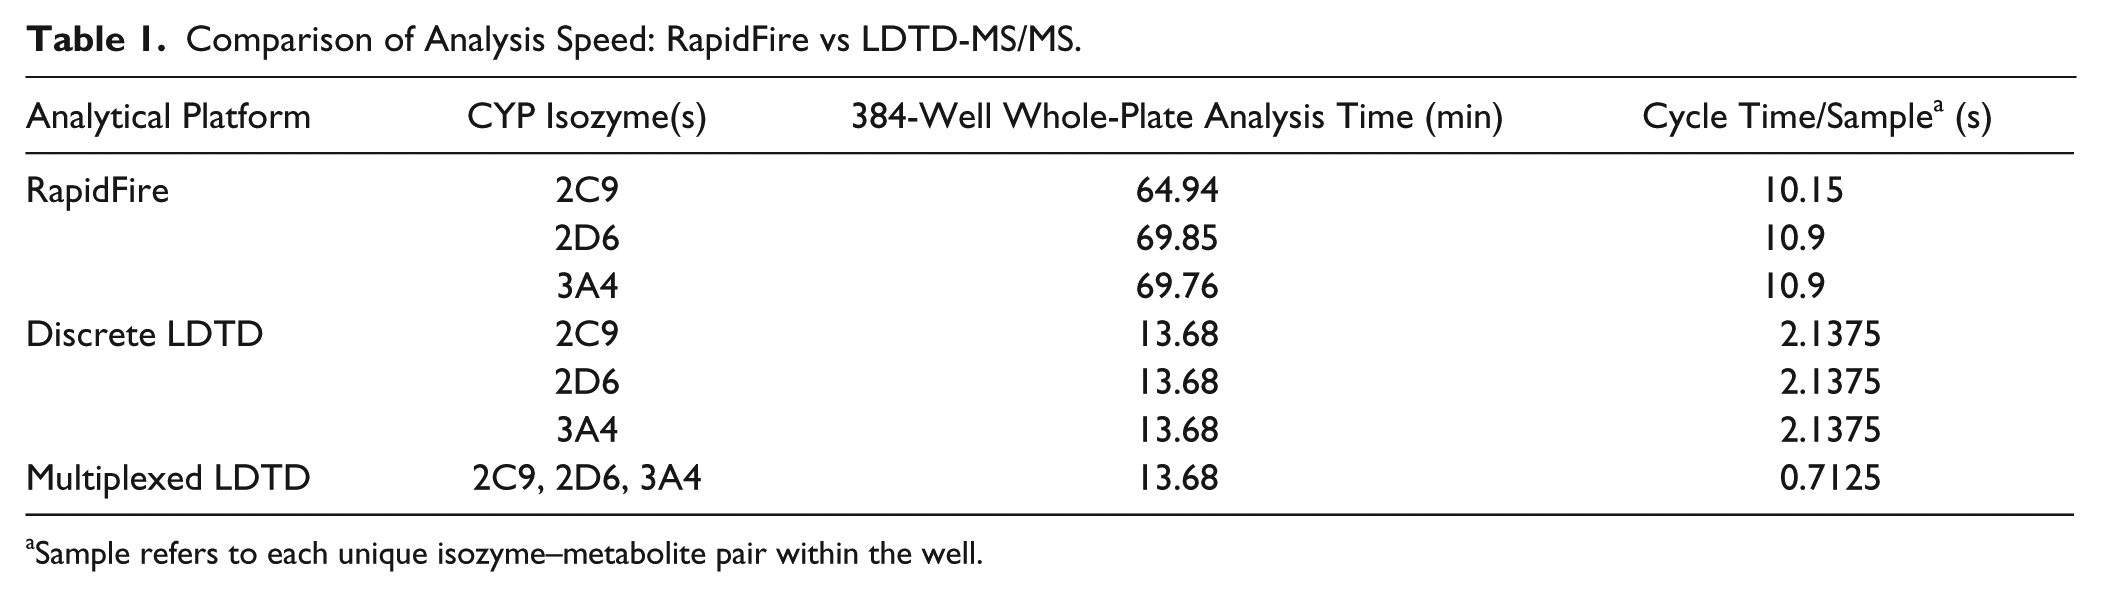
Sample refers to each unique isozyme–metabolite pair within the well.
The direct comparison of IC50 values obtained by the two technologies for each CYP isoform can be found in
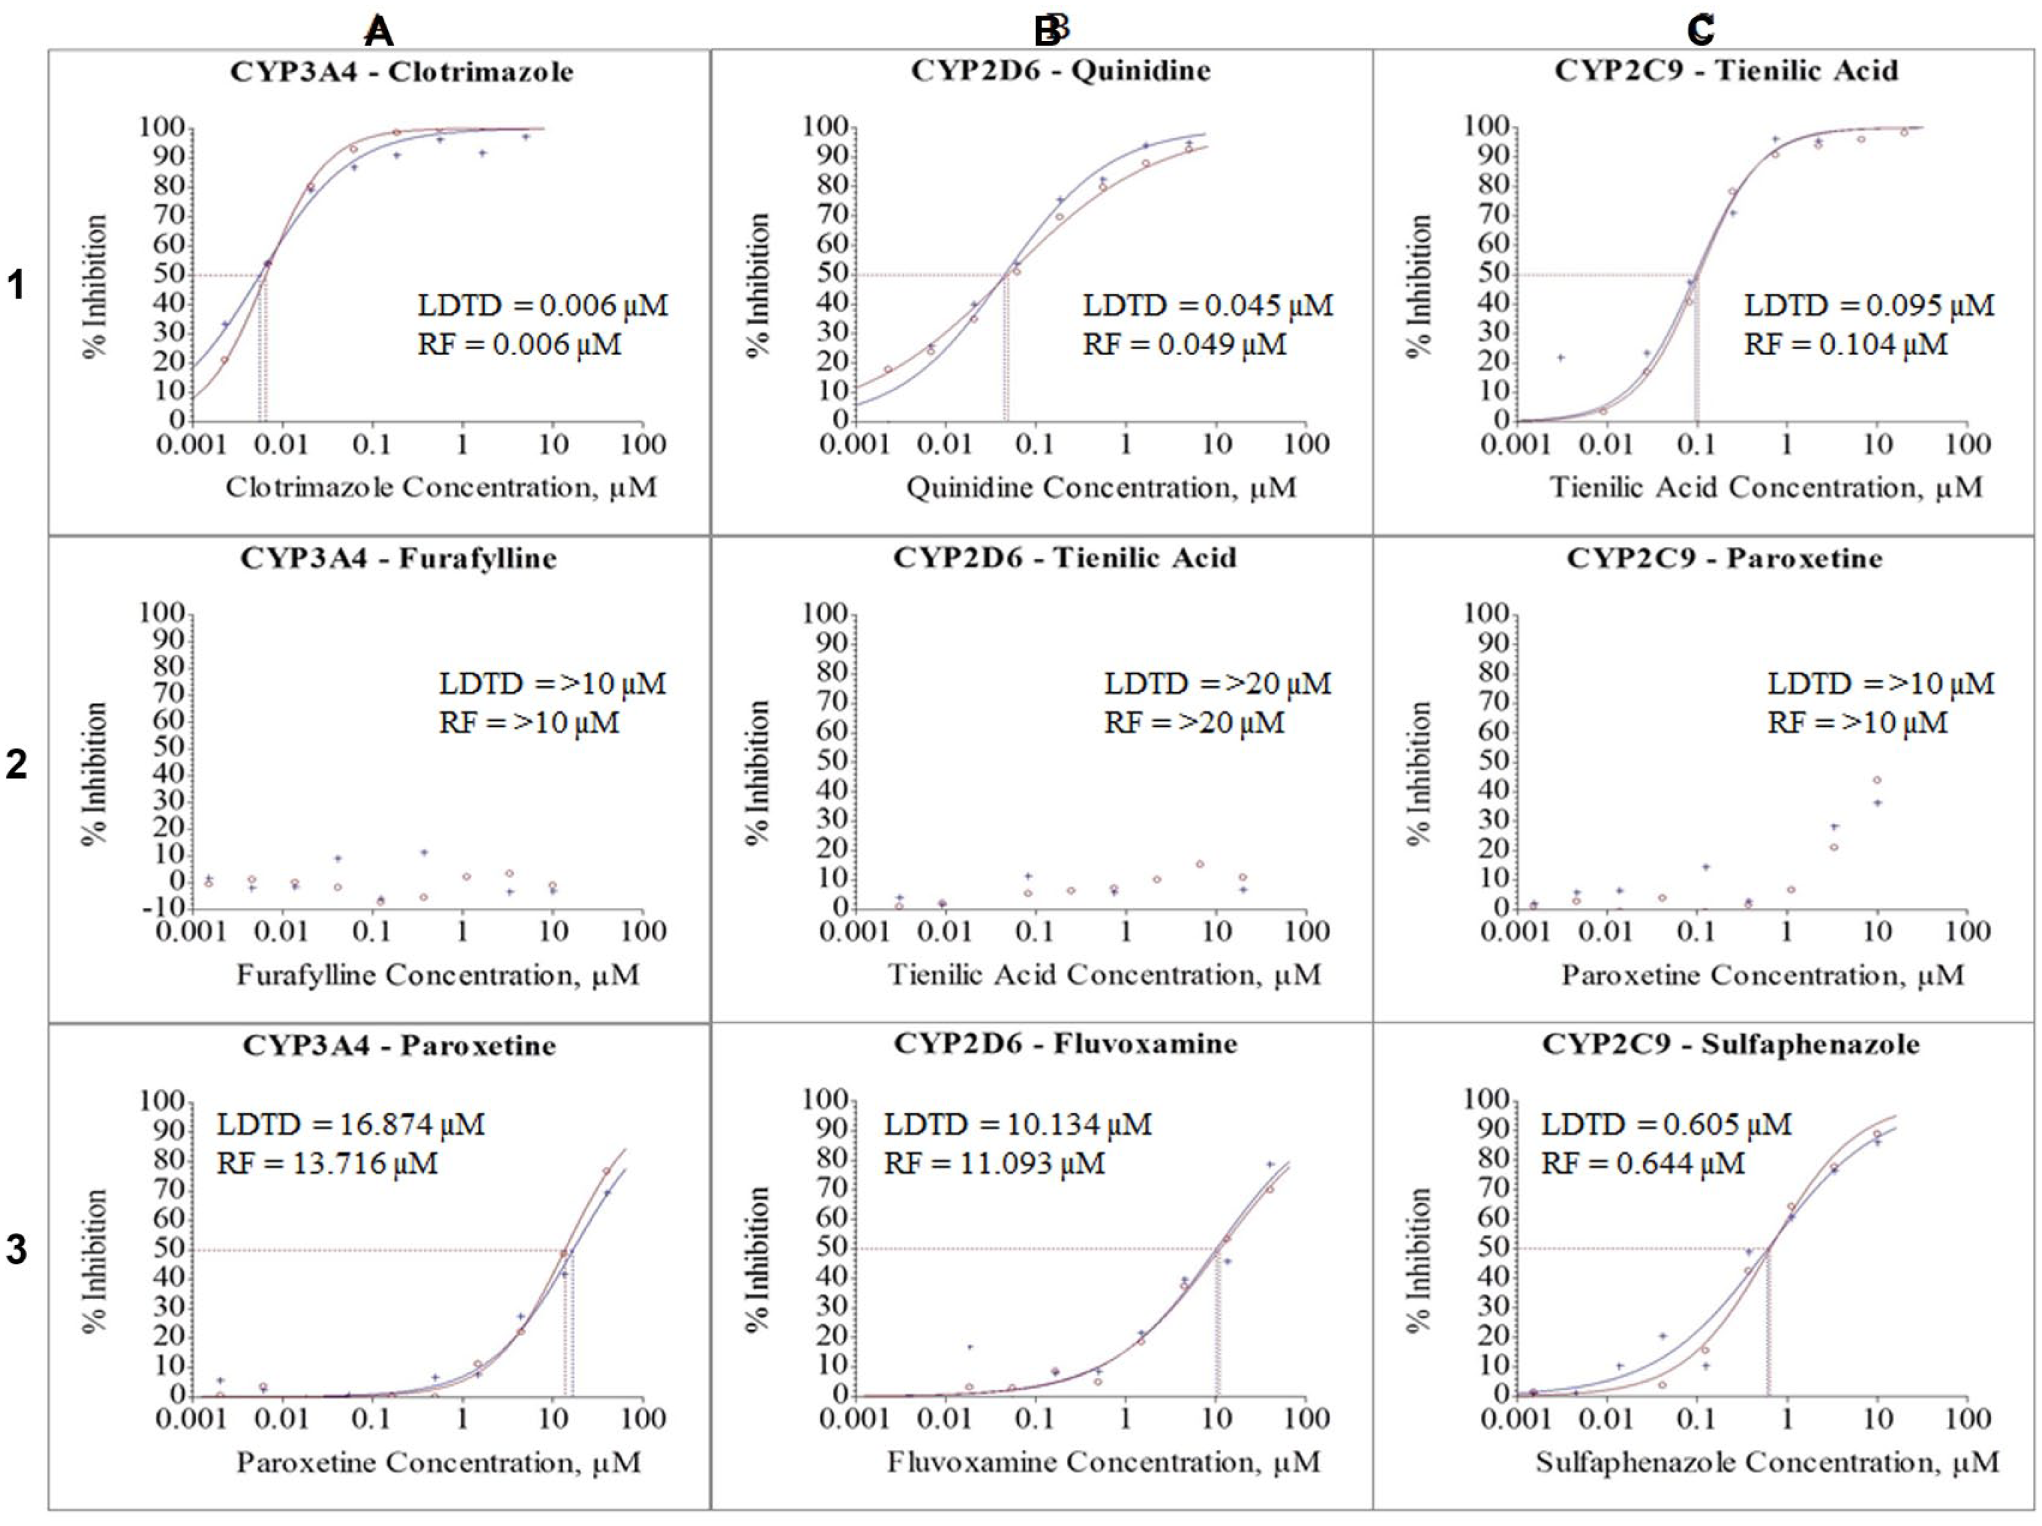
Comparison of IC50 curves obtained by LDTD and RapidFire, showing potent (1), weak (2), and moderate (3) inhibitors for each cytochrome P450 enzyme: CYP3A4 (
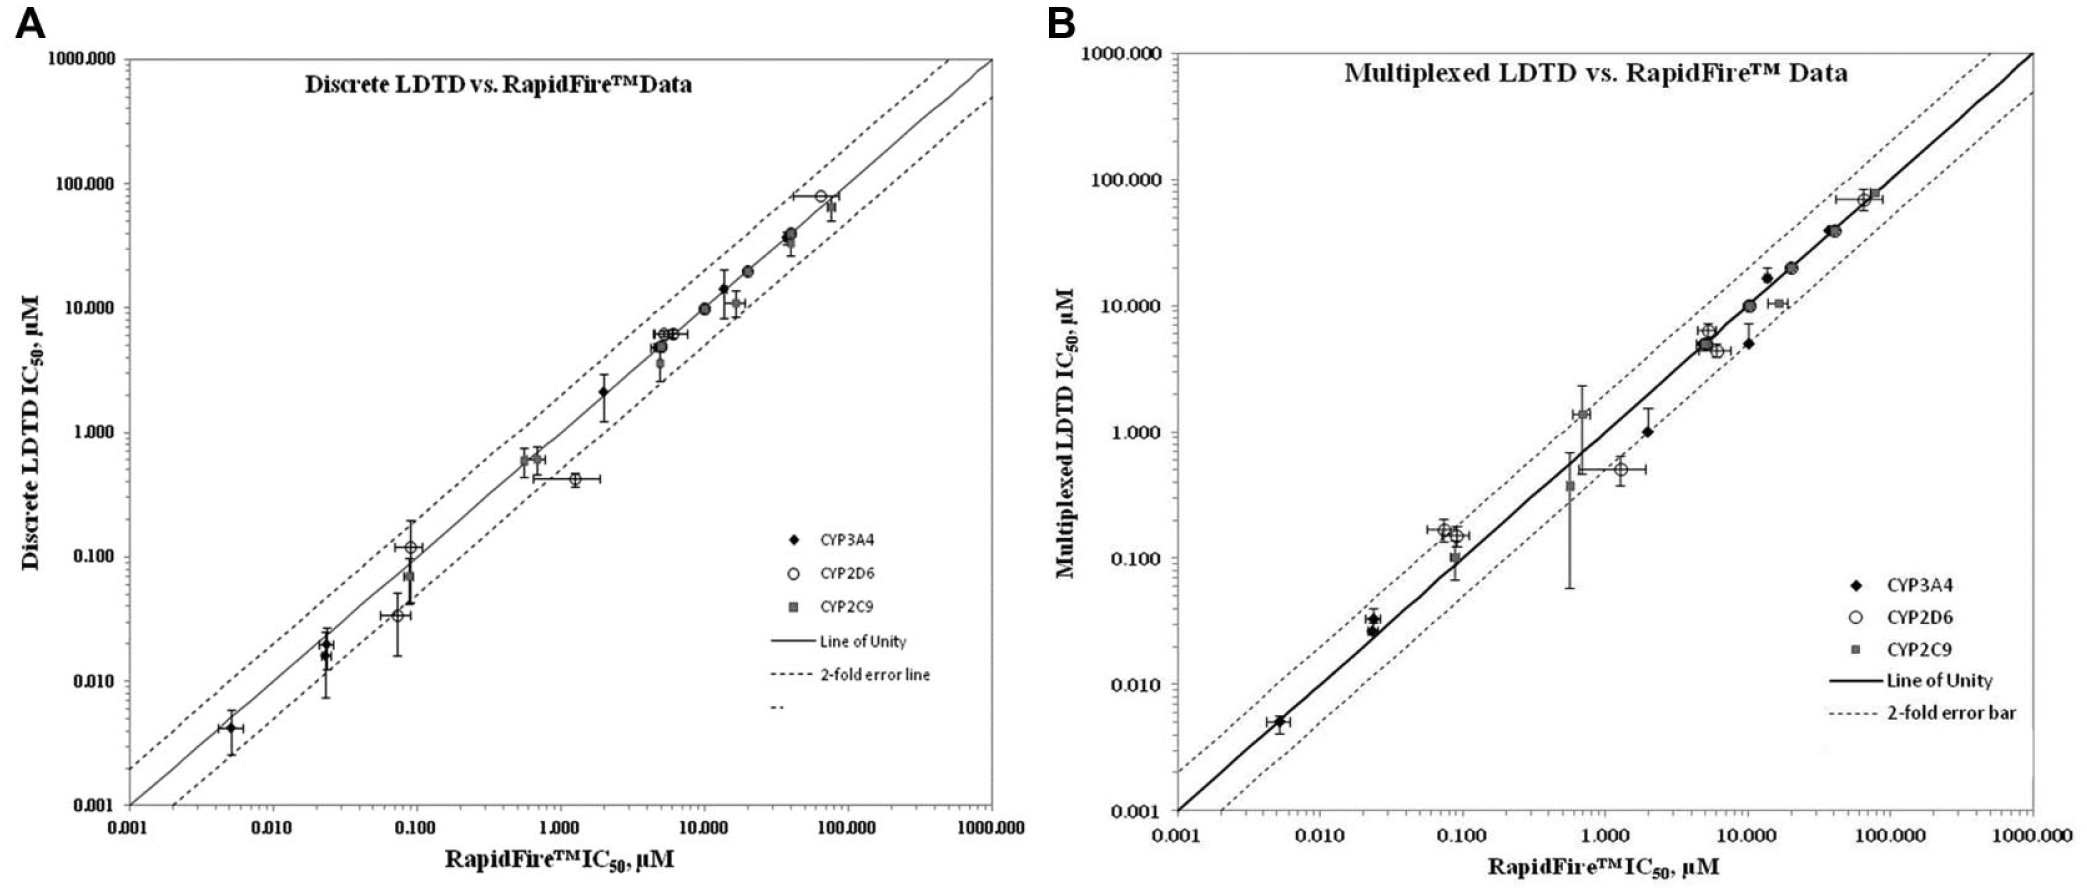
Comparison of IC50 values (logarithmic scale) obtained by LDTD (y axis) and RapidFire (x axis). Comparison of discrete LDTD values shown in panel
Postreaction Multiplexing
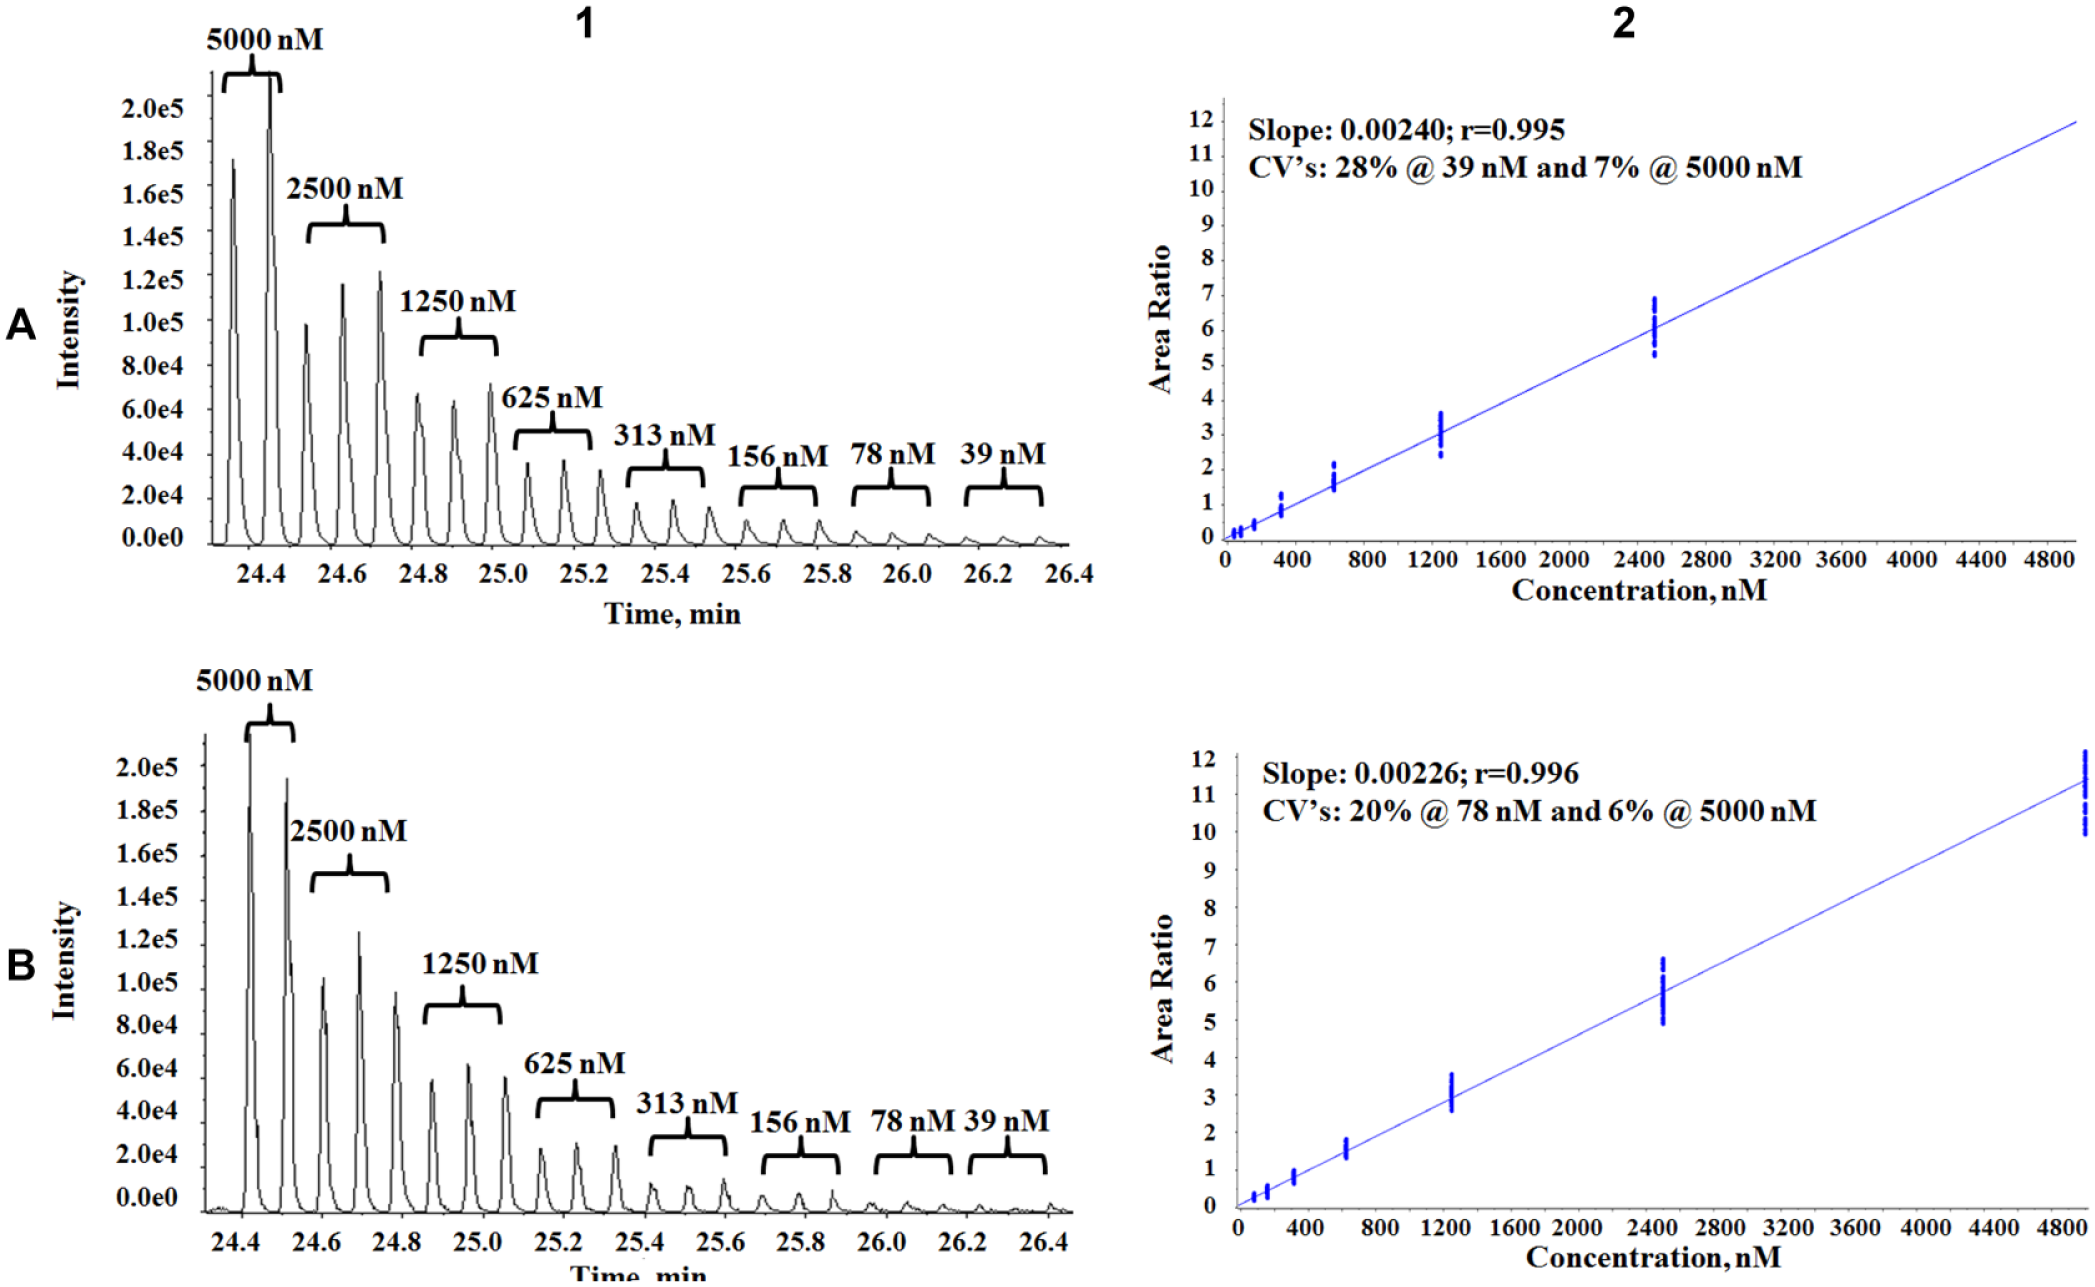
Sample pooling after incubation to increase analysis throughput is not a new idea. Peng et al. 7 developed an LC-MS/MS method to analyze five CYP isozyme assays from the same well, thereby reducing analysis time. However, due to the need for high volumes in LC-MS/MS analysis, the sample transfer could not be accomplished in a reasonable time using acoustic sample deposition, and thus tip-based transfer was required. Tip-based transfer is not cost-effective and introduces the potential of sample carryover if metal tips are used, or sample leaching into disposable plastic tips. Since our LDTD results from a 100 nL sample were in line with the RapidFire results, we were able to investigate postreaction sample multiplexing using acoustic sample deposition and thus circumvent all negative aspects of tip-based transfer. The quenched samples from each CYP reaction were acoustically transferred onto the same single LazWell plate, so that each well contained three samples from different reactions, that is, different metabolites. Since all three samples were desorbed at the same time during LDTD analysis, the overall sample analysis speed (as time per analyte) was reduced threefold to a 0.7 s/analyte. We compared the discrete analysis of a single sample for each CYP to a multiplexed analysis containing analytes from all three CYPs. As an example, the comparison between a discrete and a multiplexed sample analysis of the same dextrorphan (CYP 2D6 metabolite) standard curve at a transfer volume of 100 nL is shown in Figure 4 . The figure shows that the signal intensity for the different concentration replicates is comparable between the two modes of samples, with a slight decrease in peak intensity at the lower concentrations of the multiplexed sample. The estimated LLOQ for the multiplexed analysis was 78 nM, with an approximately 20% CV, while the discrete analysis was able to pick up the lowest tested concentration (39 nM) with a 28% CV. While there was a slight decrease in sensitivity with a multiplexed analysis (potentially due to suppression from competing matrix components), the slopes for the standard curves on the right were almost identical, 0.0024 for the discrete method and 0.0023 for the multiplexed method, with correlation coefficients of 0.995 and 0.996, respectively.
Comparison of discrete (
To assess whether the order of sample deposition would affect LDTD readout, the samples of the three CYP reactions were deposited onto three LazWell plates in a different order on each plate. Figure 5 shows the standard curves obtained for the CYP2D6 analyte from each of the three plates: dextrorphan was deposited first and thus placed underneath the two samples from the other two CYP analytes; then it was deposited second in between 1′-OH-midazolam and 4′-OH-diclofenac; finally, it was transferred as the last of the three samples, appearing as the top sample in the well. The excellent agreement between the slopes indicates that the addition sequence did not impact results in the multiplexed analysis. Similar results were obtained for the CYP2C9 and CYP3A4 sample readouts of the three plates (data not shown).
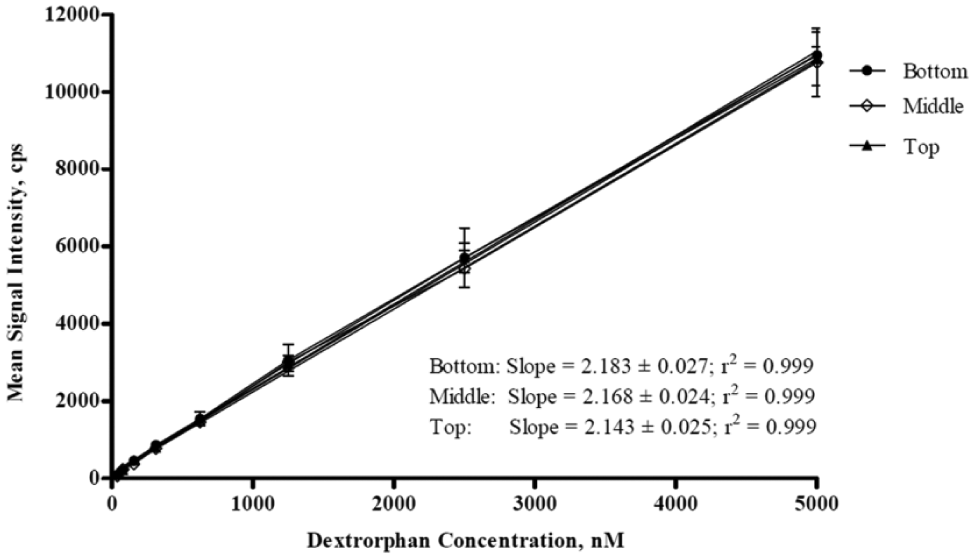
Comparison of dextrorphan standard curves obtained by LDTD from three multiplexed analyte samples placed into the same well of one LazWell plate along with samples of 1′-OH-midazolam and 4′-OH-diclofenac. The order of analyte deposition in three different LazWell plates was such that the dextrorphan sample position (in reference to the other two analytes) was at the bottom (first plate), middle (second plate), and top (third plate).
IC50 values obtained by LDTD analysis from multiplexed and discrete samples are presented in
In summary, there are several advantages of using acoustic sample deposition. First, it allows significant reduction of the sample volume to only 100 nL, which is sufficient for a robust analysis. Second, this low-nanoliter-volume transfer eliminates the need for sample dilution and additional drying time. Finally, acoustic sample transfers can also be fully automated and the LDTD-MS/MS instrument can be preloaded with 10 LazWell plates for a continuous unattended analysis (e.g., overnight). A combination of these factors would allow significant reduction of assay hands-on and turnaround time and increase assay throughput capabilities. Likewise, LDTD technology also offers several clear advantages: each well is isolated during sample desorption, so there is no sample carryover across adjacent wells; there is no mobile phase; the process is matrix-free; and the LazWell plates, both 96-well and 384-well, are commercially available. Comparable IC50 values were generated by both methods, indicating that LDTD-MS/MS may offer a faster and lower sample volume alternative to RapidFire for analysis of HLM CYP inhibition assays. Most importantly, the sensitivity, accuracy, linearity, and reproducibility are on par with our current MS analysis using RapidFire. We demonstrated here that this method can considerably increase the throughput of our existing assay panel for HLM CYP inhibition. Using a postreaction multiplexing approach, we were able to achieve a subsecond readout speed, where a 384-well plate containing three multiplexed CYP assays can be analyzed in 13 min (0.7 s/analyte or assay), which represents an increase of 15.7× in speed. This speed of readout would be suitable in an HTS environment that calls for <1 s/sample. In addition, the low volume requirements for LDTD analysis offer the option of miniaturizing some assays, which was previously unattainable. Therefore, the described method can be adopted to execute HTS campaigns using a number of label-free assays: other ADME-Tox assays, enzyme assays, G protein–coupled receptor (GPCR) endpoints, biomarkers, phenotypic screening, and so on.
Footnotes
Declaration of Conflicting Interests
The authors declared no potential conflicts of interest with respect to the research, authorship, and/or publication of this article.
Funding
The authors received no financial support for the research, authorship, and/or publication of this article.