
Abstract
The throughput level currently reached by automatic liquid handling and assay monitoring techniques is expected to facilitate the discovery of new modulators of enzyme activity. Judicious and dependable ways to interpret vast amounts of information are, however, required to effectively answer this challenge. Here, the 3-point method of kinetic analysis is proposed as a means to significantly increase the hit success rates and decrease the number of falsely identified compounds (false positives). In this post-Michaelis–Menten approach, each screened reaction is probed in three different occasions, none of which necessarily coincide with the initial period of constant velocity. Enzymology principles rather than subjective criteria are applied to identify unwanted outliers such as assay artifacts, and then to accurately distinguish true enzyme modulation effects from false positives. The exclusion and selection criteria are defined based on the 3-point reaction coordinates, whose relative positions along the time-courses may change from well to well or from plate to plate, if necessary. The robustness and efficiency of the new method is illustrated during a small drug repurposing screening of potential modulators of the deubiquinating activity of ataxin-3, a protein implicated in Machado–Joseph disease. Apparently, intractable Z factors are drastically enhanced after (1) eliminating spurious results, (2) improving the normalization method, and (3) increasing the assay resilience to systematic and random variability. Numerical simulations further demonstrate that the 3-point analysis is highly sensitive to specific, catalytic, and slow-onset modulation effects that are particularly difficult to detect by typical endpoint assays.
Introduction
The study of enzyme kinetics commonly focuses on the initial reaction phases during which constant rate conditions are verified irrespective of the degree of substrate conversion. During the so-called steady-state period, the measured initial reaction rate (v0) is related to the initial substrate concentration (S0) according to the Michaelis–Menten equation. 1 The early stages of reactions are of additional importance for the screening of novel enzyme inhibitors since the percentage inhibition computed in terms of apparent reaction rates is known to decrease over time.2,3 Moreover, endpoint assays performed within the period of constant v0 are associated with minimal costs per screened compound when large numbers (>10,000) of chemical compounds are being tested.2,4
With the advent of robotics and sample miniaturization systems, continuous monitoring of multiple reactions became possible through the use of highly automated workstations. 5 While covering different phases of the reaction, full progress curve analysis has the potential to increase the screening efficiency through the detection of enzyme modulation effects that are either slow to manifest or masked at high substrate concentrations.4,6,7 Deconvoluting this useful information from the occurrence of, for example, unaccounted enzyme inactivation, instrumental drift, and compound interference, is, however, difficult even considering separated timescales.8–10 In a previous attempt to simplify high-throughput screenings (HTSs) of dynamic modulation effects, the theoretical relationship between the half maximal inhibitory concentration (IC50) and the substrate conversion was established assuming first-order kinetic models. 11 In another example, endpoint enzymatic assays were optimized in order to measure the reaction conversion at the point of maximum difference in product concentration between control and competitively inhibited reactions. 7
A minimum of 3-point readouts are required to probe the initial, intermediate, and final phases of screening reactions 12 ( Fig. 1A ). More frequent readings are technologically possible,13,14 although their implementation in the phase of primary screening is avoided in order to keep the assay cost to a minimum. 4 When conditions of large substrate concentration cannot be adopted, the throughput level of endpoint assays is greatly limited by the duration of the constant rate period, at the end of which different estimates of v0 start to be produced15,16 ( Fig. 1B ). Compound-induced changes of background signal can be automatically normalized by adopting a 2-point strategy to measure the increase of product concentration (ΔPi = Pi – P0). This advantage, which is shared by kinetic-mode assays, obviates the design of counterassays for compound interference identification.17–19 Nevertheless, increasing the reaction monitoring to two or more instants does not solve the problem of time-dependent readouts unless a renewed theoretical framework is adopted.
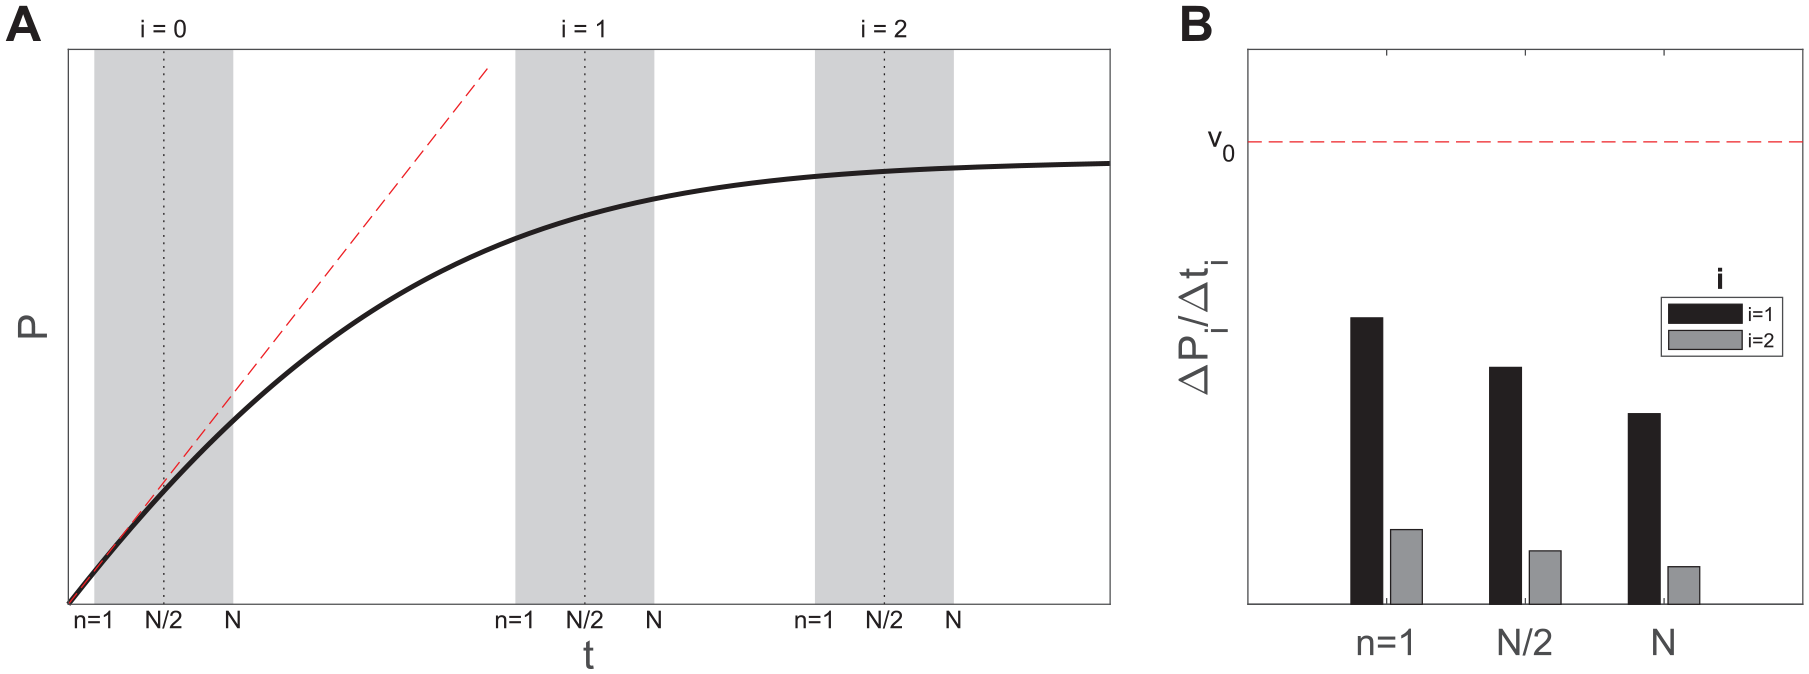
Numerical example showing possible configurations of endpoint and 3-point HTS assays. (
After proposing the closed-form mathematical solution of single-substrate, single-active-site enzymatic mechanisms,20,21 our group developed the linearization method (LM) for the detection of hidden assay interferences. 22 Here we show that the LM principles can be applied to the HTS detection of “interferences” caused by candidate enzyme effectors. The advantages of the new method are demonstrated by combining numerical simulations with a practical example of compound screening for modulators of the deubiquinating activity of polyglutamine-expanded ataxin-3 (Atx3 77Q), a protein associated with spinocerebellar ataxia type 3, also known as Machado–Joseph disease. 23
Materials and Methods
Protein Production and Enzymatic Assay
Atx3 77Q was expressed and purified as previously described.24–26 A modified version of the method described by Burnett et al. 27 was employed to monitor the release of fluorescent 7-amino-4-methylcoumarin (AMC) from the fluorogenic substrate ubiquitin–AMC (Ub-AMC; Boston Biochem, Cambridge, MA) by Atx3 77Q. Enzymatic reactions were performed in 50 mM HEPES, pH 7.5 (20 °C), 0.5 mM EDTA, 0.1 mg/mL bovine serum albumin (BSA), 5% (v/v) glycerol, and 10 mM DTT at 37 °C using 384-well microplates (low flange, black, flat bottom, polystyrene; Corning, Kennebunk, ME) and a total reaction volume of 50 or 30 μL/well. A range of Ub-AMC concentrations lower than 1 μM was used, as per recommendation of the substrate manufacturer. Total enzyme concentration ranged from 0.25 to 0.5 μM. Reactions were started by addition of protein, and fluorescence was monitored at 460 nm (390 nm excitation) using a HIDEX CHAMELEON V plate reader (Turku, Finland). To avoid evaporation, the reaction mixture in each well was overlaid with liquid paraffin (30 μL).
Screening Procedures
Potential modulators of Atx3 77Q activity were screened from 1280 Food and Drug Administration (FDA)-approved chemical compounds contained in the Prestwick Chemical Library (Illkirch, France). An automated bulk dispenser (Multidrop Combi; Thermo Fisher Scientific, Waltham, MA) was used to fill 384-well microplates with 15 μL of 0.75 μM Ub-AMC. An automated liquid handler (JANUS Automated Workstation; PerkinElmer, Waltham, MA) equipped with pin tool replicators (V&P Scientific, San Diego, CA) coupled to a Modular Dispense Technology (MDT) head was used to add 0.1 μL of test compounds (from a 1 mM stock) or DMSO (for controls), after which reactions were started by adding 15 μL of 0.70 μM Atx3 77Q to each well (reaction volume: 30 μL). The MDT head of the automatic liquid handler equipped with 96 tips was used to dispense 30 μL of liquid paraffin to overlay the final reaction mixtures. A total of four 384-well microplates were filled, each plate testing 320 chemical compounds (1 compound per well) and running 32 control reactions in the presence of DMSO (DMSO control reactions). The final reaction mixture contained 0.35 μM Atx3 77Q, 0.375 μM Ub-AMC, and 3.33 μM test compound/DMSO. Assay robustness was evaluated separately for each microplate in terms of the median Z factor:28,29

where
Criteria for Compound Selection
According to the LM, the following linear relationship between the modified reaction coordinates ΔPi/Δti and –ln(1 – ΔPi/ΔP∞)/Δti is established under typical conditions of large substrate excess over enzyme, and independently of which reaction time frames or initial substrate concentrations are considered: 22
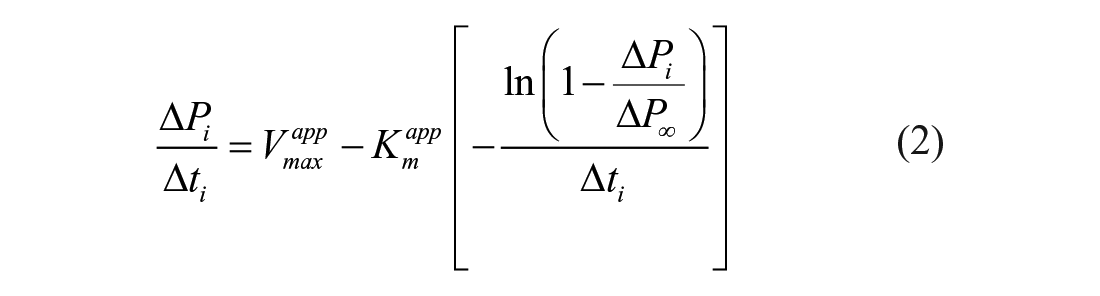
where ΔP∞ corresponds to the product concentration increase measured at the end of the reaction, and
The proposed method of enzyme modifier detection relies on the measurement of product concentration Pi (or, alternatively, substrate concentration Si) in three distinct moments (indices i = 0, 1, 2). When the effects of the screening compounds on the calibration curve are not known beforehand, indirect monitoring of product concentration is performed using signal readout values Fi instead of Pi. Possible changes in background signal are normalized by using ΔFi differences in the estimation of midpoint-centered (i = 1) LM coordinates:


Preferably, the third-point location should coincide with the plateau reached at the end of the reaction, thereby admitting the equivalence between ΔF1/ΔF2 and ΔP1/ΔP∞ ratios. As the third point becomes located further behind the reaction endpoint, the resolution of the method is expected to decrease ( Suppl. Fig. S2 ). The time- and S0-independent LM criterion for compound selection is based on the difference between obtained and predicted X1 or Y1 values. The stronger the effect of the modulator, the larger the differences ΔX1 or ΔY1 will be. During the screening of Atx3 77Q effectors, the resolution of the method is computed in terms of the Y1 difference:

where κ is the known proportionality factor converting product concentration units into Fi units in the absence of test compounds; if all test reactions can be probed simultaneously (i.e., if δt << Δti in the example of Fig. 1 ), previous knowledge of the control kinetic parameters (Km and Vmax) is not required. In such cases, distribution histograms are sufficient to statistically select higher (for activators) and lower (for inhibitors) values of X1 or Y1.
During compound screening for modulators of Atx3 77Q activity, three exclusion criteria are adopted to eliminate test reactions affected by random experimental error and artifacts. The first criterion accounts for evident deviations from the product buildup trend caused, for example, by sudden fluorescence quenching. To pass this criterion, the following condition has to be verified:

The enzymology principles used to define the other two criteria are described in detail in Supplemental Materials Section 2. The second validation criterion is derived taking as reference the limit case of

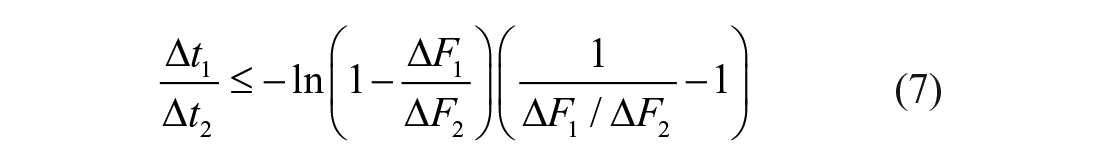
In the other limit case of
Results
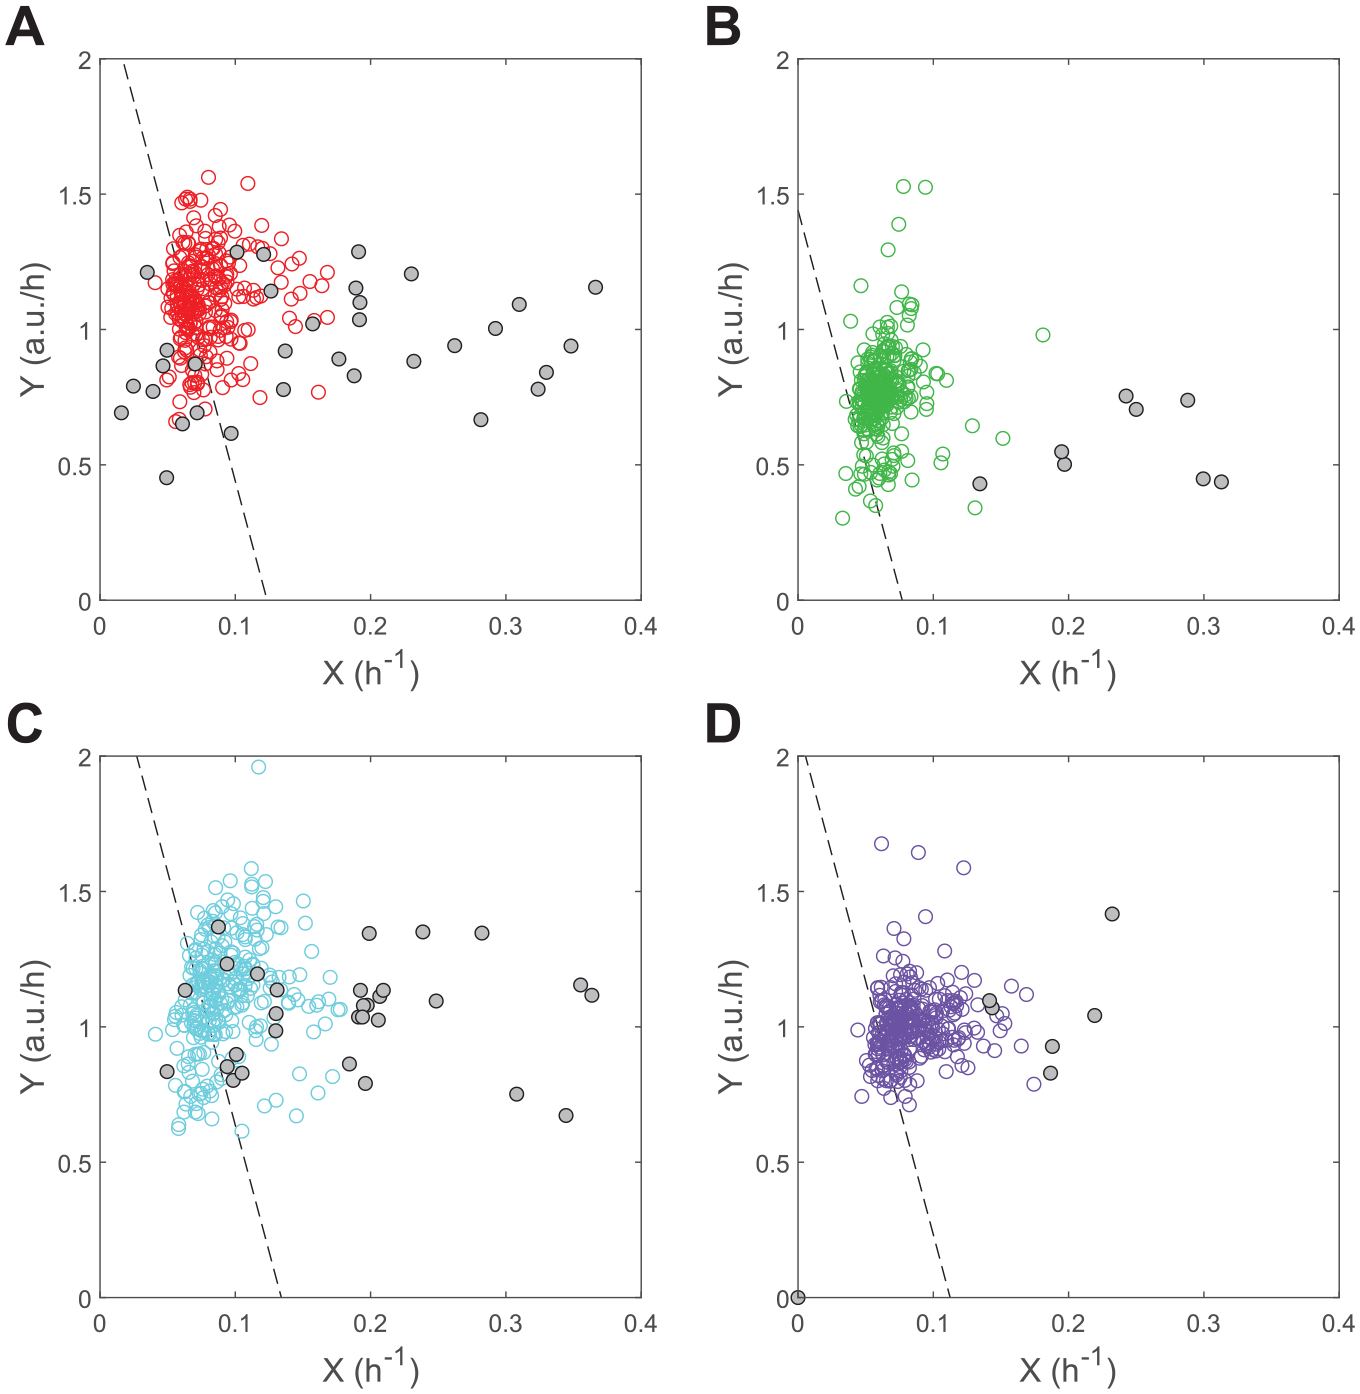
The improvements in robustness brought forward by the 3-point LM assay are illustrated with the screening of 1280 FDA-approved chemical compounds for possible modulators of the deubiquinating activity of Atx3 77Q. This is a purposely small chemical library that allows for kinetic-mode monitoring of all tested reactions running in four 384-well microplates ( Fig. 2 ). The occurrence of spurious phenomena eventually suggested by the 3-point positions can thus be evaluated against what is reported by the full progress curves. In all plates, control-reaction conversions of ~0%, ~60%, and 99.9% were chosen for the 3-point positions along the time-courses. The number of excluded compounds changes greatly from plate to plate, possibly as a consequence of the different chemical natures of the tested molecules, but also owing to inherent random and systematic errors arising, for example, from differences in the effective concentration of active sites of Atx3 77Q, which is an aggregation-prone protein. 25
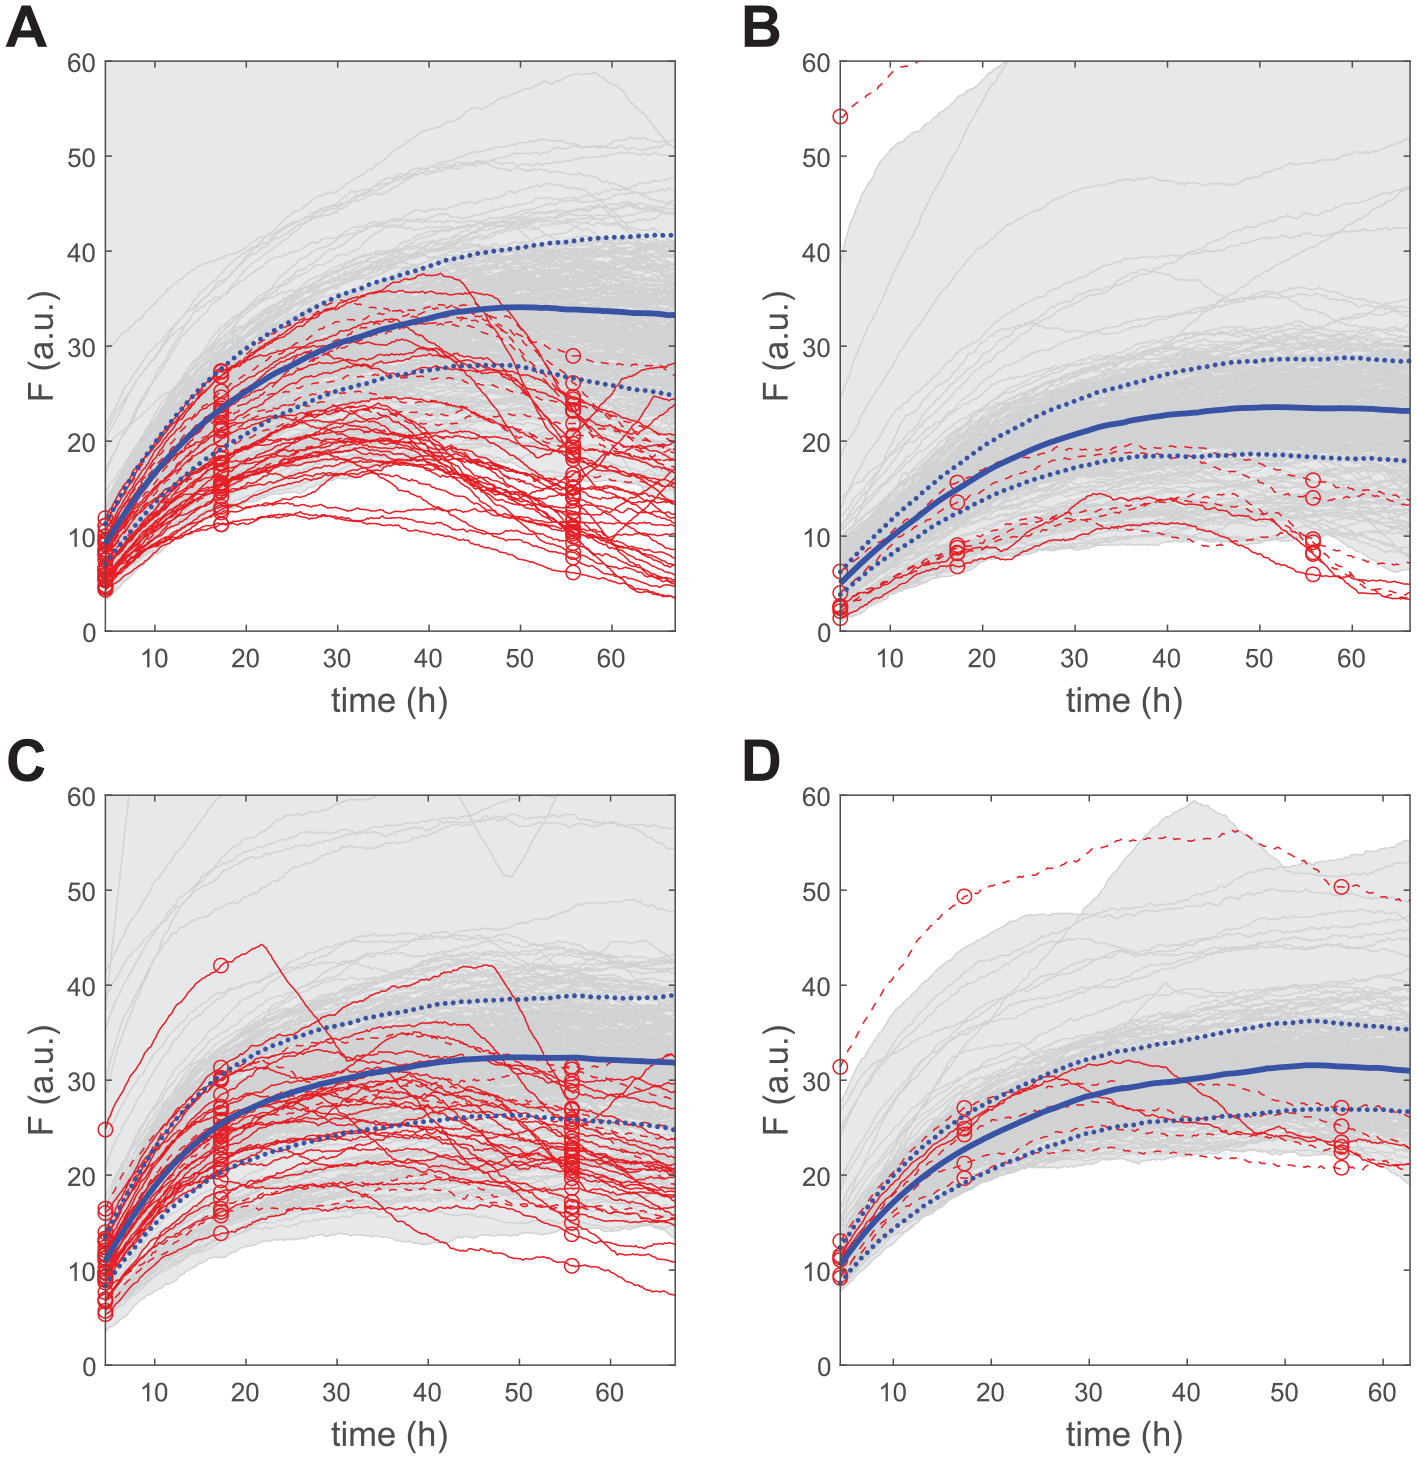
Validation criteria applied to the screening of drug repurposing compounds for potential modulators of the enzymatic activity of Atx3 77Q. (
Most excluded curves are identified upon application of the first filter accounting for evident drops in AMC fluorescence caused by quenching interference, inner filter effects, light scattering, and so forth (solid red lines in Fig. 2 ). Examples of supralinear trends failing to comply with eq 6 are not observed, whereas the third exclusion criterion (eq 7) does eliminate further unreliable readouts (dashed red lines in Fig. 2 ). Unsurprisingly, the number of excluded results increases as the second point is positioned nearer to the third point ( Table 1 ). Higher ΔF1/ΔF2 ratios increase the risk of false negatives as the result of possible deviations from physically acceptable trends originated by, for example, signal noise (Supplemental Materials Section 2); by adopting ΔF1/ΔF2 ratios below 0.5, the safety margin for exclusion increases, yet the false-positive rates in subsequent phases of hit detection are also expected to increase. All the suspicious curves that were eliminated using a midpoint threshold of ~60% control-reaction conversion ( Fig. 2 ) are indeed affected by systematic drops in fluorescence signal during at least 20% of the total time over which the reactions are monitored ( Table 1 , last column).
Impact of the Midpoint Position on the Total Number of Excluded Results. a
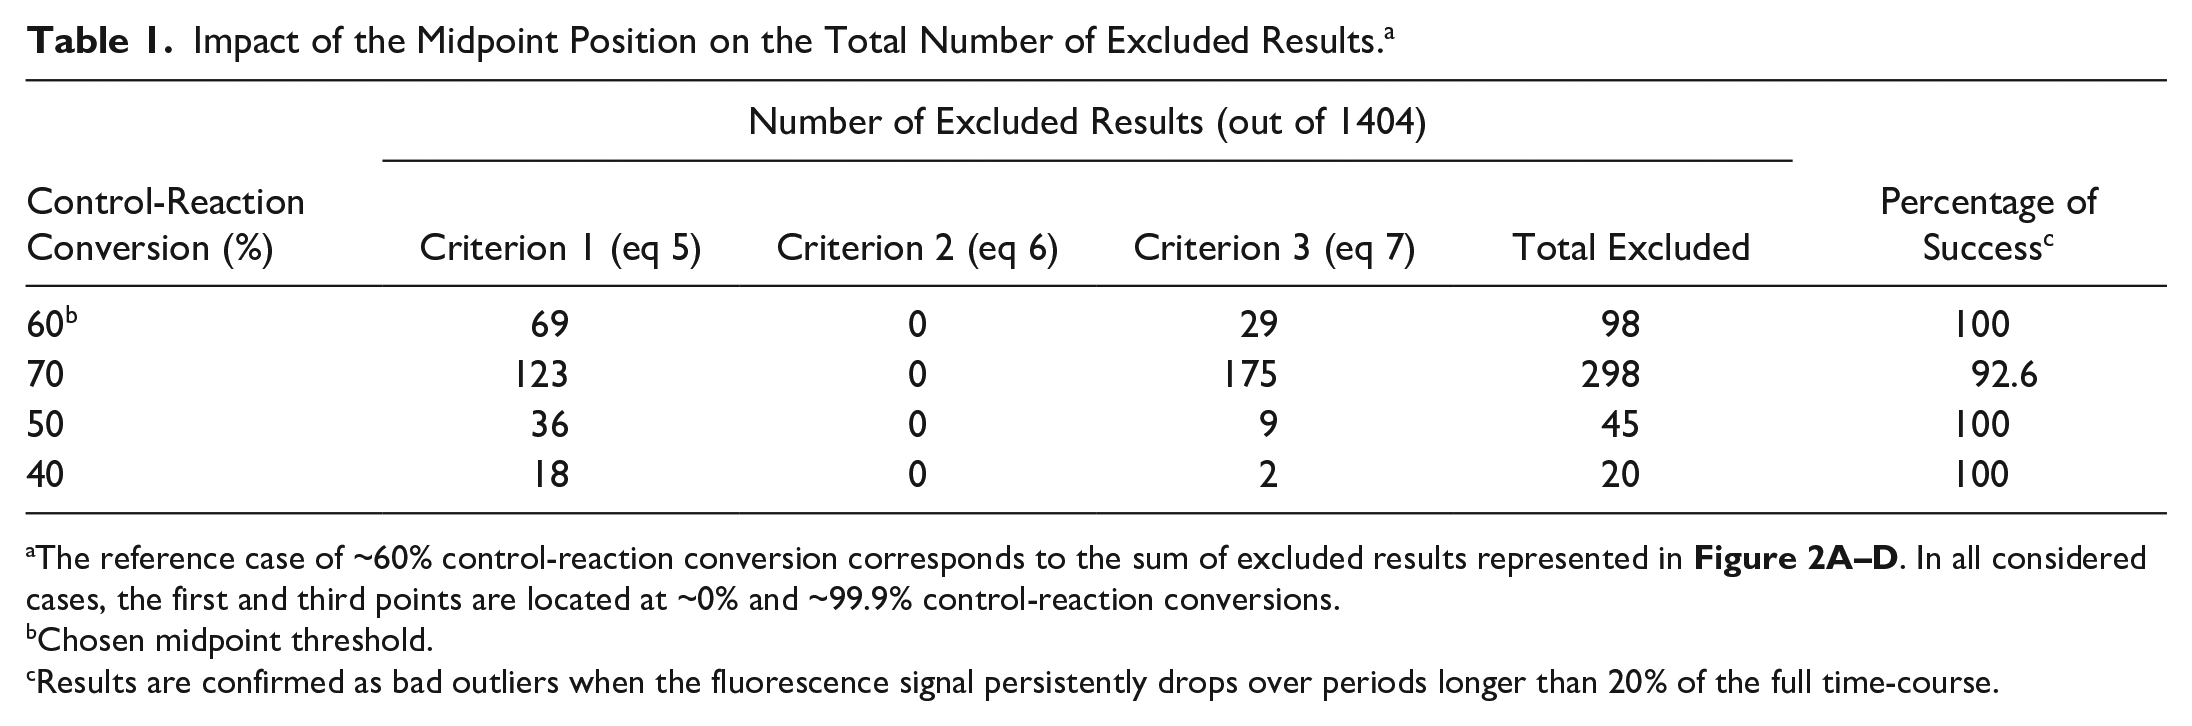
The reference case of ~60% control-reaction conversion corresponds to the sum of excluded results represented in Figure 2A–D . In all considered cases, the first and third points are located at ~0% and ~99.9% control-reaction conversions.
Chosen midpoint threshold.
Results are confirmed as bad outliers when the fluorescence signal persistently drops over periods longer than 20% of the full time-course.
The AMC fluorophore used in the Atx3 77Q assay has an excitation wavelength in the UV range, which also excites a large number of screening compounds. 30 Values of the median Z factor well below the practical limit of 0.5 confirm that the accuracy of this drug repurposing screening would not be acceptable unless robust exclusion criteria were used to identify assay artifacts ( Table 2 ). Major improvements in robustness are achieved through the elimination of bad outliers (compare the last two columns of Table 2 ) but also by adopting better normalization procedures than those conventionally implemented for endpoint assays (compare the v0- and Y1/ΔF2-based Z factors).
Median Z Factors (eq 1) Calculated for Each Microplate before and after the LM-Based Exclusion Criteria Are Applied. a
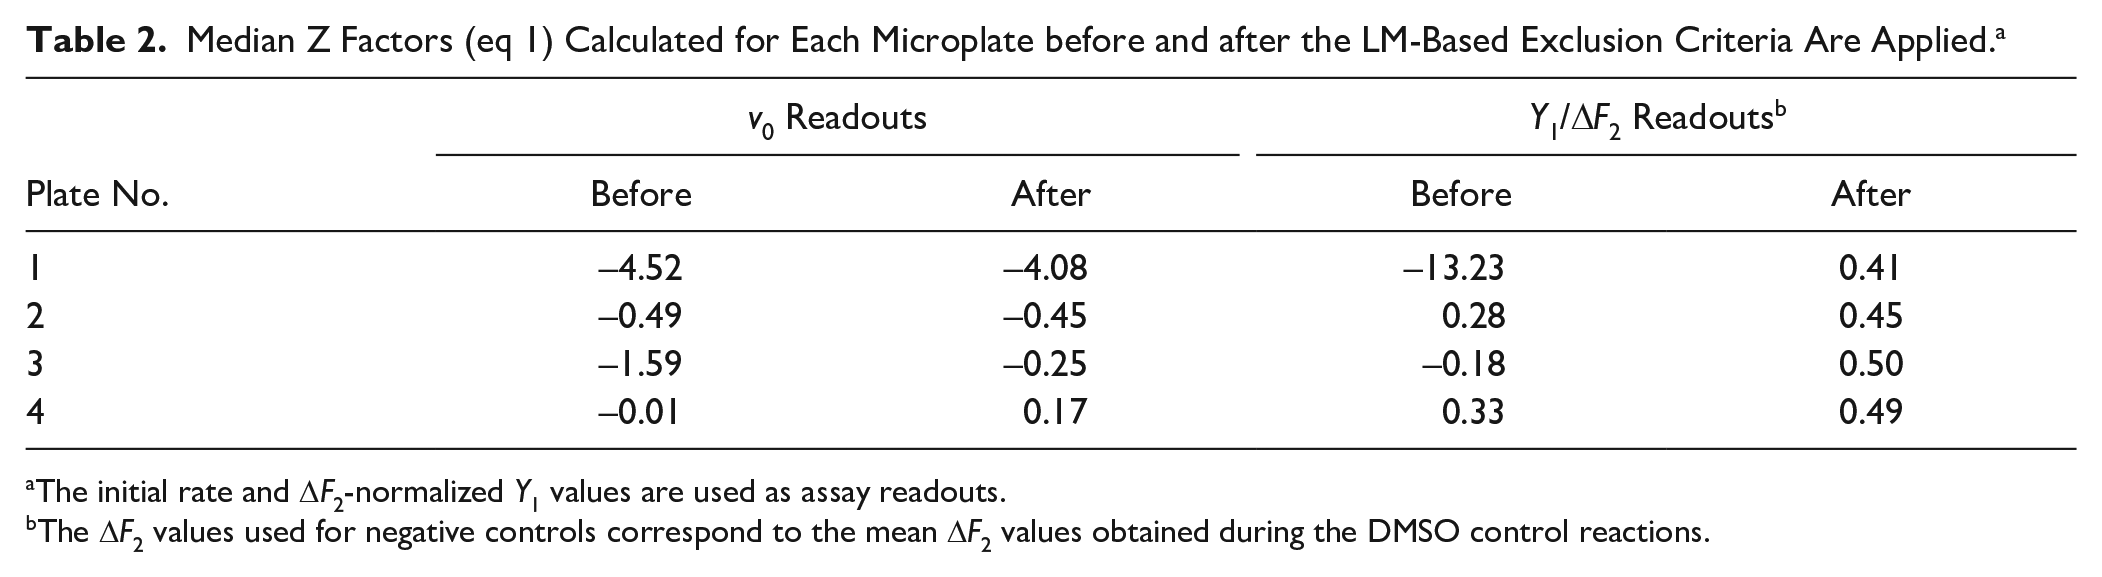
The initial rate and ΔF2-normalized Y1 values are used as assay readouts.
The ΔF2 values used for negative controls correspond to the mean ΔF2 values obtained during the DMSO control reactions.
The initial rate analysis of control reactions revealed interplate differences in enzymatic activity despite using the same molar concentration of Atx3 77Q across microplates. Analysis of single-point F1 data by the software HTS-Corrector confirmed the occurrence of plate effects affecting the quality of the χ2 contingency test of hit distribution,31,32 which is passed after the background signal is corrected (final χ2 value of 318.0 for a critical χ2 value of 380.7, with α = 0.01). This plate variability is likely due to variations in the oligomerization state of this polyglutamine-expanded protein, whose characterization in terms of the kinetic parameters Km and Vmax was performed using a lower enzyme concentration than during compound screening ( Suppl. Fig. S3 ). The resulting LM straight lines (lines in Fig. 3A–D ) underestimate most of the X1 and Y1 values obtained for each microplate (symbols in Fig. 3A–D ), even after correcting parameter Vmax by the effective enzyme concentration. While systematically affecting the differences between obtained and predicted Y1 values (eq 4), this variability has no major influence on the 3-point method of compound selection. Illustrating this, interplate variations in Y1 estimates ( Fig. 4A ) tend to vanish when the results are represented as ΔY1 distributions ( Fig. 4B ). Since the 3 points are probed at practically simultaneous time instants, within and across microplates, the dispersion of Y1 (or X1) values is not justified by significant variations in the reaction periods considered in each well. Should these variations have occurred, their normalization across microplates would also be possible by representing frequency distributions of ΔY1 values (see numerical examples in Suppl. Figs. S1 and S4 for details).
Zoomed LM representation of screening reactions. Full-scale graphs are presented in
Supplemental Figure S6.
(
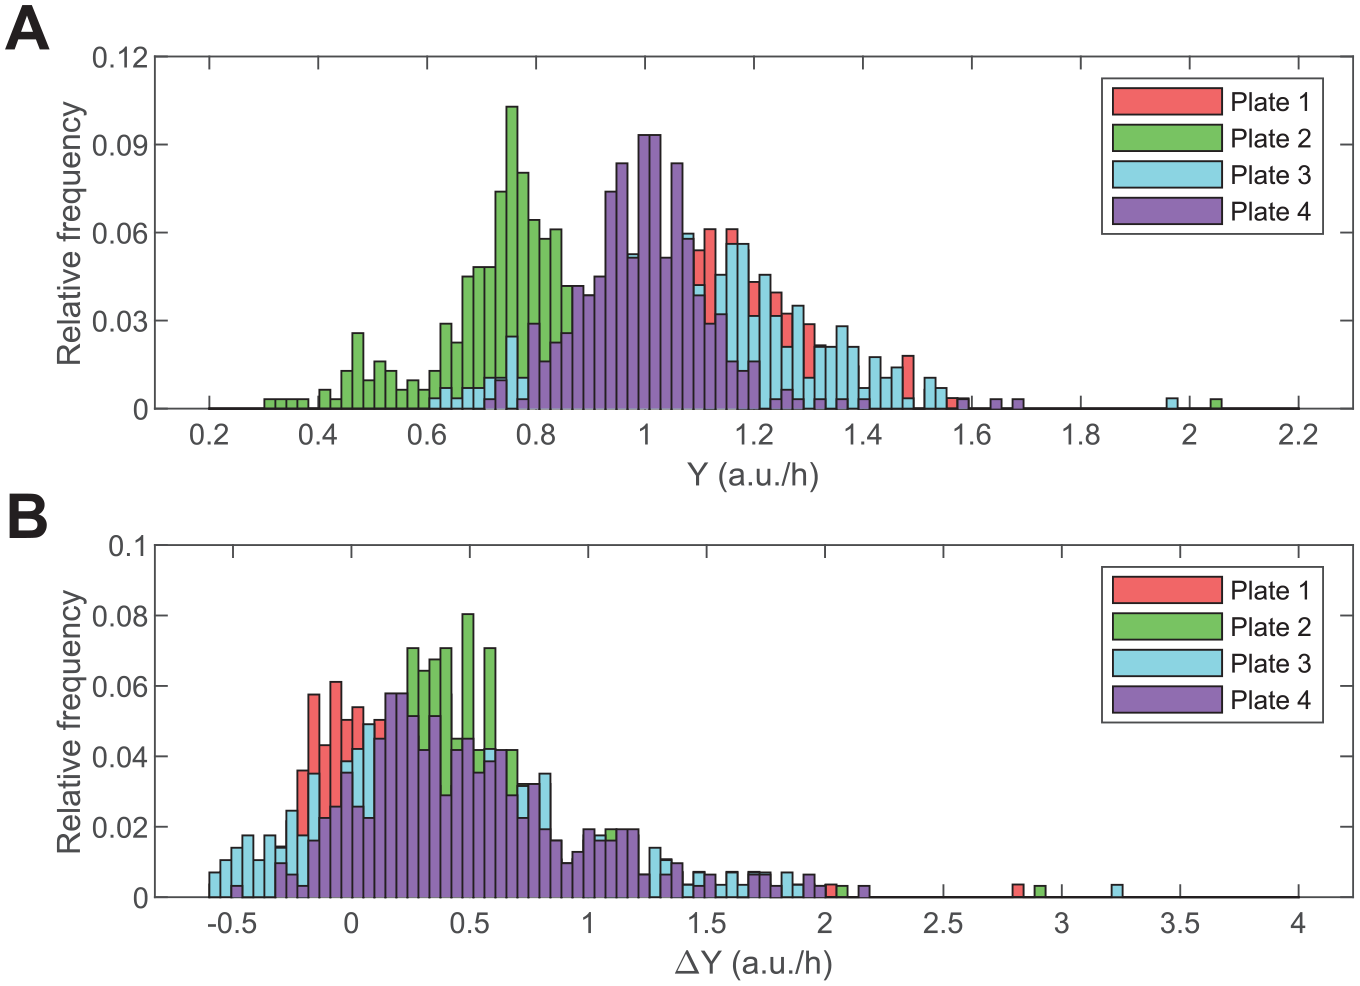
Histogram representation of the frequency distribution of midpoint LM coordinates for each microplate. (
Discussion
The 3-point method of kinetic analysis answers the current demand for new breakthroughs in the discovery of inhibitors and activators for targets of interest in pharmaceutical research.33–35 Its first principles are those of the LM recently proposed by us as a new tool to detect enzymatic assay interferences, 22 with the main difference that LM curves are now used to detect “interferences” caused by candidate enzyme effectors. Using the screening for Atx3 77Q modulators as a practical example, major improvements in robustness are achieved through judicious elimination of outliers, by adopting advanced normalization methods, and by increasing the assay resilience to systematic and random variability. Simple numerical examples illustrate another way by which the 3-point LM assay can improve HTS efficiency, namely, by increasing the detection of true-positive hits ( Fig. 5 ). Mechanisms of specific (or competitive), catalytic (or uncompetitive), and slow-binding inhibition are simulated assuming S0 = 10Km. Substrate concentrations this high are beneficial to increase the signal-to-background ratio and to detect uncompetitive inhibitors, yet values of S0 ≈ Km are generally preferred in HTS practice as a compromise to warrant good responsiveness to competitive inhibitors as well.3,34,36 In addition to a marked increase in sensitivity to competitive inhibitors at high S0 values, the numerical simulations in Figure 5 demonstrate that the 3-point screening method still marginally increases the detection limits for uncompetitive inhibitors. Therefore, in the light of the new methodology, high substrate concentrations can henceforth be adopted without further constraints than the practical limits imposed by substrate solubility and the desired overall duration of the assay. The LM straight lines describing the catalytic and specific mechanisms in Figure 5B are simulated assuming quasi-equilibrium conditions that do not apply to the case of slow-binding inhibition. 37 Transient enzyme modifier mechanisms are particularly difficult to detect solely based on initial rate measurements. In the case of slow-binding inhibitors, single-time-point analysis gives rise to apparent potencies much lower than the reality and, therefore, leads to failures in the identification of true hits. 38 Conversely, the 3-point method is capable of greatly improving the assay sensitivity to slow-binding inhibitors if sufficiently long Δt1 periods are adopted ( Fig. 5C ).
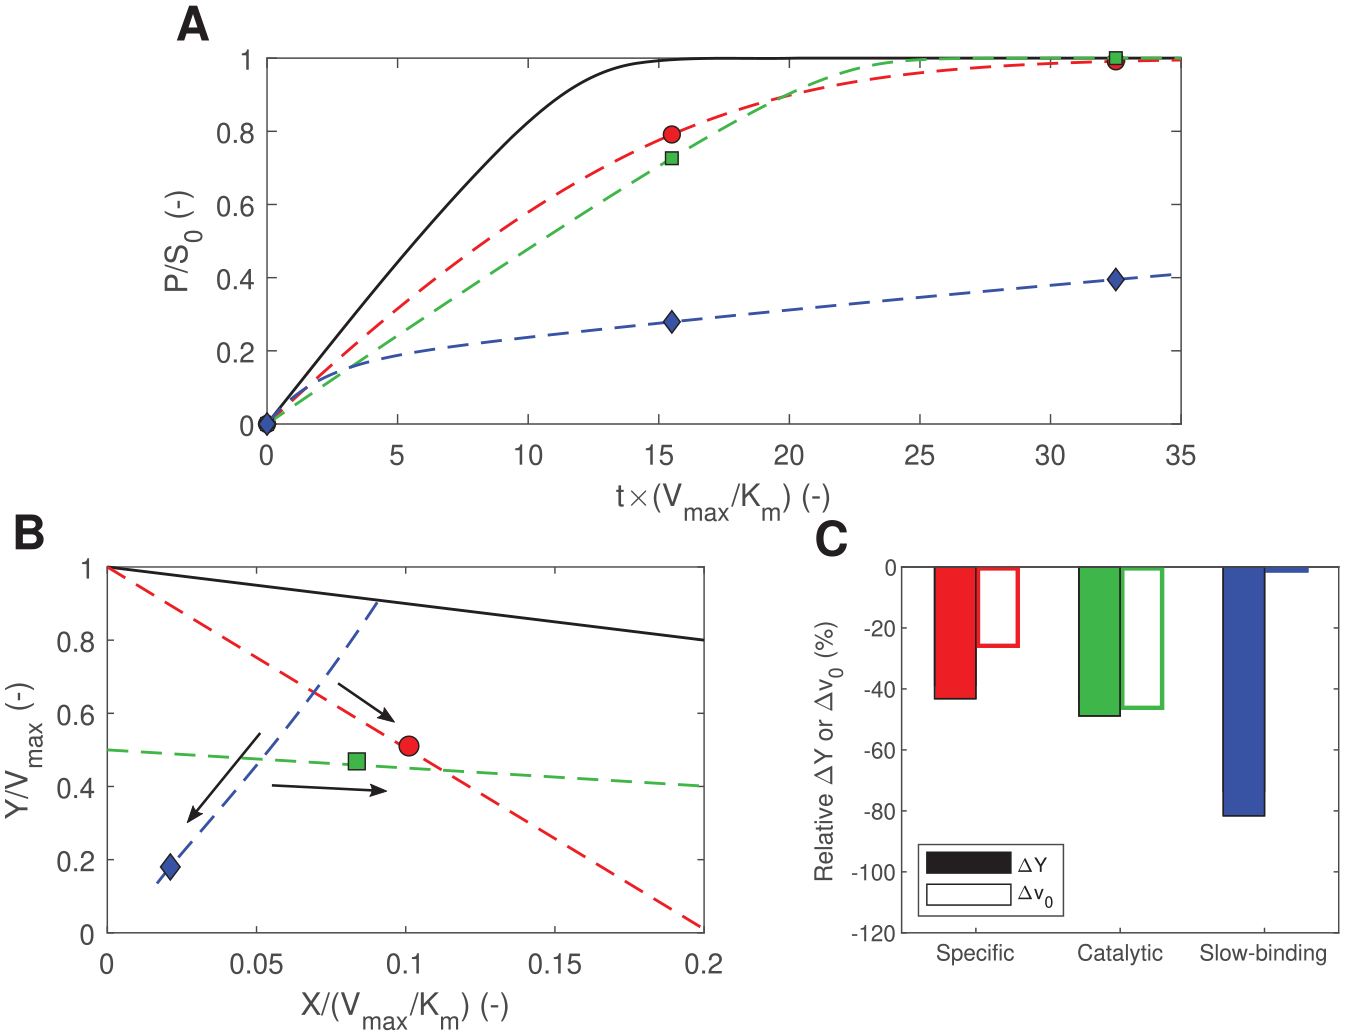
Numerical simulations of different enzyme modifier mechanisms assuming S0 = 10Km. Further details on the numerical methods are given in Supplemental Materials Section 3 and
Supplemental Table S1
. (
The cases depicted in Figure 5 are necessarily limited in number, as many other mechanisms of inhibition, inactivation, activation, and so forth, could be studied for various combinations of substrate, enzyme, and enzyme modifier concentrations. Independently of which scenario is considered, the LM remains highly sensitive to minor kinetic variations, 22 whereas the precursory application of robust validation criteria prevents false hit proliferation. The highly responsive ΔY1 measurable not only normalizes plate-to-plate differences ( Fig. 4B ) but also helps in detecting row- and column-specific variability when fed as an input variable to existing methods of bias detection.31,32 Whenever possible, initial substrate concentrations in the order of magnitude of 10Km should be adopted so as to warrant high efficiency of the 3-point method during the exclusion and selection of HTS results. Although no fixed procedure is imposed for the 3-point selection, narrow ranges of signal readout variation are not recommended due to noise amplification by the logarithm term in the definition of X1 (eq 3a). Consequently, as a rule of thumb, the first and third points may coincide with the beginning and the conclusion of the assay, while the second point may correspond to instantaneous substrate concentrations of ~Km (taking the control-reaction progress curves as reference). The suggested midpoint location may change depending on whether enzyme activators or inhibitors are pursued, since test reactions will finish either much sooner or much later when in the presence of potent activators or inhibitors, respectively.
In summary, harnessing the full power of high-throughput resources is now possible by adopting the 3-point kinetics assay as an alternative to traditional endpoint and kinetic-mode assays. A substantial decrease of false-positive and false-negative rates should be attained by improving the robustness and efficiency of the hit selection methodology. The following advantages of the 3-point method are emphasized:
- Simple implementation: Three-point monitoring can be implemented for a large number of screened reactions running simultaneously—none of the 3 points has to be located within the initial period of constant velocity. Moreover, the relative positions of the 3 points on the time-course may change from well to well or from plate to plate.
- Resilience to experimental variability: Not only time-related variability but also experimental variability can be dealt with by the 3-point methodology. Random changes in, for example, substrate concentration, do not considerably affect the method resolution. Variations in concentration and/or activity of the enzyme can also be accounted for during hit selection.
- Interference-proof: The validation criteria provided by eqs 5–7 are confirmed as powerful tools to eliminate artifacts. On the other hand, the proposed normalization method automatically corrects changes in background signal, which obviates the need for counterassays to identify compound interferences.
- Admissible (and recommended) high substrate concentrations: Although desirable for improving the signal-to-background ratio and detecting uncompetitive inhibitors, high values of S0 are traditionally associated with low sensitivity to competitive inhibitors. With the 3-point method, high substrate concentrations can be adopted without further constraints than the practical limits imposed by substrate solubility and the desired overall duration of the assay.
- Fundamentally based: Both the validation and selection criteria are based on solid enzymology principles and not on subjective judgment.
- High sensitivity: The usage of LM coordinates warrants high sensitivity to minor kinetic variations, while the precursory application of robust validation criteria prevents false hit proliferation. Simple numerical examples show how the 3-point method has evident advantages in the detection of specific-type enzyme modifiers and of time-dependent modulation effects such as slow-binding inhibition.
As a general rule to be followed by HTS assay designers, we recommend that the first and third points are located at the beginning and the conclusion of the assay, while the midpoint location should coincide with instantaneous substrate concentrations slightly above or below ~Km, depending on whether enzyme activators or inhibitors are looked for.
Supplemental Material
20200911_SupplementalMaterial_SLAS – Supplemental material for Major Improvements in Robustness and Efficiency during the Screening of Novel Enzyme Effectors by the 3-Point Kinetics Assay
Supplemental material, 20200911_SupplementalMaterial_SLAS for Major Improvements in Robustness and Efficiency during the Screening of Novel Enzyme Effectors by the 3-Point Kinetics Assay by Maria Filipa Pinto, Francisco Figueiredo, Alexandra Silva, António R. Pombinho, Pedro José Barbosa Pereira, Sandra Macedo-Ribeiro, Fernando Rocha and Pedro M. Martins in SLAS Discovery
Footnotes
Declaration of Conflicting Interests
The authors declared no potential conflicts of interest with respect to the research, authorship, and/or publication of this article.
Funding
The authors disclosed receipt of the following financial support for the research, authorship, and/or publication of this article: This work was financed by (1) Fundo Europeu de Desenvolvimento Regional (FEDER) funds through the COMPETE 2020—Operacional Programme for Competitiveness and Internationalisation (POCI), Portugal 2020, and by Portuguese funds through Fundação para a Ciência e a Tecnologia/Ministério da Ciência, Tecnologia e Ensino Superior (FCT/MCTES) in the framework of projects POCI-01-0145-FEDER-031323 (PTDC/MED-FAR/31323/2017), POCI-01-0145-FEDER-031173 (PTDC/BIA-BFS/31173/2017), and POCI-01-0145-FEDER-007274 (“Institute for Research and Innovation in Health Sciences”); (2) Base Funding—UIDB/00511/2020 of the Laboratory for Process Engineering, Environment, Biotechnology and Energy (LEPABE), funded by national funds through the FCT/MCTES (PIDDAC); and (3) FEDER through Norte Portugal Regional Operational Programme (NORTE 2020), under the PORTUGAL 2020 Partnership Agreement in the framework of Project Norte-01-0145-FEDER-000008.
PhD fellowships SFRH/BD/109324/2015 (M.F.P.) and SFRH/BD/133009/2017 (F.F.) from FCT are acknowledged. Financial support was provided through the Doctoral Program in Biomedical Sciences (ICBAS-UP).
Supplemental material is available online with this article.
References
Supplementary Material
Please find the following supplemental material available below.
For Open Access articles published under a Creative Commons License, all supplemental material carries the same license as the article it is associated with.
For non-Open Access articles published, all supplemental material carries a non-exclusive license, and permission requests for re-use of supplemental material or any part of supplemental material shall be sent directly to the copyright owner as specified in the copyright notice associated with the article.