
Abstract
Glucagon is a vital peptide hormone involved in the regulation of blood sugar under fasting conditions. Although the processes underlying glucagon production and secretion are well understood, far less is known about its degradation, which could conceivably be manipulated pharmacologically for therapeutic benefit. We describe here the development of novel assays for glucagon degradation, based on fluoresceinated and biotinylated glucagon (FBG) labeled at the N- and C-termini, respectively. Proteolysis at any peptide bond within FBG separates the fluorescent label from the biotin tag, which can be quantified in multiple ways. In one method requiring no specialized equipment, intact FBG is separated from the cleaved fluoresceinated fragments using NeutrAvidin agarose beads, and hydrolysis is quantified by fluorescence. In an alternative, high-throughput-compatible method, the degree of hydrolysis is quantified using fluorescence polarization after addition of unmodified avidin. Using a known glucagon protease, we confirm that FBG is cleaved at similar sites as unmodified glucagon and use both methods to quantify the kinetic parameters of FBG degradation. We show further that the fluorescence polarization-based assay performs exceptionally well (Z’-factor values >0.80) in a high-throughput, mix-and-measure format.
Keywords
Introduction
Glucagon is a 29-amino-acid peptide hormone produced by alpha cells of the islet of Langerhans within the pancreas. Regarded as the principal catabolic hormone within the body, glucagon signals the liver to release glucose into the blood under fasting conditions by promoting glycogenolysis and gluconeogenesis, inhibiting glycogenesis, and other effects. Injected glucagon is also used therapeutically to treat a variety of conditions, including low blood sugar, anaphylaxis, and overdose by ß-adrenergic receptor antagonists. Other therapeutic uses pertaining to the management of diabetes mellitus have been proposed. 1
Although the mechanisms underlying the production and secretion of glucagon are well understood, considerably less is known about the catabolic fate of glucagon after its release from the pancreas. Glucagon is known to be hydrolyzed by a number of proteases, including dipeptidyl peptidase IV, 2 neprilysin, 3 and insulin-degrading enzyme (IDE), 4 with a recent study demonstrating that IDE regulates glucagon levels in vivo. 5 The identification of pharmacological inhibitors of glucagon degradation will help elucidate the physiological and pathophysiological roles of this important hormone and its proteases, and such inhibitors may also hold value as therapeutic agents. 1
Although numerous assays for glucagon quantification exist, current assays are expensive, difficult to implement, and/or less than ideal for high-throughput compound screening. Several enzyme-linked immunosorbent assays (ELISAs) for glucagon are available, but these are costly, labor-intensive to execute, and normally provided only in a 96-well format. Assays based on homogeneous time-resolved fluorescence are also available (e.g., Evans et al. 6 ), but not all laboratories have the specialized equipment required for this assay format. Moreover, in our hands, these assays performed poorly for compound screening, with Z’-factor values rarely exceeding 0.3. There is, therefore, a need to develop assays for glucagon degradation more suitable for high-throughput screening (HTS).
We report here on the development and characterization of versatile assays for glucagon degradation based on fluoresceinated and biotinylated glucagon (FBG). We describe assays based on two complementary formats, one that is readily implemented with no specialized equipment, and a second, mix-and-measure, HTS-compatible format based on fluorescence polarization (FP). Using IDE as a prototype glucagon protease, we show that FBG is cleaved at the same sites as unmodified glucagon and hydrolyzed with similar kinetics. Both assays are quantitative, highly sensitive, and usable for a wide range of substrate concentrations. The FP-based assay performs exceptionally well in high-throughput format, yielding Z’-factor values consistently >0.80. These assays will facilitate the discovery of chemical modulators of glucagon degradation and proteolytic processing, which may in turn lead to the development of novel therapeutics for controlling glucagon activity.
Materials and Methods
Materials
FBG ([5FAM]HSQGTFTSDYSKYLDSRRAQDFVQWLMNT[Lys(Ahx-biotin)]-amide) was synthesized via solid-phase peptide synthesis by Thermo Scientific, Inc. (Waltham, MA, USA) and provided at 95% purity ( Suppl. Fig. S1 ). Underivatized human glucagon and NeutrAvidin agarose beads were purchased from Thermo Scientific. Recombinant human IDE was generated as described. 7 Unless otherwise noted, all other reagents and supplies were purchased from Sigma-Aldrich (St. Louis, MO, USA).
Mass Spectrometry
To establish the cleavage sites within FBG and human glucagon, peptides (20 µM) were hydrolyzed by IDE in phosphate-buffered saline (PBS) for varying lengths of time, and the reactions were terminated by addition of 1% formic acid. Excess salts were removed using Millipore C18 Ziptips (Sigma-Aldrich), according to the manufacturer’s recommendations. The intact and digested peptides were eluted in a 1:3 mixture of water–acetonitrile supplemented with 0.1% trifluoroacetic acid, spotted 1:1 with 2,5-dihydroxybenzoic acid or alpha-cyano-4-hydroxycinnamic acid onto a steel sample plate, and subjected to matrix-assisted laser desorption/ionization–time-of-flight (MALDI-TOF) mass spectrometry using the positive reflection mode on an AB SCIEX TOF/TOF 5800 System (AB Sciex Pte. Ltd., Framingham, MA, USA). Observed masses were compared to monoisotopic [M+H]+ masses predicted using PeptideMass. 8
Degradation Assays
Except when otherwise noted, reactions were performed in assay buffer [PBS supplemented with 0.05% biotin-free bovine serum albumin (BSA)] with a final FBG concentration of 1 µM. For avidin–agarose precipitation (AP) experiments, reactions were performed in 1.5-mL microfuge tubes and terminated by the addition of 1,10-phenanthroline (2 mM). Biotinylated species were removed by addition of excess NeutrAvidin agarose beads (≥4 eq. biotin-binding sites), followed by gentle rocking for 30 min and centrifugation at 14,000 ×g for 10 min. The supernatant solution was carefully transferred to 384-well plates (30 µL/well), and fluorescence (λex = 485 nm, λem = 515 nm) was quantified using a multilabel plate reader (SpectraMAX Gemini EM, Molecular Devices Corp., San Jose, CA, USA). For FP-based experiments, medium-throughput reactions were typically performed in 96-well polypropylene plates and terminated by transfer to 384-well plates containing FP Stop Buffer (2 mM 1,10-phenanthroline; 4 eq. of avidin in assay buffer). FP (λex = 485 nm, λem = 515 nm) was quantified on a multilabel plate reader (SpectraMAX M5e; Molecular Devices Corp., San Jose, CA, USA).
High-Throughput Screening
High-throughput FP-based assays were performed by successive addition of protease, experimental compounds or DMSO, FBG, and, after a fixed incubation time, FP stop buffer in low-volume (30 µL/well) 384-well plates. To demonstrate the feasibility of using the assay for HTS, we screened a collection of 753 samples dissolved in DMSO, including known peptidic and nonpeptidic IDE inhibitors and a library of metal-binding pharmacophores,9–11 in duplicate at two different concentrations. The same compounds were also tested in parallel using an amyloid ß-protein (Aß) degradation assay 12 and a fluorescence dequenching assay based on Substrate V [Sub V; Mca-RPPGSFAFK(Dnp)-OH], performed as described. 4 FP was quantified as described above.
Data Analysis
Curve fitting was conducted using Prism 5 for Mac OS X (v. 5b). Percentage changes in mP values were converted to percent hydrolysis using this formula:

where Y = percent hydrolysis and X = percent change in mP. Z’-factor values were calculated according to Zhang and colleagues 13 using the following formula:

where σHI and σLO refer to the standard deviations, and µHI and µLO the means for the high and low data, respectively.
Results
We used a derivatized form of human glucagon, fluoresceinated at the N-terminus and biotinylated at the C-terminus (FBG), and a known glucagon protease, IDE, to develop novel glucagon degradation assays. We explored two formats, each with distinct advantages. In the first format, dubbed avidin-agarose precipitation (AP) the degree of hydrolysis is assessed by removing the intact, biotinylated, and fluoresceinated species using NeutrAvidin agarose beads, then quantifying the amount of cleaved, fluoresceinated fragments remaining in the supernatant by fluorescence. This method has the advantage of requiring no specialized equipment other than a fluorescence plate reader; however, it entails comparatively complex manipulations, including centrifugation and transfer steps ( Fig. 1A ), and thus is not readily adaptable to robotic automation. As expected, the AP method was a very effective means for detecting hydrolysis: intact FBG was nearly entirely removed by precipitation with NeutrAvidin agarose, and completely hydrolyzed FBG yielded a fluorescent signal >33-fold higher ( Fig. 1B ). As controls, we also quantified the fluorescence of intact and fully cleaved FBG in the absence of NeutrAvidin agarose. Hydrolyzed FBG unexpectedly fluoresced more strongly than the intact substrate even in the absence of NeutrAvidin agarose, albeit resulting in a significantly reduced relative signal change (~2.3-fold) as compared to the AP method. Using the AP method to monitor fluorescence as a function of time resulted in progress curves fitted well by hyperbolic curves ( Fig. 1C ).
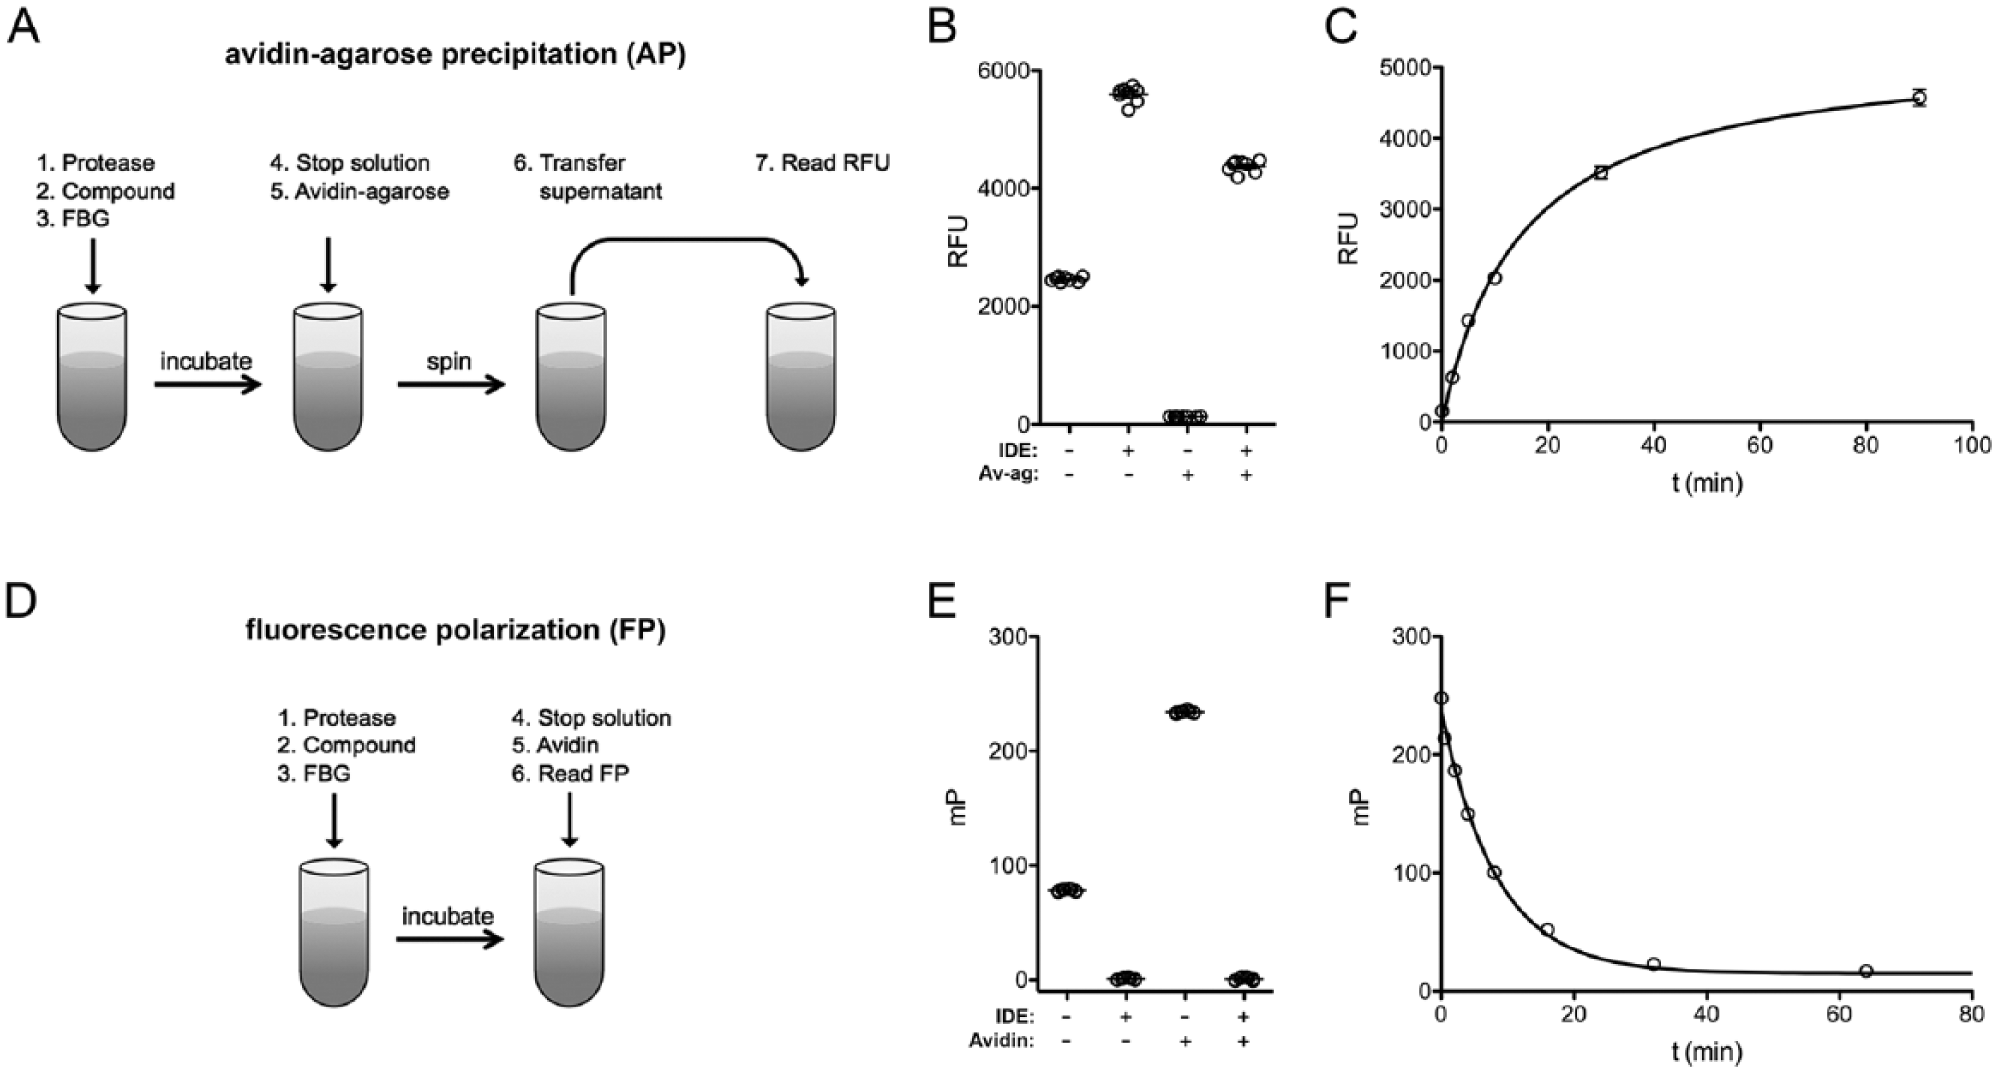
Overview of fluoresceinated and biotinylated glucagon (FBG)-based glucagon degradation assays. Comparison of the experimental protocols and overall performance of (
The second method we explored is based on the use of FP to monitor hydrolysis. 14 Although specialized equipment is required, this approach has the advantage of being a simple mix-and-measure method requiring no centrifugation or transfer steps, making it much more amenable to automation vis-à-vis the AP method ( Fig. 1D ). FP has the further advantage of being a ratiometric rather than an absolute measure and thus is less sensitive to changes in volume or interference by experimental compounds. 14 The FP method exploits the fact that fluorescent species in solution tumble at a rate inversely proportional to their size. Cleaved fragments tumble quickly and hence depolarize polarized light strongly ( Fig. 1E ). Intact FBG, being larger, tumbles more slowly, and, by virtue of the C-terminal biotin moiety, this rate of tumbling of intact FBG can be slowed further by addition of avidin, a 64-kDa tetrameric protein ( Fig. 1E ). A typical progress curve obtained with the FP method is shown in Figure 1F .
Although the foregoing results established the functionality of FBG in both the AP and FP formats, it was critical to establish whether FBG was cleaved at the same sites as underivatized glucagon. To explore this, we used MALDI-TOF to analyze the fragments obtained after various lengths of incubation of FBG or human glucagon with IDE. Consistent with previous findings, 4 we obtained fragments with masses indicative of cleavage occurring C-terminal to Ser16, Arg17, and Trp25 ( Table 1 and Suppl. Fig. S2 ) for both derivatized and underivatized glucagon. These data suggest that the biotin and fluorescein tags do not interfere with the processing of FBG.
Cleavage Sites of FBG and Unmodified Glucagon Determined by Mass Spectrometry.
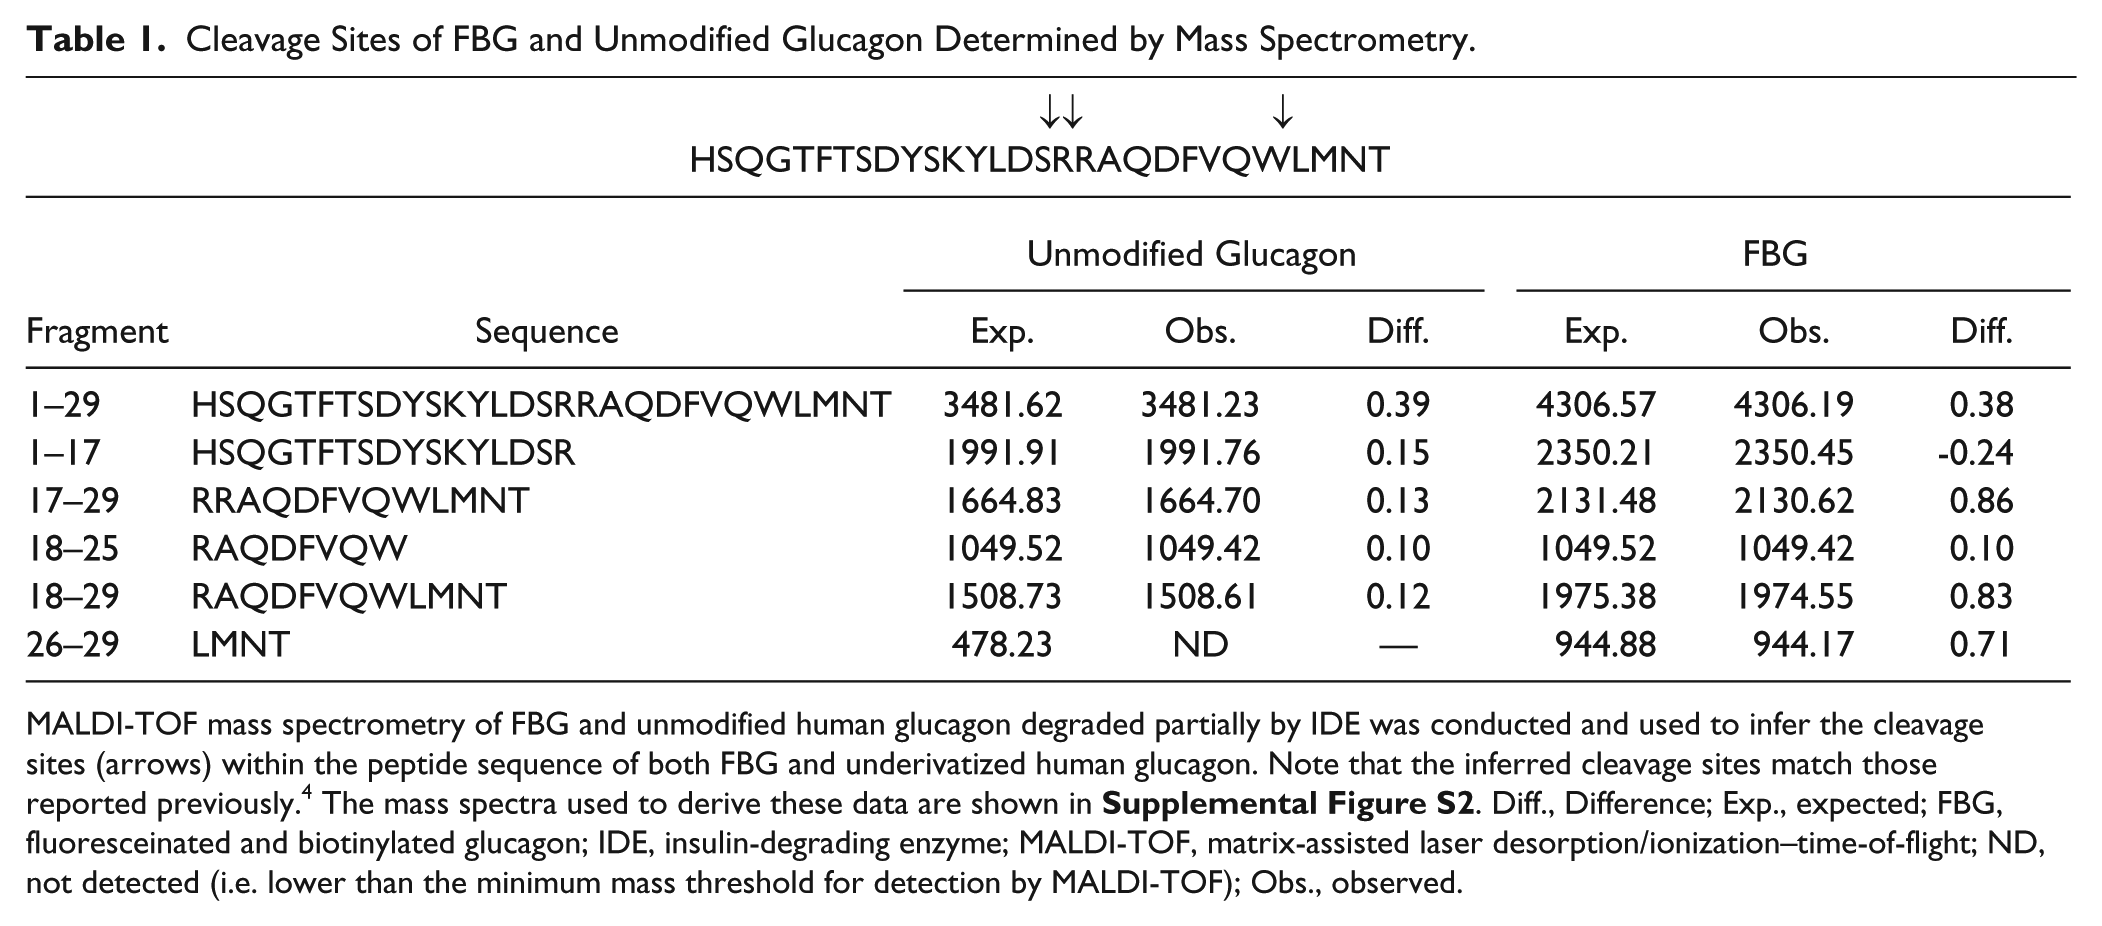
MALDI-TOF mass spectrometry of FBG and unmodified human glucagon degraded partially by IDE was conducted and used to infer the cleavage sites (arrows) within the peptide sequence of both FBG and underivatized human glucagon. Note that the inferred cleavage sites match those reported previously. 4 The mass spectra used to derive these data are shown in Supplemental Figure S2 . Diff., Difference; Exp., expected; FBG, fluoresceinated and biotinylated glucagon; IDE, insulin-degrading enzyme; MALDI-TOF, matrix-assisted laser desorption/ionization–time-of-flight; ND, not detected (i.e. lower than the minimum mass threshold for detection by MALDI-TOF); Obs., observed.
Despite the clear advantages of the FP method from the standpoint of automation, additional complications must be taken into account when it is used for quantitative assays. To illustrate this, we compared the signal changes obtained by the AP versus the FP methods in response to fixed percentages of hydrolyzed versus intact FBG (
Fig. 2A
). As expected, the percent change in
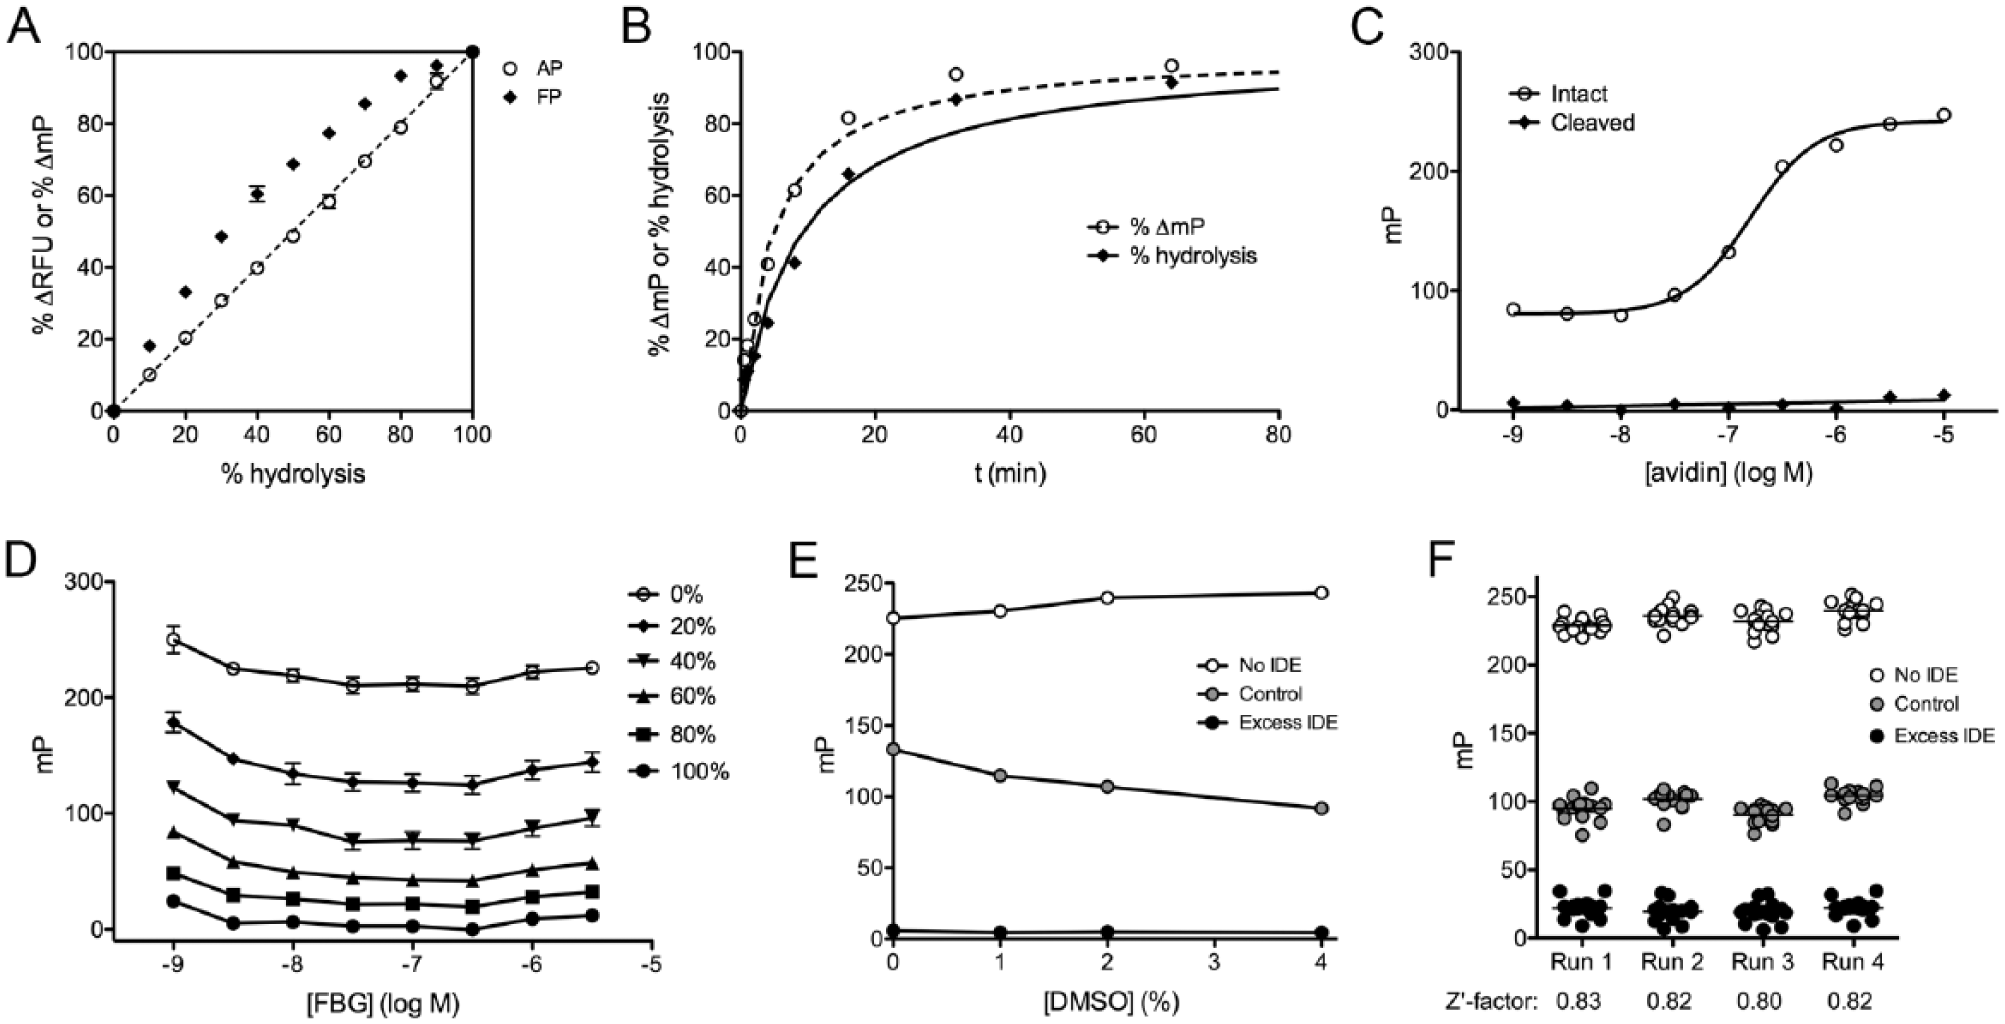
Characterization of the fluorescence polarization (FP)-based glucagon degradation assay. (
As is evident from Figure 1E , the absolute mP values obtained using the FP method depend critically on the avidin concentration. To explore this, we quantified the mP values obtained for intact and fully cleaved FBG in the presence of varying concentrations of avidin ( Fig. 2C ). For intact FBG at a nominal concentration of 500 nM, the EC50 for avidin (monomer) was found to be 160 ± 6.1 nM (n = 3), a value in good agreement with expectations, and essentially complete saturation was obtained with ~1–3 µM avidin. Avidin had no effect on the FP signal of fully hydrolyzed FBG, as expected. In practice, we used at least four equivalents of avidin monomer (i.e., equimolar quantities of tetrameric avidin) per FBG equivalent in our stop solutions.
We also quantified how the FP signal varies as a function of FBG concentration, examining intact and fully cleaved FBG, as well as several fixed percentages of cleaved substrate throughout a wide range of concentrations (1 nM to 3 µM; Fig. 2D ). The raw mP values varied only slightly as a function of concentration, being especially consistent between 10 and 300 nM ( Fig. 2D ). In addition, we examined whether FBG concentration affected the relationship between percent change in mP and percent hydrolysis. With the exception of the very lowest concentrations tested (1 and 3 nM), which showed slightly smaller deviations from linearity relative to all other concentrations, this relationship was essentially unchanged from that shown in Figure 2A (i.e., with 1 µM FBG) at all concentrations at or higher than 10 nM ( Suppl. Fig. S4 ).
To assess the effect of DMSO on the FP-based assay, we tested the assay in the presence of 0, 1, 2, and 4% DMSO. Increasing concentrations of DMSO resulted in increased rates of FBG hydrolysis by a fixed amount of IDE, but the effect on uncleaved and fully cleaved substrate was modest ( Fig. 2E ), suggesting the assay is highly tolerant of DMSO.
To assess quantitatively the suitability of the FP-based glucagon degradation assay in high-throughput format, we conducted four independent experiments in 384-well format (30 µL/well) on separate days, quantifying the maximum and minimum changes in mP values obtained from intact and fully hydrolyzed FBG, as well as testing the percent hydrolysis obtained using a fixed quantity of IDE terminated at a fixed interval of time ( Fig. 2F ). The percent hydrolysis achieved by control reactions was highly consistent (44 ± 1.4%) among the independent runs ( Fig. 2F ). Z’-factor values 13 calculated from the resulting data exceeded 0.80 in all cases and averaged 0.82 ± 0.007 ( Fig. 2F ).
To assess the utility of FBG-based assays for obtaining quantitative data, we determined the kinetic parameters of FBG degradation using both the AP and FP methods. To that end, progress curves were obtained at different substrate concentrations, from which the initial velocity (vo) of each reaction was quantified. As expected, plots of vo as a function of FBG concentration followed a hyperbolic relationship for both the AP ( Fig. 3A ) and FP ( Fig. 3B ) methods, yielding apparent KM values (800 ± 110 nM and 380 ± 72 nM, respectively) and kcat values (1.76 ± 0.19 s−1 and 1.16 ± 0.11 s−1, respectively) in good agreement ( Suppl. Table S1 ).
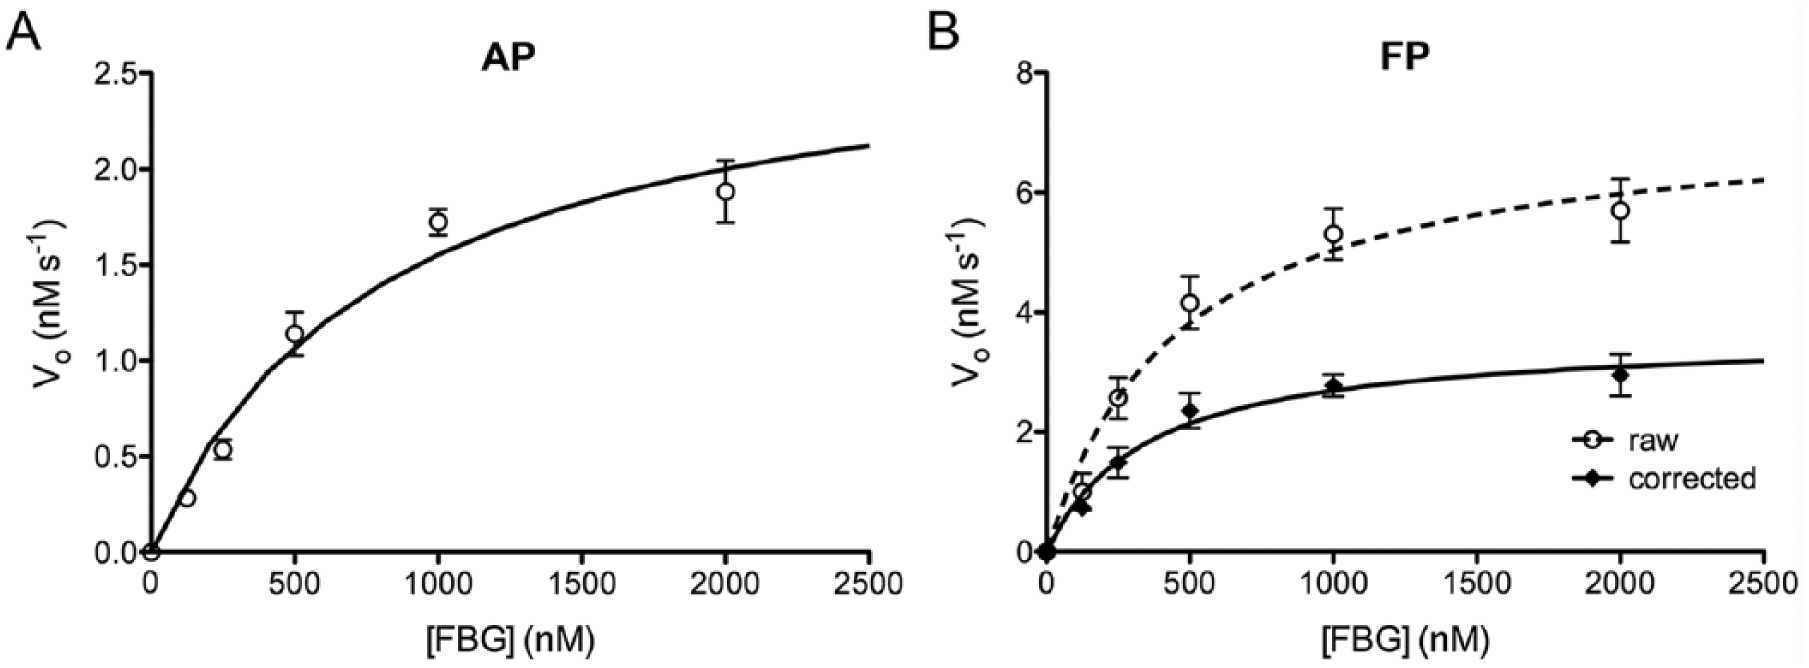
Kinetics of fluoresceinated and biotinylated glucagon (FBG) degradation by insulin-degrading enzyme (IDE). Results obtained using the (
To further validate the FP-based glucagon degradation assay, we used it to characterize two previously described IDE inhibitors in terms of potency and mechanism of action, conducting experiments on separate days to verify whether the assay obtains consistent results. To that end, we conducted dose–response curves on
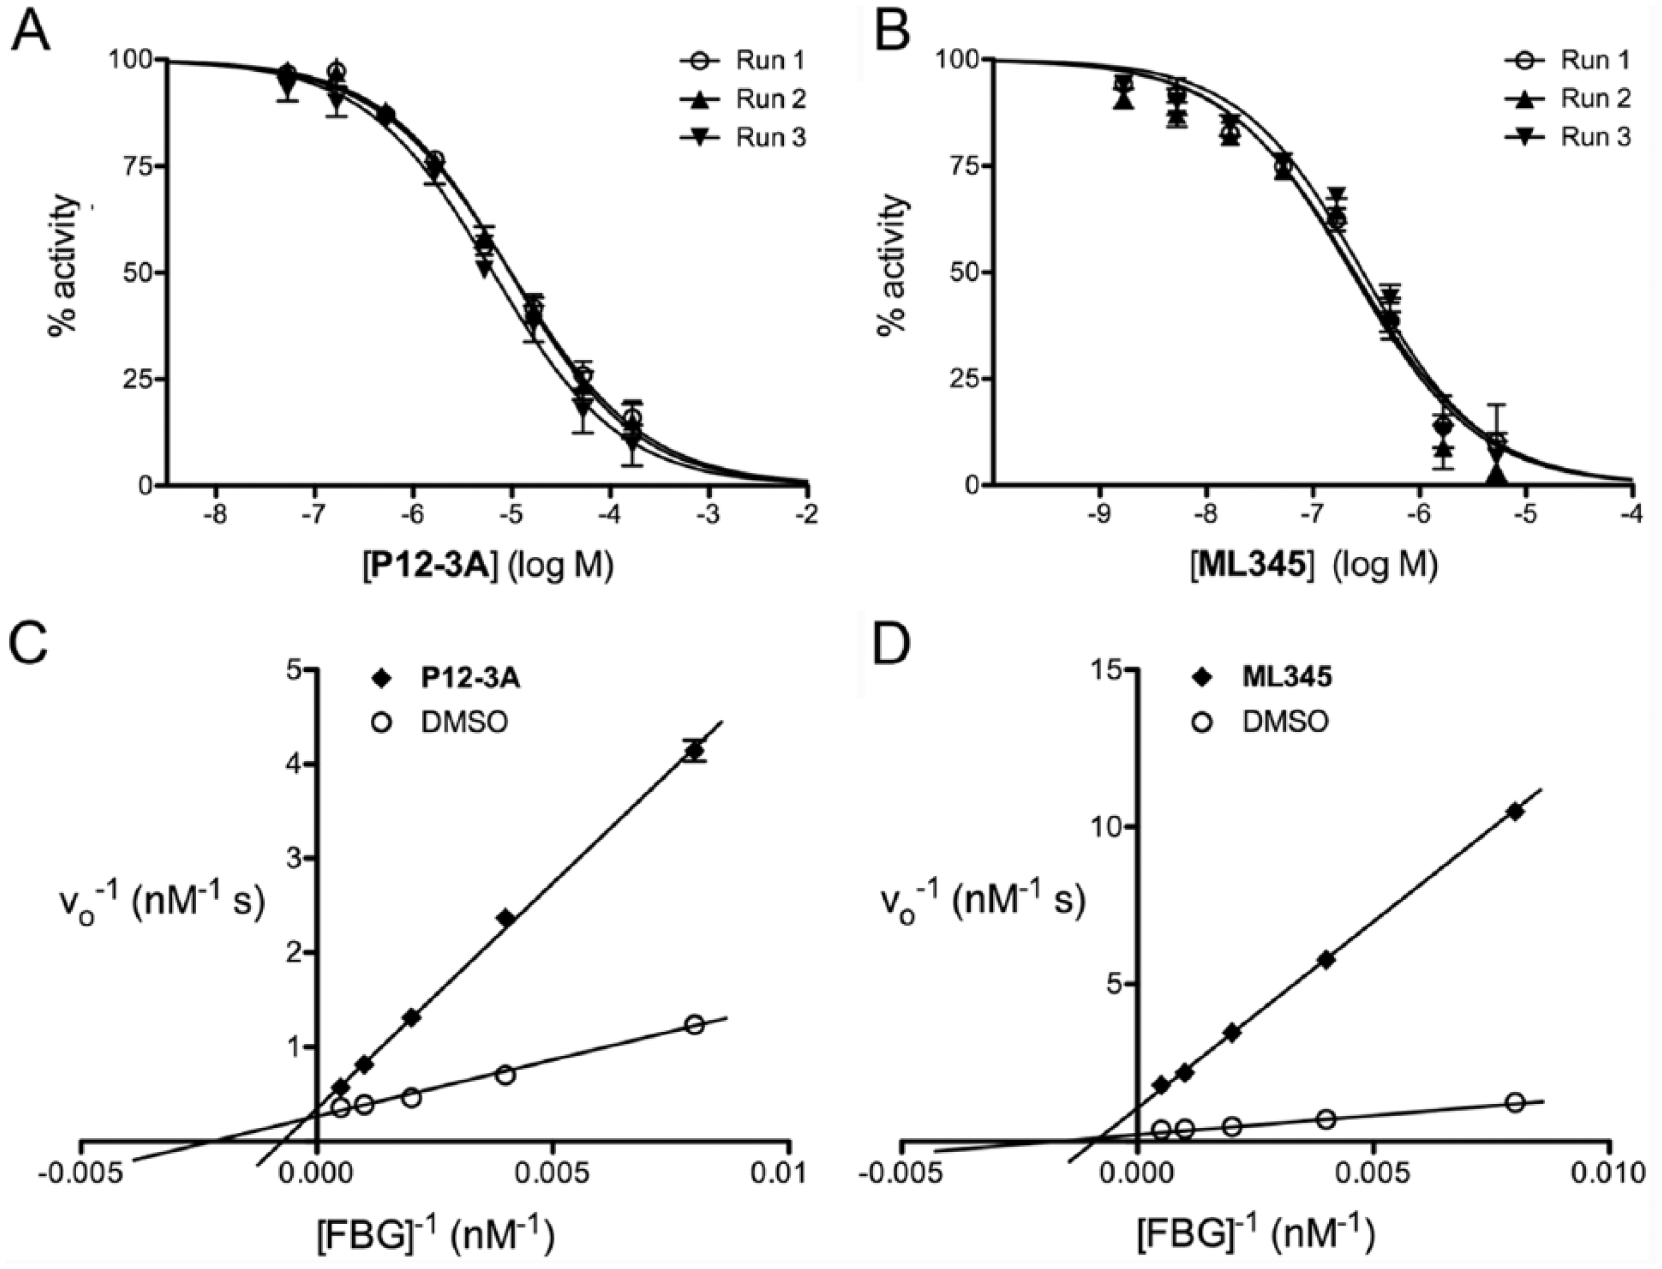
Validation of fluorescence polarization (FP)-based glucagon assay using known insulin-degrading enzyme (IDE) inhibitors. (
To establish the suitability of the FP-based glucagon degradation assay for HTS, we used it to screen a collection of 753 compounds, in duplicate, at two different concentrations (500 µM and 50 µM), for a total of 3012 separate reads plus controls. In parallel, we screened the same compounds using a well-characterized FP-based amyloid ß-protein (Aß) degradation assay 12 and a fluorogenic peptide substrate [Substrate V (Sub V)]. As expected, strong correlations were observed between replicate readings at both 500 µM ( Fig. 5A ) and 50 µM ( Fig. 5D ). Correlations with other assays confirmed the validity of the FBG-based assay and the advantage of the FP format compared to fluorescence-based screens. Comparison with the Aß degradation assay, another FP-based assay, revealed strong but not perfect correlations at both 500 µM ( Fig. 5B ) and 50 µM ( Fig. 5E ). In marked contrast, almost no correlation was observed at either compound concentration between the FBG-based assay and the fluorogenic assay using Sub V ( Fig. 5C , F ), with the latter assay exhibiting evidence of strong activation by some compounds. These results are consistent with previous findings showing that screens conducted with fluorogenic peptide substrates often uncover compounds that exhibit markedly dissimilar activity when tested against endogenous substrates.17,18
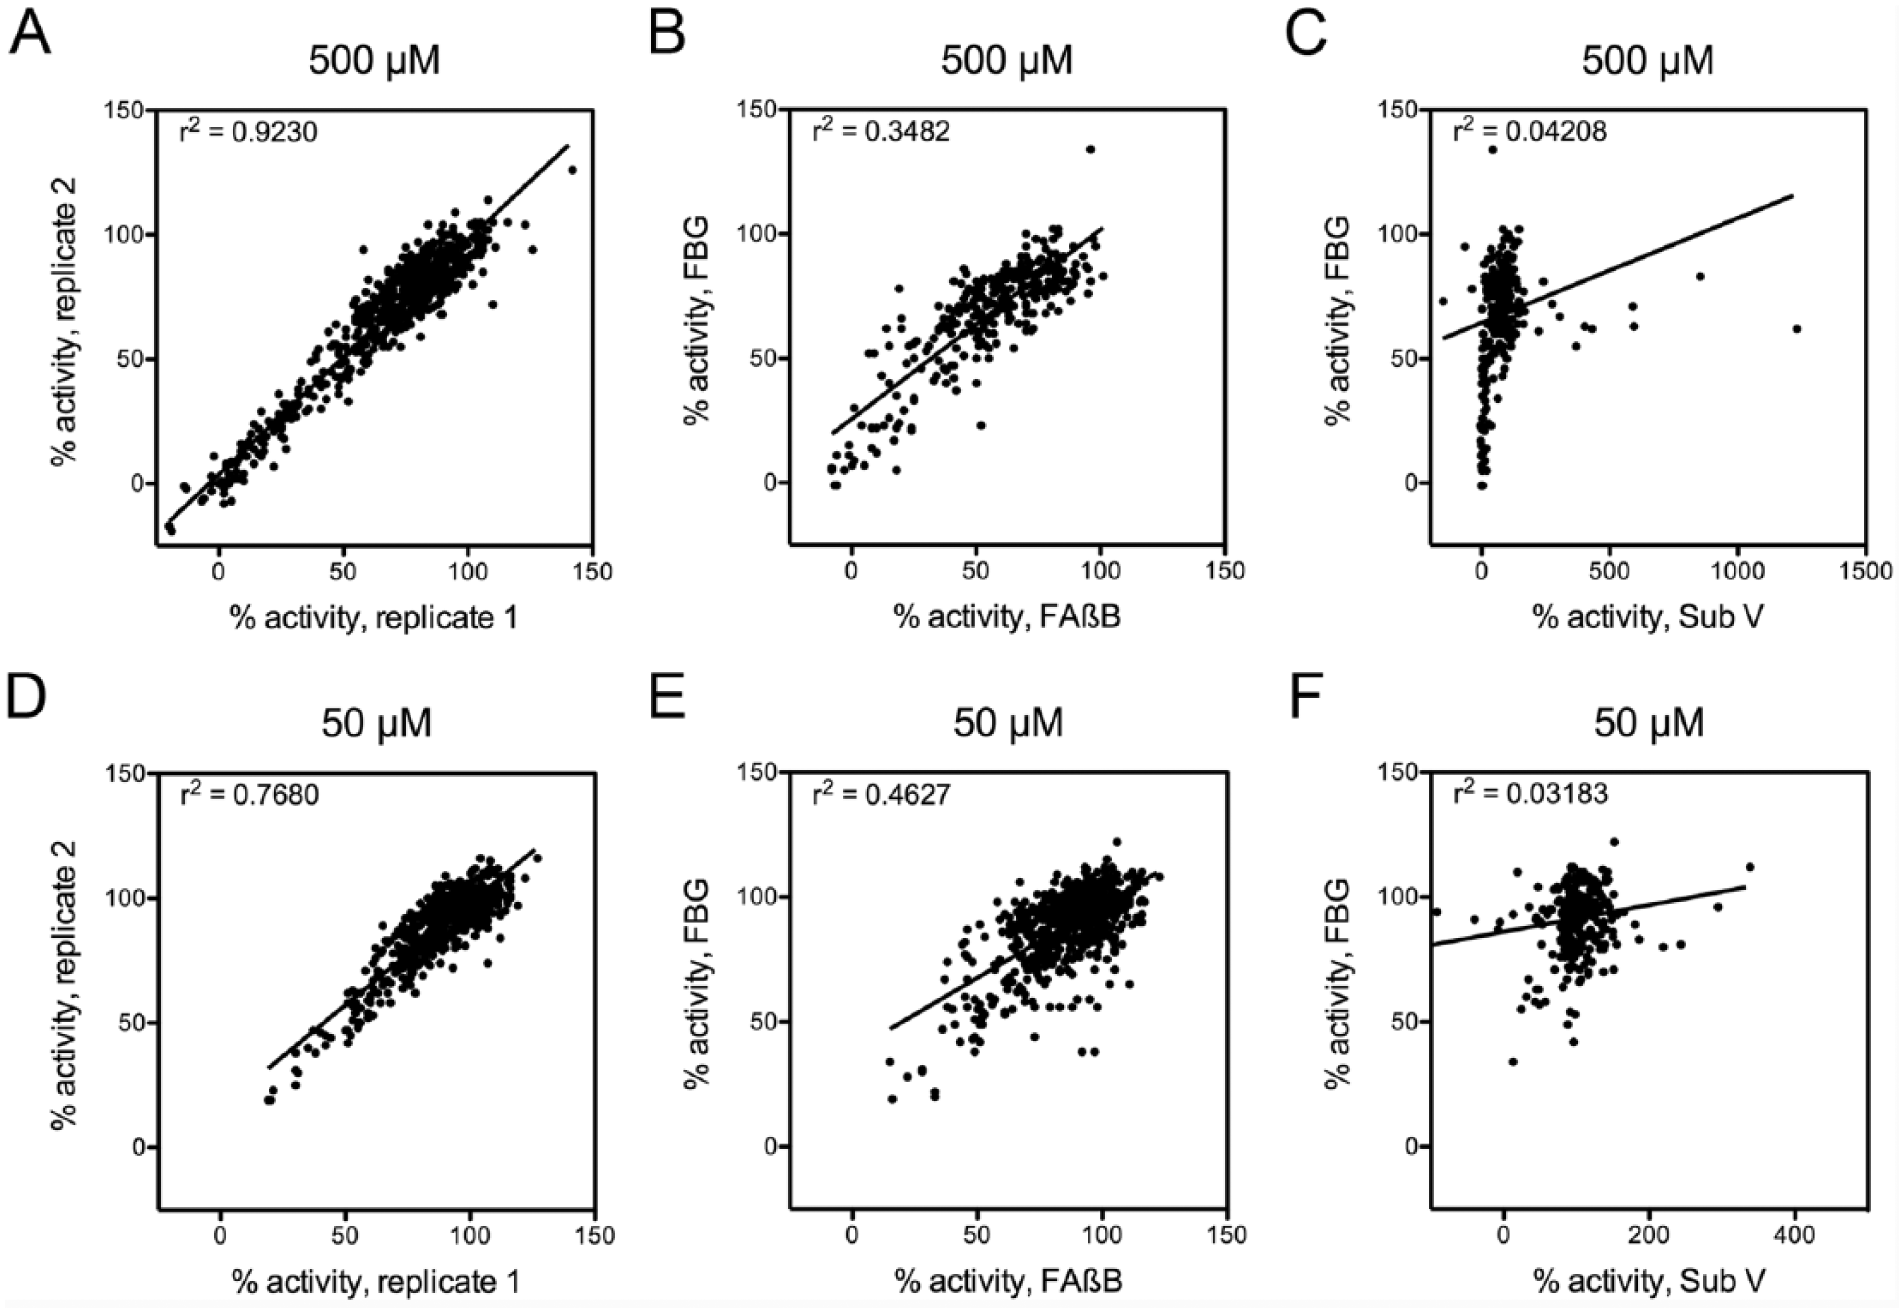
Performance of the fluorescence polarization (FP)-based glucagon degradation assay in high-throughput screening (HTS). Results from screening 753 compounds with the FP-based fluoresceinated and biotinylated glucagon (FBG) assay at (
Discussion
Using a dual-labeled form of glucagon containing N-terminal fluorescein and C-terminal biotin moieties (FBG), we have succeeded in developing novel glucagon degradation assays that are versatile, quantitative, sensitive, and easily and inexpensively implemented. Notably, we demonstrate that the FP-based format of this assay is highly suitable for automated HTS.
Several lines of evidence suggest that FBG is processed similarly to unmodified glucagon, at least for IDE, which has been demonstrated to degrade glucagon in vivo. 5 Consistent with previous results, 4 MALDI-TOF analysis reveals that FBG is cleaved by IDE at the same sites as human glucagon, specifically C-terminal to Ser16, Arg17, and Trp25. Furthermore, the kinetic parameters of FBG degradation obtained with both assay formats are in close agreement with one another and, with certain qualifications, reasonably similar to those reported in a previous study. 19 The latter study, conducted in 1985 by Shroyer and colleagues, reported that glucagon was degraded with an apparent KM of 3.46 µM and kcat of 38.5 min−1 (0.641 s−1) by a semipurified protease that has been inferred—but not definitively proven—to be IDE. More specifically, the protease in this study, purified by affinity chromatography from rat liver, exhibited some characteristics consistent with IDE and others that are inconsistent. As is true for IDE, the purified protease was susceptible to inhibition by bacitracin 20 and thiol-alkylating agents such as N-ethylmaleimide, 21 and it was partially but not completely inhibited by zinc-chelating agents such as ethylenediaminetetraacetic acid (EDTA). 22 The protease purified by Shroyer et al., however, was reported to exhibit a native size of ~180 kDa rather than the correct value of ~220 kDa for the native, homodimeric form of IDE and, more troublingly, was composed of two nonidentical subunits with different isoelectric points, 19 findings that are inconsistent with the purified protease being (exclusively) IDE. These considerations, together with other limitations inherent to the methodology available at the time, raise some doubts about the reliability of the kinetic parameters reported by Shroyer and colleagues, and may account for the modest discrepancy with the results obtained from the AP and FP assays.
The kinetic parameters of FBG degradation by IDE are also consistent with those reported for other IDE substrates. In multiple previous studies performed with the same form of purified recombinant IDE, amyloid-ß protein (Aß) was degraded with KM values of 0.8–1.2 µM and kcat values of 0.88–4.27 s−1 (Leissring et al. 12 and Farris et al. 23 ), values in excellent agreement with those obtained in the present study (see Suppl. Table S1 ). The notable exception is insulin, which was degraded with a KM of 65.7 nM and a kcat value of 0.025 s−1 (Farris et al. 23 ). The significantly lower KM value for insulin reflects the known high affinity of insulin for IDE, 24 whereas the remarkably slower turnover rate of insulin vis-à-vis other substrates is thought to be attributable to the unusually large and rigid structure of insulin, a two-chain, disulfide-bonded substrate that makes extensive contacts with the internal chamber of IDE during processing, 4 thus slowing the rate of release of incompletely hydrolyzed insulin from the protease. 25
As is evident from the performance of the FP-based glucagon degradation assay in HTS format, the assay is highly tolerant of compound screening even at concentrations as high as 500 µM. Due to the ratiometric nature of FP-based assays, the assay is generally unaffected by compounds that absorb strongly, and it also corrects for changes in volume. Because of the relatively long wavelength used for excitation of fluorescein (~488 nm), issues with compound fluorescence are largely obviated. The assay could, however, conceivably be subject to artifacts in the case of compounds that fluoresce strongly in the same wavelengths as fluorescein. As a convenient counterscreening strategy, such compounds can be readily identified by examination of the raw fluorescence data in either the S or P plane, then tested in orthogonal assays.
The assays described in the present study will facilitate the discovery of chemical modulators of glucagon degradation, which are expected to have multiple experimental and possibly therapeutic applications. 1 Given that IDE has been confirmed to mediate glucagon degradation in vivo, 5 it would seem to be an attractive target for such an effort. This idea might appear complicated, however, by the fact that IDE also avidly degrades glucagon’s anabolic counterpart, insulin. 22 Although true, more than a decade of compound screening campaigns with IDE have shown that chemical modulators of IDE can be exquisitely substrate selective, with inhibitors showing widely varying Ki values for different substrates,21,26 in some cases differing by orders of magnitude. 27 Indeed, certain compounds that inhibit the degradation of some IDE substrates can actually activate the degradation of other substrates.17,28–30 These unusual substrate-selective effects arise as a consequence of the unique structure of IDE, which resembles a clamshell that completely encapsulates its substrates during a catalytic cycle. 4 Substrates interact with the inner chamber of the protease at multiple sites besides the region near the active site, thereby permitting additional sites for chemical modulation. The assays developed in the present study will be instrumental, therefore, in the effort to identify compounds that selectively inhibit IDE-mediated glucagon degradation. In addition, the versatile nature of the assay format suggests it could be used for the discovery of chemical modulators of other glucagon proteases and/or the discovery of novel proteases mediating the degradation and/or processing of glucagon.
Supplemental Material
DS_DISC786509 – Supplemental material for Development and Characterization of Quantitative, High-Throughput-Compatible Assays for Proteolytic Degradation of Glucagon
Supplemental material, DS_DISC786509 for Development and Characterization of Quantitative, High-Throughput-Compatible Assays for Proteolytic Degradation of Glucagon by Caitlin N. Suire, Shelley Lane and Malcolm A. Leissring in SLAS Discovery
Footnotes
Acknowledgements
We thank Dr. Benjamin Katz for assistance with mass spectrometry, Dr. Daniele Piomelli for granting access to the Molecular Devices SpectraMAX M5e, and Dr. Seth Cohen for providing the library of metal-binding pharmacophores.
Supplemental material is available online with this article.
Declaration of Conflicting Interests
The authors declared no potential conflicts of interest with respect to the research, authorship, and/or publication of this article.
Funding
The authors disclosed receipt of the following financial support for the research, authorship, and/or publication of this article: This work was supported by a grant from the National Institutes of Health (R01-GM115617) to MAL.
References
Supplementary Material
Please find the following supplemental material available below.
For Open Access articles published under a Creative Commons License, all supplemental material carries the same license as the article it is associated with.
For non-Open Access articles published, all supplemental material carries a non-exclusive license, and permission requests for re-use of supplemental material or any part of supplemental material shall be sent directly to the copyright owner as specified in the copyright notice associated with the article.