
Abstract
Peptidoglycan biosynthesis is an essential process in bacteria and is therefore a suitable target for the discovery of new antibacterial drugs. One of the last cytoplasmic steps of peptidoglycan biosynthesis is catalyzed by the integral membrane protein MraY, which attaches soluble UDP-N-acetylmuramoyl-pentapeptide to the membrane-bound acceptor undecaprenyl phosphate. Although several natural product–derived inhibitors of MraY are known, none have the properties necessary to be of clinical use as antibacterial drugs. Here we describe a novel, homogeneous, fluorescence resonance energy transfer–based MraY assay that is suitable for high-throughput screening for novel MraY inhibitors. The assay allows for continuous measurement, or it can be quenched prior to measurement.
Keywords
Introduction
Most bacterial pathogens require continuous biosynthesis and remodeling of their peptidoglycan cell walls for survival. Some antibacterial drugs interfere with periplasmic/extracellular steps in this process, such as β-lactams (e.g., penicillins and cephalosporins), vancomycin, and ramoplanin. Fosfomycin, which inhibits MurA, and D-cycloserine, which inhibits alanine racemase and D-Ala-D-Ala ligase, are the only existing antibacterial drugs that inhibit the cytoplasmic enzymes directly involved in peptidoglycan precursor biosynthesis. Recent attempts to discover novel antibacterial drugs have targeted many of these cytoplasmic enzymes.1,2 One of the last cytoplasmic steps in bacterial peptidoglycan biosynthesis is the attachment of UDP-N-acetylmuramoyl-pentapeptide (UNAM-pp) to the membrane-bound carrier lipid undecaprenyl phosphate (C55P) by the translocase enzyme MraY (E.C. 2.7.8.13), an integral membrane protein. 3 Several natural product inhibitors of this enzyme have been discovered that have antibacterial activity,4,5 such as mureidomycin, liposidomycin, capuramycin, and muraymycin, validating MraY as a target for antibacterial drugs. None of these natural product inhibitors has reached clinical practice in humans, however.
High-throughput screening of chemical compound libraries is one approach that could be used to search for new drug-like inhibitors of MraY as starting points for antibacterial drug discovery. Screening assays suitable for this purpose are required. Weppner and Neuhaus 6 introduced the use of N-dansyl-UNAM-pp, the fluorescence intensity of which increases when it is translocated from the bulk aqueous phase to a lipid membrane or detergent micelle containing MraY and C55P. Stachyra et al. 7 showed how this technique could be used in a high-throughput screening format. Other investigators have reported radioisotope-based high-throughput-compatible MraY assays, such as scintillation proximity assays.8,9
In this article, we report a novel, homogeneous fluorescence resonance energy transfer (FRET)–based assay for the translocase activity of MraY in which the donor fluorophore is attached to UNAM-pp and the acceptor is embedded in detergent micelles containing MraY and C55P ( Fig. 1 ). The new assay has certain advantages over previously reported MraY assays. (1) It uses no radioisotopes, avoiding the difficulties associated with radioactive waste disposal and equipment contamination, as well as the high cost of scintillation proximity beads or assay plates. (2) The excitation wavelength of the FRET donor fluorophore is in the visible part of the spectrum rather than the ultraviolet, as with the dansyl label, reducing the interference from test compound light absorption and autofluorescence. (3) By measuring the ratio of fluorescence intensities of acceptor to donor fluorophores when donor fluorophore excitation is used, the FRET assay has greater precision than a single fluorescence intensity measurement. The FRET assay can be used in either continuous or quenched mode.
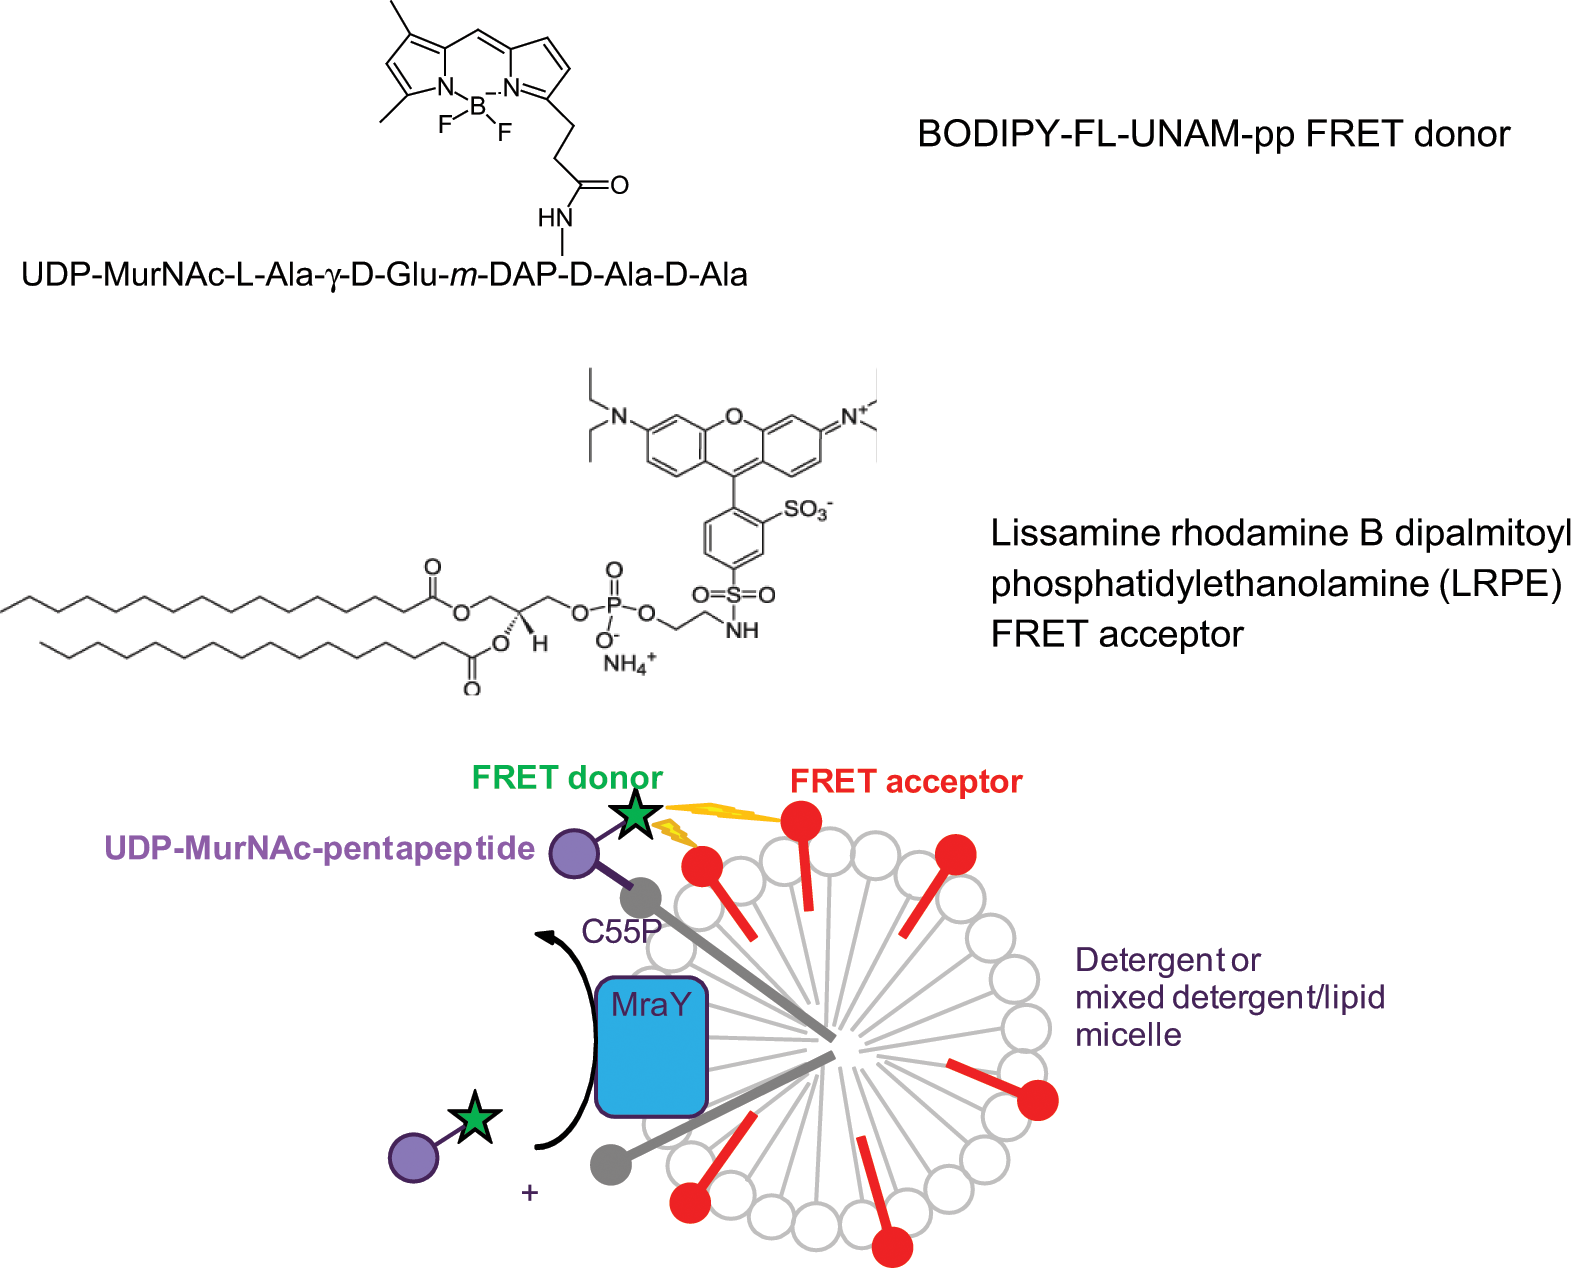
Schematic of the fluorescence resonance energy transfer (FRET) assay for MraY activity. When detergent micelles containing solubilized MraY protein from Escherichia coli membranes (blue) as well as C55P (gray) and FRET acceptor lipid (red) are mixed with UNAM-pp (purple) labeled with FRET donor (green), MraY catalyzes the transfer of the labeled UNAM-pp to the C55P, bringing the FRET donor into close proximity to the FRET acceptor. Energy transfer between the donor and acceptor (represented by lightning bolts) causes a reduction in donor fluorescence and, potentially, an increase in acceptor fluorescence. The increase in acceptor fluorescence may not be observed if the donor concentration is much lower than the acceptor concentration or if the acceptor is not fluorescent. In the method reported here, the FRET donor attached to UNAM-pp is BODIPY-FL (B-UNAM-pp), and the FRET acceptor lipid is Lissamine rhodamine B dipalmitoyl phosphatidylethanolamine (LRPE).
Materials and Methods
Chemicals
C55P was obtained from Larodan Fine Chemicals (Malmö, Sweden) and dissolved in Triton X-100 (Thermo Fisher Scientific Pierce Protein Research Products). 1,2-dipalmitoyl-sn-glycero-3-phosphoethanolamine-N-(lissamine rhodamine B sulfonyl) (LRPE) was obtained as a powder from Avanti Polar Lipids (Alabaster, AL) and reconstituted as a suspension in distilled water. Tunicamycin was obtained as a powder from Sigma (St. Louis, MO) and reconstituted with DMSO. Trehalose was from Sigma. Escherichia coli phosphatidylglycerol powder (Avanti Polar Lipids) was suspended in distilled water and sonicated prior to use. The preparation of UNAM-pp is described in the Supplemental Material.
Cloning and expression of E. coli mraY
E. coli mraY cloning followed the method previously described. 10 The mraY gene was cloned from chromosomal DNA of wild-type E. coli strain MG1655 using the polymerase chain reaction. Amplification was performed using High Fidelity PCR Master (Roche Applied Science, Indianapolis, IN) and the following primers (Eurofins MWG Operon, Huntsville, AL): 5′-AGGAACATGTCCCATCACCATCACCATCACATGTTAGTTTGGCTGGCCG-3′ and 5′-TAGGAGATCTTTA ACGTACCTTCAGCGTTGCC-3′.
The PCR product was digested with Pci1 and Bgl11 and then purified using a QuickStep 2 PCR Purification Kit (EDGE Biosystems, Gaithersburg, MD). The resulting fragment was then ligated to expression vector pET28b (EMD Chemicals, Gibbstown, NJ), which had been digested with Nco1 and BamH1, producing the plasmid pET28b-mraY. The DNA sequence of the cloned mraY gene, including an N-terminal His6 tag, was confirmed by sequencing on an ABI PRISM 3100 DNA sequencer (Applied Biosystems, Foster City, CA) using a Big Dye Terminator Cycle Sequencing Kit (Applied Biosystems). Computer analysis of DNA sequences was performed with Sequencher (Gene Codes Corporation, Ann Arbor, MI).
For membrane preparation, the plasmid was transformed into E. coli strain BL21(DE3)ΔacrB and plated on Luria-Bertani agar containing 25 µg/mL kanamycin at 37 °C overnight. A single colony of BL21(DE3)ΔacrB/pET28b-mraY was inoculated into a 25 mL culture of 2XYT (Qbiogene, Carlsbad, CA) with 0.2% glucose containing 25 µg/mL kanamycin and grown overnight at 37 °C. Ten milliliters of the overnight culture was added per 1 L of 2XYT with 0.2% glucose containing 25 µg/mL kanamycin and grown at 37 °C with aeration to the mid-logarithmic phase (OD600 = 0.4). The cells were harvested by centrifugation at 5000g for 15 min at 25 °C. Cell paste was stored at −20 °C.
Preparation of membranes from MraY-overexpressing E. coli
All operations were performed at 4 °C. The pellets from 2 L of bacterial culture were suspended in 40 mL of lysis buffer consisting of 50 mM Tris-HCl (pH 7.5), 1 mM MgCl2, 2 mM dithiothreitol, and 1 protease inhibitor cocktail tablet (Roche Diagnostics). Cells were disrupted by passing them twice through a French press operated at 18 000 psi. The extract was centrifuged at 3500g for 45 min. The supernatant was ultracentrifuged at 150 000g for 45 min. The pellet was resuspended with 40 mL of lysis buffer and ultracentrifuged as before three times. The final pellet was resuspended in 1 mL of lysis buffer. The protein concentration was determined by the method of Bradford. 11 The membrane preparation was stored at −80 °C. The MraY activity in these membranes was approximately twofold higher than in membranes prepared from cells lacking the MraY expression vector. MraY is a low-abundance protein, and no band having visibly increased thickness corresponding to MraY was visible by Coomassie Blue-stained SDS-PAGE of membranes from MraY-overexpressing cells.
Preparation of N-BODIPY-FL-UNAM-pp (B-UNAM-pp)
All operations were performed at room temperature. UNAM-pp was labeled on the free amino group of diaminopimelic acid by reaction with BODIPY-FL-sulfosuccinimidyl ester (Invitrogen, Carlsbad, CA). Four milligrams of UNAM-pp in 733 µL of 0.4M NaHCO3 was mixed with 5 mg of solid BODIPY-FL-sulfosuccinimidyl ester. After a 1 h reaction, the reaction mixture was passed over a 1 × 18 cm column of Sephadex LH-20 (Sigma) equilibrated and eluted with distilled water. Fractions of 1 mL were collected and analyzed by UV-visible absorbance spectroscopy, high-performance liquid chromatography (HPLC), and mass spectrometry. All experiments described herein were performed with one fraction that showed a single peak by HPLC and had the correct mass of 1468 Da.
Fluorescence measurements
MraY reactions were performed in triplicate at room temperature in 8 or 9 µL volume in low-volume, 384-well, black, polystyrene assay plates (Matrix Technologies). Fluorescence was excited at 485 nm, and emission was measured simultaneously at 520 nm and 590 nm with a Pherastar plate reader (BMG Labtech, Cary, NC). The gain for both emission channels was 20. The focal height was 10.6 mm. Each reading usually consisted of 20 flashes. Measurements were made at 1 min intervals for 1 h. Triplicate time courses were averaged. Exceptions to this procedure are noted in the text or figure legends.
Effect of DMSO on MraY activity
Reactions contained 20 µM C55P, 16 µM LRPE, 40 µg/mL MraY-containing E. coli membrane protein, 4 µM B-UNAM-pp, and various concentrations of DMSO in buffer consisting of 50 mM Tris-HCl (pH 7.5), 100 mM KCl, 10 mM MgCl2, 1 mM dithiothreitol, and 0.04% Triton X-100. Fluorescence was measured as described in the legend to Figure 2 with 20 flashes/reading. Triplicate time courses were averaged. Initial rates of F520 decrease were calculated based on the linear fluorescence decrease between 0 and 10 min.
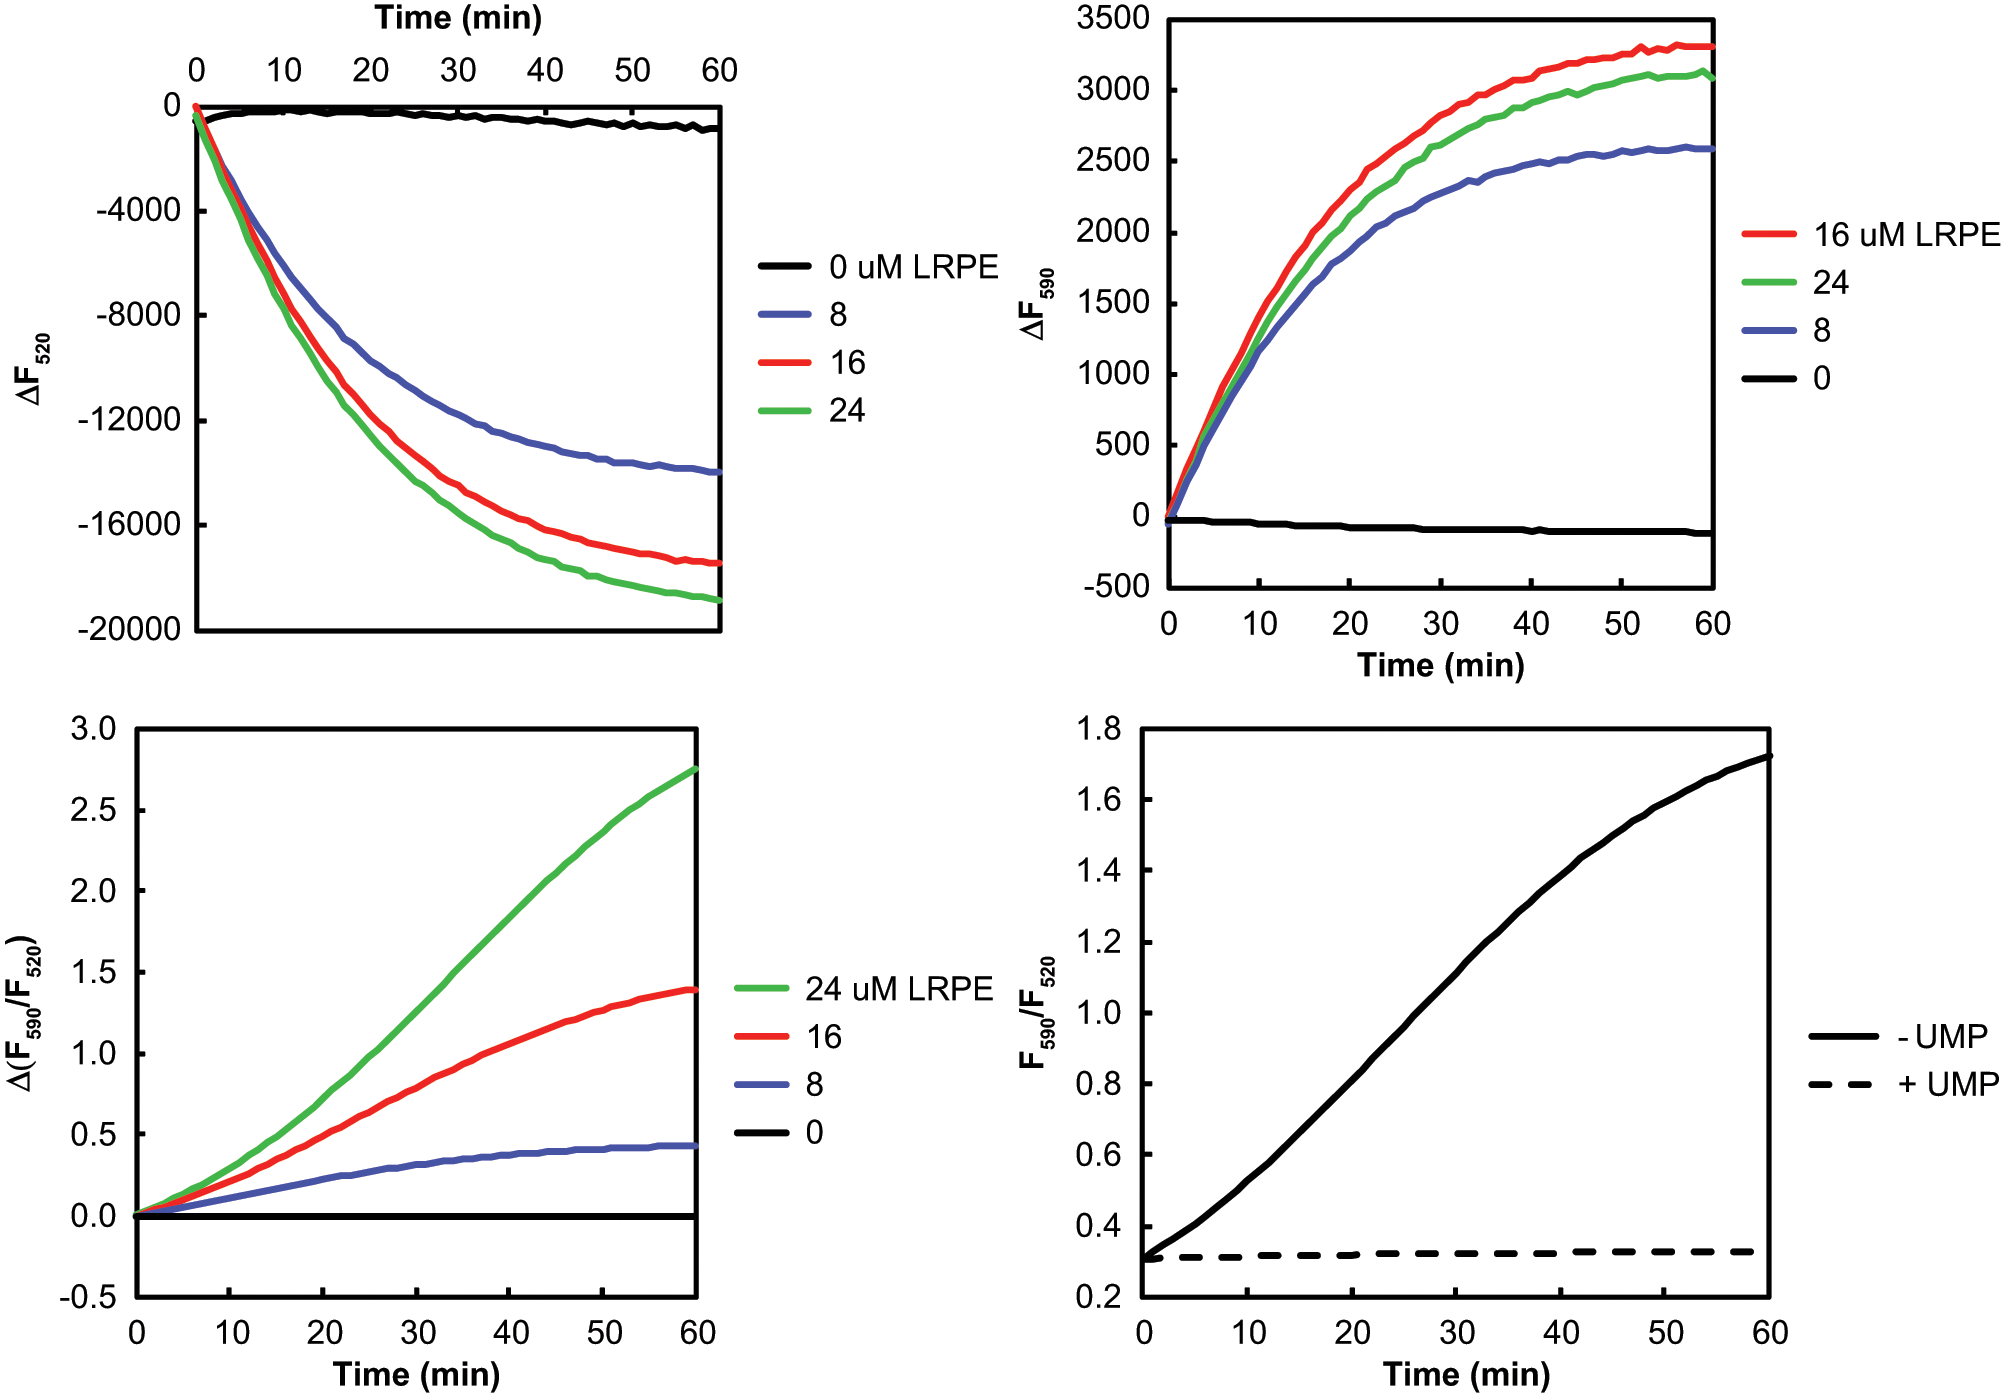
Fluorescence measurements in the fluorescence resonance energy transfer (FRET) assay for MraY activity. LRPE, C55P, and Escherichia coli membranes containing MraY were mixed together in a 6 µL volume and preincubated for 30 min. The Triton X-100 concentration during the preincubation was 0.06%. Reactions were initiated by the addition of 3 µL of B-UNAM-pp ± UMP. The final concentrations were 0 to 24 µM LRPE, 20 µM C55P, 50 µg/mL membrane protein, 2 µM B-UNAM-pp, and 0 or 5 mM UMP in buffer containing 50 mM Tris-HCl (pH 7.5), 100 mM KCl, 50 mM MgCl2, 1 mM dithiothreitol, and 0.05% Triton X-100. Each progress curve is the average of three replicate wells, or the difference between averages without UMP and with UMP, as indicated by Δ. The order of traces from top to bottom is indicated by the legend in each panel, and the traces in panels
HPLC assay of MraY activity
B-UNAM-pp consumption was monitored by the decrease in area of the B-UNAM-pp fluorescence peak using an Agilent 1200 HPLC equipped with a 2 × 50 mm Jupiter 5 µM, 300Å C4 column (Phenomenex, Torrance, CA). Mobile phase A was 20 mM ammonium acetate in 3:1:1 water:methanol:isopropanol. Mobile phase B was 20 mM ammonium acetate in 1:1 methanol:ispropanol. The column was eluted with 100%A for 3 min, a gradient of 100%A to 100%B in 2 min, then 100%B for 5 min. 7 The flow rate was 0.5 mL/min at room temperature. The B-UNAM-pp peak eluted at 5.7 min. Fluorescence detection used 485 nm excitation and 520 nm emission.
Results
The principle of the MraY FRET assay is shown in Figure 1 . Detergent micelles containing MraY protein, the lipid substrate C55P, and the FRET acceptor-labeled lipid LRPE are combined with the soluble FRET donor-labeled peptide substrate B-UNAM-pp. The translocase activity of MraY attaches B-UNAM-pp to C55P, bringing the FRET donor into proximity with the FRET acceptor. When the donor fluorescence is excited, energy transfer from donor to acceptor results in a decrease in donor fluorescence and, potentially, an increase in acceptor fluorescence. We used purified membranes from E. coli cells overexpressing E. coli MraY as the source of MraY, but the assay could also use purified MraY.
BODIPY-FL was selected as the FRET donor for attachment to B-UNAM-pp because it has very bright fluorescence; its excitation and emission wavelengths are similar to those of fluorescein, allowing standard filters to be used in assay plate readers; it resists photobleaching, making it suitable for a continuous assay that requires repeated exposure to excitation light; and it is available commercially as a water-soluble sulfosuccinimidyl ester at an acceptable cost for use in UNAM-pp labeling. LRPE was selected as the FRET acceptor lipid because it has a suitable degree of overlap between its absorbance spectrum and the emission spectrum of BODIPY-FL, it is available commercially at an acceptable cost, and it has saturated acyl chains, avoiding instability due to oxidation.
Figure 2 shows the measurement of MraY activity using the FRET assay with E. coli membranes from cells in which MraY was overexpressed. The LRPE concentration was varied with 2 µM B-UNAM-pp, 20 µM C55P, and 50 µg/mL membrane protein. The Triton X-100 concentration was 0.05%. Reactions were run with or without 5 mM UMP as a negative control. The MraY reaction is reversible, and the product UMP acts as an inhibitor. Figure 2A shows the time- and MraY-dependent reduction in B-UNAM-pp fluorescence at 520 nm due to FRET between B-UNAM-pp and LRPE when the system is exposed to 485 nm excitation. The essentially constant fluorescence in the presence of 5 mM UMP (see Fig. 2D ) has been subtracted. The 520 nm fluorescence decrease should be directly proportional to the consumption of B-UNAM-pp. The extent of the B-UNAM-pp fluorescence decrease was larger at higher LRPE concentrations because of the greater proximity of LRPE acceptor molecules to BODIPY-FL-labeled product molecules at higher LRPE concentrations. There was no further increase in the effect at LRPE concentrations greater than 24 µM, suggesting either that the capacity of the detergent micelles for LRPE had been reached or that no further increase in energy transfer efficiency between BODIPY-FL-labeled product and LRPE was possible. At the same time, there was an MraY- and time-dependent LRPE fluorescence increase at 590 nm due to FRET ( Fig. 2B ), on which there was only a modest effect of LRPE concentration, with a maximal effect at 16 µM LRPE. LRPE fluorescence is a combination of its own fluorescence due to excitation by 485 nm light and FRET-enhanced fluorescence. As the LRPE concentration increases relative to the B-UNAM-pp concentration, a greater proportion of the 590 nm fluorescence is not due to FRET and therefore does not respond to the MraY reaction. In addition, self-absorption of exciting and emitted light (inner filter effect) at high LRPE concentrations reduces the measured fluorescence. At 0.1 µM B-UNAM-pp and 16 µM LRPE, the 590 nm fluorescence is essentially constant during the MraY reaction because the contribution from FRET is negligible.
The presence of the LRPE FRET acceptor is not necessary for the MraY reaction to occur, although it cannot be detected by a B-UNAM-pp fluorescence intensity change. The B-UNAM-pp fluorescence anisotropy, in contrast, increased with time in the absence of UMP but not in its presence (
The change in the 590 nm to 520 nm fluorescence emission ratio as a function of MraY reaction time (without UMP minus with UMP) is shown in Figure 2C . This measurement is the difference between fluorescence intensity ratios, not the ratio of the differences, that is, Δ(F590/F520), not ΔF590/ΔF520. The ratiometric measurement has less noise than the individual fluorescence intensity measurements because it eliminates fluctuations that affect both measurements equally. The ratio change increased in size with reaction time and with LRPE concentration. The curves have a distinctly sigmoid shape (see below). The theoretical explanation for this behavior of the fluorescence ratio change in FRET assays has been given previously. 12 It is due mainly to the fact that although the numerator may be constant or increase slightly, the denominator decreases in direct proportion to the fraction of substrate converted to product.
In Figure 2D , the fluorescence ratio change is shown with time at 16 µM LRPE with and without 5 mM UMP. With the inhibitor present, there is a negligible change in the fluorescence ratio, whereas without UMP, there is a large increase in the fluorescence ratio with time. The inhibitory effect of UMP demonstrates that the signal in the assay is due to the MraY reaction. The progress curve of the uninhibited reaction shows the characteristic concavity at shorter reaction times and then levels off at longer reaction times because the reaction slows down as the substrate is consumed and the products accumulate, resulting in a sigmoid shape.
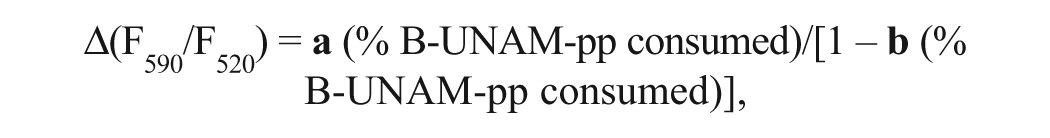
The concave shape of the plot of Δ(F590/F520) versus percentage of substrate consumed is shown in Figure 3 for the MraY FRET assay with 0.1 µM B-UNAM-pp and 16 µM LRPE. The data points were fit to the hyperbolic equation
where
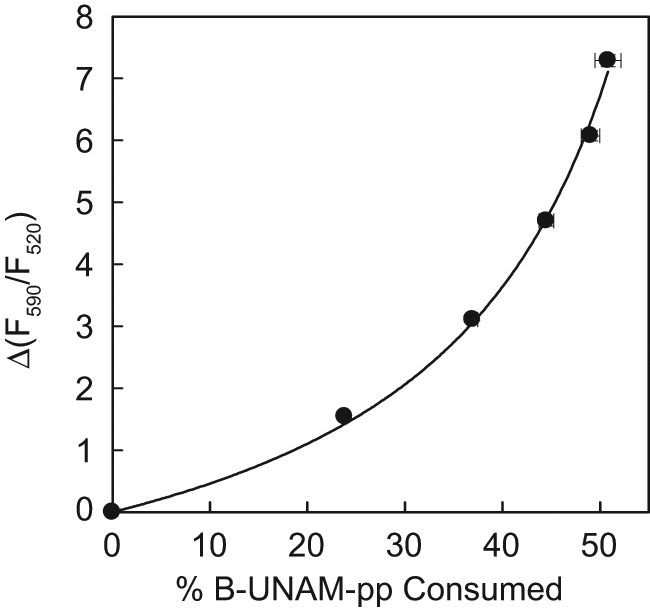
Relationship between the percentage of B-UNAM-pp substrate consumed in the MraY fluorescence resonance energy transfer (FRET) assay and the change in the fluorescence emission ratio Δ(F590/F520). The reaction contained 10 µM C55P, 16 µM LRPE, 20 µg/mL MraY-containing Escherichia coli membrane protein, and 0.1 µM B-UNAM-pp in buffer consisting of 50 mM Tris-HCl (pH 7.5), 0.5 M trehalose, 150 mM KCl, 1 mM MgCl2, 1 mM dithiothreitol, and 0.04% Triton X-100. Samples of 6 µL and 50 µL were withdrawn in triplicate at 10 min intervals. The 6 µL samples were placed in assay plates and quenched with 3 µL of 6 mM EDTA-NaOH (pH 8.0), and the fluorescence measurements were made immediately. The 50 µL samples were placed in 96-well polypropylene plates and quenched with 100 µL of 3:1:1 (v:v:v) water:methanol:isopropanol for high-performance liquid chromatography analysis. Data points and error bars represent averages and standard deviations of triplicate measurements. Nonlinear least squares fitting was done with the program SigmaPlot (Systat Software, San Jose, CA).
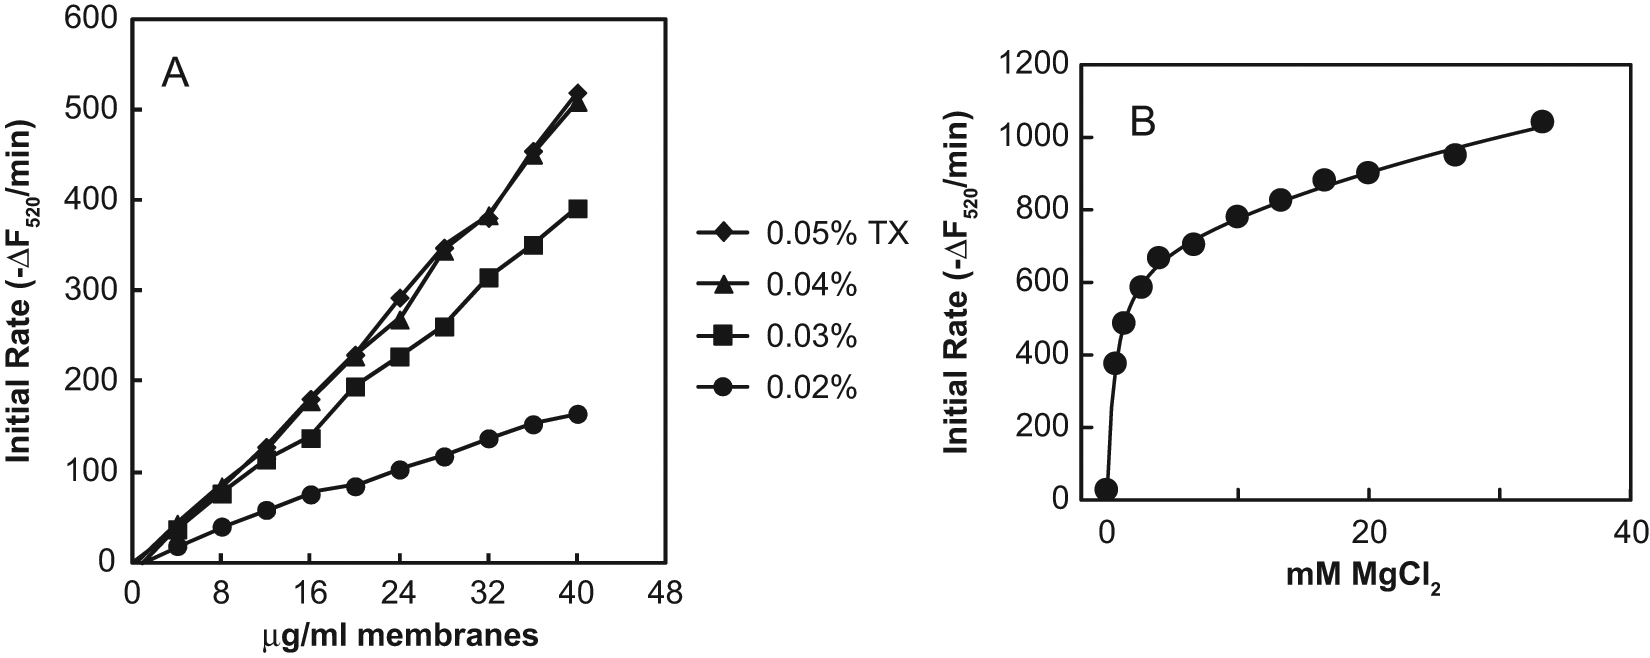
Triton X-100 was selected for use with the FRET assay because it has often been used in previous MraY assays with membrane preparations.7,9,13 The effects of the Triton X-100 detergent concentration and the membrane protein concentration are shown in Figure 4A . At each Triton X-100 concentration tested, the initial rate of 520 nm fluorescence intensity decrease was directly proportional to the membrane protein concentration and hence to the MraY concentration. The rate of translocation increased with the Triton X-100 concentration up to 0.04% but was the same at 0.04 and 0.05%. Therefore, 0.04% Triton X-100 was used for further investigations. Dodecylmaltoside, used by Bouhss et al. 10 for extraction of MraY from membranes, gave very little signal in the FRET assay at concentrations between 1.6- and 6-fold its critical micellar concentration (CMC) of 0.15 mM. N-lauroylsarcosine, which has also been used in earlier MraY assays, 10 gave no signal in the FRET assay at onefold to fourfold its CMC of 14.6 mM.
(
The response of the MraY translocase activity in the FRET assay to the concentration of activating Mg2+ was investigated by varying the concentration of MgCl2 (
Fig. 4B
). MraY catalytic activity has been shown to be dependent on Mg2+, although it is also activated by a higher range of Mn2+ concentrations.
10
There was an initial steep increase of the rate with increasing MgCl2 concentrations up to about 4 mM, with half-maximal effect at 0.65 mM. This probably represents the participation of Mg2+ as a cosubstrate in the active site, interacting with the diphosphate moiety of UNAM-pp. The shallower increase of the rate with increasing MgCl2 concentrations above 4 mM probably represents the activating effect of high ionic strength, which has also been observed with several other salts not containing Mg2+, none of which showed the steep phase of MraY activation at low salt concentrations (
An assay used to screen for inhibitors of an enzyme should be as sensitive as possible to specific inhibitors of that enzyme. We characterized the effect of varying the substrate concentrations, the reaction time, and the readout (i.e., ΔF520 vs Δ(F590/F520)) on the sensitivity of the MraY FRET assay to inhibition by tunicamycin, which has been reported to be competitive with respect to UNAM-pp. 12 The results are shown in Figure 5 .
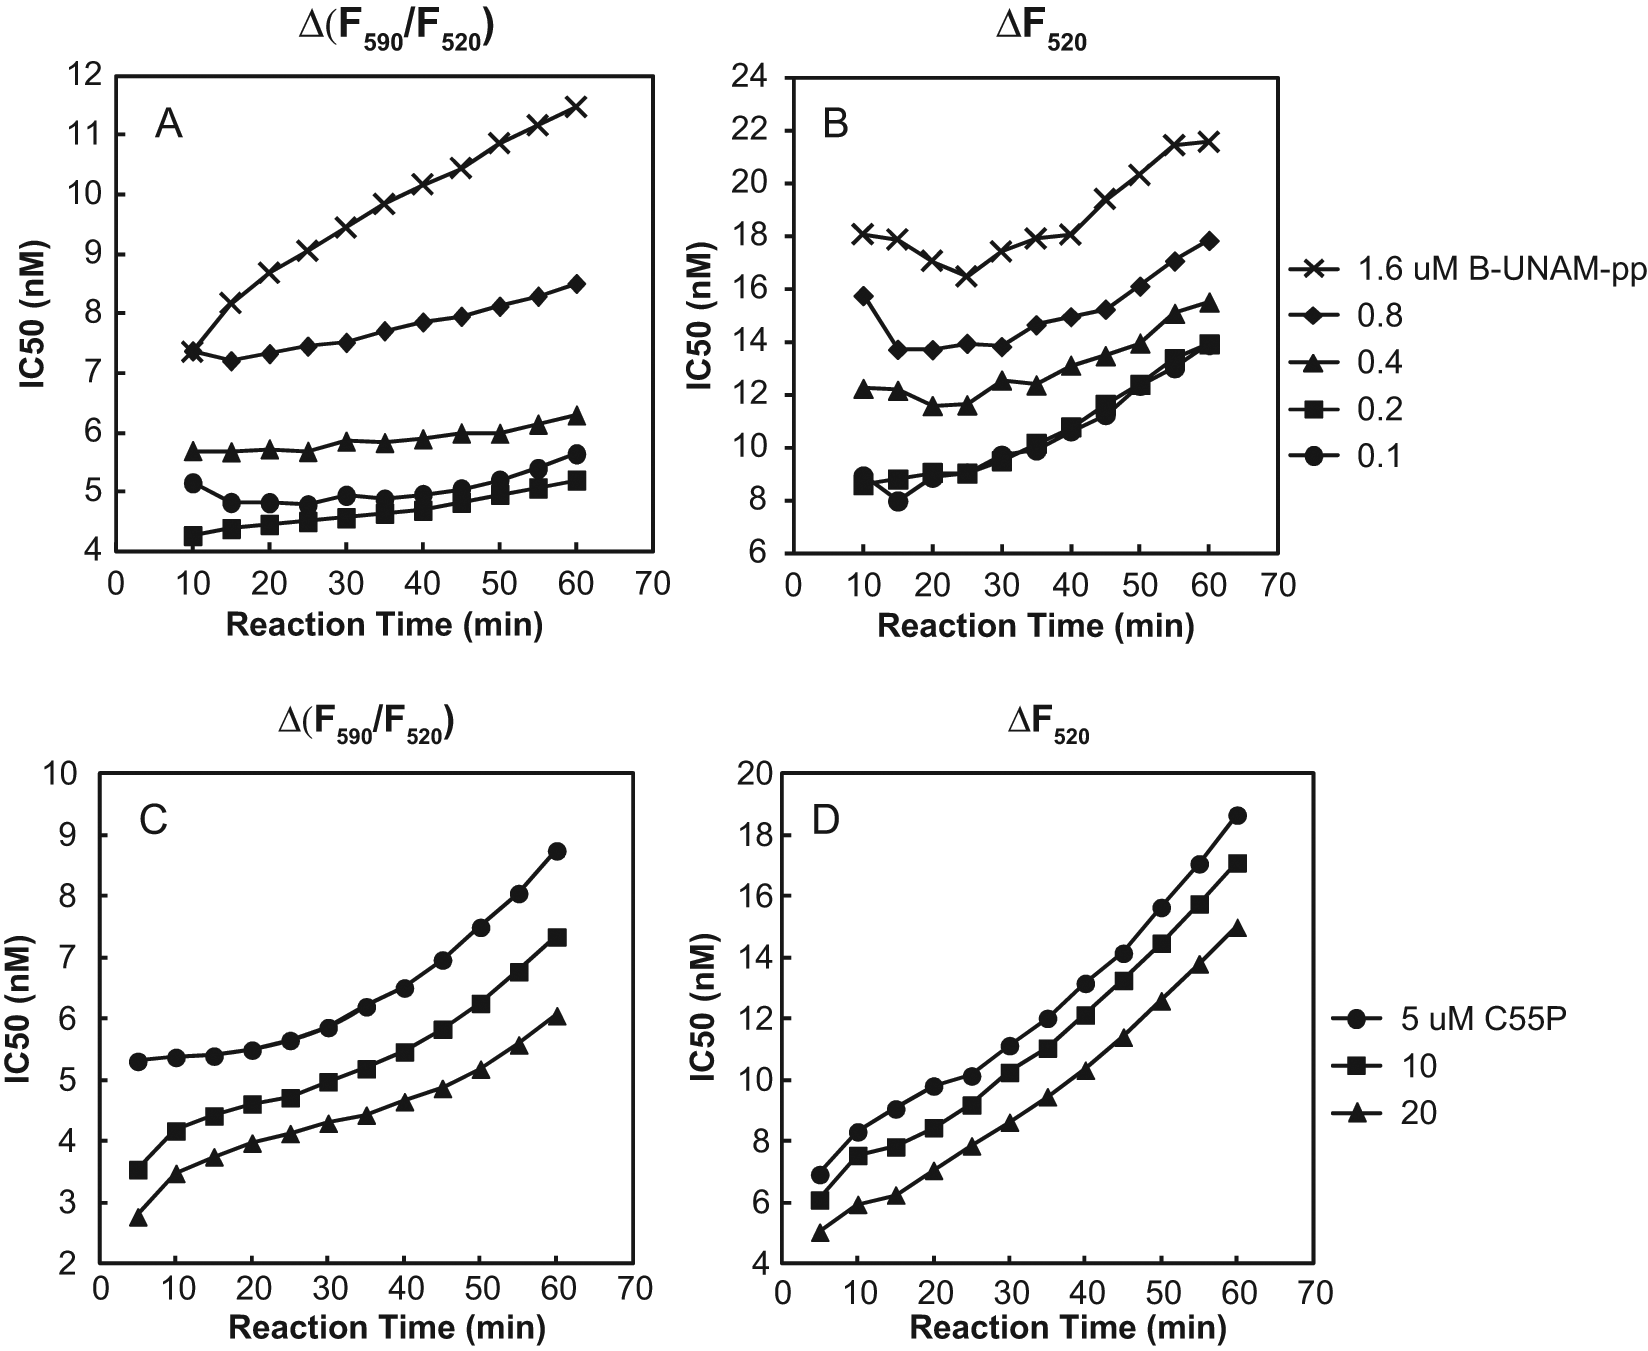
Inhibition of Escherichia coli MraY by tunicamycin in the fluorescence resonance energy transfer (FRET) assay. The reactions contained 16 µM LRPE, 0 or 15 µg/mL MraY-containing E. coli membrane protein (
First, with either readout, the IC50 of tunicamycin increased as the B-UNAM-pp concentration increased ( Fig. 5A , B ), whereas the IC50 of tunicamycin decreased as the C55P concentration increased ( Fig. 5C , D ). These results are consistent with competition by tunicamycin with B-UNAM-pp. Interestingly, the low-nanomolar tunicamycin IC50s with E. coli MraY are considerably lower than previously reported. Solapure et al. 8 reported an IC50 of 360 nM in an assay containing 9 µM UNAM-pp, 0.1% Triton X-100, 25 mM Mg2+, and only endogenous C55P from the membranes used as a source of MraY. Stachyra et al. 7 reported an IC50 of 2 µM in an assay containing 50 µM C55P and 25 µM dansyl-UNAM-pp in 0.1% TX-100 and 50 mM Mg2+. Brandish et al. 15 reported a Ki of 0.55 µM from experiments in which each substrate (dansyl-UNAM-pp and C60P) concentration was varied at a fixed concentration of the other in 0.2% Triton X-100 and 25 mM Mg2+. Several factors may contribute to the observed differences, including differences in the substrate, detergent, Mg2+, and other salt concentrations. In our assay, for example, the IC50 of tunicamycin was increased 2.2-fold when the Triton X-100 concentration was increased from 0.04% to 0.1% at 1 mM MgCl2 and 3.3-fold when the MgCl2 concentration was increased from 1 mM to 10 mM at 0.04% Triton X-100.
Second, IC50s measured with Δ(F590/F520) ( Fig. 5A , C ) were lower than IC50s measured with ΔF520 ( Fig. 5B , D ) by a factor of about 2. This effect is due to the concave shape of the curve of Δ(F590/F520) versus reaction progress (see above), causing reductions in the amount of product formed to reduce Δ(F590/F520) by a larger amount than ΔF520, which is directly proportional to the reaction progress.
Third, IC50s measured with Δ(F590/F520) in most cases exhibited less increase than those measured with ΔF520 as a result of extending reaction progress beyond the time during which the reaction was running at its initial velocity, which was approximately 10 min. This effect is also due to the concave shape of the curve of Δ(F590/F520) versus reaction progress. We conclude that the use of Δ(F590/F520) is advantageous in comparison to ΔF520, offering a higher signal-to-noise ratio, twofold greater sensitivity to inhibition, and resistance to the loss of sensitivity to inhibition that accompanies running the reaction beyond its initial rate. The ability to run the reaction beyond its initial rate without significant loss of sensitivity to inhibition is valuable in that it allows for a larger signal-to-baseline ratio.
High-throughput screening runs may last for several hours, so it is important that the assay reagents be stable for the necessary amount of time. We found that there was a substantial loss of activity of the MraY assay reagents during storage as 2X solutions at room temperature during 5 h ( Fig. 6 ) but that the activity could be stabilized by the inclusion of trehalose ( Fig. 6A ), a sugar that can stabilize proteins against thermal denaturation, 16 with little effect on the rate of the MraY reaction. The time-dependent loss of activity of detergent-solubilized E. coli MraY was previously observed. 17 A similar degree of stabilization was also observed with 10% to 20% (v/v) glycerol ( Fig. 6B ) and 50 µg/mL phosphatidylglycerol (PG) from E. coli ( Fig. 6C ), but these substances inhibited the MraY reaction substantially. For example, 10% glycerol inhibited by 23% and 50 µg/mL PG inhibited by 42%, whereas 0.5 M trehalose inhibited by only 8%. Inhibition by glycerol may be due to increased viscosity of the solution, whereas inhibition by PG may be due to reduction of the amount of available detergent in the assay for solubilizing C55P and MraY due to the presence of the additional lipid. The observed inhibition by PG contrasts with the 5- to 10-fold stimulatory effect by 100 µg/mL PG observed by Brandish et al. 13 in an assay that contained 0.25% Triton X-100. The Z′ statistic for the FRET assay declined substantially with reagent storage time in the absence of stabilizer because of the loss of signal. Inclusion of 0.5 M trehalose maintained Z′ at or above the initial value ( Fig. 6D ).
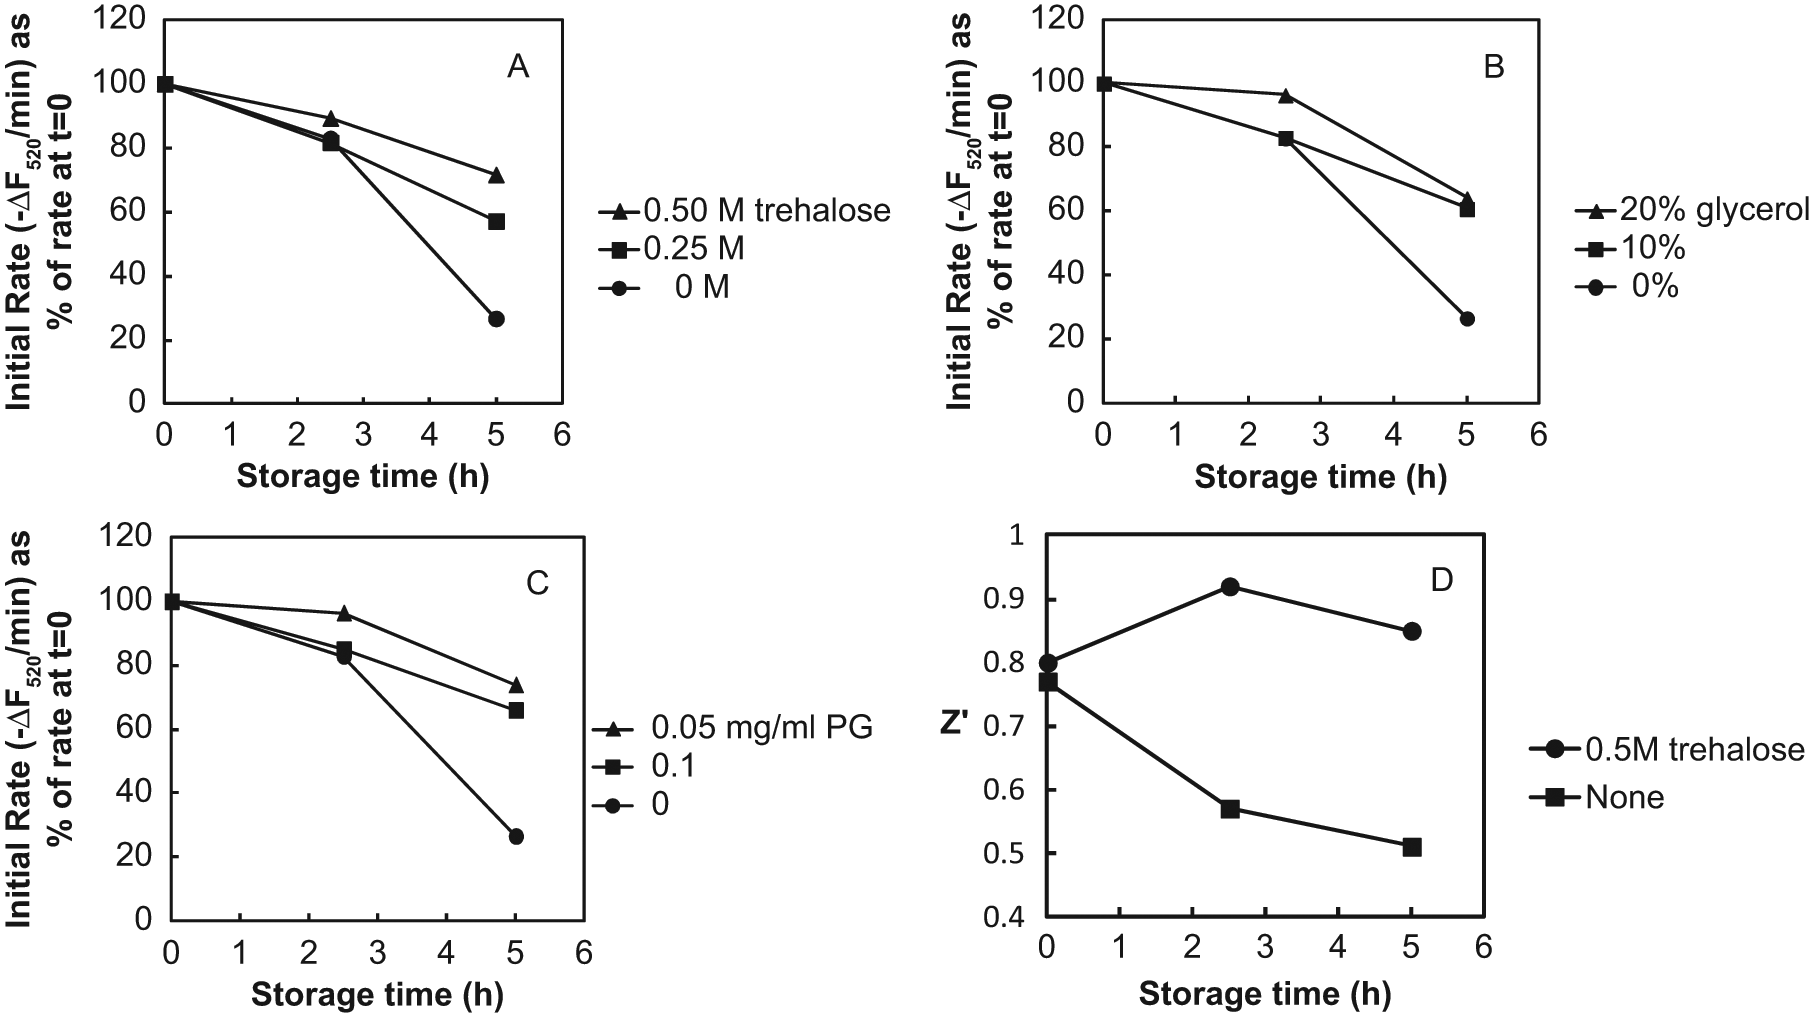
Stabilization by trehalose (
To use the MraY FRET assay in a discontinuous format, the MraY reaction can be quenched by added EDTA in excess of the Mg2+ concentration. With 1 mM Mg2+ in the reaction, 2 mM EDTA was sufficient to provide a stable quench, allowing the fluorescence measurements to be made at a later time. A slight loss in signal with time after quenching was observed during a 90 min period (
Because the compounds in screening libraries are usually dissolved in DMSO, we tested the effect of typical DMSO concentrations on the MraY activity in the FRET assay (see the Materials and Methods section). DMSO was slightly inhibitory, with the degree of inhibition increasing with the DMSO concentration. There was an 8.5% reduction in the initial rate of F520 decrease at 2% (v/v) DMSO, the highest concentration we typically use.
Discussion
The selection of substrate concentrations to use when screening a compound library for inhibitors of a two-substrate enzyme should be based on knowledge of the kinetic mechanism of the enzyme and the kinetic constants of the substrates. These enable the calculation of the sensitivity (IC50/Ki) of the assay to detection of inhibitors with various modes of inhibition using kinetic rate equations. 19 It has not been possible to take this rigorous approach with the MraY FRET assay, however, because the kinetic mechanism is not known and one of the substrates, C55P, is not water soluble. Because C55P and MraY are dissolved in detergent and the binding of C55P by MraY occurs in the detergent micelle, the local concentration of C55P at the MraY active site can neither be assumed to be equal to the overall C55P concentration nor to be necessarily directly proportional to it over the entire concentration range. Therefore, neither the Michaelis constant nor the dissociation constant of C55P can be accurately measured. An additional complication is that the local concentration of C55P will be affected by the detergent concentration in the assay. Furthermore, minimizing the detergent concentration to minimize inhibitor sequestration by detergent micelles places an upper limit on the C55P concentration in the assay. We found that the rate of the MraY reaction was directly proportional to C55P concentration within the achievable range of C55P concentrations (100 µM with 0.1% Triton X-100).
Lacking the ability to calculate IC50/Ki for inhibitors with various modes of inhibition for the MraY FRET assay as a function of the substrate concentrations, we instead examined how changing the substrate concentrations affected the IC50 for tunicamycin, an inhibitor thought to be competitive with the water-soluble substrate UNAM-pp 15 ( Fig. 4 ). The results showed that the sensitivity of the assay to competitive inhibition by tunicamycin was maximized by minimizing the B-UNAM-pp concentration to 0.2 µM or less. In contrast, increasing the C55P concentration increased the sensitivity of the assay to inhibition by tunicamycin. Both results are consistent with various kinetic mechanisms in which tunicamycin competes with UNAM-pp, including the two-step (Ping Pong) mechanism originally proposed by Heydanek et al. 20 and a one-step mechanism, 3 such as steady-state ordered. These results provide guidance for the selection of substrate concentrations when using the FRET assay to screen for UNAM-pp-competitive inhibitors. The substrate concentrations may also be dictated to some extent by practical considerations, such as the cost and difficulty of obtaining the substrates in the necessary quantities.
When screening compound libraries for inhibitors using fluorescence-based assays, it is common to observe interference with measurements from the test compounds due to compound fluorescence, fluorescence quenching, or the inner filter effect (i.e., absorbance of excitation or emission light). Such interference causes errors in the measurement of percentage inhibition and IC50. The use of longer-wavelength excitation should reduce, but not eliminate, the sensitivity of the MraY FRET assay described here to these types of interference compared with the dansyl-UNAM- pp fluorescence assay. We previously described a simple method to correct for these types of interference and improve the accuracy of inhibition measurements. 21 The method requires a separate measurement of the magnitude and sign of the interference for each sample. For the MraY FRET assay, in which two fluorescence intensity measurements are combined to calculate a fluorescence ratio, this correction procedure must be applied to each of the fluorescence measurements separately before the corrected measurements are combined.
The MraY FRET assay described here, by virtue of its high signal-to-noise ratio, long-wavelength excitation, relatively low cost, simplicity, and high sensitivity to competitive inhibition, should facilitate the discovery of novel MraY inhibitors when used to screen collections of compounds and natural product extracts. Because of the high sensitivity to competitive inhibition, however, the assay may allow the identification of MraY inhibitors that are not potent enough to inhibit MraY within bacterial cells sufficiently under physiological conditions to prevent cell growth. Medicinal chemistry efforts beginning with the inhibitors identified from screening would then be needed to make more potent analogs with antibacterial activity that can form the basis of a novel antibacterial drug discovery program. Examples of successful efforts of this kind with the bacterial targets glucosamine-1-phosphate acetyltransferase 22 and DNA ligase 23 have recently been published.
Footnotes
Acknowledgements
Mass spectrometry was performed by Rong-Fang Gu. E. coli strain BL21(DE3)ΔacrB was prepared by Sarah McLeod. Assistance with preparative-scale HPLC was provided by Tatyana Friedman, Lise Gauthier, Bridget Reaney, and Milena Virrankoski. Thanks to Gunther Kern for guidance with preparation of UNAM peptides. Contributions to the preparation of peptidoglycan biosynthesis pathway enzymes were made by Wei Yang, Sarah McLeod, James Whiteaker, Gary Wells, Vanitha Subramanian, and Stephania Livchak.
The authors declared no potential conflicts of interest with respect to the research, authorship, and/or publication of this article.
The authors received no financial support for the research, authorship, and/or publication of this article.
References
Supplementary Material
Please find the following supplemental material available below.
For Open Access articles published under a Creative Commons License, all supplemental material carries the same license as the article it is associated with.
For non-Open Access articles published, all supplemental material carries a non-exclusive license, and permission requests for re-use of supplemental material or any part of supplemental material shall be sent directly to the copyright owner as specified in the copyright notice associated with the article.