
Abstract
Genome-wide arrayed CRISPR screening is a powerful method for drug target identification as it enables exploration of the effect of individual gene perturbations using diverse highly multiplexed functional and phenotypic assays. Using high-content imaging, we can measure changes in biomarker expression, intracellular localization, and cell morphology. Here we present the computational pipeline we have developed to support the analysis and interpretation of arrayed CRISPR screens. This includes evaluating the quality of guide RNA libraries, performing image analysis, evaluating assay results quality, data processing, hit identification, ranking, visualization, and biological interpretation.
Keywords
Introduction
CRISPR-Cas9–based functional genetic screens have recently been proven to be successful methods for identifying new molecular drug targets. 1 Most CRISPR screens run to date are done on a pooled format, which consist of the use of genome-wide libraries of single-guide RNAs (sgRNAs). Pooled CRISPR screens allow the simultaneous screening of multiple genes for a phenotype of interest by delivering sgRNA en masse via lentivirus vectors and then deconvoluting the output via NGS.
Arrayed CRISPR screens, 2,3 on the other hand, are plate-based assays in which each genetic perturbation is applied individually in a single well. This enables to use CRISPR screening technology in conjunction with more complex functional assays compared with what is possible using pooled CRISPR screens
High-content imaging is an ideal screening approach as the readout is a combination of multiple phenotypic and molecular markers relevant for the biological mechanism under study, including Cas9 expression at the single-cell level, as a proxy for editing efficiency.
Within AstraZeneca, we have now established a platform for whole-genome imaging-based arrayed CRISPR screens that has been applied to several projects with the primary aim of discovering novel drug targets.
Here we describe for the first time our computational pipeline, covering the full arrayed CRISPR screening process. First, the guide RNA libraries are processed by mapping the guide sequences to the genome to evaluate their quality and predict on-target efficacy and off-target liabilities. The libraries are also annotated with information that will be used at the hit interpretation stage, such as gene families and pathways of their target genes.
In the high-content imaging assay, cells are stained for multiple readouts along the pathway of interest, as well as a fluorescent readout of Cas9 expression, which is used to monitor efficiency of editing and selectively analyze cells that are likely to have been edited. To incorporate all markers of interest, we do not include standard nuclear and cytoplasm markers for cell segmentation. Instead, we apply a deep-learning approach to perform segmentation of nuclear and cytosolic fractions from label-free phase contrast images, which are captured alongside the screen-specific fluorescent markers. The deep-learning predictions are integrated into off-the-shelf tools to enable scalability.
Quality control (QC) and visualization methods are then used to flag any outliers from automation and imaging errors and look for any trends and unwanted variation. Plate-based normalization methods are used to correct any plate spatial effect, and standardization using positive and negative control samples is used to minimize plate-to-plate variability.
Hit identification and ranking are carried out based on measured effect size and statistical significance across multiple markers, and further ad hoc criteria based on specific screen goals are added. To provide some biological interpretation about the identified hits, they are annotated with known biological information collected from internal and public data sources, such as involvement in signaling pathways and biological functions. Pathway/gene set enrichment analysis enrichment and network analysis methods are used to summarize and visualize the hits. Through this process, we identify high-quality targets for progression.
Materials and Methods
Synthetic gRNA Libraries
Chemically synthesized crRNA libraries were purchased from Horizon Discovery (Cambridge, UK). The crRNAs have been designed to be highly functional but with a low level of off-targeting using a design algorithm based on functional, phenotypic gene knockout data. Key design criteria included cut site location, sequence composition, and GC content. 4,5 Synthetic, two-part crRNA from Horizon Discovery was supplied in a prepooled format containing four crRNAs per gene, each at 0.1 nmol. Once pooled together, each well contained four crRNAs at a total concentration of 0.4 nmol per well. We have shown separately that pooling four crRNA retains the efficacy of the single strongest crRNA; therefore, we were happy to undertake a primary screen using a single pool of four crRNA per gene (in review). Libraries were resuspended by the addition of 65 µL duplexing reagent (6.15 μM tracrRNA, 10 mM Tris HCl pH 7) and incubation at 4 °C for 30 min before aliquoting into 384-well acoustic low-dead volume (LDV) plates and storing at -80 °C. The final, pooled, and duplexed concentration of libraries was 6.15 μM crRNA:tracrRNA ready for reverse transfection into cells.
The genome-wide library was comprised of human drug targets (12 plates), human druggable subset (15 plates), and human rest of genome (34 plates), providing a total of 61 library plates with up to 320 genes per plate.
Experimental Protocol
We have found that a sustained, high level of Cas9 expression can be detrimental to cells (see the
Genome-Wide Screen to Identify Regulators of Androgen Receptor Levels and Signaling in Prostate Cancer Cells
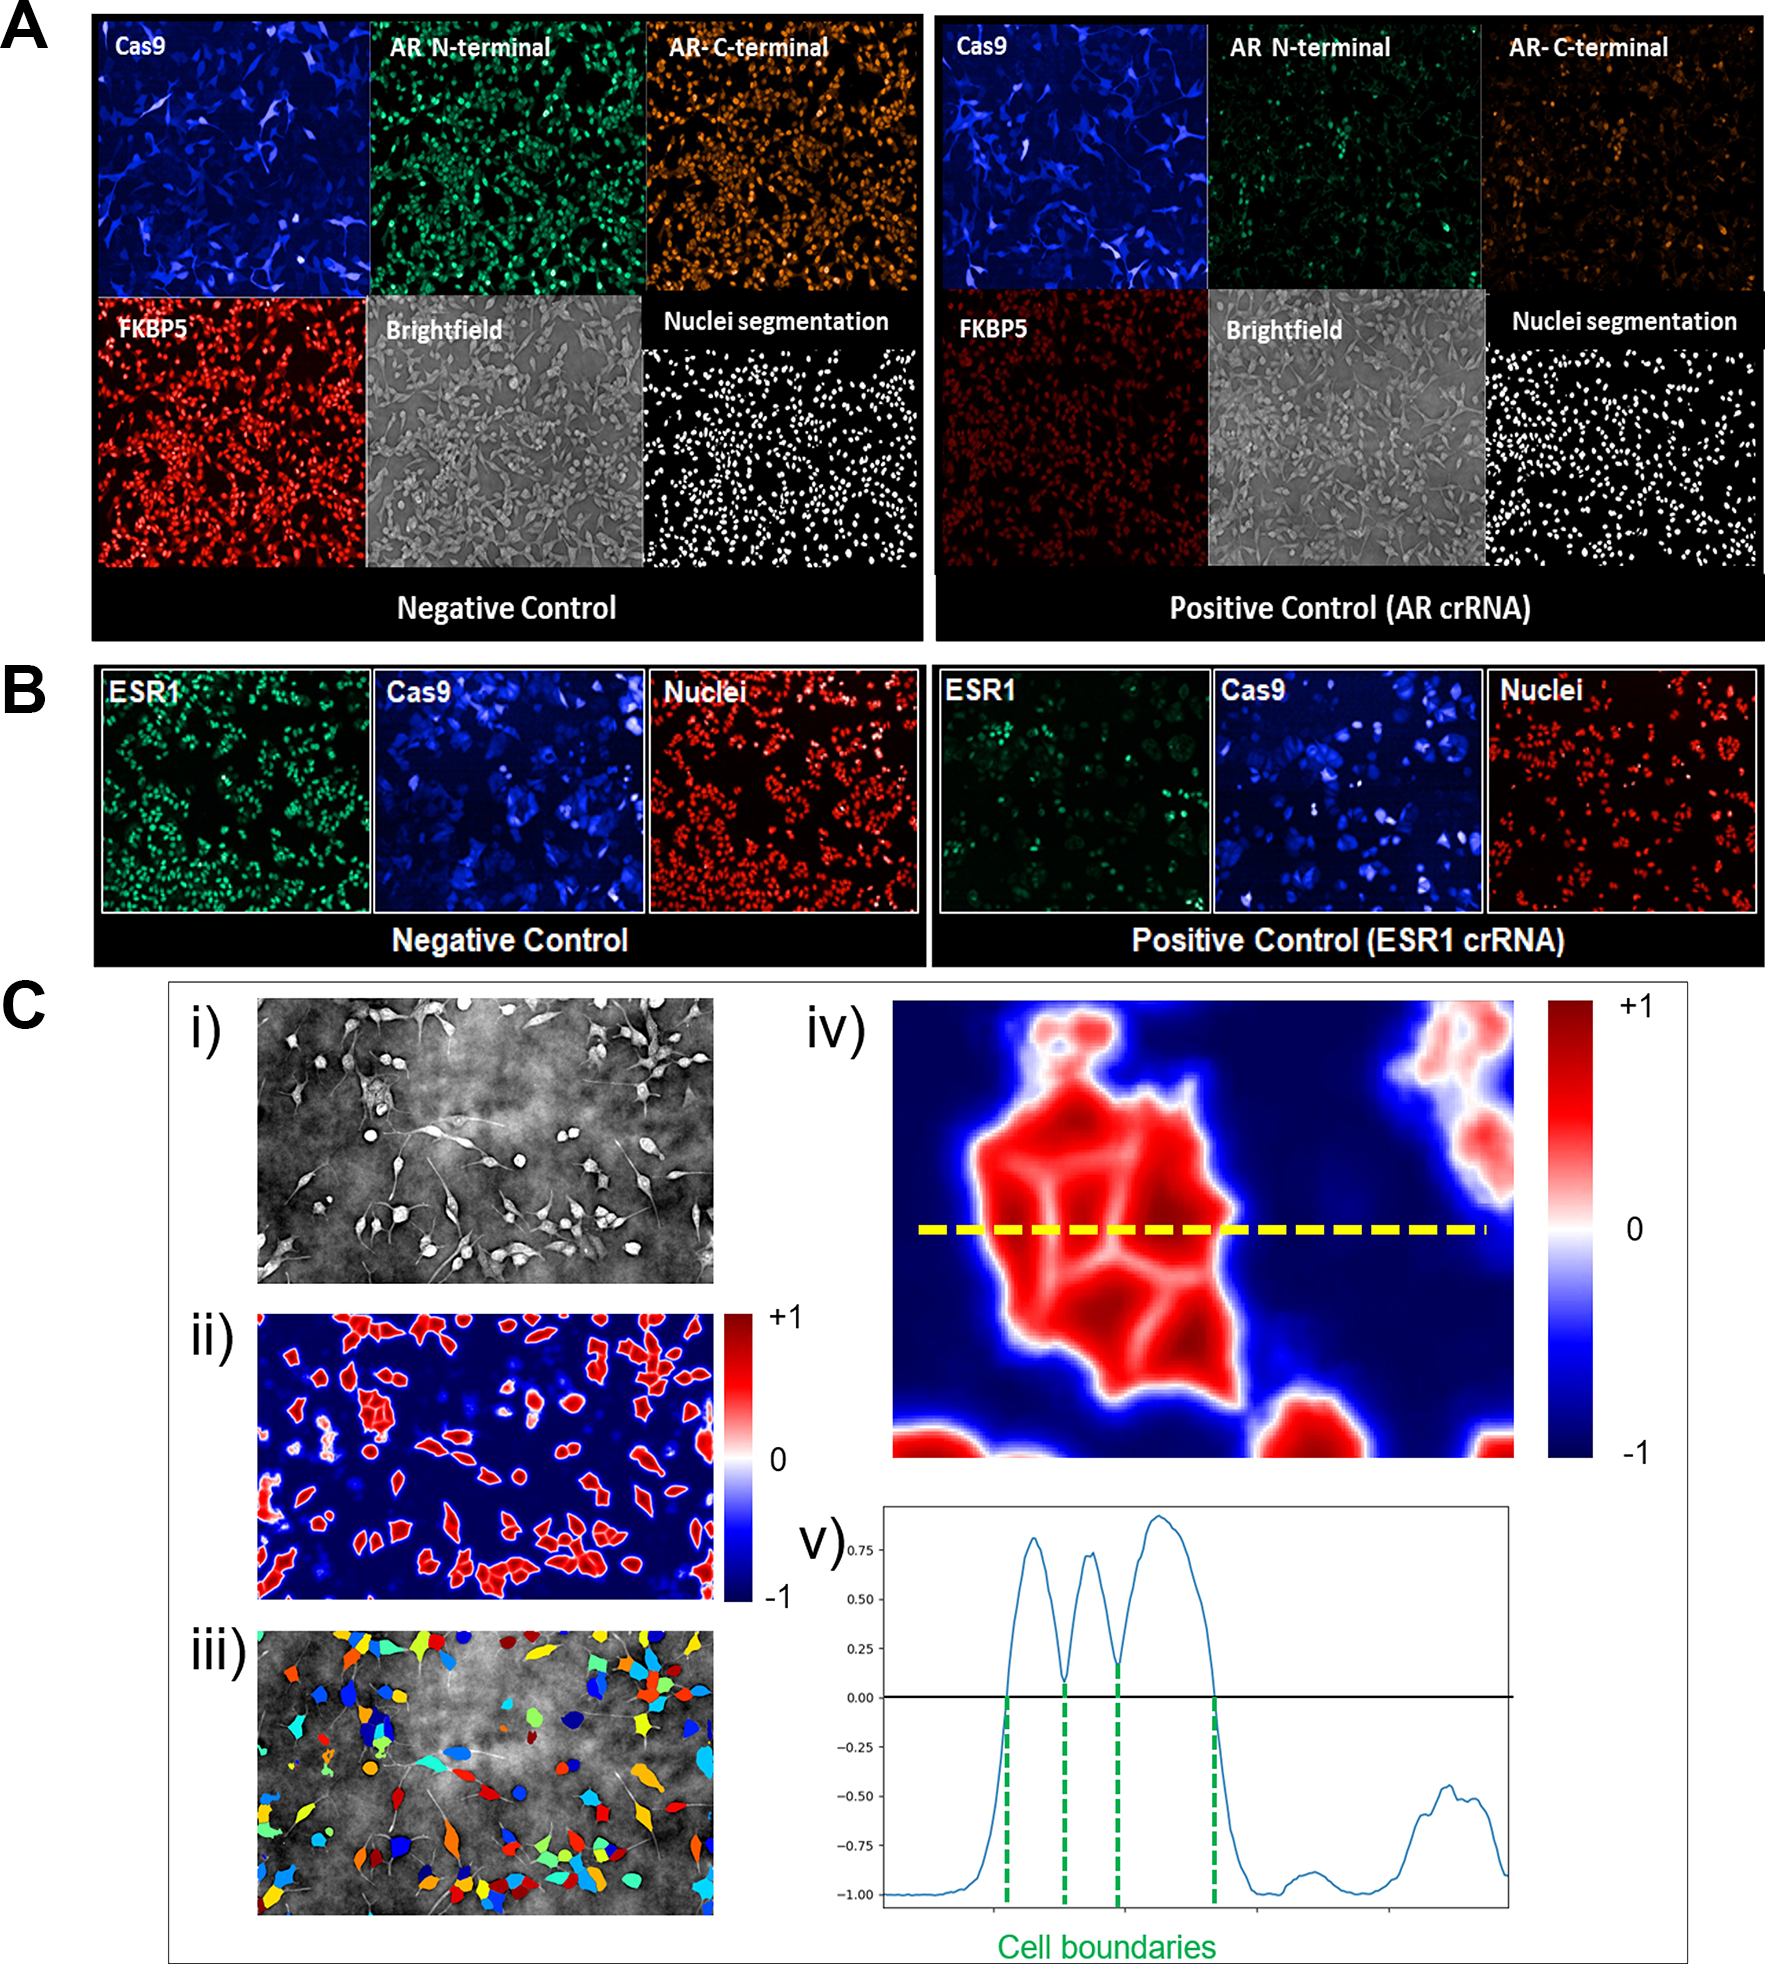
The data used here to describe this analytical pipeline come from a series of genome-wide arrayed CRISPR knockout screens in prostate cancer cells (LNCaP). In this example, crRNAs targeting the androgen receptor were used as a positive control, and the addition of tracrRNA only was used as a negative control. Cells were stained with antibodies targeting either the N-terminal or the C-terminal regions of the androgen receptor multiplexed with an antibody targeting FKBP5 (a downstream marker of androgen receptor signaling).
Genome-Wide Screen to Identify Regulators of Estrogen Receptor Levels and Signaling in Breast Cancer Cells
Data have also been included from a series of genome-wide arrayed CRISPR knockout screens using estrogen receptor–positive breast cancer cells (MCF7). In these studies, crRNAs targeting the estrogen receptor 1 (ESR1) gene were used as a positive control together with the use of tracrRNA only as a negative control. MCF7 cells were stained with an anti-ESR1 antibody.
Confocal Image Acquisition
Images were acquired using a Cell Voyager 7000 (CV7000, Yokogawa Inc., Tokyo, Japan). Confocal fluorescent images were captured using a 20× objective and an Andor Neo sCMOS camera with a 2 × 2 bin. Cas9-BFP was imaged using a 405 nm excitation laser (405 ± 5 nm, 100 mW; Coherent, Santa Clara, CA) with a 445/45 nm bandpass emission filter. Androgen receptor (C-terminal) was imaged using a 561 nm excitation laser (561 ± 2 nm, 200 mW; Coherent) with a 600/37 nm bandpass emission filter. Androgen receptor (N-terminal) was imaged using a 488 nm excitation laser (488 ± 2 nm, 200 mW; Coherent) with a 525/50 nm bandpass emission filter, and FKBP5 was imaged using a 640 nm excitation laser (640 +4/−5 nm, 100 mW; Coherent) with a 676/37 nm bandpass emission filter. In addition, three bright-field images were captured at three different Z planes over an 8 µm range. ESR1 was imaged using a 488 nm excitation laser (488 ± 2 nm, 200 mW, Coherent; with a 525/50 nm bandpass emission filter), Cas9-BFP was imaged using a 405 nm excitation laser (405 ± 5 nm, 100 mW; Coherent) with a 445/45 nm bandpass emission filter, and nuclei were counterstained with DRAQ5 nuclear stain, imaged using a 640 nm excitation laser (640 +4/−5 nm, 100 mW; Coherent) with a 676/37 nm bandpass emission filter.
Computational Analysis
We have built a computational pipeline to QC and analyze data from arrayed CRISPR screens. This pipeline includes evaluating the quality guide RNA libraries, performing image analysis, evaluating the quality of assay results, data processing, hit identification, ranking, visualization, and biological interpretation. Both the pipeline and some examples of outputs will be discussed in detail in the following section.
Results and Discussion
gRNA Libraries QC and Annotation
All libraries we acquire are reannotated for consistency using the same genome version (chromosomes only) and Ensembl 6 annotation version (hg38 and 83 in this case).
For each guide, we identify off-target sites with up to five mismatches using our own implementation of the method employed on the Sanger WGE database, 7 enhanced with the calculation of the probability of the off-target. 8 Guides are annotated with the results of the genomic mapping, including the gene(s) and gene regions(s) at the mapping locus.
Because the guide libraries are used in our screens as sets of four pooled guides, it is impossible to unequivocally decide if the activity we observe in a given well/gene in our assay is due to on-target effect or off-target effects present in one or more of the guides putatively targeting that gene. Hence, we reject only genes for which all four guides do not map exactly anywhere or map exactly to multiple loci. Other wells/genes that include at least a guide with multiple mappings are flagged as the observed activity might potentially be due to off-target effects. This annotation can be used at the hit-ranking stage to aid the decision of what genes to prioritize for further validation studies.
In the whole-genome library we used for the screens discussed in this article, we did not detect any gene for which all four guides have no or multiple genic mappings, and we detected ∼4% of genes with at least one guide with no genic mapping, ∼0.4% genes with at least one guide with multiple genic mappings, and ∼20% genes with at least one guide with single genic mapping but multiple genes.
When acquired, the libraries are provided in 384-well master plates and are transferred into replicate plates. The libraries from the replicate plates are then dispensed as required in individual experiments. To automatize the mapping of master plates to replicate plates and dispensing reports, we have developed a library-mapping tool that automatically performs such mapping.
The tool requires the user to upload three files: (1) a file that contains information on the guides library, including the guides sequences and plate/well position of each guide in the library; (2) a file that contains the mapping from the master plate to the replicate plate; and (3) a file that contains the results logged by the Echo dispenser. The tool crosslinks the information from the three files and the genomic mapping results, and it enables users to interactively visualize QC results and dispensing reports for each gRNA. It also enables users to export two files, a mapping file that includes the essential plate/well/gene information in a format suitable for use into GeneData for further analysis and a summary file that includes all of the QC information (such as genic mapping errors, off-targets for each gRNA, and official HGNC 9 gene names and Ensembl gene IDs), which can be used at the hit-ranking stage to flag and potentially deprioritize gene hits that involve less reliable guides. The automatic library-mapping tool speeds up the library-mapping process and drastically reduces the chances of human errors.
The tool is implemented in R 10 and deployed as an R Shiny 11 web-based tool. Currently, this tool is quite ad hoc, as it has been implemented to work with the specific file formats of our libraries and with the automation and data analysis software that we use in-house. We believe, however, that it could be easily generalized and adapted to the requirements of other groups, and we welcome requests to access the code.
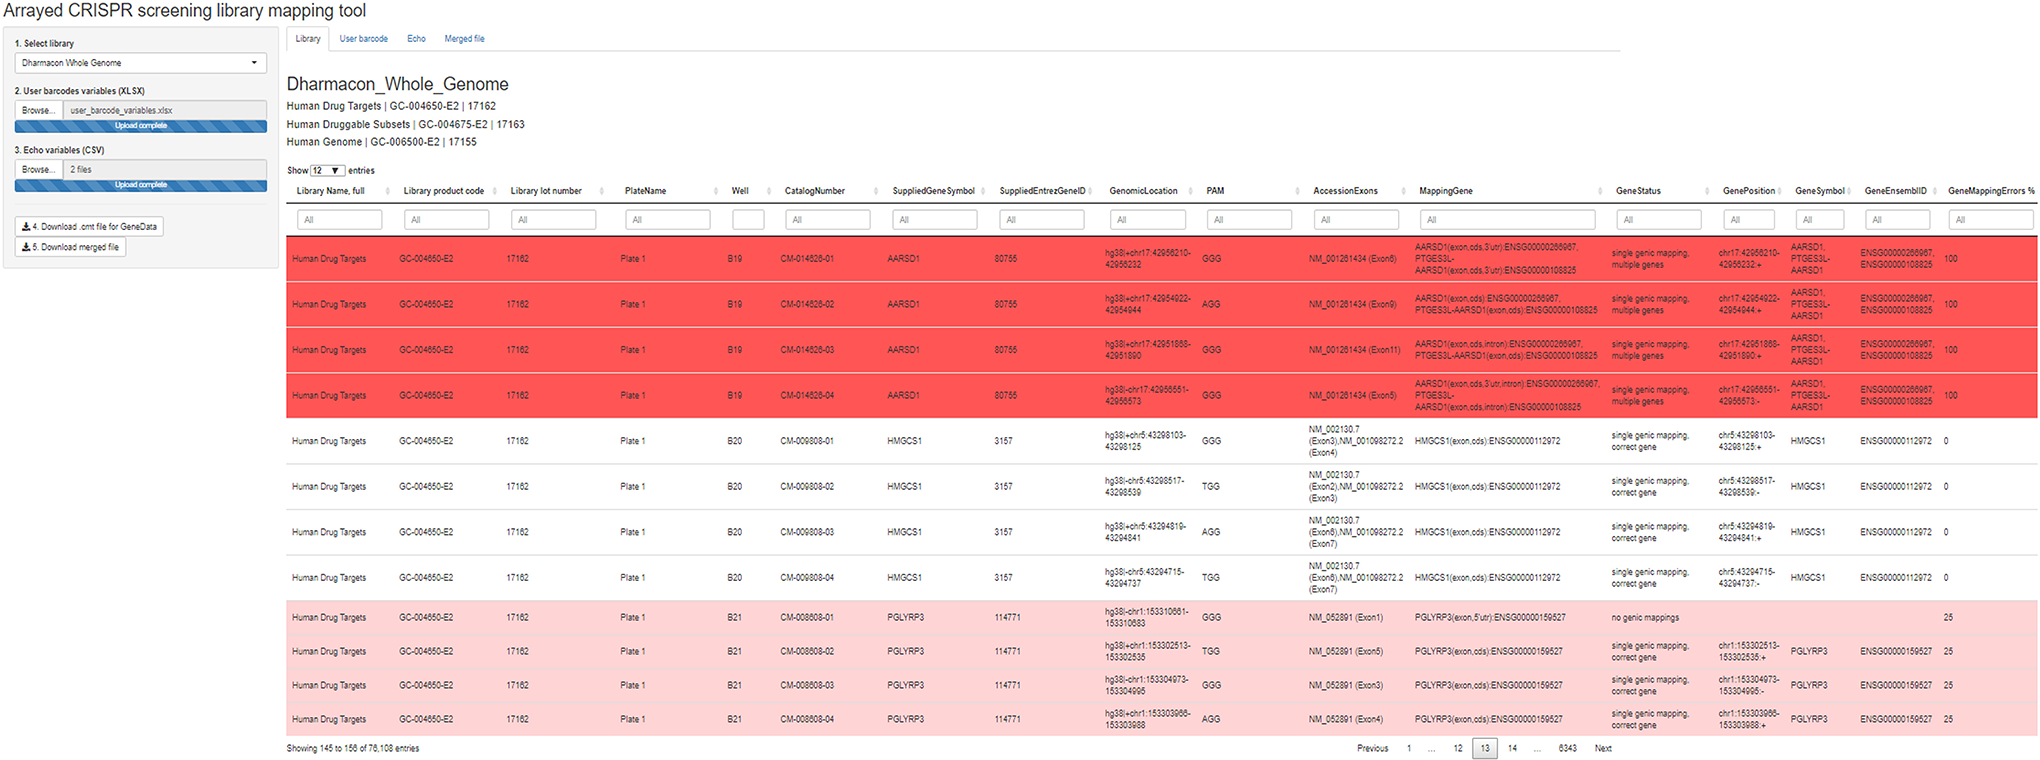
Screenshot of the arrayed CRISPR library-mapping tool. The results of the library mapping are displayed, and gRNAs that are not mapped to any gene or are mapped to multiple genes are highlighted.
Label-Free Segmentation
As described above, all four color channels for the confocal microscope are used to visualize biomarkers of interest, including Cas9-BFP in the 445 nm channel, which is very often used for labeling nuclei with DAPI or Hoechst for nuclei and cell segmentation purposes. Therefore, we captured images in bright field with which to perform segmentation.
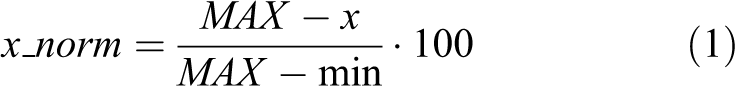
Because of the local contrast variations within a bright-field or phase-contrast cellular image, segmentation of cells and particularly nuclei is a challenging task. It has been proposed that calculating a digital phase contrast (DPC) from planes above and below the focal plane, approximating the image intensity to the optical thickness of the sample, can produce an image that is more amenable to segmentation, as cells appear bright against a dark background. Even with a DPC image, it is nevertheless highly challenging to design a classical algorithm to segment nuclei and cells, particularly in densely confluent images.
Therefore, we implement a deep-learning approach to segment nuclei and cells from a DPC image. In our hands, the DPC algorithm built into the Yokogawa microscope is prohibitively slow for a high-throughput application, and thus, to run the whole-genome CRISPR screen, we instead capture two planes of bright-field images and calculate the DPC image offline. 12 The deep-learning approach will be described in full elsewhere; briefly, we train a U-net deep neural network to predict the distance from the cell boundary: positive values inside the cell and negative values outside. Cells are separated from the background by thresholding at the zero level, and touching cells can be separated by running a watershed from local maxima of the predicted distance function. We train two separate networks: one to segment nuclei and one to segment cells. To generate training data, we capture a reference plate of bright-field images, alongside fluorescent markers for nuclei and cells. We segment the fluorescent markers using classical methods to generate the training masks in an automated manner. Then, after training the models, the segmentation masks are predicted from the bright-field images alone, and the fluorescent markers are no longer required.
We wished to integrate our deep-learning results into our production high-content analysis workflow, for ease of assay development. To do this, we exported the calculated nuclear and cell masks and DPC images alongside the channels originally acquired on the microscope, and we modified the Yokogawa metadata files to treat the exported images as additional color channels. This allows the augmented image set to be processed in the same way as a standard acquisition.
As with any machine-learning approach, it is important that the models are trained on data representative of the screen. Therefore, when generating training data, we selected a subset of gene knockouts that were expected to provide a range of cellular morphologies, so that the model is able to accurately predict segmentation even when the cell shape or appearance is strongly perturbed from the control scenario.
Image Analysis
Cell and nuclear segmentation masks, along with fluorescent images, are imported and analyzed using Columbus Imaging Date Storage and Analysis System (PerkinElmer, Waltham, MA). Several endpoints are quantified, including cell number and nuclear and cytoplasmic protein fractions. Analysis is performed in the BFP-positive cells only (indicative of positive Cas9 expression). We typically see >85% cells positive for BFP, and in this BFP-positive population, we typically achieve >90% editing efficiency.
(
Data Processing and QC
Once the image analysis step is complete, we have a matrix with a quantified intensity for each of the biomarkers and phenotypic readouts for each gene knockout. We have developed an automated pipeline to process the data and identify and rank the hits. The data-processing pipeline, implemented in the programming language R, performs the following steps: (1) data import and merging with library annotations, (2) plate spatial effect correction (within-plate normalization), and (3) samples normalization (across-plates normalization). In addition, several different plots are automatically generated for data exploration and QC.
We have implemented different methods for each of the steps, and the pipeline can be customized to use any of them.
For plate spatial effect correction, B-score 13 and LOESS-fit 14 and have been implemented.
B-score is a widely used method for normalizing high-throughput screening experiments. It accounts for row and column effects by fitting a two-way median polish on a per-plate basis. An important assumption for applying B-score is that of a low hit rate, which is generally satisfied in genome-wide screens.
LOESS (LOcally Estimated Scatterplot Smoothing) reduces column, row, and edge effects by fitting a distribution surface on the whole-plate data matrix. This method is to be preferred for validation screens with expected high hit rates.
For samples normalization, we have implemented three different normalizations: percentage inhibition, fold change over neutral control, and plate median scaling.
Percentage inhibition normalization is the ideal normalization method to use when both positive and neutral controls are available and is defined as
where MAX and min are the mean values of the neutral and positive controls in the plate.
Fold change normalization is useful when no reliable positive control is available, and is simply defined as
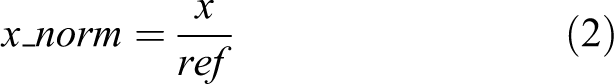
where ref is the neutral control, if a reliable neutral control is available, or the median signal of all samples in the plate otherwise.
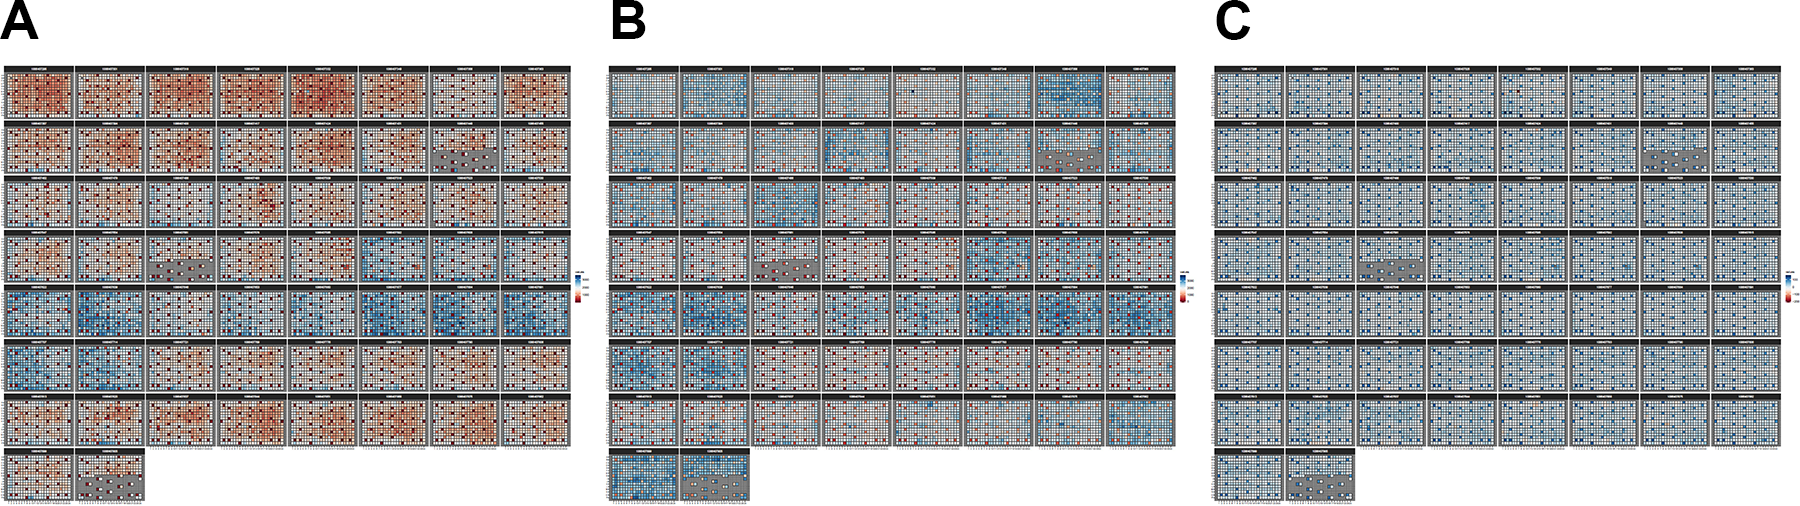
Data normalization (data from the estrogen receptor screen). (
Several different plots are automatically generated for both the raw and the normalized data, and they can be used to explore and QC the data. The main ones are heat maps, scatter plots, box plots and probability distributions plots for each measured marker and each plate, and correlations plots between different markers. Some examples are shown in the Results and Discussion section.
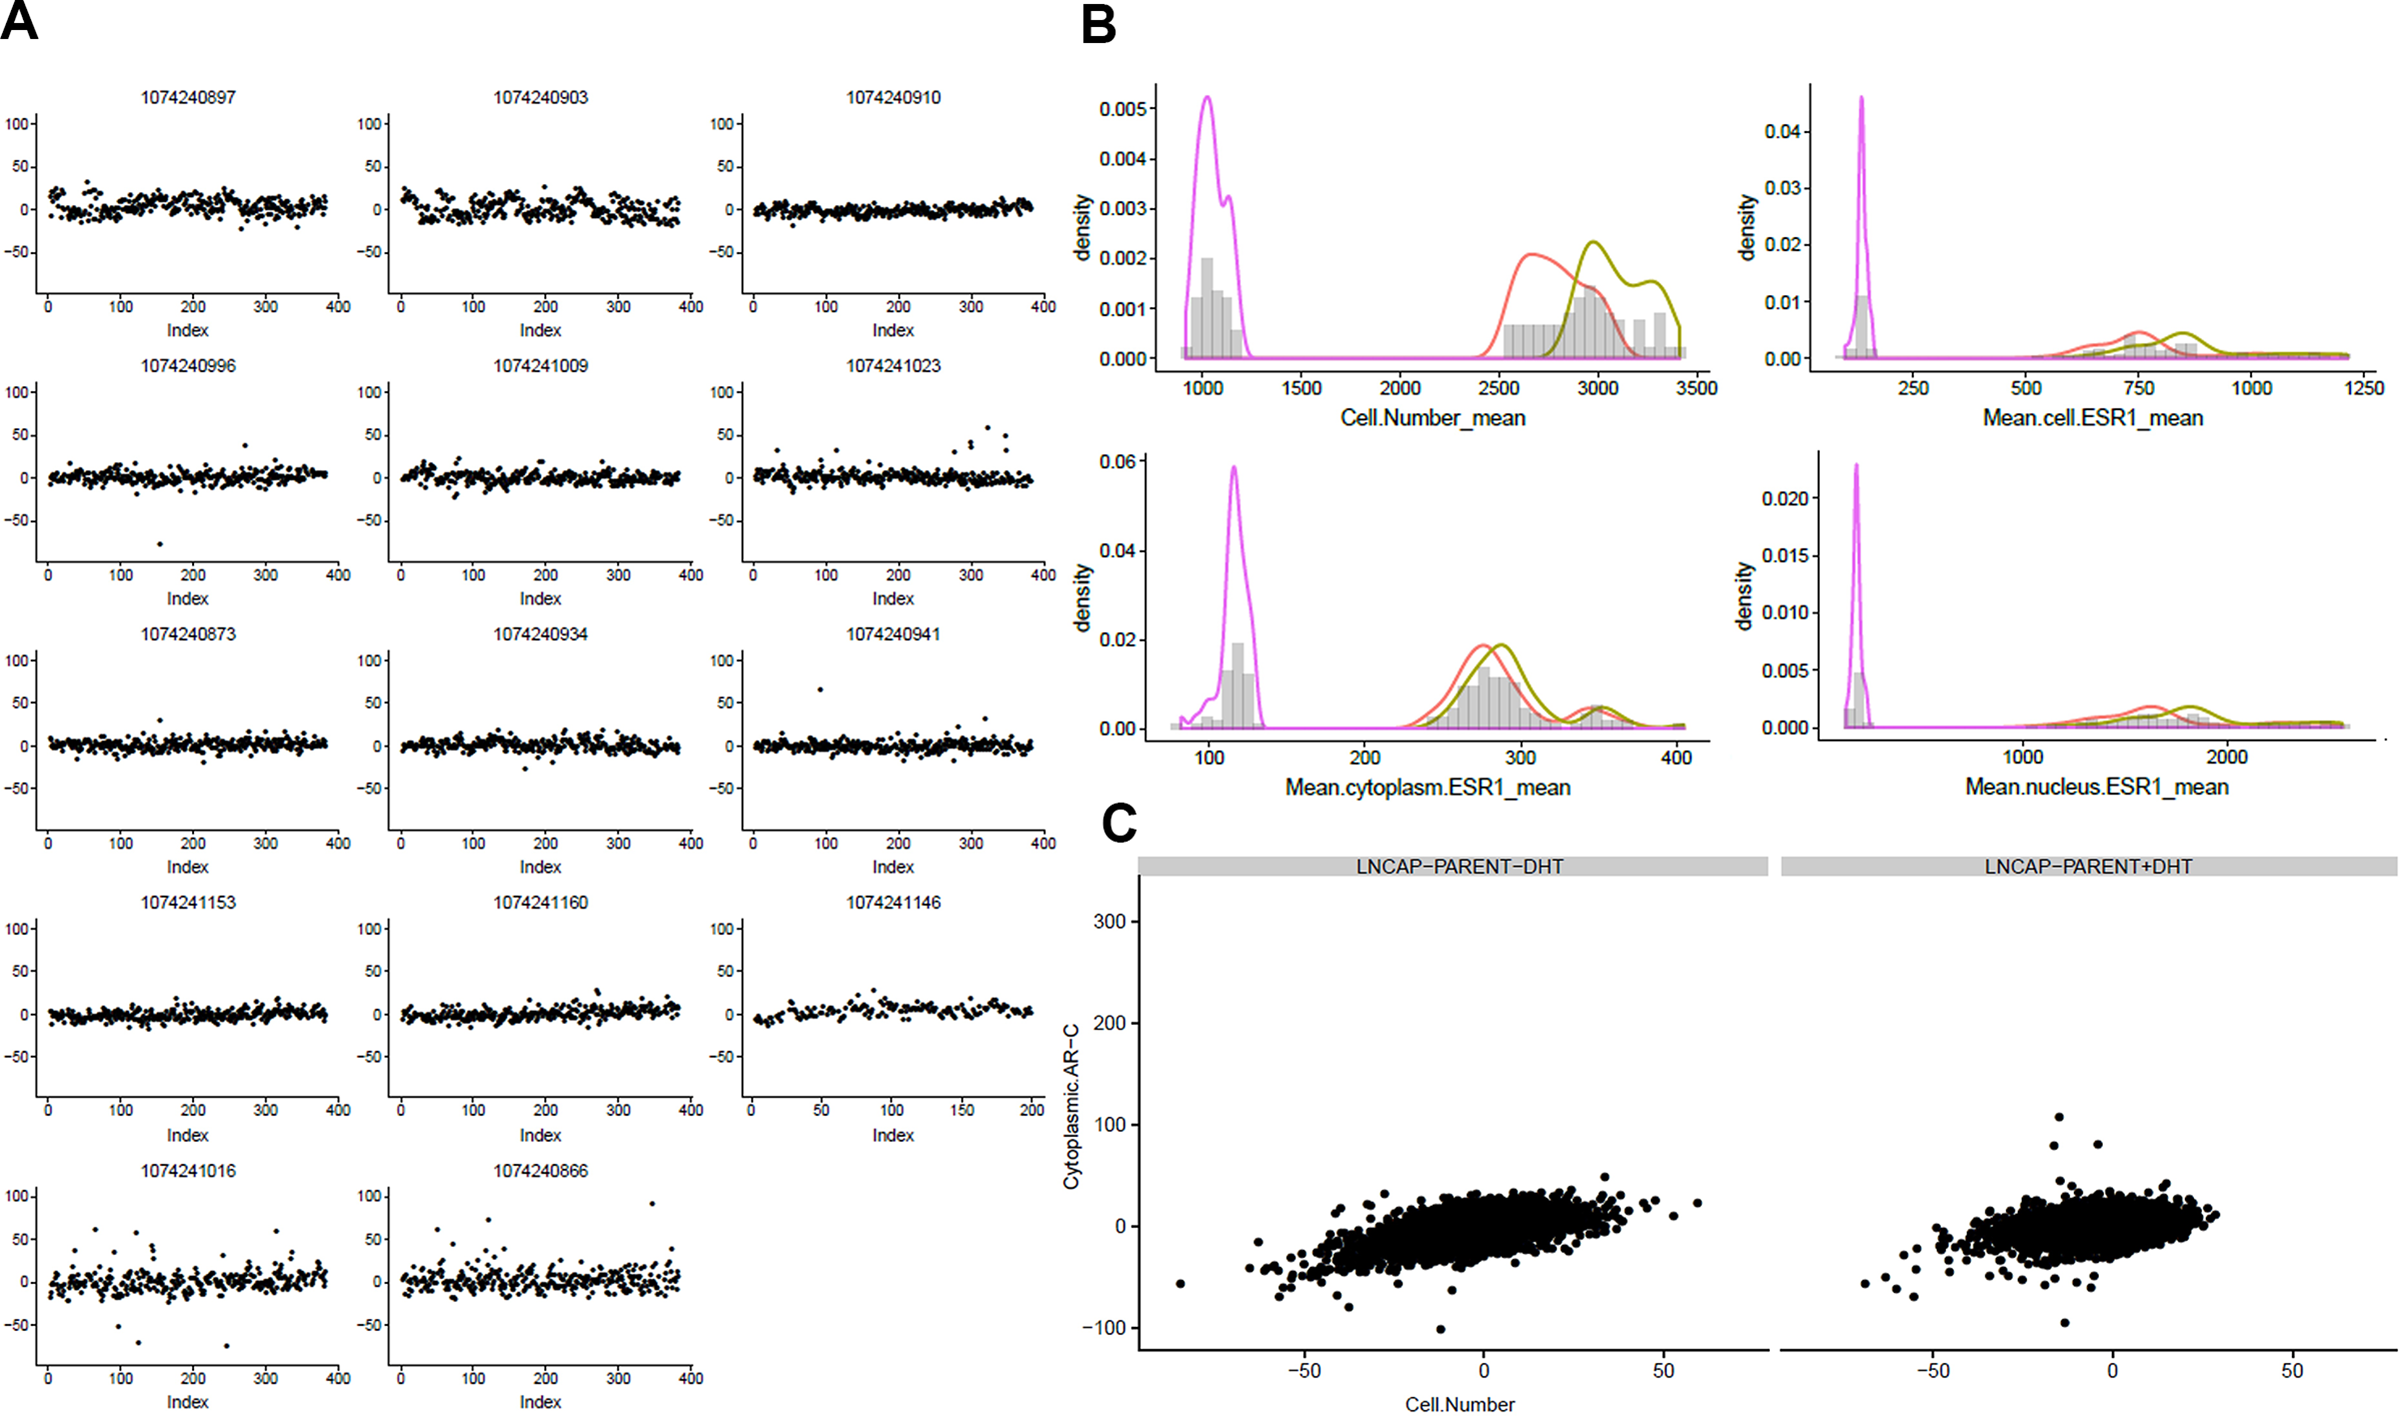
Examples of quality control plots generated. (
Hit Identification and Ranking
The general goal is to obtain a ranked list of “hits,” that is, genes whose knockout significantly reduces one or more of the measured markers.
Hit identification is performed individually per screen/cell line and marker, and it is done automatically. Hit ranking involves comparing results across different screens and markers, and it is a more ad hoc, project-specific process that takes into account the specific project’s biological questions and hypotheses.
To identify gene hits, Z-scores are computed for each gene and each marker within a screen. The Z-score formula is
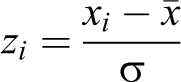
where x is the effect size (ie, the normalized signal for a given marker for gene i) and
From the Z-score, we can then compute a one-tailed p value. Finally, to control the false discovery rate, we compute adjusted p values using the Benjamini and Hochberg method 15 for multiple testing correction.
The standard method for defining hits is to set a hard threshold (e.g., the classic 0.05) and define as significant all the hits for which adj.pval 0.05. Because we look at several markers within a screen, and screens are generally done in panels that include different cell lines or treatments, we use a different approach, based on desirability functions, 16,17 which enables us to integrate both effect sizes and p values from multiple markers and screens.
From the effect sizes and p values obtained for each gene, marker, and screen, we compute desirability scores for each of the markers. The scores are numbers in the [0,1] interval, with 1 being the most desirable score (i.e., large effect size and small p value).
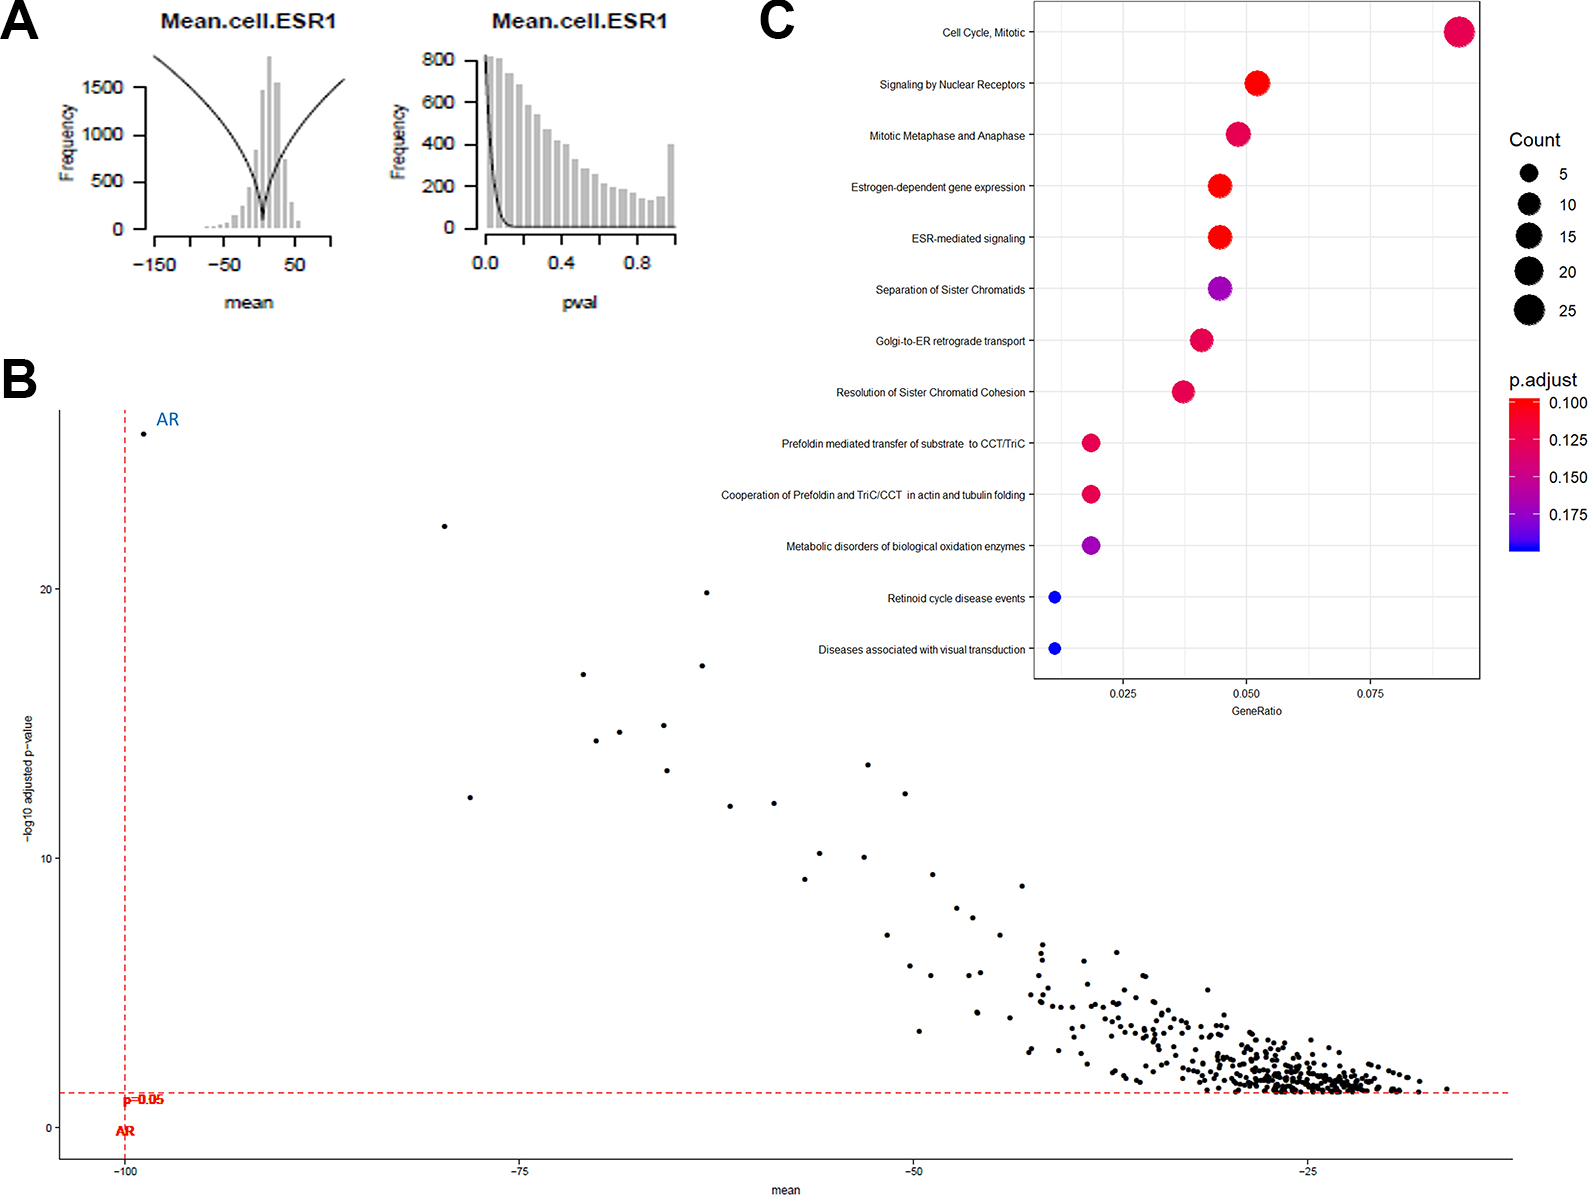
Examples of plots showing hits. (
To obtain a global desirability score for multiple markers, the scores for all markers are combined using the weighted geometric mean. This global desirability score is what we use for ranking hits.
Control genes consistently came out in our screens as top hits for their respective endpoints; for instance, AR for the AR endpoints, FKBP5 for the FKBP5 endpoint, ESR1 for the ESR1 endpoints, and essential genes (e.g., PLK1) for cell number.
Hit Interpretation and Annotation
To provide some biological interpretation to the hits, we apply enrichment analysis and network analysis.
Pathway enrichment analyses are run on the Reactome 18 database using ReactomePA, 19 DOSE, 19 and enrichPlot. 19 Gene Ontology term enrichment analyses are run using TopGO. 20
Interactions between significant hits, the target of interest, and common regulators are explored and visualized using custom R scripts for network analysis and causal reasoning. 21 These analyses are performed on data integrated from IPA 22 and MetaBase/MetaCore 23 network databases.
We also annotate hits with further relevant information, obtained from HGNC and Reactome, such as the gene families they are members of and the biological pathways they are involved with.
The biological interpretation step provides us with two main advantages. First, it enables us to obtain a better understanding of the function of hits in the pathway of interest. Second, it enables us to group together genes that have a related function, which can be useful, if needed, to reduce the number of hits to be tested in further hit confirmation assays.
Supplemental Material
Supplemental_Material_GuerrieroEtAl_Computational_Analysis_of_Arrayed_CRISPR_Screens - Delivering Robust Candidates to the Drug Pipeline through Computational Analysis of Arrayed CRISPR Screens
Supplemental_Material_GuerrieroEtAl_Computational_Analysis_of_Arrayed_CRISPR_Screens for Delivering Robust Candidates to the Drug Pipeline through Computational Analysis of Arrayed CRISPR Screens by Maria Luisa Guerriero, Adam Corrigan, Aurélie Bornot, Mike Firth, Patrick O’Shea, Douglas Ross-Thriepland and Samantha Peel in SLAS Discovery
Footnotes
Acknowledgments
The authors would like to thank Bev Isherwood for scientific advice and Martin Booth for technical support required to set up the genome wide arrayed CRISPR platform.
Declaration of Conflicting Interests
The authors declared the following potential conflicts of interest with respect to the research, authorship, and/or publication of this article: All authors are employed by AstraZeneca, and their research and authorship of this article was completed within the scope of their employment with AstraZeneca.
Funding
The authors received no financial support for the research, authorship, and/or publication of this article.
Supplemental material is available online with this article.
References
Supplementary Material
Please find the following supplemental material available below.
For Open Access articles published under a Creative Commons License, all supplemental material carries the same license as the article it is associated with.
For non-Open Access articles published, all supplemental material carries a non-exclusive license, and permission requests for re-use of supplemental material or any part of supplemental material shall be sent directly to the copyright owner as specified in the copyright notice associated with the article.