
Abstract
Due to high associated costs and considerable time investments of cell-based screening, there is a strong demand for new technologies that enable preclinical development and tests of diverse biologicals in a cost-saving and time-efficient manner. For those reasons we developed the high-density cell array (HD-CA) platform, which miniaturizes cell-based screening in the form of preprinted and ready-to-run screening arrays. With the HD-CA technology, up to 24,576 samples can be tested in a single experiment, thereby saving costs and time for microscopy-based screening by 75%. Experiments on the scale of the entire human genome can be addressed in a real parallel manner, with screening campaigns becoming more comfortable and devoid of robotics infrastructure on the user side. The high degree of miniaturization enables working with expensive reagents and rare and difficult-to-obtain cell lines. We have also optimized an automated imaging procedure for HD-CA and demonstrate the applicability of HD-CA to CRISPR-Cas9- and RNAi-mediated phenotypic assessment of the gene function.
Introduction
Cell-based arrays are a powerful technology platform for performing arrayed high-throughput screens. Diverse nucleic acids, together with the transfection reagent, are positioned (“spotted”) in defined positions on a glass or plastic surface. The surface is then overlaid with cells that are transfected within the “spot” area. The technology was first described by Ziauddin and Sabatini for use in gene overexpression studies with cDNAs. 1 Multiple spots of living cells transfected with defined cDNAs tagged to a fluorescent protein and overexpressing the encoded protein were formed on the glass slide. The arrays were examined for alterations in cellular function that were manifested in changes of subcellular localization. Since then, cell arrays were applied for the introduction of various kinds of nucleic acids,2,3 lentivirus vectors, 4 and furthermore, small synthetic molecules into living cells. 5
Cell arrays possess a number of features that allow them to compare favorably with multiwell plates. 6 For instance, cell seeding, liquid exchange, and immunostaining are easy procedures in this format, as a simple lab pipette is sufficient, instead of the need for robotics on the user side. Most importantly, cell arrays are suitable for miniaturization due to the absence of physical walls that usually separate samples into multiwell plates. Commercially available cell arrays from Persomics (http://www.persomics.com) and Retrogenix (https://www.retrogenix.com/) contain up to 3200 and 4500 spots per array, respectively. In addition, several research groups developed increased-scale arrays, ranging from 3888 spots 7 to 9216 spots, introduced by us, 8 and eventually 9888 spots, reached by Palmer and colleagues. 9 The increase in the sample numbers that can be analyzed on one cell array helps to scale down the required cell numbers, reagents, and pipette tips to a minimum and to speed up data acquisition.
As the potential of cell arrays and increased-scale cell arrays for performing gene function analysis has been clearly shown,7,10–12 we have further developed cell arrays to accommodate a human genome-scale number of samples. Accordingly, we call our platform high-density cell arrays (HD-CAs). A total of 24,567 spots are positioned on the array surface, and 1 HD-CA is equivalent to 256 plates with 96 wells or 64 plates with 384 wells ( Fig. 1 ). We reached this scale by expanding the “spottable” area on the surface and introducing a novel cell-seeding method using a two-mesh system. The method allows us to minimize unwanted liquid flow and compensates, to a large extent, complicated surface coating procedures that may be required to separate individual spots when increasing sample numbers and, accordingly, densities.7,8 The method ensures an even cell distribution across the complete size of an HD-CA.
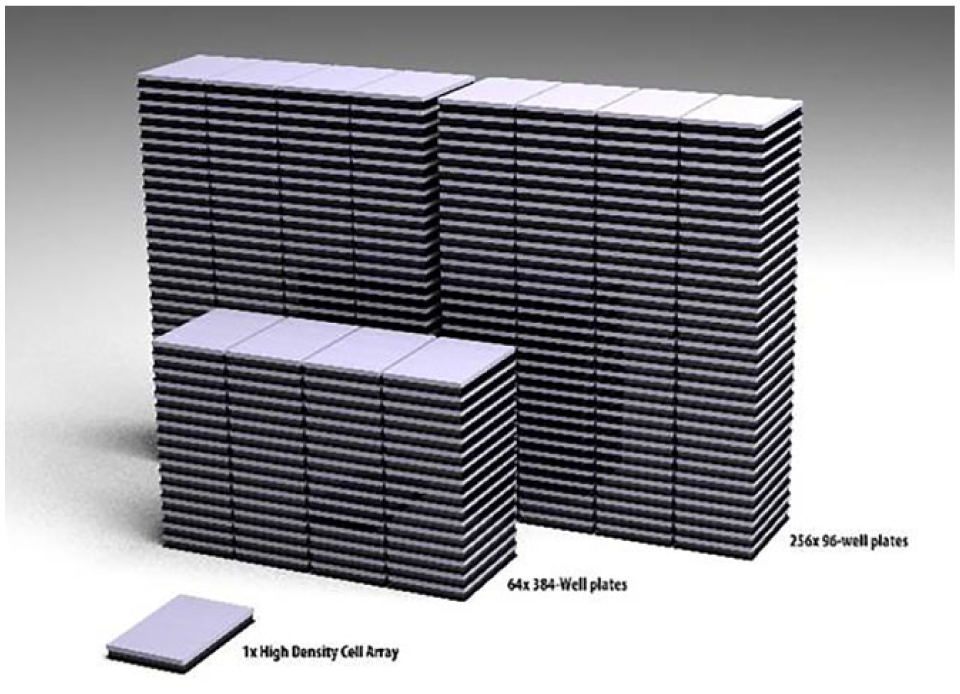
Throughput comparison of HD-CAs and multiwell plates. One HD-CA can accommodate the same number of samples as sixty-four 384-well plates and two hundred fifty-six 96-well plates.
The data acquisition on a scale of the whole genome is a challenging task, despite the presence of a number of automated fluorescence microscope-based image acquisition systems on the market.13,14 For this reason, we established a customized and modular imaging procedure for a commercial microscope platform to ensure high-quality data acquisition on HD-CA, and to be able to offer a complete service package. Finally, we demonstrated the applicability of HD-CA in CRISPR-Cas9-mediated gene editing and RNAi applications. An RNAi-mediated epithelial growth factor (EGF) internalization assay was performed in various types of cancer cells and generated novel data on the cell type-dependent endocytosis regulation. Moreover, we performed an RNAi-mediated screen for the involvement of genes related to plasma membrane (PM) signaling in cell proliferation. Our study for the first time presents genome-scale cell arrays and the utility of HD-CA for the rapid and efficient generation of functional data enabling complex analysis of biological systems.
Materials and Methods
Materials
ATCC HepG2 cells (HB-8065) were cultivated in Eagle’s minimal essential medium (EMEM). A549 cells (CCL-185), HeLa Kyoto cells (accession number CVCL_1922, courtesy of Dr. Pepperkok, EMBL), and HeLa-Cas9-GFP cells (SL503, GeneCopoeia, Rockville, MD) were cultivated in Dulbecco’s modified Eagle’s medium (DMEM), all supplemented with 10% fetal calf serum (FCS). HeLa-Cas9-GFP cells were cultivated in the presence of 250 µg/mL hygromycin. The growth media in all cases were supplemented with 2 mM glutamine, 100 U/mL penicillin, and 100 µg/mL streptomycin. gRNAs targeting KIF11 (target sequence: CCTAATGAAGAGTATACCTGGG) and PLK1 (target sequence: TCGGACGCGGACACCAAGGAGG) were purchased from Sigma-Aldrich (St. Louis, MO). Silencer Select siRNAs targeting endocytosis regulators are listed in Supplemental Table S2 , targeting KIF11 (s7902), INCENP (s7423), PLK1 (s448), and Negative Control No. 1 (NC) and Silencer Negative Control fluorescent labeled with Cy3 (NC-Cy3) were purchased from Ambion, Thermo Fisher (Waltham, MA). The siRNAs for the cell proliferation screen were synthesized by Qiagen (Hilden, Germany) and are listed in Supplemental Table S5 .
Fabrication of HD-CA
For fabrication of HD-CA, 82.2 × 124.6 mm glass substrates were purchased from Laborservice Brenzinger (Walldorf, Germany). The glasses were put in an immersion bath with 2 × 10⁻⁴% poly-
Coating of Multiwell Plates with the Transfection Solution
The plates were essentially prepared as described previously. 15 Briefly, 50 ng of gRNA and 1.25 µL of Lipofectamine 3000 transfection reagent (Thermo Fisher) were added to 200 µL of OptiMEM, containing 1.82 M trehalose dihydrate in a single well of a 384-well plate (Thermo Fisher). Then the solution was incubated for 5 min at RT to allow the complex formation. Collagen IV solution (3.625 µL; 1 mg/mL in ddH2O) was added into each well, and the mixture was diluted at a ratio of 1:11 with ddH2O. Of this solution, 7 μL was transferred to each well of 384-well plates (Becton Dickinson, Franklin Lakes, NJ). From each transfection solution, three wells were filled (triplicates).
Cell Cycle and Cell Proliferation Assays on HD-CA
Before cell seeding, nylon membranes of 150 and 500 µm (Novodirect, Kehl, Germany) were placed into the magnetic chamber and fixed with small magnets in the corners (supermagnete.de, Webcraft GmbH, Gottmadingen, Germany). Hela Kyoto and Hela-Cas9-GFP cells (2 × 10⁶) were distributed with a pipette on HD-CA in 10 mL of growth medium. Cells were incubated for 24–30 h when measuring cell cycle inhibition and for 48 h when measuring cell proliferation. Then cells were fixed with 3% paraformaldehyde solution containing 0.25 ng/µL Hoechst-33342 overnight at 4 °C.
EGF Internalization Assay on HD-CA
After positioning of the membranes (see above), 2 × 10⁶ cells were distributed with a pipette on HD-CA in 10 mL of growth medium, incubated for 36 h, and serum-starved for 12 h before the assay in DMEM with 1% (w/v) FCS. Alexa Fluor 555 EGF complex (Thermo Fisher) was added to a final concentration of 100 ng/mL, and cells were incubated at 37 °C for 15 min. After washing with phosphate-buffered saline (PBS) solution, an acidic “stripping” buffer (0.5% acetic acid and 0.5 M NaCl, pH 2.6) was added for 7 s to remove the cell surface-attached EGF. Cells were washed with PBS and fixed with 3% paraformaldehyde for 20 min at RT. Hoechst 33342 was used to stain cell nuclei.
Imaging of HD-CA
HD-CA was imaged on a modified automated Olympus IX81 ScanR system (Olympus, Shinjuku, Tokio, Japan). The ScanR software was replaced by a self-written Java application. Micromanager was used for hardware control and OpenCV for image processing.16,17 We used a 20× magnifying dry objective (Olympus UPlanSApo 20×, NA = 0.75, FN = 26.5, working distance = 0.6 mm) and integrated a Hamamatsu ORCA-FLASH 4.0LT camera (Hamamatsu, Hamamatsu, Shizuoka, Japan) for image acquisition with a large field of view, which allows us to image whole spots of the cell arrays with 20× magnification. Due to the large camera sensor of 13.3 × 13.3 mm, the entire field of view was not illuminated, but mainly the central region, which leads to a visible intensity drop-off at the edges of the images. Only the central region with sufficient illumination intensity was used for the evaluation of the images. A coordinate matrix with the equidistant single spot coordinates was created and mapped to the microscope stage coordinates by an affine transformation based on the coordinates of fluorescently stained reference points in the corners of the HD-CA. These reference points were imaged manually beforehand and their positions recorded automatically. The transformation between stage coordinates and coordinates on the specimen was performed using a linear projection. The transformation is capable of compensating rotational and translational misalignments, as well as compensating scale differences. After the initial calibration, a map of the specimen’s z profile was created. Therefore, z positions of chosen spots distributed over the HD-CA were recorded. To determine a starting position for the autofocus routine, the software interpolates between the recorded spots with inverse distance weighting. Nuclei were recorded by using 350 nm peak excitation and 451 nm peak emission, and internalized EGF-Alexa 555 was recorded using 555 nm peak excitation and 580 nm peak emission wavelengths using appropriate long and bandpass filters of the microscope system.
Quantification of Nuclei Changes and EGF Internalization on HD-CA
Acquired images from the cell cycle assay were analyzed for phenotypic classification with the open-source workflow manager Konstanz Information MinEr (KNIME; https://www.knime.com/) and its image processing plugins that are based on the same libraries as ImageJ. We applied and published workflows for phenotypic classification as described previously. 6 Image and data analysis for the EGF endocytosis assay was performed in MATLAB (The MathWorks, Natick, MA). For this, grayscale nuclei images were blurred using Gaussian low-pass filter and then converted to binary. Boundary elements were removed. Watershed transformation was used to define single cell regions. A nucleus mask was dilated using a disk structuring element, and the extended mask was used for calculation of Alexa Fluor 555 mean intensity values. Background was subtracted from original images using a morphological opening with a disk structuring element. Only cells within 225 µm from the center of the image, comprising the spot area enlarged by 20 µm to compensate for the potential shift in the spot positioning, were included in the analysis. Cells were classified into two groups: normally and weakly internalizing EGF. Ten percent of the cells with the lowest Alexa Fluor 555-specific intensity in the spots containing NC siRNA were used as a classification value (threshold). The ratio of weakly internalizing cells within the spot was used to flag an siRNA as effector. The threshold value was calculated for each HD-CA separately. Only spots with more than 45 cells after the thresholding were taken for further analysis.
Cell Proliferation Assay on HD-CA
Data from the ENCODE library (https://www.encodeproject.org) were used to reduce the set of selected genes to those presumably expressed in HeLa cells. We selected genes based on an ENCODE RNA-seq dataset for HeLa-S3 cells (GEO sample accession: GSM958735; available at http://genome.ucsc.edu/; UCSC accession: wgEncodeEH000130) with FPKM ≥ 1. To correct for regional inhomogeneities and normalize measurements of
Results and Discussion
Characterization of HD-CA
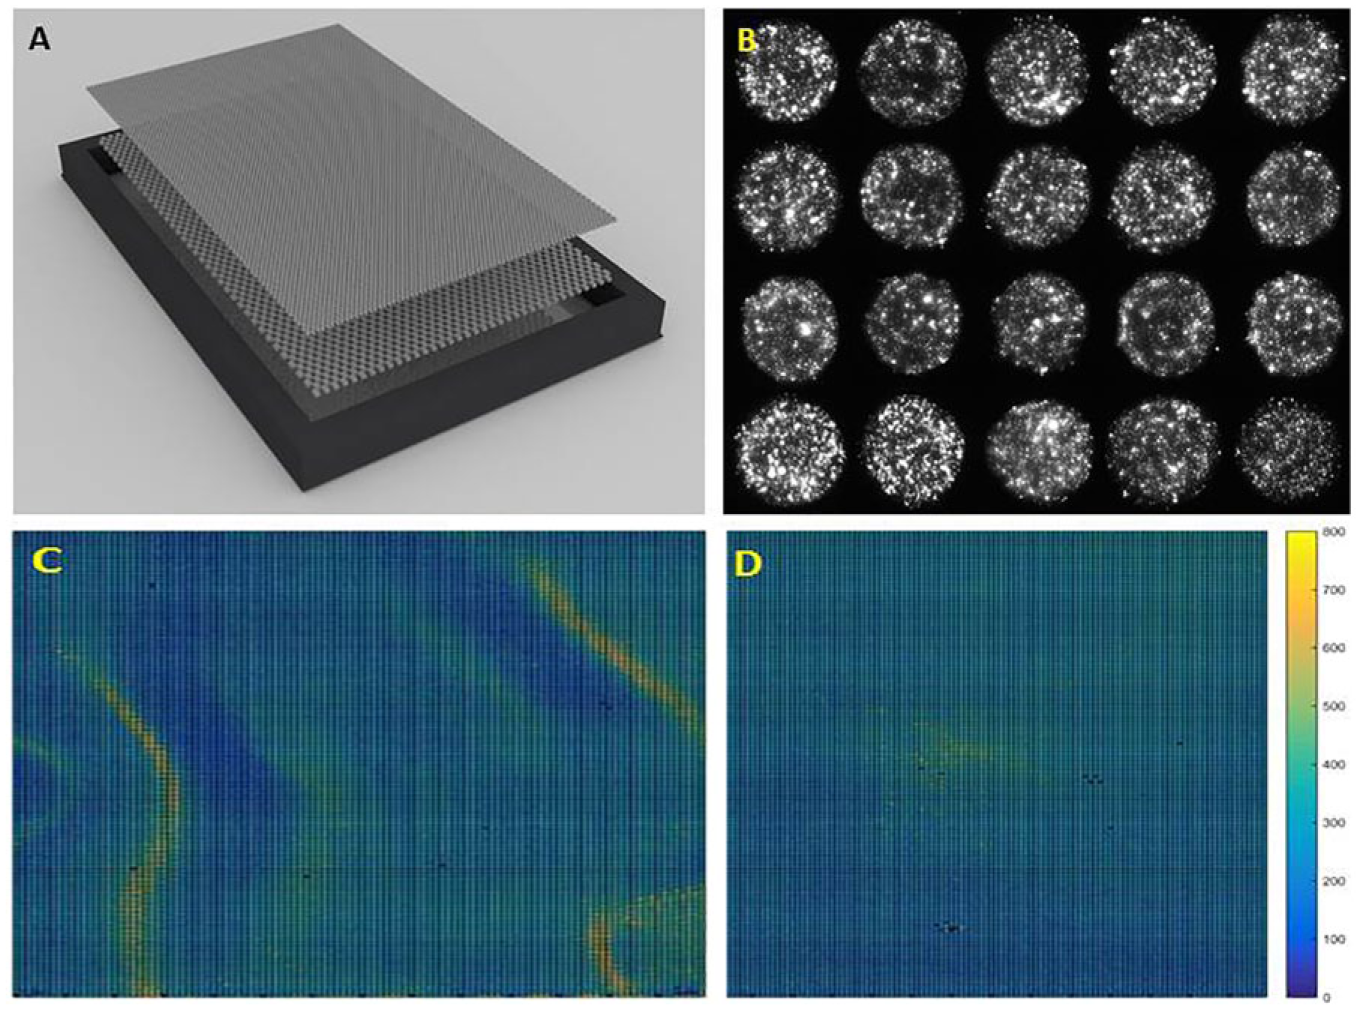
One of our aims was the generation of cost-effective and easy-to-produce and -use cell arrays. We addressed those issues by printing on 170 µm thick glass substrates with dimensions of a multiwell plate (SBS plate standard), which we clamped into a customized reusable magnetic holder ( Fig. 2A ). Those dimensions allow insertion of HD-CA in any standard microscopy stage (Materials and Methods). We harnessed the complete addressable area of a microscopy stage with a travel range of 120 × 80 mm as a surface of HD-CA. This procedure extended the common microscopy slide dimensions to an active area of about 18 × 54 mm. We picked thin glass substrates because they can be used in diverse microscopy systems and for targeted or correlative imaging (e.g., wide-field, confocal, spinning disc, or super-resolution microscopy). As a result, a wealth of different phenotypic assays could be performed.
HD-CA. (
For the reagent spotting, we applied contact printing technology employing a highly precise robot equipped with a 384-pin head. The unique high speed of the printing process, by applying 384 pins in parallel, and the open access to the robotic software allow us to print in a cost-effective way, with more than 100 arrays being produced from a single source plate. The extended area of the glass substrate enabled us to position 24,576 spots corresponding to the complete human protein-coding genome on a single cell array if each gene were assayed on a single spot. In order to obtain sufficient numbers of cells per spot, we chose a spot diameter of 430 µm (after cell seeding) with approximately a 3 nL volume that can accommodate, on average, 218 ± 49 cells. In order to avoid sample mixing between the spots, we used spot-to-spot distances of 562.5 µm in the x and y directions if measuring between the centers of two spots. The distance between the edges of two spots is 133 µm, and five to six cells of 20 µm (e.g., HeLa) in size can be accommodated to ensure sufficient spot-to-spot separation. The quality of the spots and their positioning were repeatedly tested by using siRNAs labeled with Cy3 in the spotting mixture ( Fig. 2B ), and less than 6% variation of the spot sizes could be detected. Smaller spots of diameter 350, 200, and 140 μm were reported by Persomics and Rantala and colleagues, 7 respectively. Correspondingly, fewer cells are available for functional analysis.
One of the problems when growing 2D cell monolayers is inhomogeneous cell distribution on the surface. For instance, cell density is higher at the borders and in the center of the individual well of the multiwell plate than in between both regions. The reasons for this phenomenon may be vibrations or differential material transport during the cell seeding. In order to reduce this phenomenon on cell arrays, we introduced a two-mesh system. The first mesh, which is positioned closer to the glass substrate, has a pore size of 500 µm, and the second one is positioned on the top and has a pore size of 150 µm. Cells are seeded on top of the two-mesh systems and allowed to migrate through the pores and attach to the glass for 30 min. Then the two-mesh system is removed. The rationale behind the system is that the first mesh, with a pore size similar to the spot-to-spot distances on the HD-CA, and the second mesh, with three to four times smaller pores, block liquid wave formation when applying cell suspension and other solutions. Cell seeding on HD-CA with the insert shows a considerable more homogenous cell distribution compared to without the mesh, and extreme cell crowding (up to 600 cells per spot) or their local absence (less than 50 cells per spot) is nearly completely avoided ( Fig. 2C,D ). Both layers are made from cell-repellent material (e.g., Nylon) and can be acquired commercially (see Materials and Methods). Alternatively, the meshes can be printed on a 3D printer.
A particular focus was to keep potential cross-contamination between the neighboring spots minimal prior to and after cell seeding. The first issue was addressed by extensive optimization of the pin washing procedure between different samples (time of washing, prolongation of washing, and varying temperatures were tested), 20 which collectively enabled the reduction of spillover of siRNA-Cy3 between the neighboring spots. In addition, the introduction of the mesh and medium change shortly after cell seeding, similar to what was described by Fengler et al., 21 enabled us to efficiently restrict the phenotype appearance to the spot areas after cell seeding ( Suppl. Fig. S3 ). By those optimizations we could reduce cross-contamination from 10.9 ± 3% prior to optimization to only 0.95 ± 0.76% after optimization. 20
Imaging of HD-CA
Fluorescent microscopy-based functional analysis has proven to be one of the most useful tools to analyze proteins and their complexes acting in diverse cellular processes. Image acquisition devices for large-scale experiments have to meet requirements that are different from those for conventional fluorescence microscopes. They should be compatible with large numbers of the samples and entirely adapted in terms hardware and software for fully automated operation. Many of those devices, however, are limited in regard to extensions, for example, hardware substitutions or parameter range, and flexibility.13,14 We modified a commercial screening microscope to acquire a genome-scale number of samples in one continuous imaging experiment. In order to achieve that, we modified an Olympus IX81 ScanR screening microscope, which we control with customized software (for more details, see Materials and Methods). The implemented camera has a large field of view, which allows imaging of the complete spot with a 20× magnification (
Figs. 3
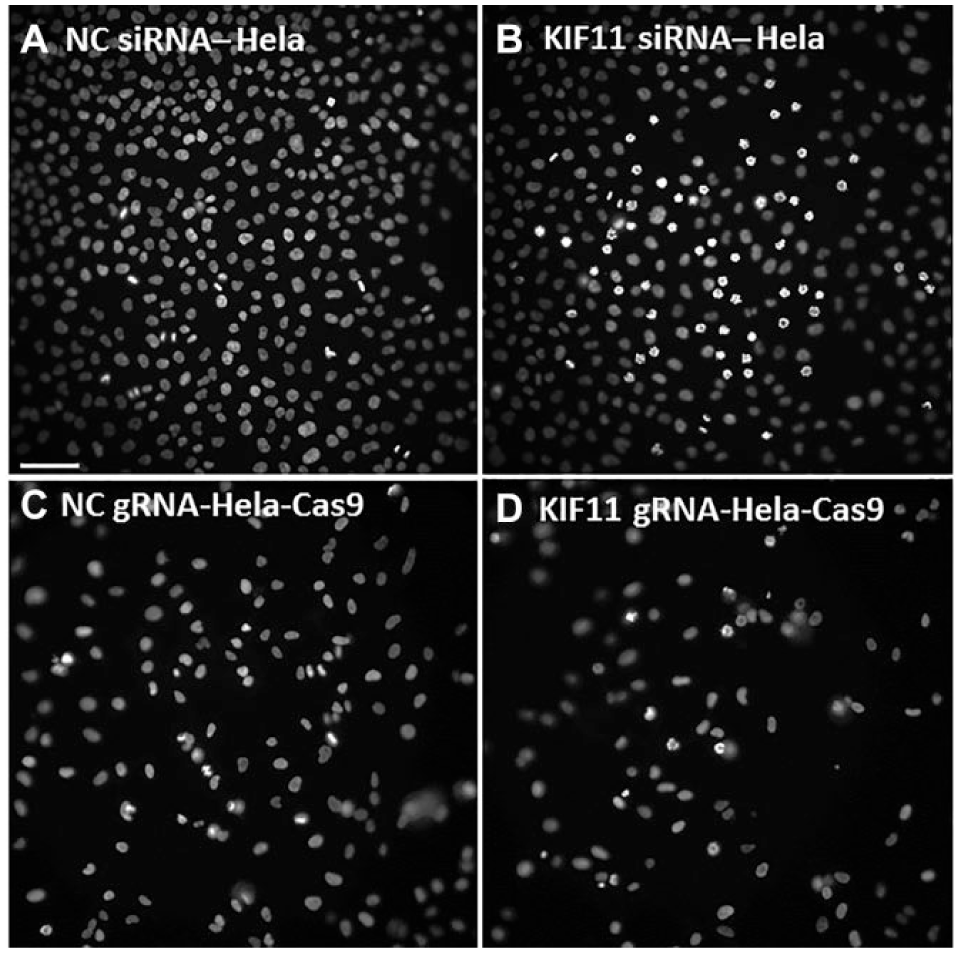
Mitotic arrest induced by RNAi and CRISPR-Cas9 on HD-CA. The formation of monopolar mitotic spindles is induced by the transfection of HeLa cells with an siRNA targeting KIF11 and by the transfection of HeLa-Cas9-GFP cells with a gRNA targeting KIF11. Cell nuclei are stained with Hoechst 33324. Scale bar is 75 µm.
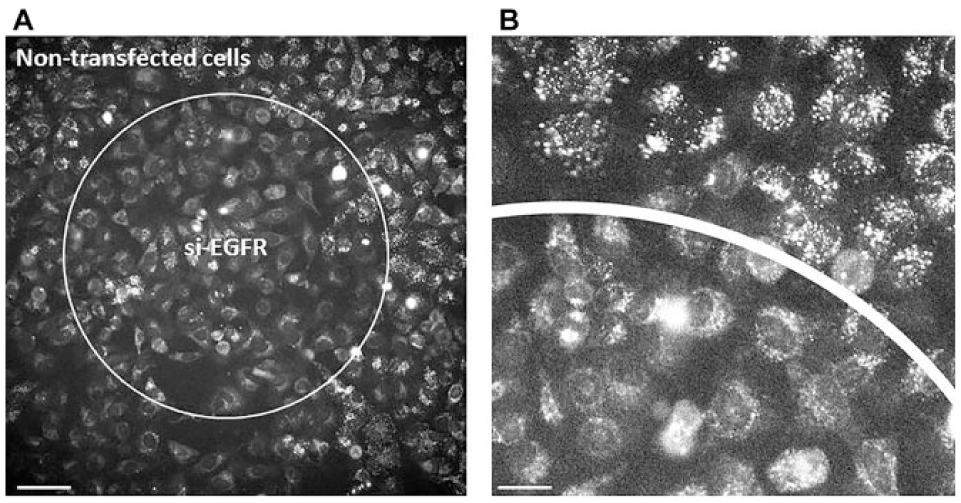
Spot-constrained RNAi-mediated inhibition of EGF endocytosis. (
Application of HD-CA for RNAi and CRISPR-Cas9-Mediated Gene Editing
After having found the optimal conditions for cell seeding, we tested the application of HD-CA in cell-based assays. For this, we took advantage of the knowledge that the RNAi of KIF11 (kinesin-like protein), PLK1 (polo-like kinase 1), and INCENP (inner centromere protein) induces a well-characterized impairment of cell cycle progression.22–24 Also, we have a set of validated siRNAs to reliably downregulate the expression of these proteins. It was previously shown that the characteristic changes in the nuclei morphology are induced upon the depletion of these regulators on cell arrays.6,25 Indeed, we could also recapitulate these effects on the HD-CA platform following the seeding of HeLa cells on the prespotted arrays and incubating for 24–28 h. As demonstrated in Figure 3A and Supplemental Figure S3A , 35%–40% of cells residing on the spot (the central area of the image) are trapped in mitosis with the formation of aberrant monopolar mitotic spindles in their nuclei upon the depletion of KIF11 and PLK1, respectively. The formation of multilobed nuclei was reached in about 30% of cells growing on HD-CA following the depletion of INCENP ( Suppl. Fig. S3C ). We have achieved phenotype rates similar to those reported previously using the “classical” cell array format enabling working with 384 samples.3,6 Furthermore, we observe a good restriction of the desired phenotype on the spot and its nearly complete absence in cells surrounding the spot, which is marked by the addition of siRNA conjugated to Cy3 ( Suppl. Fig. S3B,D ).
Next, we complemented RNAi by knockout of the same genes using CRISPR-Cas9-mediated gene editing. For this purpose, we used gRNAs that were previously validated in the format of multiwell plates 15 and HeLa cells stably transfected with a Cas9-GFP fusion protein (Materials and Methods). Similar to the conditions of RNAi, cells on the spot containing gRNA targeting KIF11 also formed monopolar mitotic spindles. A phenotype frequency of about 10% was achieved after 24 h incubation on HD-CA ( Fig. 3D ); however, it was increased in longer incubation times of 36–48 h (data not shown). The impairment of cell division is also reflected by the reduction of cells in the population. Indeed, the knockout of PLK1 and KIF11 reduced cell numbers within the spot area by 60% and 46%, respectively. We also generated data in 384-well plates under the conditions of reverse transfection (Materials and Methods) using the same posttranscription incubation times, cells, and gRNAs, and could demonstrate that a fairly similar number of cells, namely, about 30%, showed the expected mitotic phenotypes when knocking out KIF11 and PLK1 (data not shown). Similar to the experiments with HD-CA, the remaining cell numbers in the individual wells were also reduced by 35% and 47%, respectively. Two independent replicates with HeLa and Hela-Cas9-GFP cells were performed for RNAi and gene editing experiments, respectively. Our data indicate that HD-CA can be successfully applied to induce gene knockdown and knockout conditions for phenotypic screening.
RNAi-Mediated EGF Endocytosis Assay on HD-CA
In order to further test the suitability of HD-CA in phenotypic screening applications, we focused on EGF endocytic trafficking, as the assay was recently shown to perform well in the cell array format. 6 In contrast to our latter work, where we compared the data quality and reproducibility in regular cell arrays (with 384 spots) and multiwell plates on the basis of well-established positive controls, here we extended the EGF assay and quantification routine to more regulators. We applied 36 siRNAs targeting 12 key regulators (3 siRNAs per gene) of clathrin-dependent endocytosis, including conventional (AP2M1) and alternative (Dab2, NUMB, LDLRAP1) adaptors for cargo recognition and vesicle formation. 26 The chosen RAB GTPases serve as markers of early (Rab5A), recycling (Rab4A, Rab11A), and late (Rab7A) endosomes—the major stations of endocytic trafficking ( Suppl. Table S2 ). 27 We further included siRNAs targeting caveolin-1 (CAV1) to test the alternative to clathrin-dependent trafficking, namely, the caveolin-dependent pathway, in different cells. 28 Eighteen siRNAs out of 36 were validated by qRT-PCR by the producer ( Suppl. Table S2 ).
Each siRNA along with the negative control (Materials and Methods) was spotted five times using Lipofectamine 2000 transfection reagent ( Suppl. Fig. 1A ). We then performed an EGF endocytosis assay in cancer cells of varying origin ( Table 1 ). Two independent replicates were performed in HeLa cells (indicated as HeLa I and II in Table 1 ) and extended to A549 and HepG2 cells (a single replicate each). In every experiment, the average values of five spots with their respective siRNAs were calculated and normalized against the negative control of the individual experiment (resulting z scores of each experiment are shown in Suppl. Table S3 ). A gene was considered a hit when at least two siRNAs out of three reached a z score of more than ±1 or one siRNA out of three reached a z score of more than ±1.5 and was consistently showing the same effect over different experiments. As expected, 12 the RNAi of the epithelial growth factor receptor (EGFR) induced a nearly complete inhibition of EGF cellular entry in all types of cells ( Fig. 4 ), and the effect was achieved with all three tested siRNAs ( Suppl. Table 3A–D ). The downregulation of large GTPase dynamin-2 (DNM2) that is required for the scission of clathrin-dependent and clathrin-independent endocytic vesicles at the PM 29 also consistently inhibited EGF internalization in all experiments. In general, both independent replicates performed in HeLa cells showed an excellent correlation with all tested siRNA, inducing the same effect. For instance, the downregulation of clathrin heavy chain (CLTC) and two clathrin-associated sorting proteins (CLASPs), namely, Dab2 and LDLRAP1, impaired EGF intracellular accumulation. The RNAi of CAV1 also reduced EGF cellular uptake, suggesting that both pathways operate in HeLa cells ( Suppl. Table 3A,B ). The caveolin-dependent pathway seems to be less important in HepG2 cells ( Table 1 , Suppl. Table S3D ), which correlates well to the absence or very low expression level of CAV1 in these cells.30,31 In contrast, a moderate expression of CAV1 was reported in HeLa cells.32,33 Also, another set of CLASPs, namely, Dab2 and NUMB, may operate in the clathrin-dependent EGF endocytosis than in HeLa cells. Lung epithelial A549 cells responded in a similar manner to HeLa cells, except that the downregulation of CLTC caused no inhibition of EGF endocytosis. Despite the established functional link between EGFR and the AP-2 adaptor complex, 34 the downregulation of one of its components, AP2M1, caused no changes in EGF endocytosis in all experiments ( Table 1 ). This may result from inefficiently performing nonvalidated siRNAs ( Suppl. Table S2 ), or the function of the AP-2 complex may be compensated by other adaptors, as observed and previously suggested. 35 In agreement with previous data (see the review in Bakker et al. 36 ), the downregulation of Rab5A and Rab7A uniformly impaired EGF trafficking in all tested cells. The importance of endocytic recycling pathways was cell type dependent: both short Rab4A-dependent and long Rab11A-dependent pathways may be relevant for HepG2 cells, 33 whereas none of these caused any changes in A549 cells when downregulated.
Overview of EGF Internalization Assay in Different Cells.
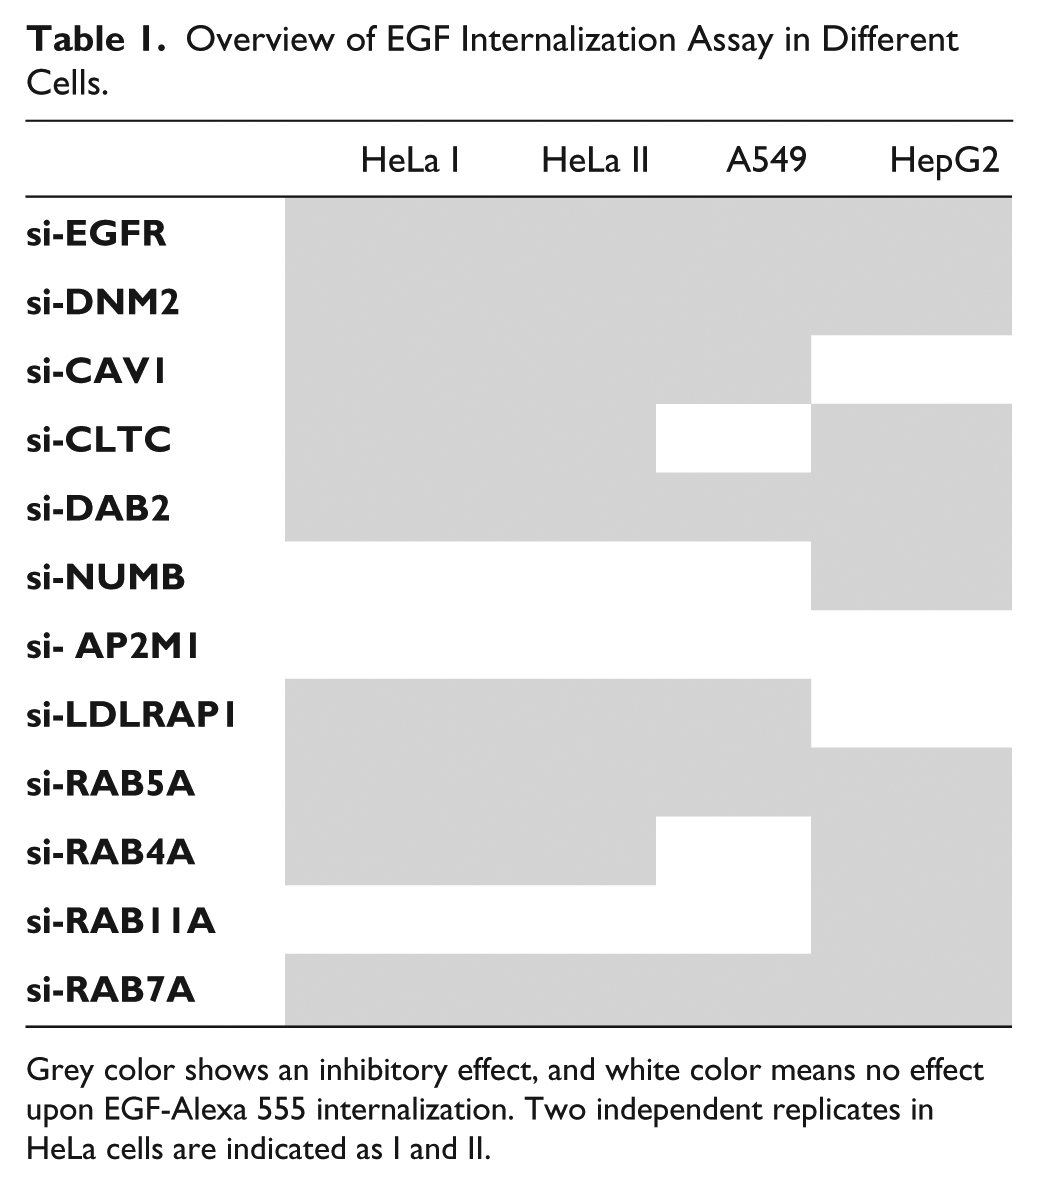
Grey color shows an inhibitory effect, and white color means no effect upon EGF-Alexa 555 internalization. Two independent replicates in HeLa cells are indicated as I and II.
Here, we demonstrate that the HD-CA technique enables a fast and efficient analysis of cellular pathways. The comparative analysis across different cell lines may be an important advantage of HD-CAs because it is difficult to accomplish this task with conventional screening platforms. The limited set of data presented in this article already shows high biological relevance. For instance, 6 of the 12 genes tested in our study were also downregulated in a previous RNAi-mediated EGF endocytosis screen performed in HeLa cells using 384-well plates. 37 Downregulation of only one gene, namely, CAV1, induced inhibition of EGF trafficking in HeLa cells in our study, whereas no effect was raised in the previous screen of Collinet et al. 37 The RNAi of the remaining five genes (EGFR, DNM2, CLTC, Rab7A, and AP2M1) caused the same effects of EGF endocytosis in both studies.
RNAi-Mediated Screen for the Involvement of Genes Linked to Plasma Membrane Signaling in Cell Proliferation
We next exploited HD-CA for studying interconnections between several important signaling pathways operating at the PM and cell proliferation, which enables us to apply a straightforward readout, namely, scoring the number of cells per spot following the transfection. We included genes in the screen based on the results of our previous studies on integrin function and additionally by selecting genes linked to gene ontology (GO) terms that are related to signal transduction pathways involved in signaling from the PM (
Suppl. Tables S4
We observed significant effects for 26 siRNAs ( Fig. 5 , Suppl. Table S6 ). Two of the potential hits, KIF27 and PDIA3, showed significant effects with two independent siRNAs; therefore, we consider them “strong” hits. The gene PDIA3 encodes for the protein disulfide-isomerase A3 (PDIA3; also termed GRP58 or ERp57). Potential downregulation of PDIA3 reduces cell numbers per spot due to either inhibition of cell proliferation or induction of apoptosis, both of which may be attributed to the protective role of this protein against cellular stress. 38 In contrast, more cells per spot were recorded when KIF27 was targeted with siRNAs. The function of this slow processive kinesin is still little understood, and it is suggested to link microtubules to the signaling complexes rather than propelling microtubule-mediated transport. 39 A direct or indirect role of KIF27 in cell proliferation, as suggested by our data, opens novel follow-up research directions.
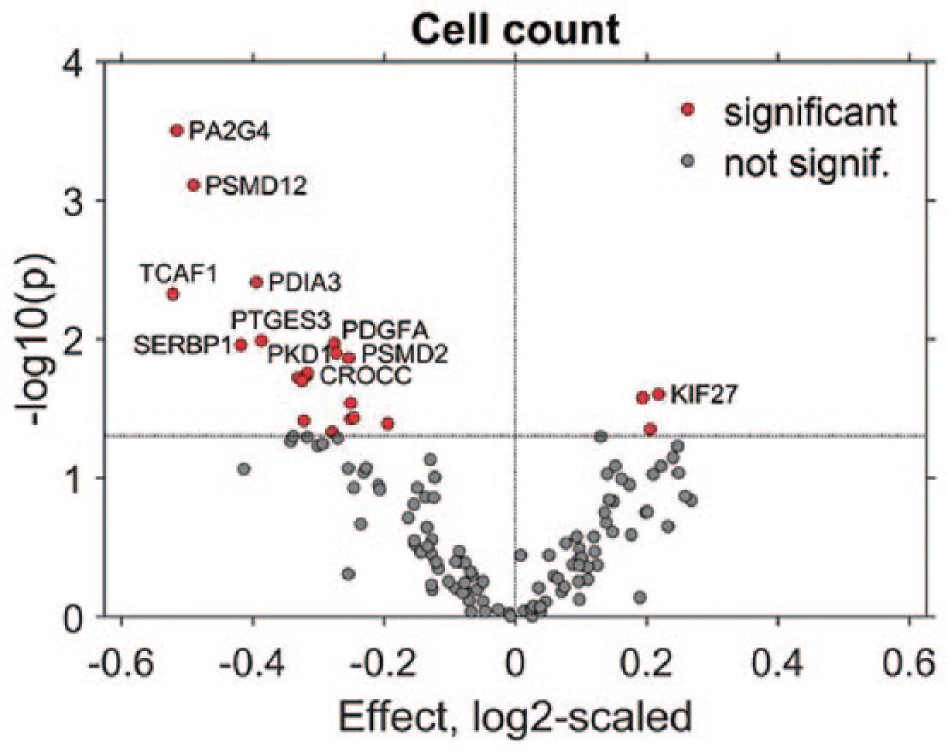
Screen for the involvement of signaling pathways in cell proliferation. RNAi screening was conducted to characterize the involvement of signaling pathways related to signaling from the PM or vesicle trafficking in cell proliferation. Two siRNAs per gene, for a total of 131 genes, were spotted on HD-CA plates. Log2-scaled fold changes in cell numbers relative to negative controls and p values were visualized for the most effective siRNA per gene. Significance was defined by p < 0.05 obtained from Welch t tests. The names of the 10 most significant genes and the KIF27 gene that was associated with the strongest increase in cell count were indicated.
Predominantly, decreased cell numbers were recorded for potential hits obtained with one siRNA. We call them “weak” hits, as all of them require rigorous validation. The most prominent changes in cell numbers were observed with siRNAs targeting PA2G4, PSMD12, TCAF1, and PTGES3. Indeed, the functions of these genes are directly or indirectly linked to pathways related to proliferation and cell survival. For instance, PA2G4 encodes proliferation-associated protein 2G4 (PA2G4; also termed EBP1), which is involved in the regulation of apoptosis, proliferation, and differentiation. 40 Herewith, we demonstrated that HD-CA technology was capable of identifying genes regulating cell proliferation and facilitates the identification of novel connections between diverse signaling pathways and cell proliferation. Characterizing new interconnections between these pathways might be relevant for developing co-treatments that can be combined with established antiproliferative therapies.
We presented here HD-CA, which has the potential to accommodate a human genome scale of up to 24,576 samples for simultaneous phenotypic analysis. Compared with commercially available multiwell plate formats with 1536 wells, the gain in throughput by HD-CA presented here is a factor of 16, and even more if compared with 384-well and 96-well plates (
Fig. 1
). Consequently, HD-CAs could enable a high degree of data reproducibility when applied in large-scale screening campaigns. Nearly all major cost factors (personnel, reagents, imaging time) are significantly lower when estimating a genome-wide RNAi screen using HD-CA compared with 384-well plates (
Suppl. Fig. S5
On the other hand, a broad variety of RNAi and CRISPR-Cas9-mediated assays can be performed with our system. The cost-effective fabrication and exploitation of HD-CA is especially rewarding for combinatorial genetic or genetic-chemical screens that are highly needed to tackle the complexity of biological systems but are currently difficult to perform due to a lack of truly large-scale platforms for phenotypic screening. As a result, HD-CA has a broad application spectrum, ranging from the identification of disease-relevant genes and proteins, to the combinatorial screening of drugs and their respective targets, to testing for therapeutically active biologicals.
Supplemental Material
Suppl_Mat_for_High_Density_Cell_Arrays_for_Genome-Scale_Phenotypic_Screening_by_Starkuviene_et_al – Supplemental material for High-Density Cell Arrays for Genome-Scale Phenotypic Screening
Supplemental material, Suppl_Mat_for_High_Density_Cell_Arrays_for_Genome-Scale_Phenotypic_Screening_by_Starkuviene_et_al for High-Density Cell Arrays for Genome-Scale Phenotypic Screening by Vytaute Starkuviene, Stefan M. Kallenberger, Nina Beil, Tautvydas Lisauskas, Bastian So-Song Schumacher, Ruben Bulkescher, Piotr Wajda, Manuel Gunkel, Jürgen Beneke and Holger Erfle in SLAS Discovery
Footnotes
Acknowledgements
We acknowledge Jan Philipp Eberle and Armin Drusko for supporting our work with the imaging platform, Dr. Johannes Rittinger for supporting our work with the cell arrays, and Martin Below for data presentation support.
Supplemental material is available online with this article.
Declaration of Conflicting Interests
The authors declared no potential conflicts of interest with respect to the research, authorship, and/or publication of this article.
Funding
The authors disclosed receipt of the following financial support for the research, authorship, and/or publication of this article: This work was supported by the following grants: “Methoden für die Lebenswissenschaften” of the Baden-Württemberg Stiftung (no. P-LS-SPII/11); “RNA-Code” (no. FKZ 031A298) of the German Federal Ministry of Education and Research (BMBF); HD-HuB (no. 031A537C) and “MultiPro” (no. 03VP03910), VIP+ Program, BMBF. The Advanced Biological Screening Facility was supported by the CellNetworks–Cluster of Excellence, Heidelberg University (no. EXC81).
References
Supplementary Material
Please find the following supplemental material available below.
For Open Access articles published under a Creative Commons License, all supplemental material carries the same license as the article it is associated with.
For non-Open Access articles published, all supplemental material carries a non-exclusive license, and permission requests for re-use of supplemental material or any part of supplemental material shall be sent directly to the copyright owner as specified in the copyright notice associated with the article.