
Abstract
High-content screening has brought new dimensions to cellular assays by generating rich data sets that characterize cell populations in great detail and detect subtle phenotypes. To derive relevant, reliable conclusions from these complex data, it is crucial to have informatics tools supporting quality control, data reduction, and data mining. These tools must reconcile the complexity of advanced analysis methods with the user-friendliness demanded by the user community. After review of existing applications, we realized the possibility of adding innovative new analysis options. Phaedra was developed to support workflows for drug screening and target discovery, interact with several laboratory information management systems, and process data generated by a range of techniques including high-content imaging, multicolor flow cytometry, and traditional high-throughput screening assays. The application is modular and flexible, with an interface that can be tuned to specific user roles. It offers user-friendly data visualization and reduction tools for HCS but also integrates Matlab for custom image analysis and the Konstanz Information Miner (KNIME) framework for data mining. Phaedra features efficient JPEG2000 compression and full drill-down functionality from dose-response curves down to individual cells, with exclusion and annotation options, cell classification, statistical quality controls, and reporting.
Keywords
Introduction
High-Content Landscape
High-throughput screening of chemical libraries against predefined targets is an established method to generate hits from which lead compounds can be derived.1,2 For the discovery of drugs with innovative mechanisms of action, or of new targets, there appear to be important advantages to phenotypic in vitro screening using small-molecule or RNAi libraries.3,4 In today’s drug discovery process, we use cells and cell lines that exhibit normal and disease phenotypes that occur in large multicellular organisms. Despite the unavoidable limitations of such models, the expectation exists that they can improve the success rate of the drug discovery process. 5
This approach requires technologies that generate rich data sets from a cell-based assay, with several values for each individual analyzed cell, possibly with the addition of a time dimension. Microscopy-based high-content screening (HCS) is a flexible technology that can be used to perform fundamentally simple assays such as cell proliferation but also supports assays of high complexity. This includes the use of morphological parameters and fluorescent probes to characterize cellular phenotypes, the screening of co-cultures and primary cells, and the culture of cells in three-dimensional models. 6 Complex assays present a much greater challenge of data interpretation and quality control 7 because dealing with high-dimensional data requires more sophisticated tools and more complex math. Traditional quality control tools for screening are defined for univariate data sets. The list of benefits and advantages of the use of HCS is still expanding. 8
Another technology able to generate rich mechanistic information is flow cytometry (FCM).5,9 Modern instruments can measure a dozen or more fluorescence channels, and flow cytometers are appearing that combine stable isotope tags with a mass-spectrometry readout to permit even greater multiplexing. 10 Technologies such as continuous-flow auto-samplers such as Hypercyt 11 (IntelliCyt, Albuquerque, NM) speed up sampling speed in FCM. Although FCM lacks spatial resolution within cells, it can in general analyze much larger numbers of cells than HCS and has greater detection sensitivity.
In the past decade, flow cytometers with an imaging capability have become available, providing limited spatial resolution.12,13 We find that our researchers commonly explore assay development using both imaging and FCM and select the technique that works best in a particular case. Techniques for gating FCM data are similar to those used to classify cell subpopulations based on image analysis data and can be reused. 14 Therefore, both technologies must be supported by the informatics environment.
High-Level Goals
Phaedra development aimed for the cross-site integration of HCS efforts, thus leveraging our existing investments in instrumentation, connecting them with the existing informatics environments and offering users a single, integrated application environment. Phaedra had to connect with our entire range of HCS instruments, which includes the Digilab MIAS-2, PerkinElmer Opera QEHS, and GE Healthcare IN Cell Analyzer 1000 and 2000. We also added the ability to import data from Zeiss LSM confocal microscopes. The associated image analysis tools include PerkinElmer Acapella, GE IN Cell Investigator, custom tools developed for us by DCI Labs, and our own in-house algorithms. Data streams also have to be provided from and to several screening laboratory information management systems (LIMS) and data warehouses (e.g., to retrieve plate layouts and report compound results).
We required a structured, searchable repository of data, with tools for statistics, quality control, and curve fitting. The environment allows the review and reporting of images, heat maps, histograms, correlation plots, compound effects, and dose-response curves. Users have to be able to approve or reject data on plate, well, image, and even cell levels while ensuring data integrity and triggering recalculation where necessary.
Besides simplifying and accelerating data management, we also aimed to offer new data analysis options. Phaedra had to be straightforward enough for fast assay development and for ad hoc microscopy users yet sophisticated enough to support data mining.
Architecture: Web or Client Based?
Although HCS is a maturing and proven technology, it is still evolving, and user requirements cannot be entirely fixed. Thus, a flexible, modular, and extensible architecture is fundamental. An enterprise-level high-content analysis (HCA) system is complex, with many building blocks, as illustrated by
We have worked with modern Web-based graphical user interfaces (GUIs) such as EXT 19 and the Google Web Toolkit, and in our opinion, a fat-client interface still provides the best possible flexibility and speed in tasks such as arbitrarily assembling multipart views or displaying, resizing, and combining multiple image channels. Graphics processing unit–based algorithms to speed up image processing 20 are easier to run or available only on workstations, and OpenGL rendering algorithms were needed to get sufficient speed for some visualization tasks, for example, to create three-dimensional (3D) scatter plots of data sets with a million or more points.
Demanding image analysis tasks can be run on servers or on client machines. The distinction is increasingly becoming moot because multicore workstations are now commodity items. The analysis of a large screening data set can still take many hours on such a system, but as these workstations are affordable, it seemed advantageous to scale up organically and accommodate extra concurrent users by adding extra workstations, instead of having to dedicate more costly server infrastructure. Processing is limited not only by number and speed of processors but also by available memory and data transfer rates: the use of large-area sCMOS cameras, the multiplexing of several color channels, and the capture of Z stacks for 3D assays all add to the growth of memory requirements in HCA, now up to tens or even hundreds of megabytes for a single well. Multiparametric FCM also generates huge data volumes, especially if large numbers of cells and multiprobes are analyzed in search of rare events.
In summary, concerns of cost, scalability, and memory lead us to a choice to distribute processing tasks over multiple workstations, and a fat-client approach was indicated. A distributed solution (“scale out”) was preferred over increasing the capabilities of a single central server (“scale up”).
Adapt or Create and Reuse?
In building our own HCA system, we strove to avoid the impedance mismatches usually associated with linking together systems constructed on a different architectural basis and with different design assumptions. We needed a platform that easily integrates our own and other (open-source) modules and tools. We chose the Eclipse/RCP environment, which implements the OSGi architecture standard, as a basis. Apart from its technical advantages, this gave us the possibility to quickly integrate other modules available on the Eclipse marketplace, such as KNIME, BioClipse, and Bio7 (see
This permits us to address the challenges of mining large HCS and FCM data sets with existing tools. KNIME 21 is a graphical workflow tool similar to Pipeline Pilot and Taverna, 22 with inherent parallel processing capabilities, 23 which has also been adopted by the OpenBIS project. Data pipelining tools enable nonexpert users to perform complex analysis tasks on large amounts of data. Tables are passed along the pipeline to nodes handling various tasks such as selection of subsets, transformations, and aggregation. Nodes for interactive visualization help to explore the results. The self-documenting graphical representation renders the workflows’ purpose much more obvious, improving sharing of knowledge among analysts. From any data view in Phaedra, a selection of data, for example, a list of plates, can be injected into a KNIME workflow.
The imaging functionality is equally critical for the success of an HCA software system, and its performance and capabilities are strongly determined by the choice of the underlying technology. We adopted JPEG2000 because it is a best-in-class compression standard, with a wealth of capabilities. 24 The most important of these are a state-of-the-art low-bit-rate compression performance, about 20% better than the former JPEG format. The typical JPEG blocking artifacts (introduction of artificial edges) do not occur. JPEG2000 allows progressive transmission by quality, resolution, component, or spatial locality. It offers both lossy and lossless compression (with lossless decompression available naturally through all types of progression). It can deal with tiling and random (spatial) access to the bitstream, enabling fast pan and zoom (with decompression of only a subset of the compressed data). Some regions of interest can be coded with a higher level of detail. Furthermore, the JPX file format can contain multiple images, allowing on-the-fly, real-time generation of thumbnails for all wells of a whole plate. Because these possibilities satisfied all our requirements, we decided to use JPEG2000 for all stored images. Admittedly, JPEG2000 technology is complex to implement, which may account for its being little used so far in HCS and HCA offerings.
Materials and Methods
Phaedra consists of three parts: an Oracle database (10 g or better; Oracle Corporation, Redwood Shores, CA), a file server, and a Java client based on the Eclipse RCP application framework. Plug-ins and features facilitate creation of a modular architecture. Client software is installed via an Eclipse P2 update (see
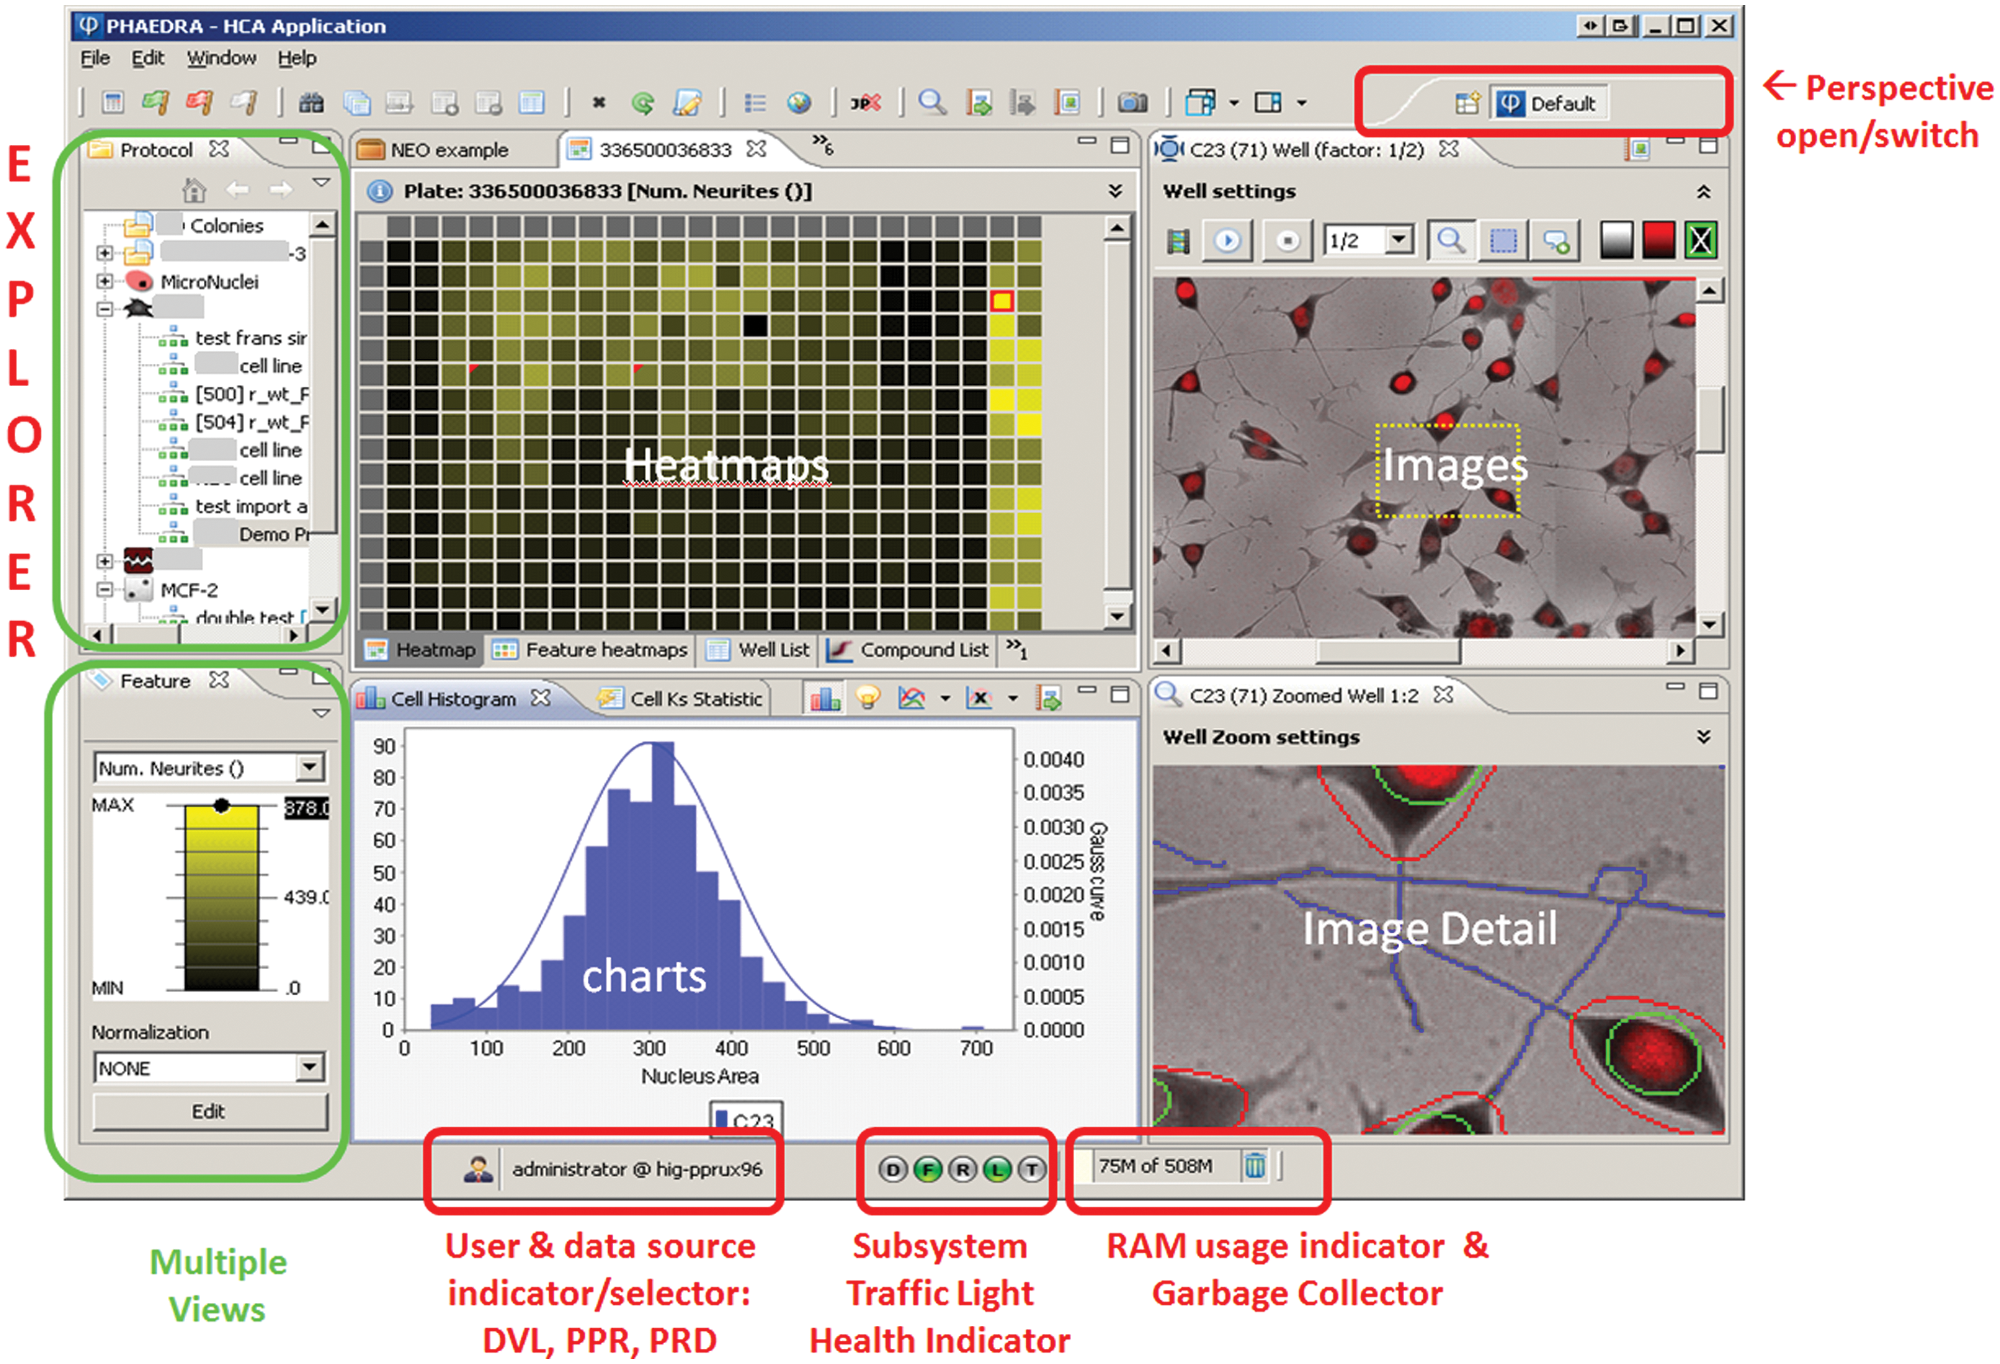
Phaedra graphical user interface general look and feel. In the Eclipse RCP environment, a perspective is an assembly of views. There are 12 predefined perspectives, but users can assemble and save their own. Here, the default perspective is shown. Users can open any number of perspectives and switch between them. From the explorer view (top left), the user can drill down from protocols to experiments, plates, well and cell data, and images.
Software Components
Maximal reuse was made of open source libraries.
Although standard charts are based on Jfreechart, more sophisticated graphs are produced by an integrated R pool available via the RJ-Servi interface. This allows any R script to be executed from within the Phaedra environment. For power users, the Eclipse-based R interface StatET is provided as an integrated Phaedra perspective. Matlab scripts can be run using the free Matlab Common Runtime or MCR (MathWorks, Natick, MA).
In Phaedra and in Matlab, reading images is done using the LOCI BioFormats library. This allows us to read 120 file formats, including OME-TIFF, OME-XML, and those generated by widely used HCS imagers and microscopes.
The KNIME data-mining environment is integrated into Phaedra as a perspective. The execution of R scripts from within KNIME uses an integration made by the Max Planck Institute of Molecular Cell Biology and Genetics. We modified this implementation to use RServi instead of Rserve. Rgg is used to automatically create a Java GUI for the script parameters. 25
For subpopulation gating of flow cytometric and image-derived multivariate data, we used FaceJava, an implementation of the ISAC gating-ML standard that we use to store the gate definitions. JPEG2000 libraries from Aware, Inc. (Bedford, MA) are used for image compression and viewing components. Other JP2 implementations are OpenJpeg and Kakadu.
Results
Software and Data Architecture
Phaedra is protocol oriented. Before data can be loaded into the system, a protocol class must be created and configured through the GUI. Here, the cell- and well-level features are defined, together with the way raw and overlay images will be analyzed, compressed, and imported. Per feature, the well types used for low and high controls can be defined, together with attributes for presentation, curve fitting, and normalization
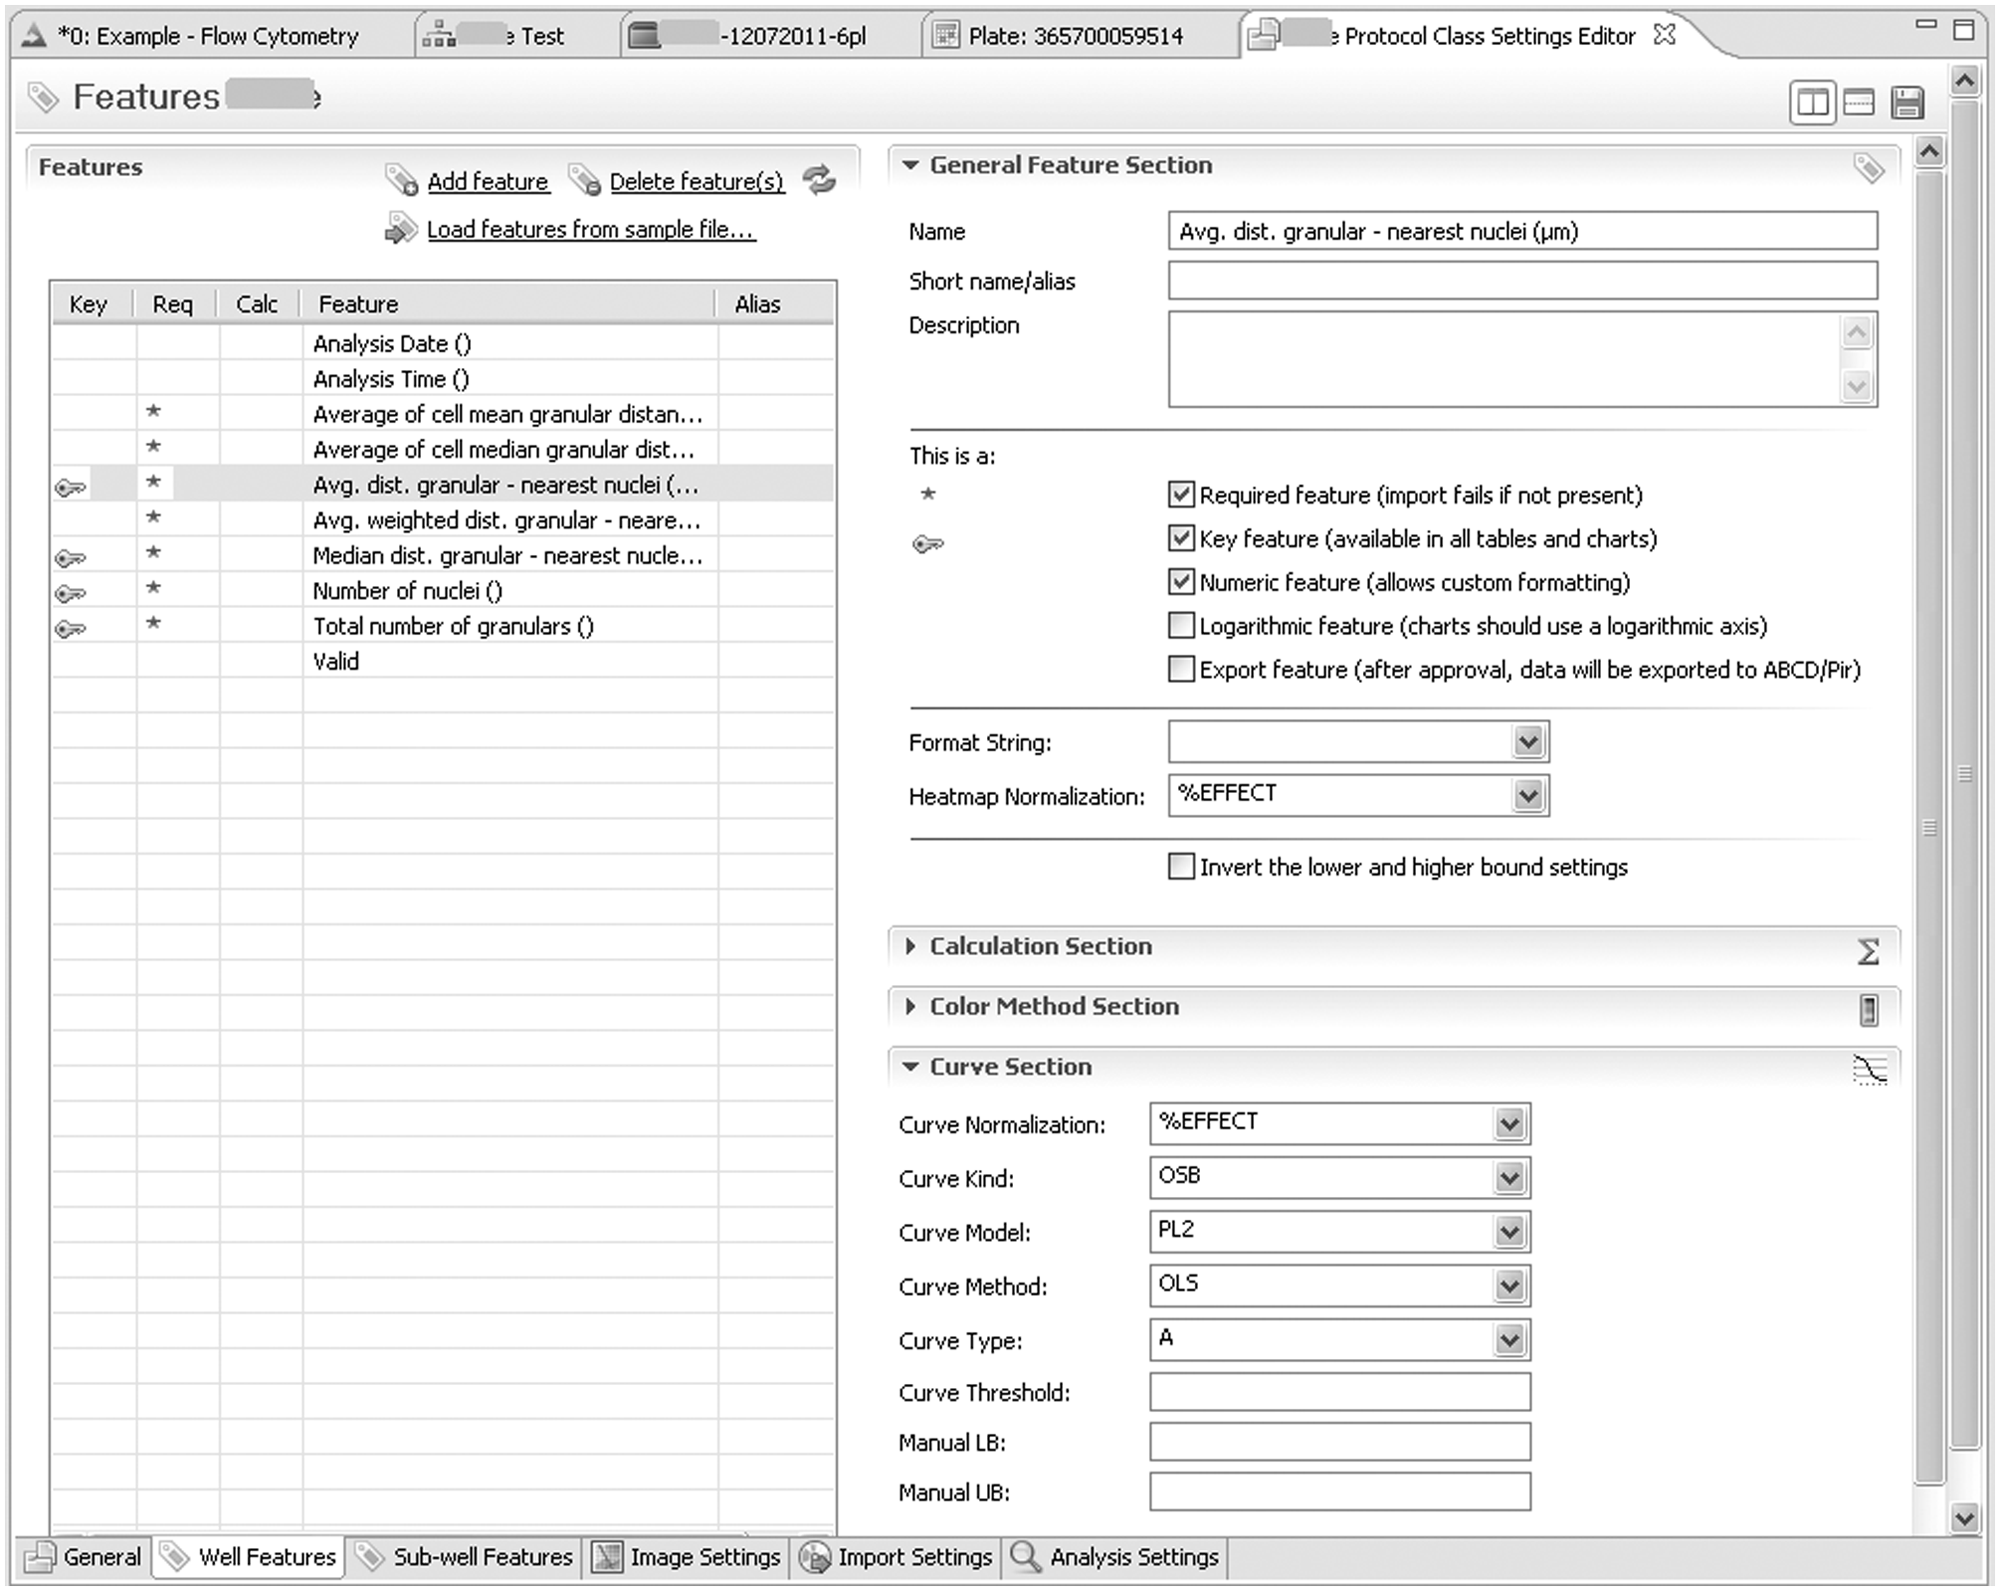
1) Creation and editing of protocols. In the Protocol Explorer pane (left pane in Fig.1), a context menu is used by an administrator or manager to create a new protocol or edit an existing one. As shown here in the lower tab section of the Protocol Class Settings Editor, six groups of settings are available: The general Tab defines name, ID, description, the source system for plate layout information, the well types used as low/high controls, and the access rights. The (currently selected) Well Features tab contains normalization settings for each feature, a script for calculated features, the type and color of the default LUT, and the fitting settings. Sub-well tab settings are for cell-level data and kinetics. Image Settings define default zoom and gamma settings and, for each channel or layer, the default visibility, transparency, contrast, and color mask. Import Settings define file (name) parsing rules and JP2 compression settings. In the Analysis tab, the default parameters for the algorithm are defined.
The data hierarchy is straightforward: Protocol Classes define Protocols that have Experiments, which contain Plates. The plates have Wells, to which well data are associated, which may result from aggregation of sub-well data. The sub-well data can be cell-level data or kinetic data. Data may be derived from images, which are also associated with the wells, but they can also result from FCM. The user can explore data at all levels and attach annotation marks, down to the cell level.
Phaedra also supports the project as a virtual cross-protocol assembly of the previous elements. Projects can be dynamically defined by any user, although supervisors can freeze a specific project definition that is shared by several users.
Image Analysis and Import
Phaedra has a combined image analysis and import perspective. There, the user selects experiment folders containing the images of one or more plates, indicates the target protocol, and, if necessary, adjusts analysis settings. If the images have already been analyzed, cell- and well-level data can be imported together with the images. Phaedra supports several third-party image analysis file formats.
For complex image analysis, such as required for 3D cell culture assays, algorithms are interactively prototyped in Matlab using the IPT toolbox or other available libraries. Cell or kinetic data are calculated, and well-level aggregations are performed. When distributed with Phaedra, Matlab algorithms run on the freely available, embedded Matlab Compiler Runtime (MCR). Analysis parameter defaults are set during the protocol definition (see above) and exposed when the analysis/import perspective is initiated. Image analysis is executed by a multithreaded process that runs in the background while the user continues other work. On machines with multiple CPU cores, the number of cores used for image analysis can be configured.
During import, the images are compressed, as described in the next paragraph, and combined with overlays produced by the image analysis, such as cell and nucleus outlines. The images are then stored on the file server as JPX files. When analysis/import is finished, the plate layout data, which specify the well types, compounds, and concentrations, are imported from a database as defined in the protocol settings.
Image Compression and Visualization
JPEG2000 technology offers superior image compression rates without blocking artifacts. Both lossy and lossless compression are supported. If it is assumed that the images will not need to be reanalyzed, lossy compression can be used. The best possible level of compression, while avoiding visual artifacts, depends on the assay. It can accordingly be adjusted for a protocol class.
Compression not only saves disk space but also makes access to the images faster. At the time of writing, Phaedra has about 200 GB of compressed image data stored. Based on an average compression factor of 15 to 20, this represents 3 TB raw, uncompressed image data. Our LAN download speed is approximately 7 MB/s of compressed data, representing about 100 MB after decompression. For a typical full-size well image (three color channels of eight-bit images, 4000 × 4000 pixels), the download, multithreaded decompression, and assembly take about a second on quad-core workstations.
Because of the way data are stored in the JPEG2000 file format, creating a 1:10 thumbnail image is equivalent to reading the first 10% bytes from the file. This implies we do not have to store reduced-resolution images: arbitrary-sized thumbnails can be generated on the fly. A supplementary benefit is offered by the JPX multifile format, which is used to store all images from all wells of a plate. Indexed access to individual well images in JPX is flexible and fast. Because we need to open only a single file, file server caching combined with the fact that compressed data are sent over the network allows real-time multithreaded generation of all well thumbnails for a whole plate. For example, 1/16 resolution thumbnails of 96 wells can be visualized in the actual plate layout in about a second. One can zoom in on the plate thumbnail collection up to actual image size or specify any combination of channels to construct the plate thumbnail representation. Because all views and editors are bidirectionally linked, clicking a well in a feature heat map or in an image thumbnail will highlight the well features in the well-list view and show the complete image ( Fig. 1 ).
Data Calculation, Quality Control Review, and Export
Most HCA image analysis routines aggregate the descriptive parameter values for single cells to feature values that are reported at well level. Subsequent analysis can combine several features into a calculated feature that is thought to be representative of a biological effect, for example, by combining morphological parameters into a toxicity score. In Phaedra, this can be done using KNIME workflows (see below), but there also is an integrated Javascript functionality that supports simple calculations.
The protocol defines the control well types that are used to perform normalization of well features and also specifies how to fit the concentration-response curves using a set of routines implemented in R. In the quality control process, multiple data and image views can be accessed to help the user filter out individual wells or plates that do not meet acceptable standards. Wells can be rejected according to protocol-specific rules or interactively from within multiple visualizations, including a plate heat map, a well list, or a compound curve displaying individual points (
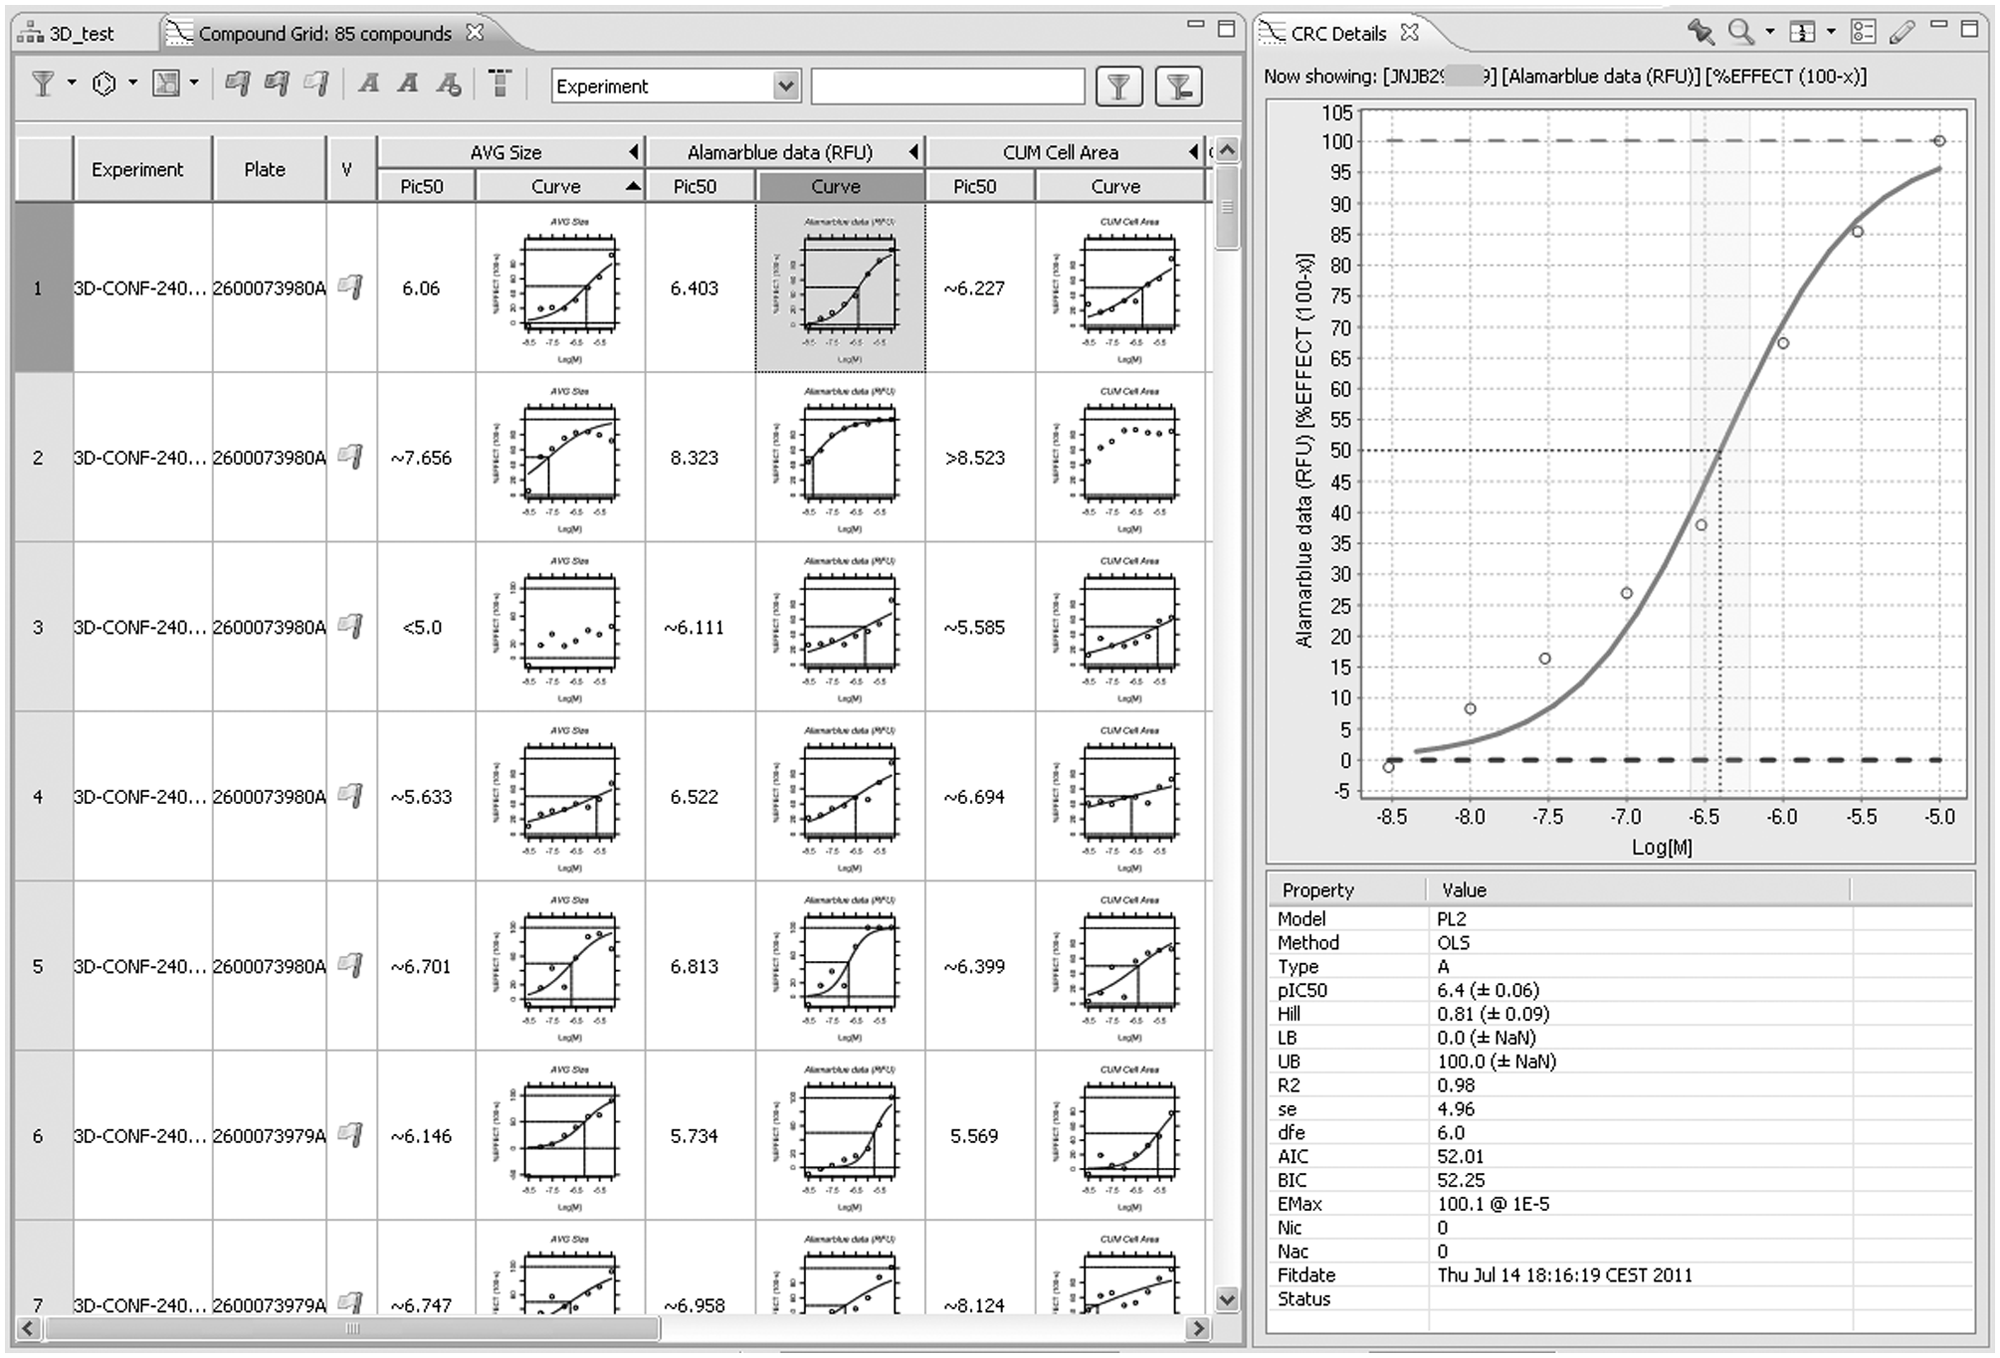
Curve fitting. Fitting is performed automatically when data have been imported and linked with compound information. From experiment or plate lists, an arbitrary selection can be made and fits for all compounds/feature combinations shown in the compound grid. (Compound columns were hidden.) Clicking on a curve will show curve and fit details (right pane). In this plot, individual points can be rejected, triggering refitting. After validation of a compound row, information is uploaded to data warehouses. Curve fitting is done using R, making it easy to integrate other fitting models.
Cell Subpopulation and FCM Analysis via KNIME Integration
Both high-content imaging and FCM generate data at the cell level (e.g., indications of morphology and total intensity of each individual cell). High-throughput FCM poses similar data analysis problems as HCS, especially if multiple labels or stains are used, for example, to analyze subpopulations of immune cells in PBMC samples. In both cases, measurements are executed at well level, but there is a need to perform calculations that compare the cellular populations at the single-cell level in different wells of a plate or a screen.
Many image analysis software packages process individual wells, or even image fields within a well, in isolation. This is usually sufficient as long as one can presume that all cells in the well are part of a single population, derive aggregate statistics, and compare these. It becomes problematic when several subpopulations are present, in ratios varying from well to well. In its simplest form, the problem has only one parameter. For example, in a cell migration or 3D invasion assay, we may observe a small fraction of motile cells amidst a large population of static cells. In that case, overall statistics may have a poor signal-to-noise ratio, leading to poor assay sensitivity, but isolating the motile cells based on pooling cell-level data of all control wells can greatly improve assay performance. In its more advanced form, a data set containing tens or hundreds of parameters per cell can be explored to discover unknown phenotypes in a complex cell population. This can no longer be achieved by applying simple intrawell criteria and requires advanced data analysis techniques.
In Phaedra, KNIME is used to define population analysis workflows. These can be started by making any selection of experiments, plates, or wells and executing a context action. The framework permits an easy definition of new analysis workflows; they are stored on the file server and can be made available to the user immediately, without having to publish a software update. Traditional cytometry techniques are supported, including the semi-interactive gating of cell populations, by combinations of range, quad, and polygonal gates. The advantage of the workflow mechanism then mostly resides in its ability to automate very specific processing of large data sets. But we can also take image and polychromatic flow cytometry analysis a step further by offering automatic clustering or principal component analysis. 14 Combining this with interactive visualization allows users to gain more insight in complex multivariate phenomena.
FCM data can be supplied as FCS3.1 files (one file per well). Most flow cytometers generate files in the FCS data standard defined by ISAC, which since version 3.1 also includes plate coordinate information for screening experiments. FCM data can also be supplied to Phaedra as comma separated value (CSV) files.
KNIME nodes were created to process ACS and FCS files (both ISAC standards), apply the necessary data transformations such as hyperlog and logicle transformations
27
and gating to classify cells, and report subpopulation statistics as well-level features into the database. Cell classes are represented as bit patterns that are attached to cells, so that in Phaedra graphs, subpopulations can be distinguished by colors and labels as defined in the protocol. The multigate classification paradigms used in FCM can just as well be applied on image-derived multivariate cell data. An example of an FCM workflow is shown in
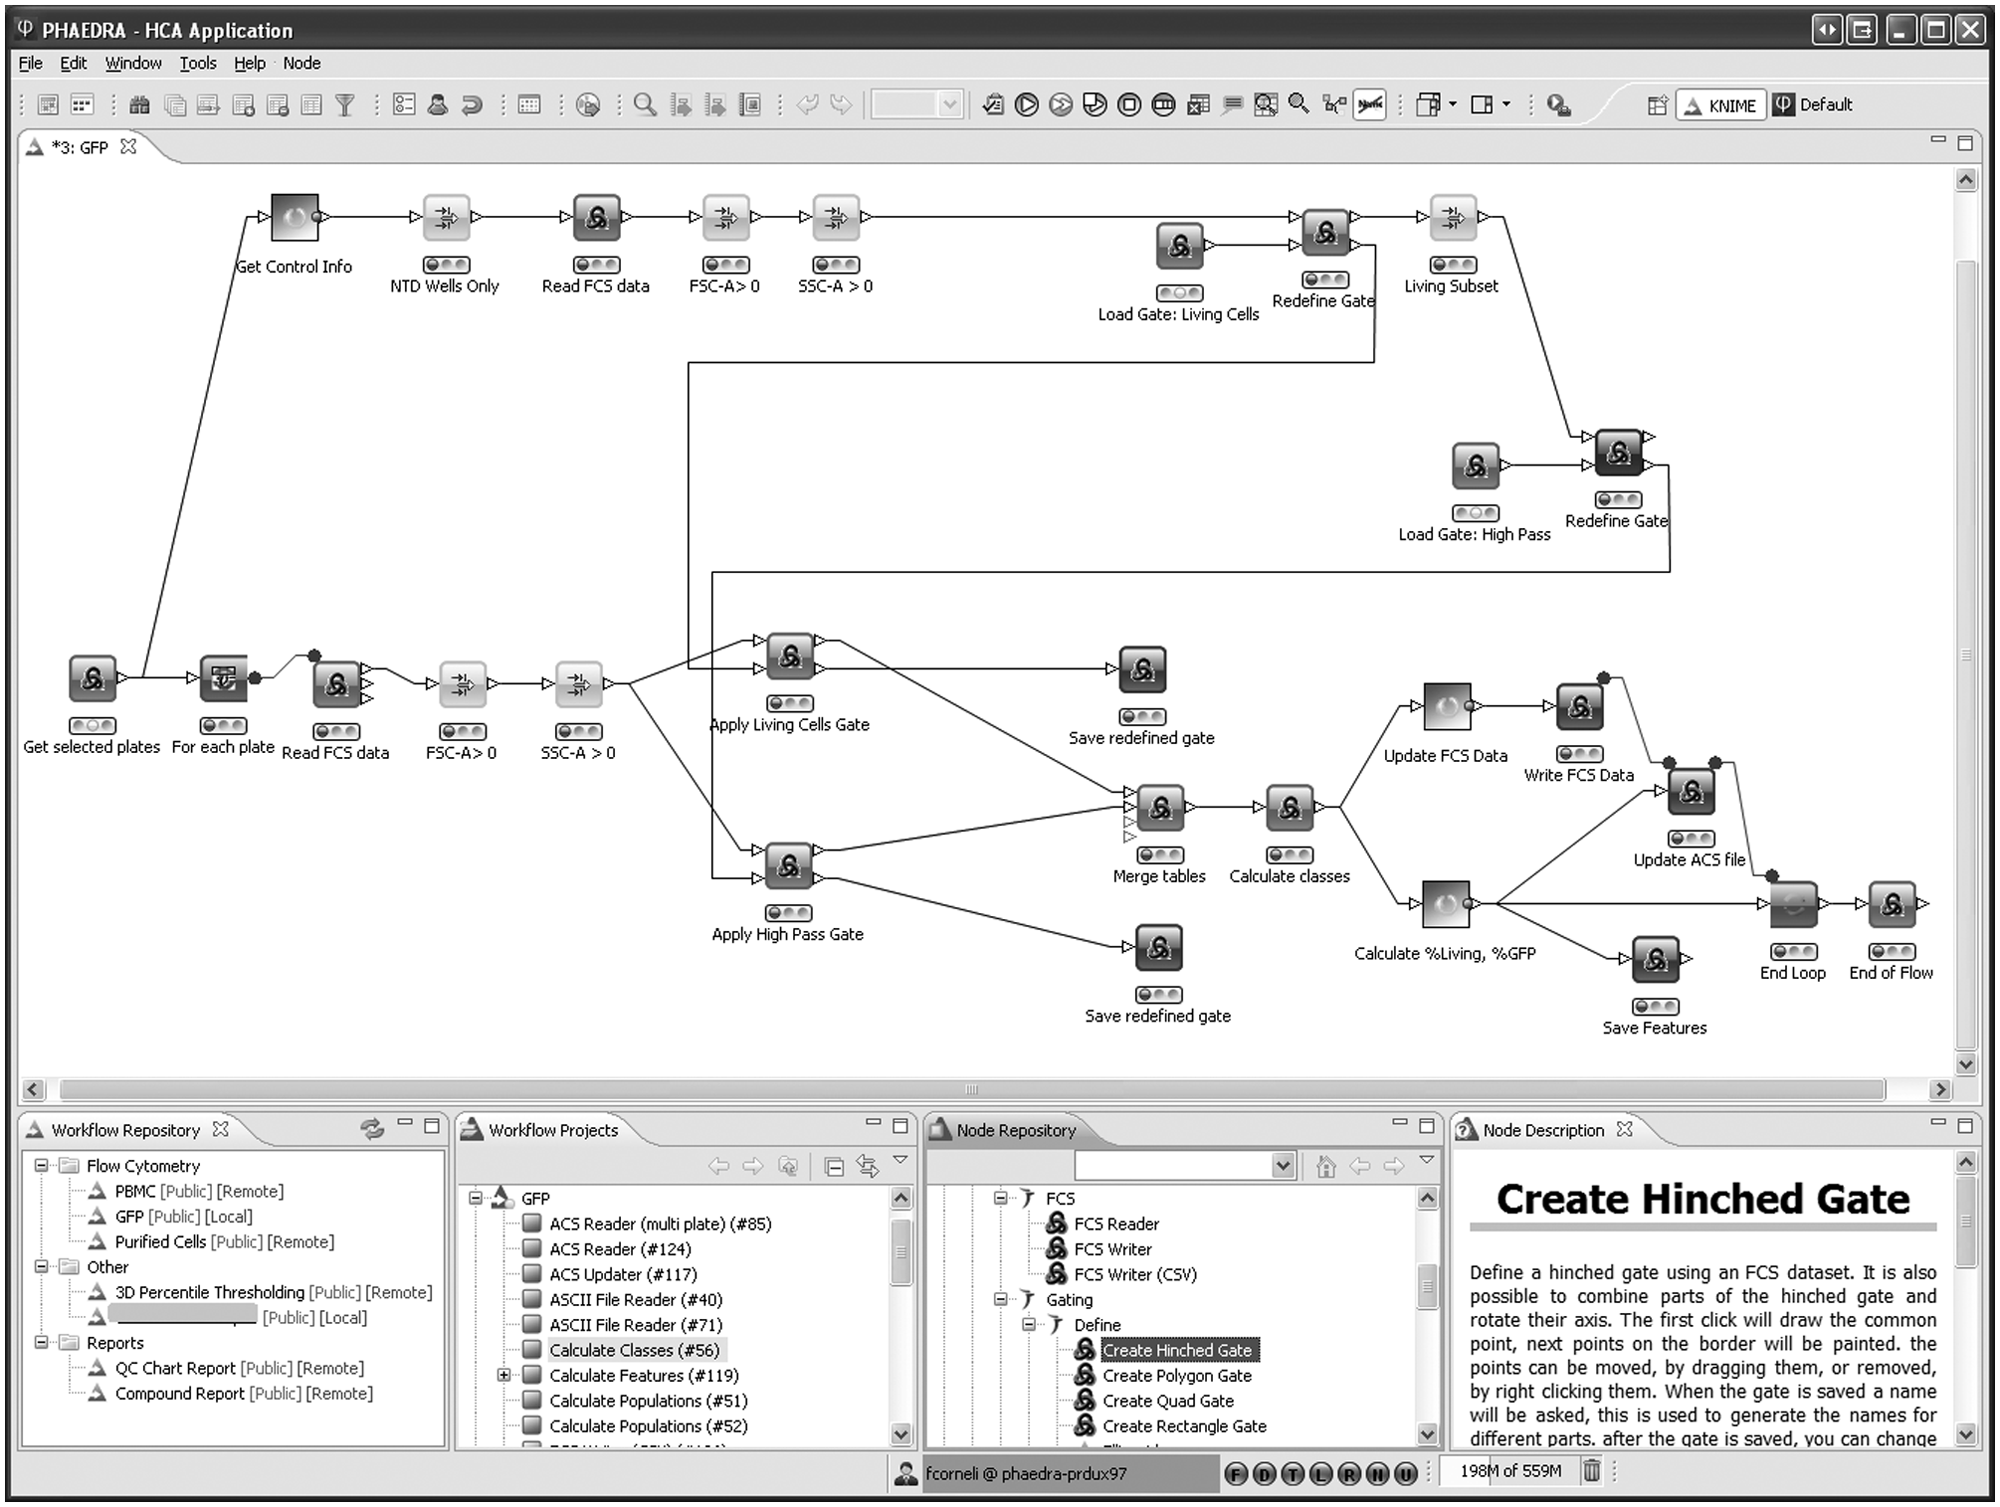
Flow cytometry workflow example. From the default perspective in Phaedra, a number of plates is selected and passed to the workflow. In the upper part, all control wells are selected, and their data are pooled. The default FSC-SSC polygon gate around the living cells is read and shown to the user, who can adapt it if needed. The gate indicating the range of GFP-positive cells is handled in a similar way. Both adapted gates are used in the loop over all wells of all plates. Finally, all individual cell class memberships and aggregated well-level results are stored.
Gates can be defined interactively in Phaedra workflows ( Fig. 5 ). Initially, “create gate” nodes are used once to define default gates for the protocol. The corresponding gating-ML files are stored on the Phaedra file server. In the first analysis of an experiment (one or more plates), a “redefine gate” node reads in the protocol-default gates and allows the user to adapt them to the current situation. The redefined gating-ML files are stored together with result data of each plate. When a single plate is reanalyzed, the experiment-specific gate will be opened in the “redefine gate” node, and the adapted plate-specific gate is again saved with the plate results.
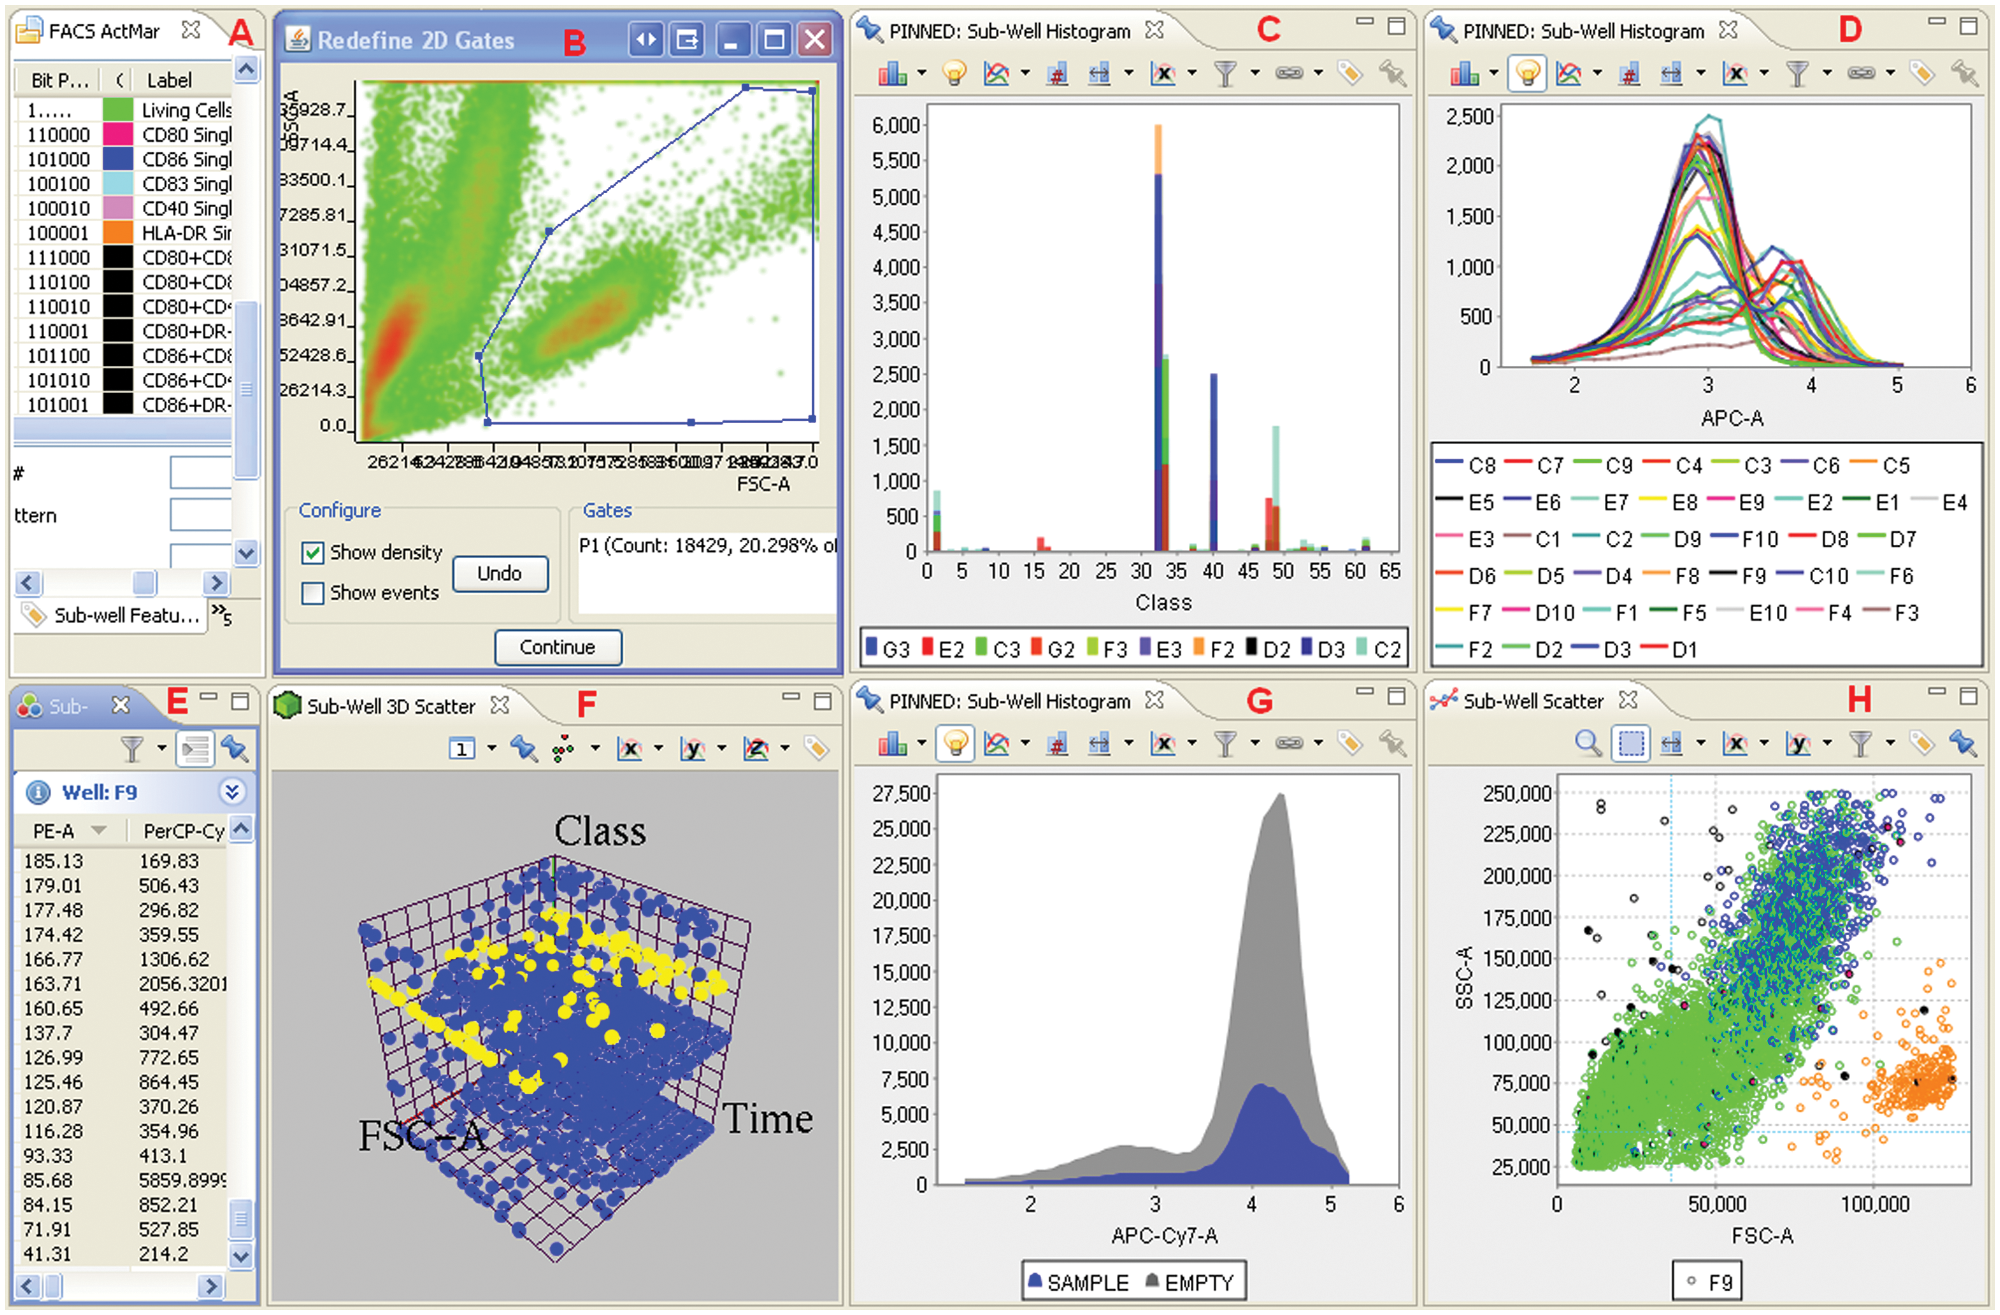
Flow cytometry data analysis and evaluation example. In this Phaedra screenshot, (
Discussion
Before starting this project, we reviewed existing HCS applications, and although there were several solutions on the market at that time, there were none that really met our needs.
The in-house development effort was undertaken by an Informatics Center of Excellence team and aimed to create a unified solution allowing different R&D teams to share a common data analysis platform compatible with a broad spectrum of applications, assays, instrument software, and hardware. This is a task of considerable magnitude, but rapid progress could be made using an agile development strategy supported by the presence of comprehensive IT and business knowledge in the team.
Phaedra was developed mainly on the basis of open-source components. The Java, Eclipse/RCP, and R biotope was chosen because the basis of the platform is freely available and has shown robustness, high level of activity, and importance in the computing world. 28 Its ability to integrate a wide range of data and data sources and a wide range of visualization options in a single application has proven to be of great benefit.
The term high-content analysis is often taken to signify specific imaging- and image analysis–based methods. In practice, however, HCA can include all types of multivariate data. That includes data generated by FCM but may also be extended to (for example) label-free cellular assays, broadening the requirements for an HCA software solution. Technology innovators may be driven to optimize a single platform, but research teams strive to gain optimal insight into biology by using a palette of technologies. The integrated analysis of data from such diverse sources is a challenge that hampers the creation of a “one size fits all” package for HCA.
Another bottleneck is the use of nonexchangeable data formats. It has long been regretted that there is no widely accepted standard for HCS data.1,29 This creates practical problems for laboratories with diverse instruments and hampers comparison of scientific data sets. Although standardization efforts are ongoing (e.g., by ISAC), there is not yet a consensus about what the standards should comprise. Software interoperability is an important consideration for many users and vendors, but other factors are the need to exchange or publish complete data sets and measure reproducibility of experiments done on different platforms. The discipline is still evolving rapidly, and user requirements are not yet stable. A number of links to sites discussing HCS standards is presented in
But in addition to that issue, Phaedra is an LIMS-integrated HCS tool, implying a need to interface directly with a number of in-house developed, proprietary databases and warehouses. Phaedra is primarily an HCS data management and analysis tool. Designing software that incorporates open standards where possible and extending or tuning it where necessary is not only a viable approach but also is perhaps the only feasible one if so many different sources of information must be incorporated. 29 It is interesting to note that some other drug companies have also recently constructed their own HCA application. 30
Diversity of need goes beyond supporting various instruments and file formats: users also vary greatly in their data-processing needs and skills. Phaedra has been used to support experiments involving 3D tumor invasion and colony growth assays for oncology (
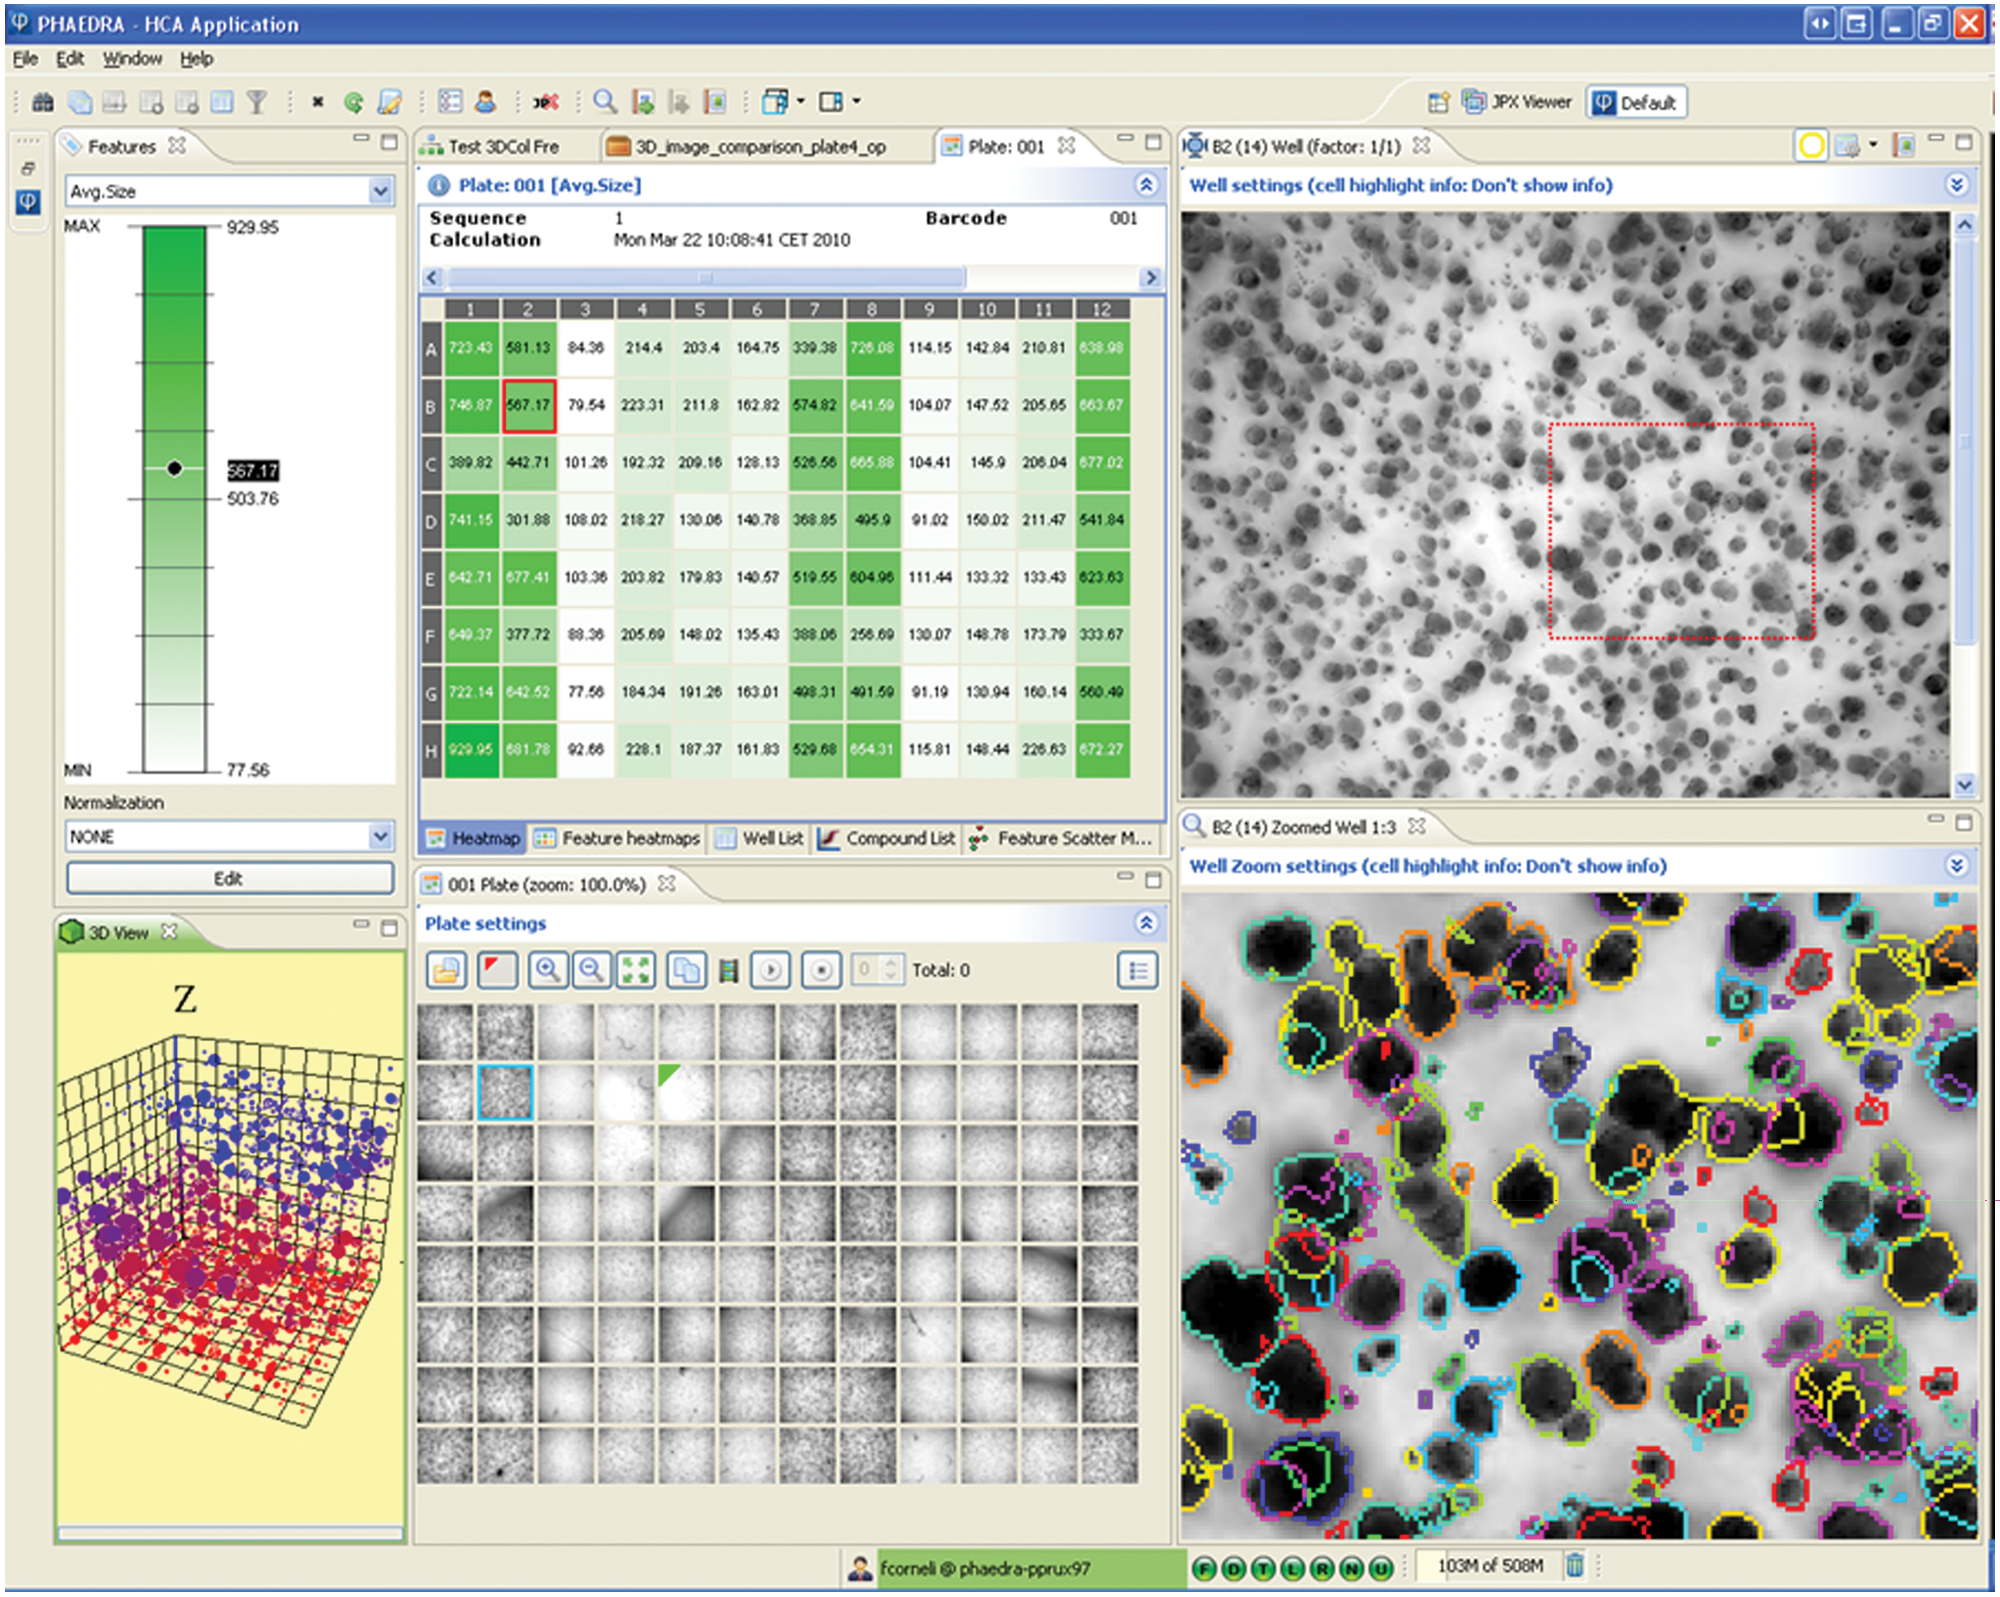
Three-dimensional tumor colonies example. Tumor colony growth is measured in 3D images. Heatmap labels show well mean colony size. Well thumbnail images are shown in plate layout, revealing preparation and acquisition artifacts. A maximum-intensity projection image from the selected well is presented (top right) together with a zoomed section where the projected colony outlines are shown as color overlays. Three-dimensional position and size of the colonies can be viewed in the interactive 3D scatterplot (lower left). The z-position is color coded. The view can be rotated in real time. Selected cells will be highlighted in the images and cell data lists and vice versa.
For expert users, powerful statistical tools such as KNIME, StatET, and R have been embedded to enable, for example, subpopulation analysis with interactive gating or machine learning and data mining. But routine users can configure Phaedra to execute predefined workflows or show only visualization components (perspectives) they need for a specific assay or role. Next to that, about 150 user preference settings are available.
Other distinguishing features of Phaedra are the integrated image analysis, the use of JPEG2000 technology, labeling subcell population classes and FCM analysis, bidirectional drill down from curve to individual cells ( Fig. 7 ), and integration of several extensive data-mining tools.
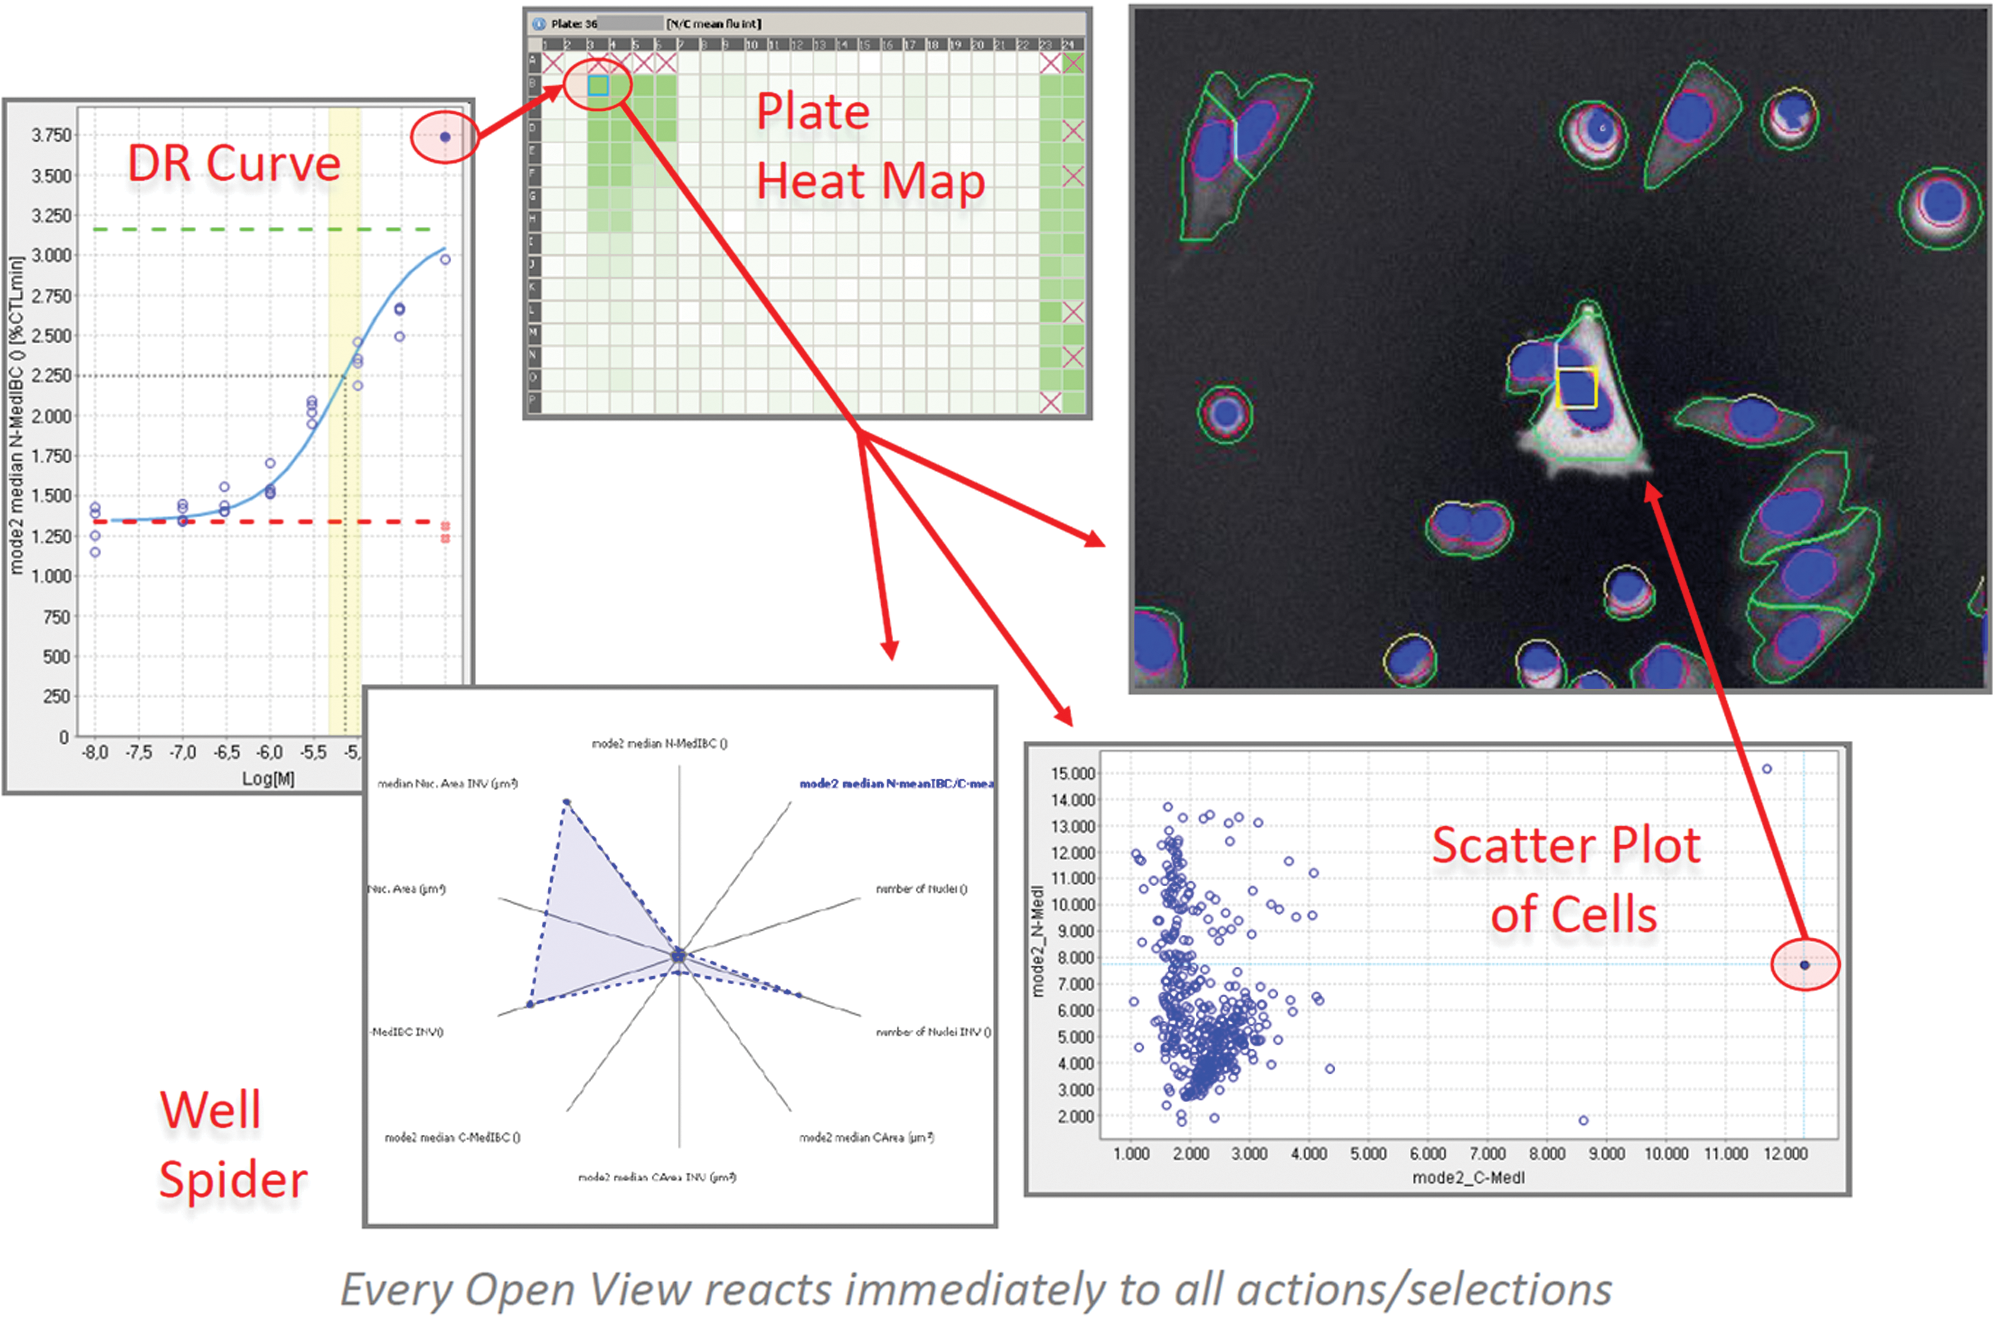
Bidirectional drill down. In Phaedra, open views react instantaneously to all actions and selections in other views. Thus, bidirectional drill down is possible from a point on any feature curve down to an individual cell in an image and vice versa.
Ongoing developments include cross-protocol data views based on pivot tables. Improvements could be made in the way subwell data are stored. Currently, we use a human-readable CSV file format that can be opened by any text editor but is not well suited to updating or storing hierarchically structured information. SDCubes, combining XML with the efficient binary HDF5 format, seems a promising alternative. 31
A wizard is included to define layout (well types, compounds, concentrations) of plates, so standalone operation is feasible for small-scale experiments. For large-scale screening, we link to systems that are specialized for such tasks. Having a robust, modular architecture and control over source code will allow us to evolve the application together with the needs of drug discovery. The goal of our investments in HCS is to create and support in vitro model systems with an improved relevance to the clinic, which can be used to discover differentiated candidate drugs with higher efficacy and improved safety. We are confident that Phaedra will prove a highly adaptable and powerful tool.
Footnotes
Acknowledgements
We are grateful for the tremendous efforts of Frederick Michielssen and Ari De Groot, without whom Phaedra would not have been realized.
The authors declared no potential conflicts of interest with respect to the research, authorship, and/or publication of this article.
The authors received no financial support for the research, authorship, and/or publication of this article.