
Abstract
Fragment-based drug discovery (FBDD) has come of age in the last decade with the FDA approval of four fragment-derived drugs. Biophysical methods are at the heart of hit discovery and validation in FBDD campaigns. The three most commonly used methods, thermal shift, surface plasmon resonance, and nuclear magnetic resonance, can be daunting for the novice user. We aim here to provide the nonexpert user of these methods with a summary of problems and challenges that might be faced, but also highlight the potential gains that each method can contribute to an FBDD project. While our view on FBDD is slightly biased toward enabling structure-guided drug discovery, most of the points we address in this review are also valid for non-structure-focused FBDD.
Introduction
Fragment-based drug discovery (FBDD) has established itself as a widely used target-based method in drug discovery.1,2 The central tenet of the method is the finding that successful small-molecule drugs are often characterized by high ligand efficiencies (LEs). 3 The LE of a drug against its target is defined as the free energy of binding to the target divided by the heavy-atom count of the drug. FBDD considers this fact by starting from very low-molecular-weight (MW) initial hits displaying high LE. Such starting points are usually found by screening libraries consisting of several thousand compounds typically with a MW of <300 Da—so-called fragments. Initial hits are characterized by low affinities (Kd > 10 µM) and hence require sensitive biophysical screening methods for detection. The low MW typically translates to a high LE, despite the low affinity. Maintaining the high LE of initial fragment hits is a key goal in the hit-to-lead and lead optimization stages of FBDD. Due to their small size, fragments are more likely to form high-quality interactions with their target, 4 which is central to the high LE values commonly observed with fragment hits. A corollary of this is the fact that smaller molecules can sample chemical space more efficiently. There are an estimated 106 to 1012 fragment-sized molecules 5 (compared with 1050 for molecules of <500 Da 6 ). Therefore, a library of a couple thousand fragments allows much better coverage of chemical space than a high-throughput screening library of several million compounds. The reduced effort required to establish and maintain a fragment library has made FBDD particularly interesting for smaller companies, and its proven track record has led to major pharmaceutical companies establishing their own FBDD groups.
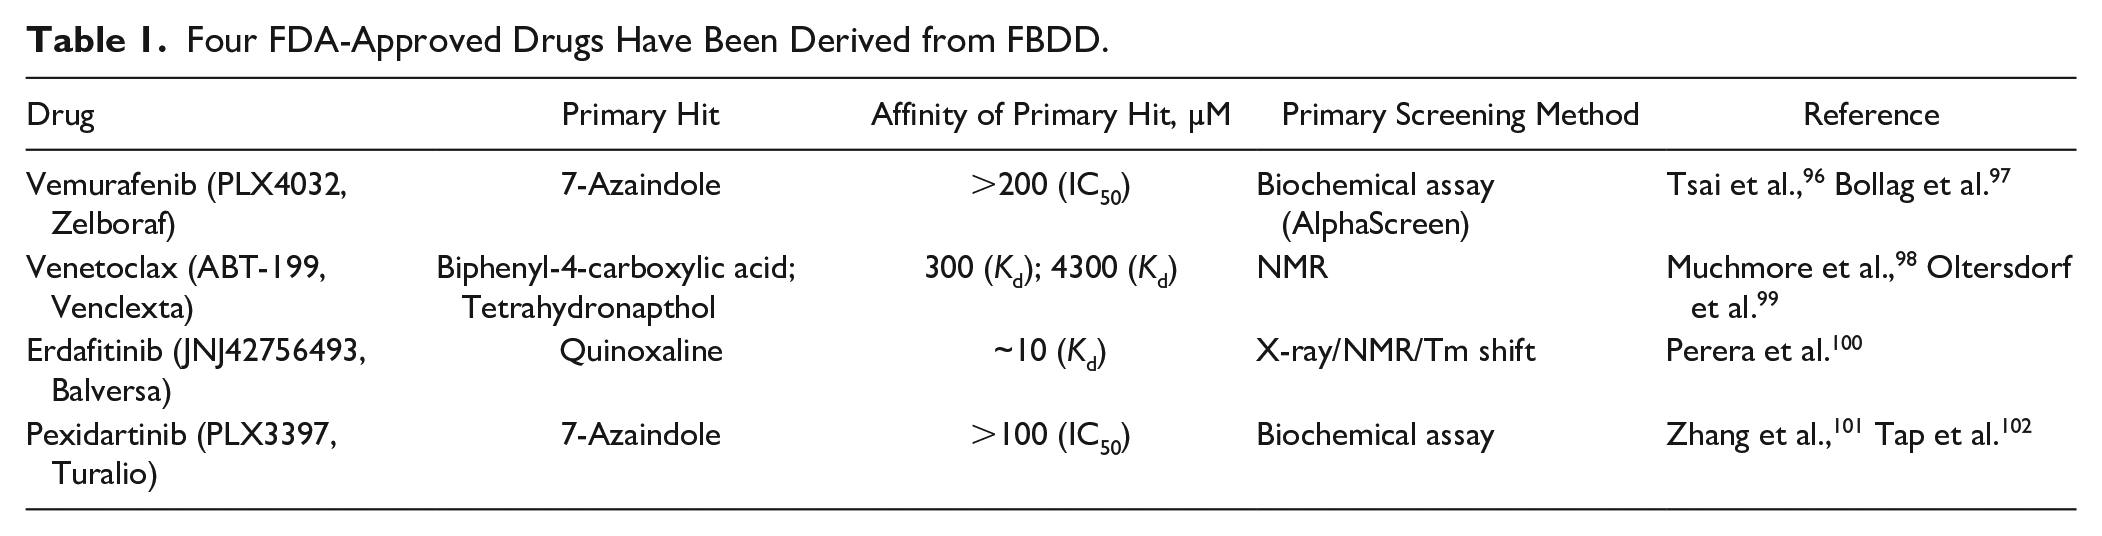
From its first description in the literature, 7 FBDD has matured into a successful approach for lead discovery and delivered four FDA-approved drugs ( Table 1 ).
Four FDA-Approved Drugs Have Been Derived from FBDD.
In our opinion, the strengths of FBDD are most efficiently harnessed in combination with structure-guided chemistry optimization strategies. Astex is extremely structure focused, to a degree that only targets with a structural system amenable to high-throughput crystallography are pursued. 8 It is, however, possible to employ FBDD methods in the absence of high-resolution structural information. A comprehensive review on this subject has recently been published. 9 This review will focus on a pipeline where one or several biophysical screening methods are used to feed a high-throughput structure determination method.
Currently, x-ray crystallography is the only structural biology technique that can be considered high-throughput. However, the spectacular recent advances in cryo-EM, in terms of resolution and sample-to-structure times, make this method seem the obvious candidate to join x-ray crystallography as a high-throughput structure determination technique. Nuclear magnetic resonance (NMR) is the third technique able to deliver atomic resolution structures, but it has never been able to compete with x-ray in terms of applicability and throughput. Promising NMR methods for simplified protocols to determine protein–ligand structures have been developed over the years, but we feel these methods are not being routinely used in the drug discovery industry. If not for structural elucidation purposes, NMR does, however, have its merit in the process of FBDD (see below).
As stated, biophysical techniques are extensively utilized in FBDD, from screening of fragment libraries through to hit validation and lead optimization. Although many reviews on the principles of biophysical techniques have been published,10,11 there is little describing the practical aspects of applying biophysical techniques to the problem of fragment-based screening (FBS), and less again on how to extract the most value from biophysical primary screening data. In this review, we hope to expose the reality of biophysical FBS in a useful fashion, aspiring to help the anxious biophysicist withstand the relentless unforeseen. We discuss three of the most widely utilized biophysical methods employed in FBS: NMR, surface plasmon resonance (SPR), and Tm shift. It is beyond the scope of this review to cover every aspect of each technique and every flavor of instrument and software. We instead focus on the more general and practical considerations of biophysical FBS.
Biophysics in Fragment Screening
The State of My Protein
Before a screening pipette is raised in earnest, one should get to know the enemy. Protein mass, oligomeric state, posttranslational modifications, oxidation state, level of heterogeneity, and the oft-forgotten binding of endogenous ligands should all be known. Liquid chromatography–mass spectrometry (LC-MS) and native mass spectrometry (native MS) can give insight into most of these criteria. Solution-based characterization is also highly important: size exclusion chromatography (SEC), multiangle light scattering (MALS), and analytical ultracentrifugation (AUC) can confirm the oligomeric solution state of proteins; protein NMR and Tm shift can give insight into the folded state of proteins; isothermal titration calorimetry (ITC) can provide invaluable protein quality control (QC) via the binding stoichiometry term (what fraction of my protein is competent for binding?) and the measured dissociation constant (Kd) (does in-house data tally with published values?).
Endogenous ligand binding to a protein target has been observed in-house several times. In each case the presence of the endogenous ligand was unexpected and only revealed by x-ray crystallography, native MS and ITC titrations exhibiting either weaker than expected Kd values, or complex multiphasic titrations. The presence of bound endogenous ligands at sites of interest will be problematic for most biophysical readouts and must be monitored carefully. With any new target, the authors strongly recommend performing an ITC titration if there is a good tool compound available, both to QC the protein and to provide a Kd benchmark for other techniques.
Tm Shift
Background
The thermal shift principle has been around for a long time, 12 but it is continually reemerging under a profusion of pseudonyms, for example, thermofluor, 13 thermal shift, Tm shift, and differential scanning fluorimetry (DSF). 14 The widespread appeal of Tm shift is due to the following:
Ease of setup—it can be run on most real-time PCR instruments.
Low cost of instruments and consumables.
High throughout—96- or 384-well formatting and ~1 h/plate.
Low protein consumption—typically a few milligrams per screen.
Relative ease of data analysis.
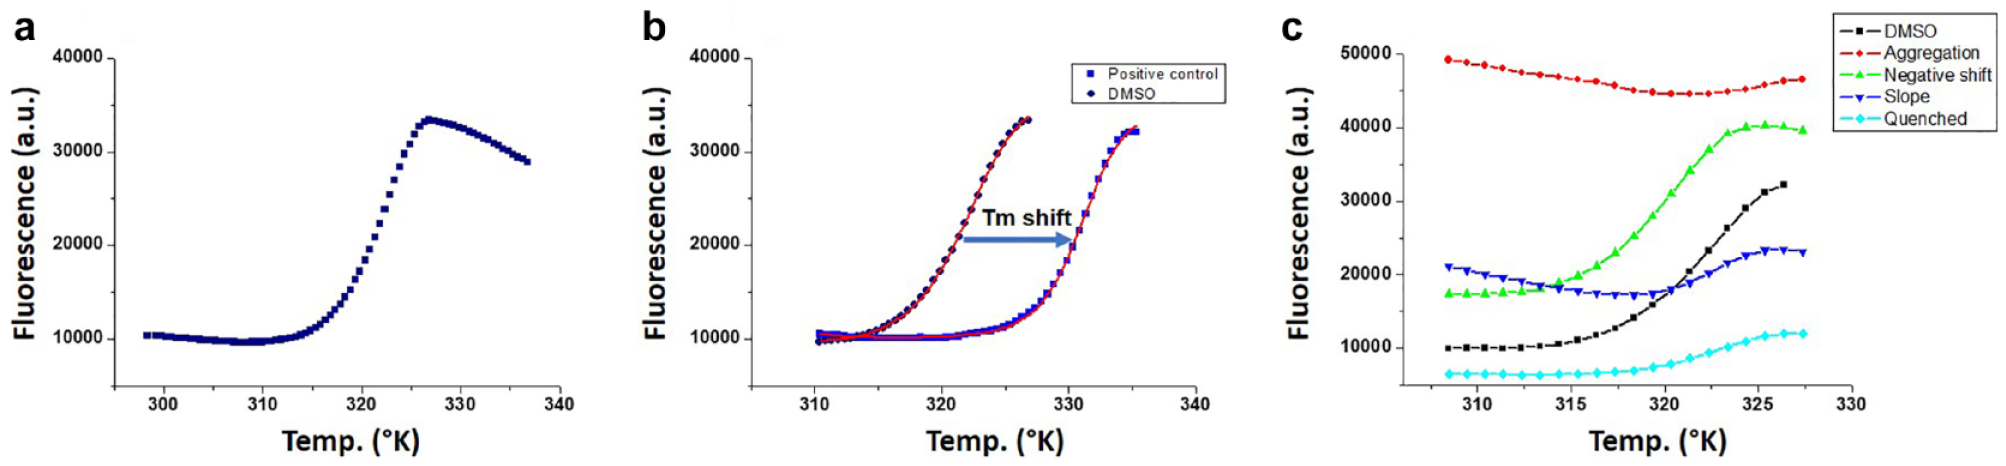
At its heart, Tm shift exploits the coupling of the protein denaturation equilibrium (Native ⇌ Denatured) with the ligand binding equilibrium (Protein + Ligand ⇌ Protein:Ligand). Protein thermal denaturation is often irreversible, and in most cases, protein aggregation ensues after some degree of thermal denaturation. Even so, most protein thermal denaturation curves exhibit a single sigmoidal transition, appearing two-state, despite not being true representations of reversible protein denaturation equilibria. Ideally, bona fide protein ligands that bind the native state of a protein will shift the entire thermal denaturation curve to the right, which is conveniently expressed as a shift in the melting temperature, or “Tm shift” (
(
Compound screening using Tm shift was first implemented using fluorescent dyes that preferentially bind partially or completely denatured states of proteins, 13 with Sypro Orange emerging as the most widely used fluorescent dye for Tm shift assays. 15 More recently, intrinsic tryptophan fluorescence has made a return to Tm shift buffer screens, 16 and the thermal shift principle has also been adapted to a cell-based readout and the issue of target engagement.17–21 The following section discusses Tm shift fragment screening monitored by Sypro Orange binding, but similar principles should apply to any fluorescent method that is used to monitor the thermal denaturation process.
Fragment Screening Using Tm Shift
Tm shift setup for fragment screening relies on first establishing conditions under which a clear denaturation transition can be observed and fitted. Specifically, one hopes to see well-fit replicates displaying low standard deviations in the fitted parameters. It is worth performing thermal denaturation experiments using other complementary methods, for example, far-UV circular dichroism (far-UV CD) or differential scanning calorimetry (DSC), to validate the apparent Tm observed using the fluorescent dye. Far-UV CD and DSC can also provide vital insights into more complex protein thermal denaturation events, for example, for multimeric proteins or intrinsically disordered proteins.
Exact plate layouts for Tm shift screening are at the discretion of the user, but care must be taken regarding cross-plate variation and edge effects. A rule of thumb at Astex is that for eight DMSO protein control replicates on a 96-well plate the standard deviation for the fitted Tm should be <0.2 °C and preferably <0.1 °C. It is also important to consider the overall shape of the thermal denaturation curve. Ideally, the predenaturation baseline should be linear, and the denaturation transition should be a single sigmoid (
In terms of buffer additives, it is worth remembering that fluorescent dyes used for Tm shift screening will readily interact and fluoresce in the presence of detergents. Even small amounts of detergent can compromise Tm shift experiments and are best avoided. A Tm shift method has been published for membrane proteins using covalent modification of cysteine residues with a coumarin dye. 22
As mentioned earlier, most proteins begin to aggregate upon thermal denaturation. The fluorescent signal for Sypro Orange-bound protein aggregates typically decreases after denaturation, giving the latter half of any thermogram a “horsetail” appearance (
Tool Compound Binding—Caveat Emptor
In an ideal world, every new drug target would arrive on the lab bench with a bona fide tool compound alongside it. Alas, this is not the case, and to make matters worse, the literature is strewn with compound binding artifacts.23–25 It is necessary, therefore, to maintain some degree of cynicism about literature reports of compound binding to one’s target of interest. It is good practice to keep a list of pan-assay interference compounds (PAINS)23,26 at hand and to be particularly wary of literature describing the discovery of compounds with neither direct binding nor structural support. One’s critical faculties should be especially heightened regarding the quality of any published biophysically derived Kd values, kinetics, or mechanisms of action. Many compounds seem ingeniously designed to confound the drug discovery process and catch out even the most vigilant scientist. 27
Small molecules, peptides, cofactors, substrates, products, and effectors can all be utilized as positive controls to illicit a ligand-dependent Tm shift. Ideally, the positive control replicates will show a significant thermal shift (>2 °C) and exhibit low standard deviations in the fitted parameters.
Fragment Screening Using Thermal Shift
With control data in place, the next concern is the compound screening concentration, which involves consideration of the fragment library complexity, the fragment library solubility, and the perceived ligandability of the target binding site. Gauging ligandability is an inexact science, and it can vary markedly even within a specific target class. In addition, novel chemotypes or mechanisms of action may be what are desired rather than yet another kinase hinge binder. Nevertheless, having some sense of the ligandability of a protein target binding site is important, as it is clear both empirically (>50 screens at Astex) and theoretically (degree of binding site occupancy required) that Tm shift fragment screens perform best on more ligandable target binding sites, that is, in situations where fragment Kd values are at the more potent end of the fragment affinity spectrum (<300 µM). In fact, an early screening stage Tm shift screen can provide a useful steer on how ligandable a new protein target is.28,29
The magnitude of a Tm shift is a function of the ligand concentration, the ligand Kd, the number of ligand binding sites, and the thermodynamics of both protein denaturation and ligand binding.29–32 Crucially, eliciting a ligand-dependent Tm shift requires an excess of ligand relative to the Kd, or in other words, the ligand binding site occupancy needs to be high. Thus, at a fragment screening concentration of 1 mM we might expect to achieve ~80% occupancy for fragment Kd values of <250 µM. Higher ligand concentrations are required to detect more weakly binding fragments. However, increasing the fragment library screening concentration will increase the number of fragments that are insoluble. This, in turn, will increase the number of fragments that will interfere with the Tm shift readout. It is therefore worth knowing the solubility of one’s fragment library and factoring this into what fragment concentrations will be used for a Tm screen. At Astex we typically run a Tm screen using fragment concentrations of 1, 2, and 5 mM.
Tm Shift Screening Output
The majority of thermograms from a Tm shift fragment screen should resemble the control data in terms of overall shape and goodness of fit. Clear artifacts can be immediately dismissed from further consideration, but invariably the quiddity of the screening process throws up an assortment of more troublesome thermograms (
Fragments that generate a negative Tm shift are perhaps the most insidious Tm screen curiosities. Something about the siren call of these protein destabilizers draws the ever-optimistic screener to see some meaning or value in them. We have never derived anything useful from negative Tm shifts, although there are cases (with the benefit of hindsight and/or orthogonal assays) where bona fide hits have been found that generate negative Tm shifts. 33 The rationale for negative Tm shifts is well described31,34 and often results from multiple weak binding events to the denatured or partially denatured state of a protein. In theory, certain fragments can bind to both the native and denatured conformations of a target protein, making the net Tm shift difficult to interpret. Screening pragmatism dictates that, at least for a Tm shift primary screen, fragments that generate negative Tm shifts are best dismissed without further consideration.
Thermograms that exhibit a high initial fluorescence that slopes downward before merging with the latter part of the genuine protein denaturation event. This type of thermogram can be fit to give an apparently positive Tm shift. In most cases this is a false positive produced by the foreshortening of the denaturation curve. There is a bit of a gray area depending on how close the initial sloping baseline approaches linearity prior to the thermal denaturation transition. A useful steer on the permissibility of such compounds is whether the peak of the denaturation transition is also right-shifted.
As for any fluorescence technique, there will be issues with compound-dependent fluorescence quenching. A multicolored DMSO screening plate will undoubtedly exhibit varying degrees of fluorescence quenching; however, some bona fide fragment hits can still be identified, particularly if the shape and fit of the thermograms are satisfactory.
Over the course of many in-house Tm shift fragment screens we have seen genuine fragment Tm shift values as large as ~7 °C for some particularly ligandable binding sites. A recent Tm shift screen identified several fragments that generated Tm shift values of ~15 °C. None of these big “shifters” were hits in any other method. Historically, in-house Tm shift values of >2 °C have translated well to x-ray and other biophysical methods. It is worth keeping in mind that protein thermal denaturation often proceeds via multiple intermediate states. The apparent two-state denaturation transition we hope for in Tm shift screening is often a gross simplification of the actual thermal denaturation process.
Grouping Tm Shift Hits
Tm shift fragment screening data are most usefully output as the ΔTm (Tm + Fragment – Average Tm of the DMSO controls). Although data fitting and ΔTm derivation are often automated, it is essential to manually inspect every denaturation curve; most data can be inspected in a cursory manner but flawed automated fits must be identified and more painstakingly analyzed. Thermograms that are compromised by compound aggregation or fluorescence interference can be quickly removed from further consideration, although it is worth monitoring how such fragments behave at different concentrations and across multiple target classes. Once the interfering data have been removed, there comes the issue of hit classification.
We typically group Tm shift hits into three classes, the boundaries of which depend on the spread of ΔTm values observed in the screen.
For more ligandable binding sites, the grouping of ΔTm values might be as follows:
>2.5 °C—strong hit.
1–2.5 °C—medium hit.
0.5–1 °C—weak hit.
For less ligandable binding sites, the grouping of ΔTm values might be as follows:
>1.5 °C—strong hit.
0.5–1 °C—medium hit.
0.2–0.5 °C—weak hit.
There are exceptions, as always, but the veracity of a Tm shift hit is strongly dependent on the magnitude of the ΔTm value. Another rule of thumb is the following:
1&x46;ΔTm > 2 °C—probably real and worth following up by other methods.
ΔTm = 1–2 °C—moderate chance of being real and might be worth following up.
ΔTm < 1 °C—most often a false positive, although occasionally a weak-affinity hit.
Rules of thumb aside, when pursuing a difficult or high-value protein target or when protein expression levels are low and no other technique is available, there can still be value in pursuing small ΔTm hits by x-ray crystallography and bioassay.
Tm Shift Data Analysis
Several data fitting methods are standard in the field of Tm shift data analysis.13,32,35–37 We feel that fitting protein thermal denaturation curves from a fragment screen are best undertaken using a physical two-state protein denaturation model and not the commonly utilized first derivative or some unfounded spline interpolation. Several versions of the protein thermal denaturation equation exist, all of which include terms for the initial/pre-/native fluorescence signal, the final/post-/denatured fluorescence signal, the midpoint of the thermal denaturation curve or Tm, and various forms of the free energy term for protein denaturation. Although the first derivative is a common way to derive the Tm, it tends to mask other problems in raw screening data, so plucking just the Tm from a first derivative peak is a dangerous game. Automated fitting routines can be configured, but as mentioned, the user must manually inspect all raw thermal denaturation curves and often manually refit individual thermal denaturation curves that need to have input ranges altered to improve the fit quality.
In summary, Tm shift is a generic method and binding site agnostic. It often requires little protein, little time, or little experience to set up and run—benefits that cannot be overstated and which distinguish Tm shift assays from every other FBS method. Most importantly, Tm shift assays can rapidly deliver fragment hits on target proteins with more ligandable binding sites.
Surface Plasmon Resonance
Modern biophysics instrumentation and software have become increasingly user-friendly, leading to a generation of users who can “do” a technique but who are not completely clear about how the instrument functions or the extent of raw data manipulation that is acceptable or meaningful. SPR is particularly user-friendly and particularly prone to artifact, overinterpretation, and varying degrees of frustration, especially in the area of FBS.
Anyone who has attended an SPR conference will have noticed that the SPR users at the antibody end of the SPR spectrum are a lot more “data happy” than those of us lurking in the long grass of SPR fragment screening. The data “unhappiness” of a typical SPR fragment screener is born out of a specific set of challenges: obtaining an immobilization method that provides a reasonable level of active protein, sorting the wheat from the chaff of a fragment screen, and dealing with linear fragment dose responses. Hope is provided, however, by some excellent SPR FBS screening publications38–44 and an exemplary guide to the aspiring SPR fragment screener. 45
Instrumentation
Biacore has dominated the SPR instrumentation field, and the Biacore T200 has been the workhorse instrument for many labs undertaking SPR fragment screens in the last decade. A slightly higher-sensitivity instrument, the Biacore S200, and the higher-throughput Biacore 8K continue to keep Biacore at the forefront of SPR FBS. Other SPR manufacturers, such as ForteBio, Sensiq, and Creoptix, also sell instruments that are aimed at the small-molecule/fragment screening market and are worth investigating. It is essential, however, to factor in the quality of customer technical support, service contracts, and the supply time for consumables when deciding which instrument to purchase. Most of the following SPR review sections are based on our in-house experience with a Biacore S200 and a Sensiq Pioneer, but we hope the guidelines will be relevant to any SPR instrument used for FBS.
Much has been written about the importance of maintenance and care required to get the most out of an SPR instrument.45–47 This cannot be overemphasized, and the reader is strongly advised to perform all proper maintenance checks and controls, particularly on a communal instrument, prior to running any real samples of interest.
Response Units and Signal
The operating principle of an SPR instrument and the physical basis of the raw SPR signal are well described elsewhere.48–50 Conventionally, SPR fragment screens have the protein target of interest immobilized onto a chip surface while the fragment library is injected serially over the chip surface. The magnitude of an SPR response is proportional to the MW of the interacting protein and compound; for example, if we have 3000 response units (RU) of an immobilized 45 kDa protein, we would expect a maximum signal of 10 RU for an interacting 150 Da fragment, assuming the binding site is saturated and the protein is 100% active on the chip surface.

Obviously, problems will arise if the protein MW increases and the percentage surface activity drops; for example, a 450 kDa protein that is 10% active will only give a 0.1 RU signal for a 150 Da fragment, which would be difficult to detect.

Most target proteins are in a more SPR-friendly MW range, and the sensitivity of most modern SPR machines means that, in principle, the low MW of fragments is not limiting their detection.
Immobilization
Protein immobilization is the first step of configuring an SPR fragment screen. Each individual protein target requires a unique set of immobilization conditions, the major variables being protein construct design, choice of immobilization chemistry, and choice of buffer components. Some targets will look good with little effort, while other targets may require many months of optimization or may never work at all. Many other biophysical techniques (NMR, ITC, and Tm shift) do not require so much up-front optimization for every target, which means that the SPR immobilization process can get frustrating, particularly as the process defies much rationalization. Instead, SPR immobilization requires a wholly systematic approach, and crucial to the immobilization effort is the availability of a tool compound; without a tool compound, one is running blind in a fragment screen.
Three major protein immobilization methods are utilized in SPR FBS:
NiNTA capture or NiNTA capture coupling. Histidine tags for SPR immobilization are typically longer than the standard six histidine tags used for protein purification purposes. Lengthening the histidine tag helps to minimize the extent of protein leaching from the NiNTA chip surface. The joint SPR/purification utility of the longer histidine tags is still convenient, and 6 + 6, 6 + 8, or 12 histidine tags have been shown to increase the avidity of histidine capture by NiNTA. 51 A poly-NINTA chip available from Xantec has also been claimed to increase the avidity of the histidine tag interaction. Combining histidine capture with standard amine coupling is a popular method for stable protein immobilization. Utilizing the histidine capture step provides a more uniform protein orientation on the chip surface than standard amine coupling and eliminates the need for the low-pH capture step.
Streptavidin capture immobilization requires biotinylation of the target protein, typically via a site-specific protein tag (AviTag), which is a substrate for the biotin ligase enzyme. Endogenous levels of AviTag biotinylation in E. coli can be very low but more than enough for efficient protein capture on a streptavidin chip surface. Co-expression of biotin ligase (BirA) with the target protein can provide higher levels of biotinylation within bacterial, insect cell, or mammalian expression systems, although this will not give effective biotinylation of secreted proteins. The AviTag sequence of a purified protein can also be biotinylated in vitro using a commercial biotin ligase kit or the purified biotin ligase enzyme.
Amine coupling via surface lysine residues or the N-terminal amine requires the target protein to get to the chip surface before the covalent immobilization reaction can take place. This is achieved by having the target protein at a pH below the isoelectric point, which can cause some proteins to aggregate or denature. N-terminal polylysine protein tags can help make amine coupling more uniform in protein orientation, in a similar way to histidine and biotin tags.
In our experience, the search for the most suitable immobilization conditions often necessitates trying all three immobilization methods. Protein tags can be combined in some protein constructs and should be tested at both the N- and C-termini. For screening purposes, it is vital to have a stable level of immobilized protein over the course of each screening run—hence the preference for capture coupling and the exploitation of the biotin–streptavidin affinity. A longer histidine tag may provide a sufficient level of surface stability, in the absence of covalent coupling, if users need the option to regenerate NiNTA chips. Usually, obtaining a reasonable level of immobilized protein (3000–10,000 RU) is straightforward by one or all the methods listed above. The thorny issue is how best to achieve a high level of surface activity, which we assess using a tool compound.
Tool Compound Binding and Surface Activity
It is vital that a well-validated tool compound is used to assess SPR immobilization trials. Well validated means that the compound solubility is known and the purported Kd/Ki/IC50 value has been confirmed in-house by ITC, NMR, microscale thermophoresis (MST), or bioassay. Ideally, the tool compound should also be structurally validated and engage the site of interest for the SPR fragment screen; validating one specific protein target binding site by SPR does not mean that any other protein binding site is SPR validated, although validating one site is clearly better than nothing. Access to bona fide fragment hits or weaker-affinity tool compounds is also useful, in order to get a sense for how well the immobilized protein setup copes with nonspecific binding (NSB) at higher ligand concentrations and how well SPR Kd estimates for fragments compare with other direct binding methods.
Assuming we have access to a validated tool compound, we can next consider surface activity, which is defined as

Having high surface activity seems intuitively beneficial both in terms of limiting the fraction of “dead” protein on the chip surface and in terms of attenuating the NSB problem by permitting the use of a lower level of immobilized protein.
We can backcalculate a value for the minimum immobilization level that is required based on (1) the lowest fragment MW, (2) the protein MW, (3) sensitivity of the instrument, and (4) the level of protein immobilization. Suppose we start with the assumption that we would like a 5 RU binding signal for a 150 Da fragment binding to a 45 kDa protein.

In real-life cases, however, it can be difficult to achieve such high levels of surface activity; activity levels <30% are not uncommon. In the above example, if we assume the surface activity is 10%, then, theoretically, we would need to immobilize 15,000 RU (not trivial) of our 45 kDa protein to see a 5 RU signal for a 150 Da fragment. Unfortunately, observing 10% activity at 1500 RU does not mean we will see 10% activity at 15,000 RU; the percent activity will almost certainly be lower at the higher immobilization level.
Protein construct design is often crucial for maximizing surface activity levels. In addition to testing multiple immobilization methods, it is worthwhile to assess the following:
Immobilization tags being on the N- and C-termini—consider the relative position of the binding site of interest to the immobilization tag.
The sequence and length of any spacer amino acid sequences between the immobilization tag and the target protein sequence.
Various length constructs, for example, full-length and individual domains.
Utilizing glutathione S-transferase (GST), maltose binding protein (MBP), or other fusion constructs to facilitate antibody-mediated immobilization.
Increasing the level of surface activity can be also be achieved through screening buffer components, for example, choice of pH, buffer, reducing agent, detergent, salt, and any relevant additives. Immobilizing a protein in the presence of a potent ligand can also improve surface activity.
It is not standard practice in the SPR field to publish the protein surface activity level for any reported SPR experiments, although it feels like an important piece of information when trying to gauge the credibility of reported affinity and kinetic values; for example, a Kd value reported from a surface that is 90% active is a lot more convincing than a Kd value reported from a surface that is 10% active.
Just as important as surface activity level is surface stability. It is essential to check, using repeated tool compound dose responses, that the surface activity level does not decline significantly over the time required for a screening plate run. A certain degree of surface activity decline can be accommodated in the data analysis of a screening run, but this is best kept to a minimum. Buffer optimization and lower temperatures can help preserve the surface activity levels of sensitive proteins. Ultimately, it is imperative to put in considerable effort in order to achieve a stable and high level of surface protein activity when assessing protein immobilization methods for SPR fragment screening.
Screening Concentration and NSB
Fundamental to the challenge of SPR fragment screening is the battle against NSB. The plague of NSB is a curious artifact of the relatively high compound concentrations required for FBS and for weaker-affinity Kd determination. Something about a protein-immobilized surface is irresistible to many compounds at a concentration above ~100 µM, which can give rise to an NSB signal that is often linear with increasing compound concentration (see “SPR Fragment Dose Responses”). The extent of NSB is dependent on the protein, the compound, the compound concentration, the protein immobilization level, and the immobilization method. Of these variables, we have some control over the protein immobilization level; however, the NSB problem is more readily attenuated by keeping the compound concentration low. A survey of published SPR FBS conditions42,52–54 reveals that many users are opting to screen at fragment concentrations of <300 µM in order to combat the problem of NSB. Although it might attenuate NSB, low-concentration SPR fragment screening limits the fragment binding affinity range that is detectable.
It is worth considering what fragment binding affinities we would expect to detect from an SPR FBS performed at a fragment concentration of 100 µM. If we assume that the screening raw data signal is only a function of the Kd value, then it becomes apparent that low-concentration SPR fragment screening will only succeed with the most ligandable target binding sites. Achieving 80% fractional occupancy at a screening concentration of 100 µM would require fragment Kd values to be <25 µM. Even at 50% fractional occupancy we are restricted to detecting Kd values of <100 µM. The question arises as to what fractional occupancy is worth following up in a fragment screen, especially when the picture is muddied by the inevitable chaff and artifact of an SPR screen (see “SPR Fragment Dose Responses”).
Certain library fragments will bind and dissociate slowly from certain immobilized protein surfaces, which means that the signal from subsequent fragment injections is compromised. This phenomenon is attenuated by performing a “clean screen” in order to identify and remove such fragments from an SPR fragment screening library. Problem fragments will be immobilization surface and protein specific, so it is recommended to run a clean screen for each new target, even if it means removing some hitherto bona fide fragment hits.
Since SPR chips contain multiple channels (typically three or four), it is possible to include a “reference” protein on one channel. 39 Selecting an appropriate reference protein is a tricky business and requires the availability of a positive control for the reference protein. Ideally, a reference protein should mimic the NSB liabilities of the target protein while having significantly weaker affinity for any fragments that specifically bind the target protein. Even if such a universal reference protein existed, it is hard to calculate the real value in knowing whether certain library fragments bind to it or not, and how that should inform the user on what is happening with the real protein target. At Astex, we have yet to employ a reference protein during a fragment screen. We have run very different target proteins in parallel on the same chip and can see the value of running variants of certain proteins in parallel, for example, clinically relevant mutations, selectivity targets, or domain deletions from multidomain targets. But caution is clearly required when drawing conclusions from screening data with reference proteins or with multiple proteins run in parallel.
SPR Screening Configuration and Output
The theory, process, and configuration of any SPR FBS are lucidly and generously explained in the excellent review by Giannetti. 45 This publication should be the first piece of reading for anyone undertaking an SPR fragment screen, and users would do well to follow many of the guidelines.
Data analysis of SPR screening output follows a series of steps: solvent correction, blank subtraction, and normalization based on positive control data. It is essential to check that all the buffer blanks, the positive controls, and the solvent corrections are within the expected ranges. Typically, the final fragment RU signal is then output and compared with a theoretical Rmax signal calculated for each fragment to give a percentage or stoichiometry term; for example, a fragment with a theoretical Rmax of 10 RU and an observed screening response of 5 RU would be designated as 50% or as having a 0.5 stoichiometry. Next comes the prickly problem of binning data based on sensorgram amplitude and shape (
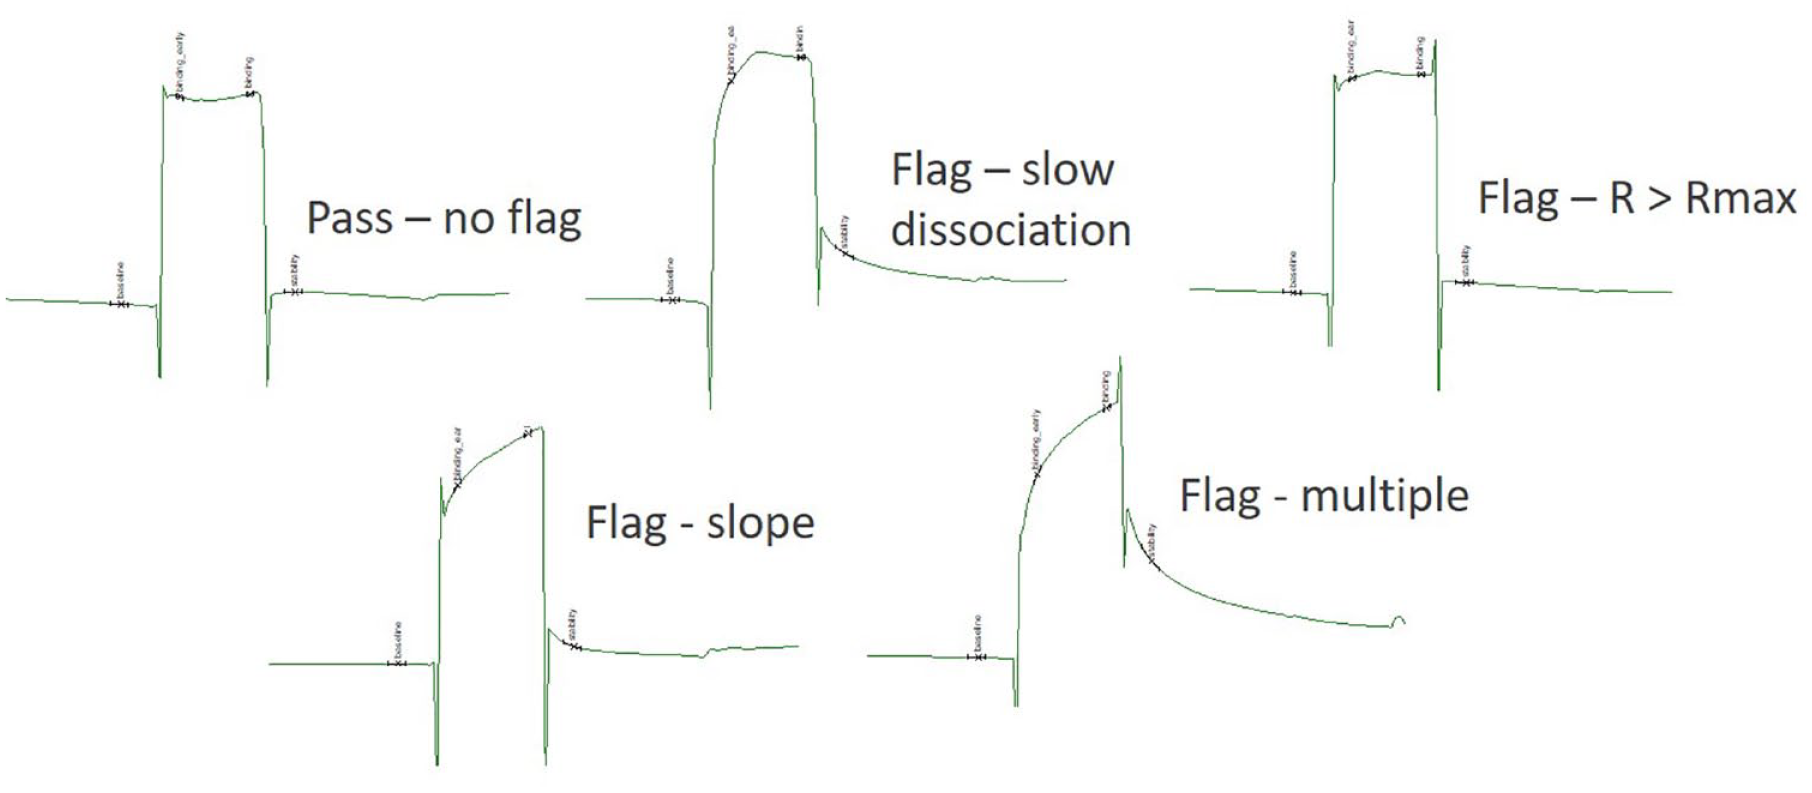
Examples of data classes from analysis of an SPR fragment screen. Taken from Biacore S200 evaluation software. The sensorgrams have the time and RU axes removed for clarity.
It is easy to immediately dismiss any fragment with a signal less than three times the standard deviation (SD) of the negative controls (buffer blanks)—these are clear misses. Fragments with a classic rectangular shape and rapid kinetics can then be binned according to percentage, dismissing any fragment with a response greater than ~200%. Within the remaining percentage range (200% − 3 × SD%) it is worth thinking carefully about the value of finer binning. The inclination is often to think that higher-percentage hits are better, but it is worth remembering that a bona fide 90%–100% binding signal would equate to a Kd value that was at least ~5- to 10-fold below the screening concentration. What is the likelihood of discovering such high-affinity fragment hits for the target being prosecuted? Some level of skepticism is justified. Common sense, SPR dose responses, and other biophysical direct binding techniques should hopefully dictate the plausibility of such high-scoring SPR screening hits.
In many cases, it is the lower-percentage hits that have the potential to be real fragment hits with tenable Kd values; for example, a 33% hit at 100 µM would correspond to a Kd value of 200 µM. Clearly, the vagaries of SPR screening mean that, even within the subset of well-behaved fragment sensorgrams, there will be many contributing factors to the final RU/percentage score other than the Kd value. Thus, it is best not to bin these percentages too finely and instead designate such fragments as hits for follow-up.
Having taken care of well-behaved hits and clear misses, we are left with assessing what, if any, value can be extracted from “problem” sensorgrams (
It seems sensible to run an SPR fragment screen at multiple concentrations, being careful to balance the likely onset of NSB with the ligandability of the target binding site. In practice, this means running SPR fragment screens at several concentrations in the 300 µM to 30 µM range. Seeing a clear, sensible dose dependence for fragment hit responses at different screening concentrations gives us a little more faith in their veracity. Ultimately, single-concentration SPR fragment screens are probably viewed, at best, as being a way to quickly identify ~20% of a fragment library that is worthy of follow-up. SPR benefits from low protein consumption and relatively rapid-throughput, making it feasible to quickly follow up on many promising initial hits. This leads us naturally on to the subject of SPR fragment dose responses.
SPR Fragment Dose Responses—Reading between the Lines
With the initial SPR fragment screen complete, designated SPR fragment hits are typically progressed for dose response analysis. This is necessary to validate the initial screening result but, more importantly, to sort the wheat from the remaining SPR screening chaff. Without knowledge of the Kd values for these SPR fragment hits, it is worth having the highest concentration of the dilution series in the 500 µM to 2 mM range, such that a 7- or 11-point halving dilution series will cover enough data points to derive fragment Kd values in the middling to higher-affinity range (<300 µM). Typically, SPR dose responses for fragment hits fall into four categories:
Higher-affinity fragment hits (<100 µM) will often show saturating or near-saturating dose–response curves and, more rarely, the comforting sign of some kinetics (
Many datasets will show some hint of curvature before showing a strong linear dose response at higher fragment concentrations (
An unambiguous straight-line dose response from beginning to end (
No signal or no interpretable signal.
It is helpful to take a step back and discuss the range of fragment affinities we might expect for hits from a fragment screen. Obviously, fragment affinities will vary according to binding site ligandability and fragment size. In addition, the fragments for which affinity data are available are most often at the measurable end of the fragment affinity spectrum; that is, SPR, MST, ITC, and bioassay will tend to perform better when estimating Kd/IC50 values in the <300 µM fragment affinity range. Deriving lower-affinity fragment Kd values is often the sole remit of protein-observed (PO) NMR or competitive ligand-observed (LO) NMR methods (see “Affinity Determination by NMR”). although these NMR methods are relatively slow and require milligram levels of protein.
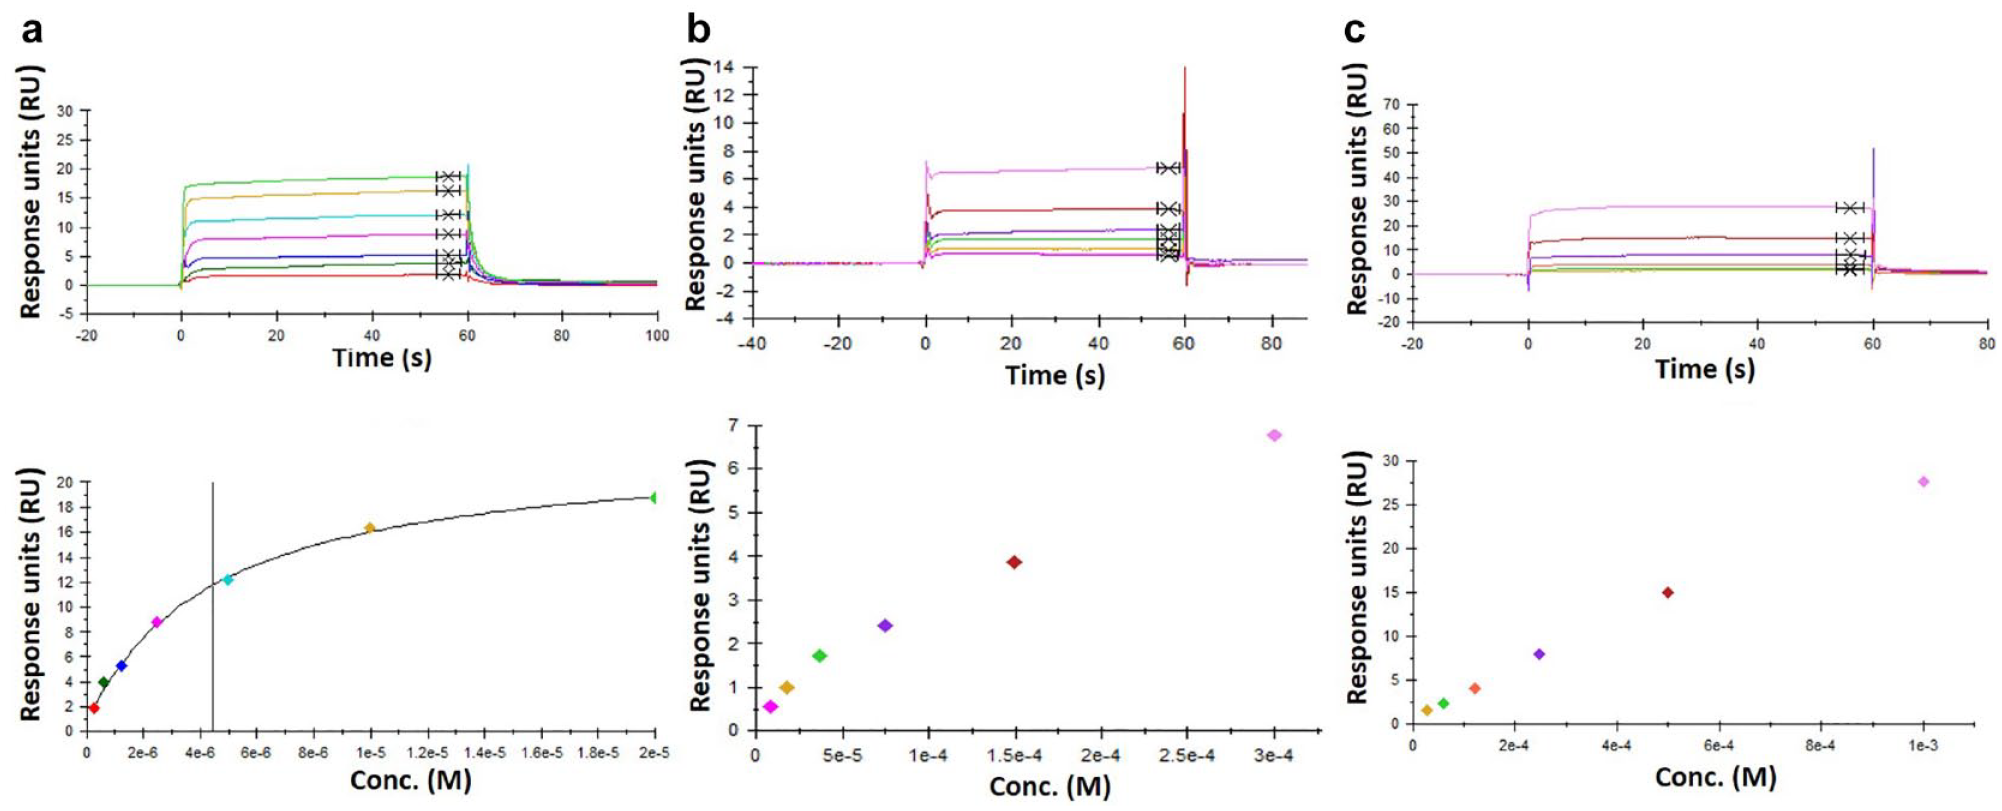
Examples of fragment dose responses that are difficult to reliably fit and determine Kd estimates from. (
In-house we have observed fragment Kd values over a broad range of affinities. Fragments with Kd values of <10 µM are rare, although perfectly feasible for certain target binding sites. Fragments with Kd values in the 10–100 µM range are more common and will often be the best hits from screening campaigns against highly ligandable binding sites. Fragments with Kd values in the 100–1000 µM range are the most common, comprising moderate to weak hits from highly ligandable sites and better fragment hits against more challenging target classes. Fragments with Kd values of >1000 µM have been measured in-house for many target classes, mainly using NMR methods. In addition, x-ray fragment screening at Astex has identified fragments that are not detectable by any other method, presumably binding with Kd values of >10 mM.
In theory, therefore, we might expect most biophysical FBS hits to have affinities of >100 µM for most target sites being prosecuted. It is evident, however, that published SPR fragment screens tend to be on more ligandable target proteins with high-affinity fragment hits. Thinking back to how we bin SPR screening hits, it is feasible that even the lowest percentage hit scores could correspond to valuable bona fide hit matter, especially for more difficult protein targets. The problem that arises for SPR follow-up dose responses is our old friend NSB. As mentioned above, many SPR dose responses will appear relatively linear with fragment concentration and defy reliable fitting unless the Kd values are in the <100 µM range. One suggestion to overcome the problems of NSB is to only use the lowest concentration dose response points and then to extrapolate the fit to a theoretical fixed Rmax value. We do not recommend this practice. Determining a Kd value requires a fractional occupancy of ~80%, evident by clear curvature in the fragment dose response as saturation is approached. It could be argued that quoting an SPR binding percentage at a certain, pre-NSB concentration could provide enough steer for SAR purposes, although this is debatable, and likely of limited value. In certain cases, an SPR competition format will provide a more effective means to site specifically validate and rank SPR primary hits.
Competition SPR
If the binding site of interest has a known tool compound, it is possible to configure a competition SPR format in which a tool compound is immobilized onto the chip surface, for example, through a biotinylated linker. Several linker lengths, surface densities, and immobilization strategies may have to be tested in order to achieve a suitable competition configuration. Since the protein target is in solution and not immobilized on the chip surface, we are more likely to avoid the problems of NSB that are caused by the protein–chip surface interface. This is a major advantage and allows the use of much higher competing fragment concentrations than would be possible in a direct binding format.
Titrating the protein over the immobilized tool compound surface should provide a healthy SPR response and a Kd estimate for the interaction that is close to the independently determined Kd value. It is important that the protein dissociates rapidly and completely from the immobilized tool compound surface, which means that the interaction Kd should ideally be in a moderate affinity range, that is, 0.1–10 µM. A titration of unmodified tool compound should effectively compete with the immobilized tool compound for binding to the target protein, giving rise to a dose response that can be fit to generate an IC50 close to the estimated Kd value for the interaction. It is crucial that the binding signal for the protein to the immobilized tool compound is completely knocked down by the titration of free unmodified tool compound. All being well, the competition format can be configured to follow up on SPR primary screening hits; it will allow higher concentrations of fragments to be used, weaker IC50 values to be determined, and an opportunity of delivering SAR through the hit validation phase of FBDD. More detail on the configuration and analysis of SPR competition experiments can be found in the following references.54–56
Some Thoughts on the Future of SPR Fragment Screening
In terms of FBS, SPR scores highly in being high-throughput and in having very low protein requirements, which are major advantages for many protein target classes. However, the problem of NSB continues to be a major drawback for SPR fragment screening, limiting its utility to highly ligandable target binding sites. The NSB problem appears to be due to the high level of immobilized protein required to detect binding of low MW compounds. Continued improvements in instrument sensitivity should mean that users will be able to lower the level of immobilized protein and perhaps attenuate the extent of the NSB problem. In addition, there is a clear unmet need for a biophysical technique that can routinely, rapidly, and robustly deliver affinity measurements for FBDD programs, particularly in the hit validation and hit-to-lead phases. It is hoped that SPR can meet this need one day.
Nuclear Magnetic Resonance
NMR can be used in FBDD campaigns in numerous ways. In this section, we focus on the impact that NMR can have on SBDD supported by high-throughput crystallography. In addition, we review experiments probing the interaction of target proteins and ligands. We begin by briefly describing the instrumental role that NMR plays in establishing and maintaining a high-quality fragment library.
Fragment Library QC
At the foundation of every successful FBDD campaign lies a well-curated fragment library. We are not going into the details of selecting fragments to get good coverage of chemical space, a topic for which a host of excellent articles exist.57–61 Instead, we focus here on what is needed for a library to be amenable to biophysical screening. For biophysical and x-ray screening to deliver hits, fragments must be soluble and stable under specific assay conditions. All fragments of the Astex library are quality controlled by NMR for their integrity, aggregation, and stability (including redox activity). Integrity is typically probed by one-dimensional (1D) proton NMR and supplemented by multidimensional and/or heteronuclear experiments where required. Stability and aggregation behavior are monitored by quantitative NMR 62 and waterLOGSY, 63 respectively.
Target QC
NMR can be used to assist construct design for the target protein in early-stage drug discovery. The signal dispersion observed in simple 1D-NMR experiments with unlabeled proteins up to 50 kDa can be used to assess whether a protein sample is folded and stable under the chosen conditions (
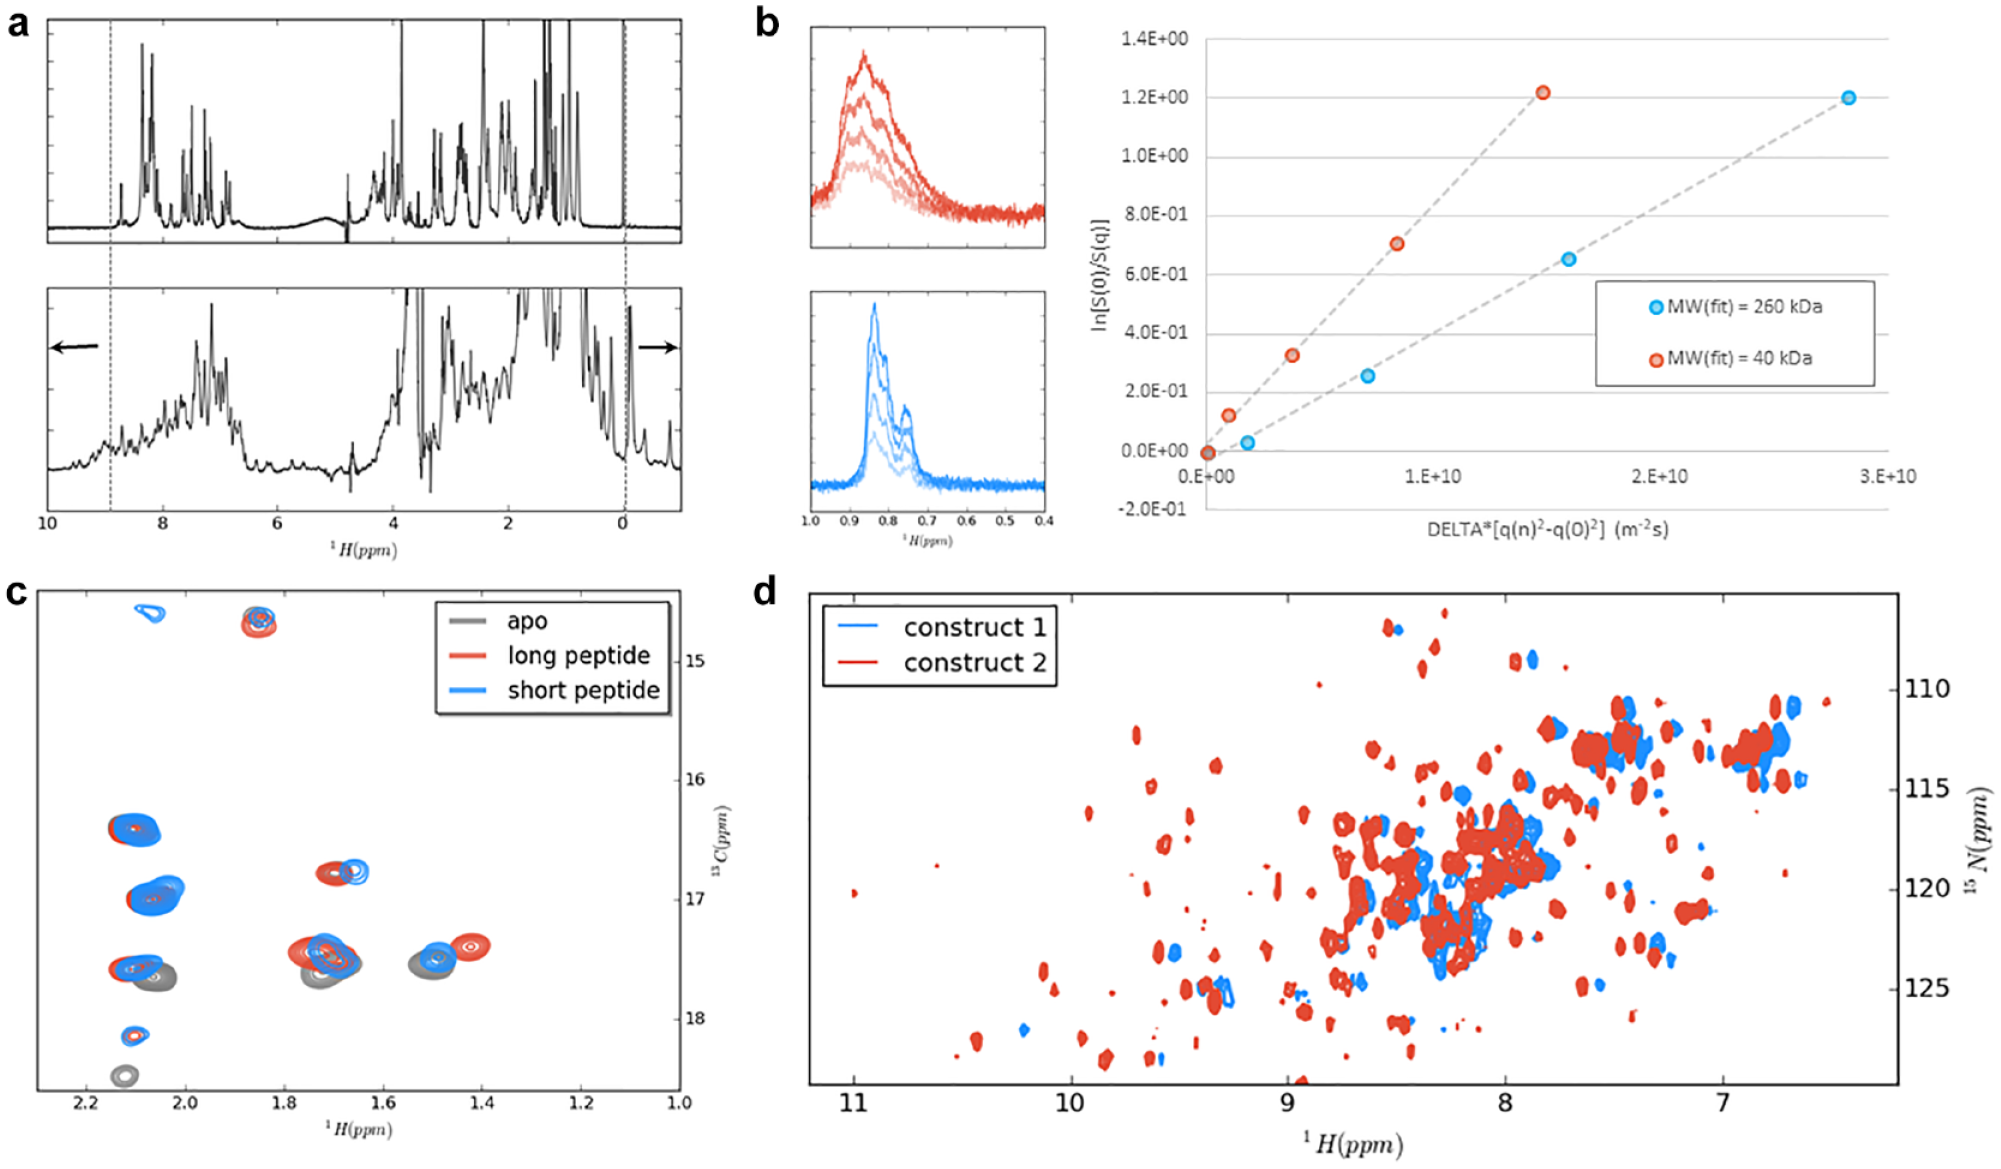
(
Fragment Screening by NMR
Despite its relatively low-throughput, NMR has evolved over the years to be the most prominent biophysical fragment screening method.66–68 NMR offers a range of advantages over other popular biophysical screening methodologies such as SPR or thermal shift, for example, the ability to detect binding at ligand concentrations well below the Kd. NMR can in principle be used in two different formats for fragment screening: ligand-observed (LO) and protein-observed (PO) NMR. LO-NMR offers the distinct advantage that it does not require labeled target protein. Furthermore, no MW restrictions apply as is the case for PO-NMR (see below). In fact, LO-NMR experiments tend to work better for bigger target molecules.
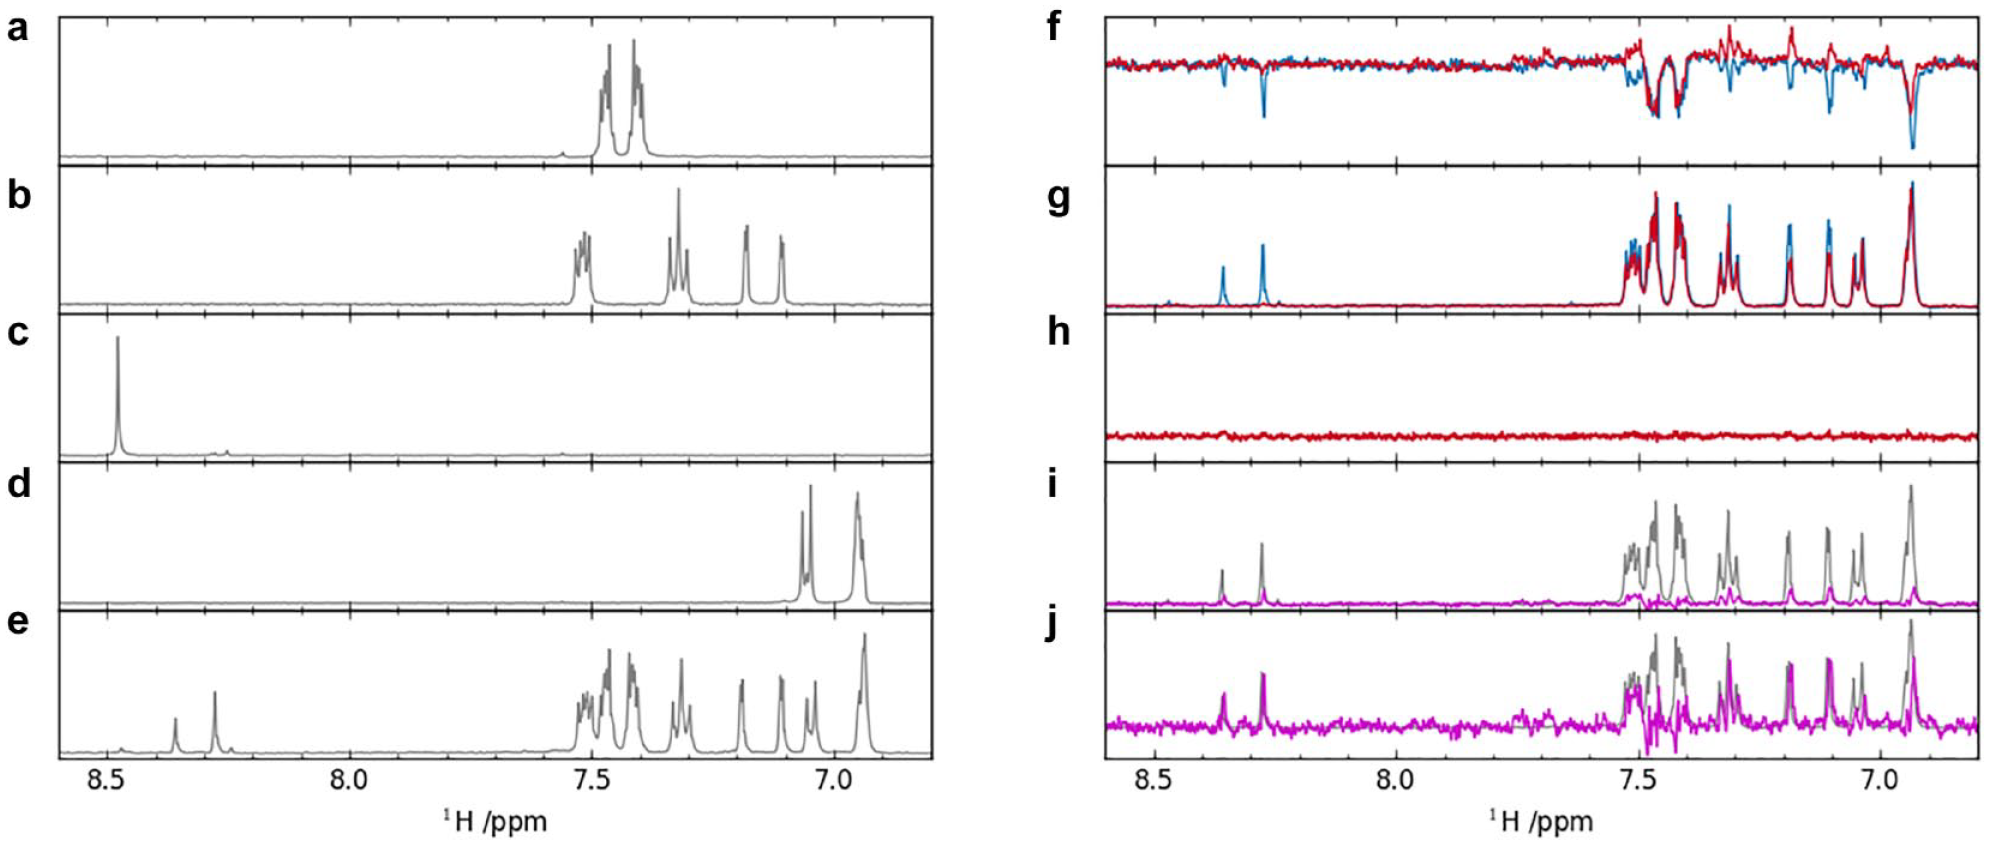
The large chemical shift range that a typical fragment library spans usually allows for cocktailing of fragments. Given that the resonances of the individual fragments are known prior to screening, cocktails can be designed to minimize spectral overlap in the cocktail (
(
LO-NMR makes use of the fact that a small-molecule ligand experiences a dramatic increase in its rotational correlation time upon binding to a higher-MW target protein. While small molecules are characterized by small positive cross-relaxation rates, these become smaller and then large and negative for high-MW systems. This change in cross-relaxation behavior is exploited in the saturation transfer difference (STD)
74
and waterLOGSY63,75 experiments (
We are not going to review any further the technical details of the different LO-NMR experiments that can be used for fragment screening. We refer the interested reader to a large body of literature that covers these techniques in detail.79–82 Instead, we want to focus on the analysis of LO-NMR data and the conclusions that can be drawn from them.
We commonly conduct a control experiment containing the fragment cocktail in buffer in the absence of protein. This so-called “buffer control” sample serves a twofold purpose. First, it serves as a reference spectrum to form the difference between the LO-NMR screening experiment in the presence and absence of the target protein.
*
Second, it is then this difference spectrum that is compared with a conventional 1D-NMR spectrum of the buffer control sample. Each peak of the buffer control reference 1D spectrum is scaled to each peak of the difference spectrum of the LO-NMR screening experiment. Each fragment in the cocktail is then assigned a score, which is the biggest score observed across all peaks of that fragment (
While the affinity of a fragment for a given target does have an influence on the measured score, there are many other factors that contribute to the score, so that we abstain from relating score intensities to affinities—except in reporter screening experiments. In these experiments, a signal of a reporter molecule, known to bind to the site of interest, is observed for perturbations by the addition of a cocktail of fragments or fragment singletons. In this scenario, the same signal is always monitored and the effect that a test fragment exerts on the reporter signal can directly be related to the affinity of the test fragment for the site of interest. This can be a very useful feature, especially when the aim is to only progress the highest-affinity hits into further validation experiments.
Analysis of LO-NMR screening experiments is a relatively laborious process, especially in the case of CPMG and waterLOGSY experiments, where difference spectra need to be generated. In our experience, this is best done manually for each cocktail, as often small lateral shifts in the protein or buffer reference spectra are required to obtain high-quality difference spectra. This is not the case for STD experiments where formation of the difference can be hard-coded into the NMR pulse sequence, a feature that is made possible by the fact that the “negative control” experiment is measured on the same sample. As strictly speaking no buffer control sample is required for measuring STD experiments, the preparation and measurement of such a sample can be omitted, if one accepts the use of a conventional 1D-NMR spectrum containing the target protein for scaling purposes. This allows for significant time savings in sample preparation and data acquisition. Even more time savings are possible for reporter screens. Likewise, for these no reference sample needs to be measured. In addition, as one and the same signal is monitored throughout the screening of a whole fragment library, the automated analysis of reporter screening data is much more straightforward than for the “direct detection” LO-NMR screening experiments.
Hit Validation by NMR
Another big advantage of NMR over other techniques is its inherent QC feature: at the same time as screening for ligands binding to a given target molecule, the experimental data delivers information on the integrity (identity, concentration, aggregation, etc.) of the fragment under investigation. This feature is central to the low false-positive hit rates that are commonly observed when using NMR for fragment screening.
When using PO-NMR, resonance signals of the target protein are observed and interrogated for fragment-induced changes. At the same time, PO-NMR delivers information on the integrity (folding, aggregation, oxidation, etc.; see “Target QC” section above) of the target protein under investigation. Together with the complementary LO-NMR experiment, this allows a stringent assessment of a protein–ligand interaction in the framework of the NMR validation cross. 79
There are cases where unlabeled protein has been used for PO-NMR screens both in-house and as reported in the literature. However, in general PO-NMR requires isotopically labeled target proteins. This, together with its relatively high demands in terms of protein consumption, is the main limitation of PO-NMR.
In principle, MW considerations come into play with PO-NMR. The advent of transverse-relaxation optimized (TROSY) NMR, together with uniform, high levels of deuteration, has pushed the MW limit for the 15N- 1 H correlation experiments to circa 100 kDa. 83 More advanced isotopic labeling methods, especially the selective 13C-labeling and protonation of methyl groups in an otherwise highly deuterated background (also referred to as “selective methyl labeling”), has pushed the MW limit another order of magnitude toward systems of 1 MDa.84–87 Thus, the limiting factor for (fragment) screening using PO-NMR is no longer MW, but rather the production of sufficient amounts of labeled target protein.
For drug discovery projects at Astex, the translation rate into x-ray-validated hits is the critical figure of merit for any biophysical screening technique. While thermal shift and SPR can often reliably detect binding events with Kd values of <100 µM, the detection threshold for NMR is a good order of magnitude higher. X-ray itself is well suited to detect fragment binders as weak as 100 mM. And even if such weakly binding fragments may not be of interest as starting points for hit-to-lead campaigns, they serve an important function in mapping the site of interest in terms of hot and warm spots. This feature has been exploited by adding high concentrations of cosolvents88,89 and, more recently, with an approach termed MiniFrags, in which highly soluble molecules with heavy-atom counts of <12 are soaked into protein crystals at concentrations as high as 1 M. 90
A critical factor for all LO-NMR techniques is the availability of a high-affinity tool compound. Such a molecule can be used to specifically compete with binders to the site of interest and, therefore, plays a crucial role in validating a LO-NMR screening method. Translation rates for NMR screening hits into validated x-ray structures vary greatly from target to target. Rates as low as 5% and as high as >80% have been observed in screening campaigns carried out at Astex over the years. Generally, translation rates for fragment hits that have been found to be competed off by a high-affinity tool compound are higher than hits found in noncompetition screens. However, the gain in translation rate may not always justify the additional experimental effort. Carrying out a small-scale prescreen using different LO-NMR screening methods, with and without a competition step, serves an important purpose in finding the optimal screening cascade to ensure the highest possible translation rates into validated x-ray structures.
Affinity Determination by NMR
In addition to serving as a biophysical screening method for obtaining primary hit matter for FBDD campaigns, NMR is well suited to determine affinities of weakly binding molecules. This can again be in either a PO-NMR format or a LO format. The PO format is particularly interesting in the absence of any known binding compounds for a given target, when multiple binding pockets are present in a target or in general in the very early stages of a project. It requires relatively little investment of resources other than the purification of suitably labeled protein. In the presence of a tool compound or a natural ligand, resonances sensitive to binding events in the pocket of interest can often be mapped (see
The PO-NMR work described above is often carried out with the aim of establishing a LO-NMR affinity assay that is both higher-throughput and does not require labeled target protein. Such LO-NMR reporter assays work in analogy to biological assays, with which readers may be more familiar. Basically, all LO-NMR experiments (e.g., STD, waterLOGSY, and CPMG) can be used in LO-NMR reporter assays. In the following, we exemplify the use of a LO-NMR reporter assay based on a CPMG experiment. In a CPMG experiment an NMR signal (a “resonance”) is quenched (by a combination of increased transverse relaxation when bound to the target and line broadening by the exchange event itself) when the reporter is bound to the target protein. Adding a test molecule that competes for the same site as the reporter frees some of the reporter molecule, leading to the reappearance of its signal (
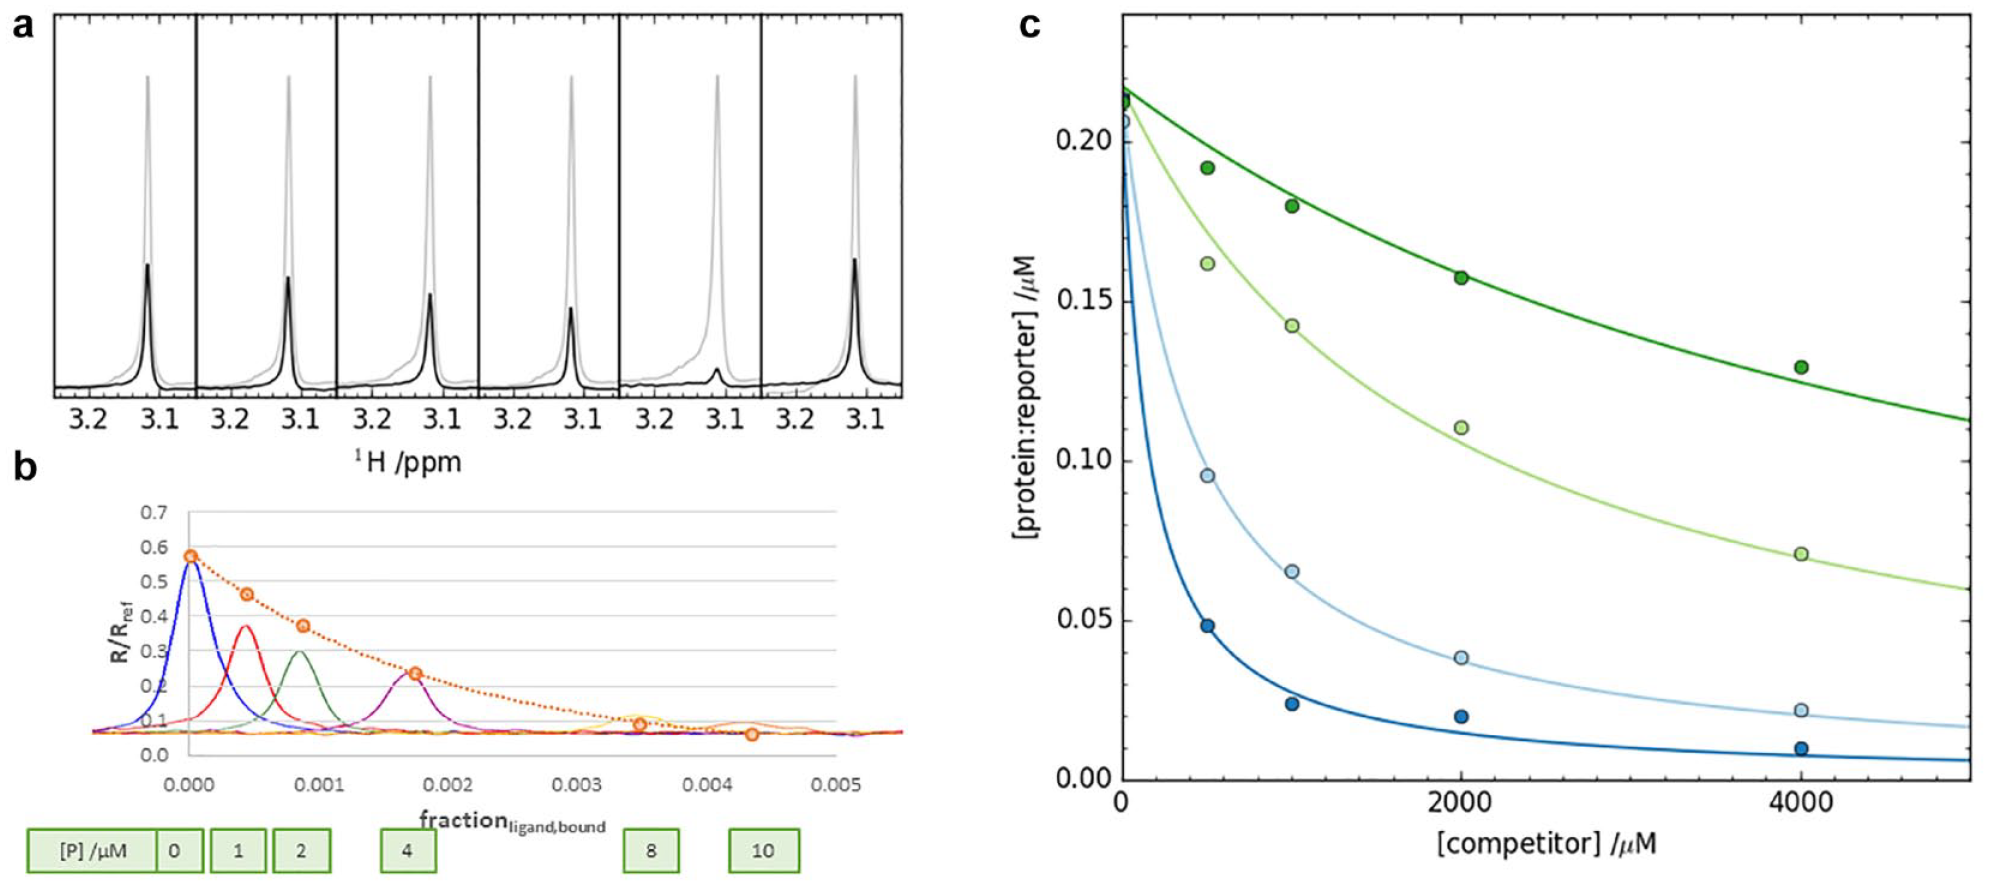
(
Below we describe some of the practicalities of setting up a LO-NMR reporter assay. The assay can use a proton or a fluorine signal as reporter. For both methods, the same considerations as outlined below apply. We usually start by identifying potentially interesting reporter molecules from the crystallographically validated hit matter that is generated during a fragment screening campaign. Ideally, one of these crystallographic hits can be used. If that is not possible or desired, we look for suitable commercially available analogs of crystallographic hits. Candidate reporter molecules then undergo affinity determination against the target, often by PO-NMR. We then titrate the reporter with an increasing concentration of target protein (
Discussion/Outlook
FBDD has achieved its most important milestones, delivering active molecules both to the clinic and to the market. Thus, it has reached the status of a bona fide lead generation method across the pharmaceutical industry. But of course—as with any scientific field—the method continues to innovate and adapt to emerging technologies. From an SBDD perspective, cryo-EM is undoubtedly the most exciting new opportunity for FBDD, as it continues to bring within reach a host of targets deemed “intractable” to date. It is our belief that, within the next decade, cryo-EM will have established itself firmly in the world of SBDD. Taking on challenging targets such as large, multiprotein complexes or membrane proteins will also pose challenges for the biophysical methods that are used in SBDD, for both screening and affinity determination. Some of the methods mentioned in this review offer advantages for such targets (e.g., the low material requirements of thermal shift assays), whereas others are facing challenges (e.g., fragment screening in the presence of ill-defined amounts of lipids/detergents). Innovation in these fields will likely follow suit with the new problems that are encountered. Other challenges are of a more fundamental nature, such as the expected increased hit rates for large multiprotein complexes.
The multitude of screening possibilities and hit validation and hit elaboration strategies make FBDD ideal for collaborative projects. This is exemplified by the industry–industry partnering and industry–academia collaborations that led to the discovery of two of the four FBDD-derived drugs that are currently on the market. NICR and Monash University played vital roles in the discovery of erdafitinib and pexidartinib, respectively.
The fact that fragment libraries require less establishment and curation effort makes the method particularly interesting to smaller companies and academic institutions. Nowadays, there are a variety of commercially available fragment libraries, catering to every taste of screening method—from fluorinated libraries (https://enamine.net/fragments/fragment-collection/fluorinated-fragments) for fast and efficient 19F LO-NMR screening to ultrasoluble mini-fragments (Enamine and Astex are commercializing the Astex MiniFrag 90 library) aimed at the crystallography community. If anything, this is expected to further popularize the FBDD method in the coming years.
Footnotes
Acknowledgements
We would like to thank Marc O’Reilly, Chris Murray, and David Rees for helpful comments during the writing of this manuscript.
Declaration of Conflicting Interests
The authors declared the following potential conflicts of interest with respect to the research, authorship, and/or publication of this article: All authors are employed by Astex Therapeutics Limited and their research and authorship of this article was completed within the scope of their employment with Astex Therapeutics Limited.
Funding
The authors received no financial support for the research, authorship, and/or publication of this article.
*
Except for the STD experiment, where the difference is formed by subtracting two STD experiments that have been irradiated at very different frequencies, and the buffer control is, strictly speaking, not necessary to form the difference spectrum.