
Abstract
Malfunctions in the basic epigenetic mechanisms such as histone modifications, DNA methylation, and chromatin remodeling are implicated in a number of cancers and immunological and neurodegenerative conditions. Within GlaxoSmithKline (GSK) we have utilized a number of variations of the NanoBRET technology for the direct measurement of compound–target engagement within native cellular environments to drive high-throughput, routine structure–activity relationship (SAR) profiling across differing epigenetic targets. NanoBRET is a variation of the bioluminescence resonance energy transfer (BRET) methodology utilizing proteins of interest fused to either NanoLuc, a small, high-emission-intensity luciferase, or HaloTag, a modified dehalogenase enzyme that can be selectively labeled with a fluorophore. The combination of these two technologies has enabled the application of NanoBRET to biological systems such as epigenetic protein–protein interactions, which have previously been challenging. By synergizing target engagement assays with more complex primary cell phenotypic assays, we have been able to demonstrate compound–target selectivity profiles to enhance cellular potency and offset potential liability risks. Additionally, we have shown that in the absence of a robust, cell phenotypic assay, it is possible to utilize NanoBRET target engagement assays to aid chemistry in progressing at a higher scale than would have otherwise been achievable. The NanoBRET target engagement assays utilized have further shown an excellent correlation with more reductionist biochemical and biophysical assay systems, clearly demonstrating the possibility of using such assay systems at scale, in tandem with, or in preference to, lower-throughput cell phenotypic approaches.
Introduction
The therapeutic effect of clinical drugs is achieved through effective binding to their cognate target within a complex cellular system. Such binding typically occurs at a functional site of the protein and has either an activating or inhibitory effect, the result of which elicits the desired molecular, cellular, and physiological response. 1 Drug efficacy is critically dependent on the extent of drug–target engagement, documented by multiple reports demonstrating that the failure of a significant proportion of small-molecule drugs in phase II clinical trials was due to a lack of efficacy.2–4 One notable example highlighting the importance of drug–target engagement is the PARP-1 inhibitors iniparib and olaparib. Within phase III clinical trials, iniparib failed to meet efficacy endpoints while olaparib has recently been approved by the Food and Drug Administration (FDA). Subsequent reports have utilized target engagement assays to demonstrate that iniparib does not engage PARP-1 in contrast to olaparib.5,6 Furthermore, clinical safety liabilities are often encountered due to the nonspecific off-target binding of drugs with other protein members/families.7,8
Traditional drug development critical paths have focused on reductionist biochemical assays to monitor the specificity and affinity of target engagement, with complex cellular phenotypic assays utilized to probe desired drug function. Within a cellular context, however, proteins reside in structurally intricate settings and typically function as components of extended molecular complexes, therefore likely exhibiting significantly different behaviors than they would as isolated polypeptides. Such physiological differences likely explain the disconnect between biochemical analysis of target engagement and compound potency measured by cellular phenotype. Bridging the gap between isolated binding interactions and phenotypic endpoints therefore offers a key opportunity for probing drug–target engagement driving physiological outcomes within intact native cellular systems.
Although direct physical drug–target engagement in live cells has historically been difficult to probe, recent advances in this field have led to the establishment of new methodologies such as CETSA and bioluminescence resonance energy transfer (BRET)-based approaches.1,9,10 In this report we take advantage of Promega’s NanoBRET technology toolbox to directly measure drug–target engagement within native cellular environments to drive high-throughput compound profiling and drug discovery across the epigenetic landscape. We demonstrate that intracellular protein–protein interaction (PPI) assays correlate with both “simple” biochemical assay formats and “more complex” cellular phenotypic endpoints, therefore providing a screening platform to directly probe drug function based on a desired mechanism of action. Such a systematic evaluation of target engagement for drug candidates will likely enhance efficacy and reduce off-target liability risks to drive attrition reduction during drug discovery.
Materials and Methods
BRD2, BRD3, and BRD4 NanoBRET PPI Assays
Compounds were titrated 1:3 from a 1 mM stock solution in 100% DMSO, with 40 nL transferred per well to a white 384-well tissue culture (TC)-treated microplate (Nunc 164610; Thermo Fisher Scientific, Waltham, MA) using a Labcyte Echo 555 (Labcyte Inc., Sunnyvale, CA). BRD-NanoLuc fusion and H3.3-HaloTag plasmids were purchased from Promega (Madison, WI). HEK293-wt cells were seeded into T75 flasks (Thermo Fisher Scientific) at 4.8e6 cells/flask in a total volume of 12 mL and left to attach for 4–6 h at 37 °C, 5% CO2. The cells were then transfected with the following transfection mix (per T75 flask): 600 μL of OptiMEM, 0.12 μg of NanoLuc BRD4 DNA, 12 μg of Histone H3.3 HaloTag DNA, and 48 μL of FuGENE HD.
Following an overnight incubation at 37 °C, 5% CO2, cells were washed with phosphate-buffered saline (PBS) and then detached by trypsinization using TrypLE Express. Cells were then centrifuged at 1500 rpm for 5 min, the supernatant discarded, and the cell pellet resuspended in OptiMEM + 4% USA fetal bovine serum (FBS) at 2e5 cells/mL (Invitrogen, Thermo Fisher Scientific, Waltham, MA). Promega 618 HaloTag ligand was then added to the cell solution at a 1:1000 dilution. Cells were subsequently dispensed into compound plates and incubated for 18–24 h at 37 °C, 5% CO2. NanoLuc substrate solution was prepared (100× dilution of the NanoLuc substrate in OptiMEM) with 10 μL of solution added per well and plates centrifuged at 1000 rpm for 1 min and shaken at 1000 rpm for 1 min, followed immediately by data capture (see Supplemental Data for NanoBRET data capture and analysis details). All data were normalized using eq 3 (all equations available in Supplemental Materials), to 16 high (DMSO) and 16 low (GlaxoSmithKline [GSK] proprietary inhibitor at 1 μM) control wells on each microplate. pIC50 determination was performed by plotting the ratioed, normalized data against the BET inhibitor concentration and applying a four-parameter logistic fit as described in eq 2.
BRD4 Tracer Assay: BRD4-NanoLuciferase Transfection and Tracer Characterization
To carry out initial transfection of mammalian cells with BRD4-NanoLuciferase, 2 mL of HEK293-wt cells were added into a six-well TC microplate (Corning, NY) at 6e5 cells/well and incubated for 4–6 h at 37 °C, 5% CO2. The cells were then transfected with the following transfection mix (per well): 88 µL of OptiMEM, 0.2 µg of NanoLuc BRD4 FL fusion vector, 2 µg of carrier DNA, and 12 µL of FuGENE HD.
Following an overnight incubation at 37 °C, 5% CO2, cells were washed with PBS and then detached by trypsinization using TrypLE Express. Cells were then centrifuged at 1500 rpm for 5 min, the supernatant discarded, and the cell pellet resuspended in OptiMEM + 4% US FBS at 2e5 cells/mL. NanoGlo substrate was then further added to the cell suspension at a 1:500 ratio. Forty microliters of the cell suspension was added to a 384-well microplate containing 10 µL of titrated fluorophore-labeled ligand (all fluorophore-labeled ligands or compounds are hereafter referred to as tracers), which was bromosporine labeled with a bodipy fluorophore (BSP-BODIPY; based on the promiscuous bromodomain (BD) inhibitor first disclosed by Picaud et al. 11 ) dissolved in DMSO, followed by repetitive reads of the assay plate. Tracer association curves derived from the endpoint reads at 70 min were fitted with eq 2. Data captured before this timepoint was used for kinetic analysis (data not shown).
BRD4 Tracer Assay: Inhibitor Competition Assays
A titration of compound dissolved in DMSO was dispensed into a white 384-well microplate that was normalized to the highest concentration of DMSO. A 12.5 mM HEPES solution with 30% polyethyleneglycol (PEG) and 1.5 µM bromosporine tracer, BSP-BODIPY, in OptiMEM was dispensed across the microplate at 5 µL/well. Five microliters of OptiMEM was then dispensed across the microplate, with the plate subsequently shaken at 550 rpm for 15 min. Transfected HEK293-wt cells (see above for methodology) were adjusted to 2.5e5 cells/mL in OptiMEM. NanoGlo substrate was then added to the cells at a 1:500 dilution and the cells dispensed at 40 µL/well into the assay microplate, followed by repetitive reads of the assay plate. Inhibition curves derived from the endpoint reads at 120 min were fitted with eq 2. Data captured before this point were used for kinetic analysis of compounds and are not included in this publication.
MCP-1 Whole Blood Cytokine Release Assay
Compounds were titrated 1:3 from a 3 mM stock solution in 100% DMSO, with 1 μL of compound transferred per well to a white 96-well TC-treated microplate (cat. 655088; Greiner Bio-One, Frickenhausen, Germany). One hundred thirty microliters of human donor blood was added to each well using a Viaflo 96 12-channel electronic multichannel pipette (Integra Bioscience, Berkshire, UK) and left for 30 min. Ten microliters of lipopolysaccharide (LPS), dissolved in PBS, was then added per well (final assay concentration [FAC] of LPS, 200 ng/mL). Following overnight incubation of the assay microplates at 37 °C, 5% CO2, 140 μL of PBS was added per well followed by microplate centrifugation at 2000 rpm for 10 min. Supernatants were collected and further diluted 1:2 in PBS + 1% bovine serum albumin (BSA). Ten microliters of diluted supernatant was then transferred to a V-bottom 96-well black microplate (cat. 651201; Greiner Bio-One) using a Biomek FX (Beckman Coulter, Brea, CA). Cytokine detection was then performed as described below.
MCP-1 PBMC Cytokine Release Assay
Compounds were titrated 1:3 from 1 mM stock solutions in 100% DMSO, with 0.5 μL transferred per well to a white 96-well TC-treated microplate (cat. 655088; Greiner Bio-One). Frozen peripheral blood mononuclear cells (PBMCs) from differing donors were thawed and resuspended to 3.2e5 cells/mL in assay media. One hundred thirty microliters of cell suspension was added per well and the microplates were left for 30 min. Ten microliters of 14 ng/mL LPS was then added per well with cells incubated at 37 °C, 5% CO2 overnight. The following day, 140 μL of PBS was added per well, followed by microplate centrifugation at 2000 rpm for 10 min. Ten microliters of the supernatant was then transferred to a V-bottom 96-well black microplate (cat. 651201; Greiner Bio-One) using the Biomek FX (Beckman Coulter). Cytokine detection was then performed as described below.
MCP-1 Cytokine Detection Assay
For cytokine detection, monocyte chemoattractant protein 1 (MCP-1) BD cytometric bead array (CBA) beads (BD Biosciences, Franklin Lakes, NJ) were used. Capture bead solution was prepared by performing a 1:200 dilution of the MCP-1 capture bead stock solution in PBS + 1% BSA. Ten microliters of this solution was added per well to the assay supernatant and microplates were incubated at room temperature on a microplate shaker for 2 h. Detection reagent was further prepared by performing a 1:400 dilution of the detection reagent stock solution. Ten microliters of detection reagent was added per well and microplates were incubated at room temperature on a microplate shaker for 2 h. Data were acquired on an iQue Screener flow cytometer. All data were normalized, using eq 3, to eight high (DMSO) and eight low (GSK proprietary inhibitor at 70 μM) control wells on each microplate. The pIC50 was determined by plotting the normalized data against the BET inhibitor concentration and applying a four-parameter logistic fit as described in eq 2.
CECR2 NanoBRET Tracer Assay
Compounds were titrated 1:4 from 10 mM stock solutions in 100% DMSO, with 40 nL transferred per well to a white 384-well TC-treated microplate (Nunc 164610; Thermo Fisher Scientific) using a Labcyte Echo 555 (Labcyte Inc.). HEK293-wt cells were seeded into a Corning six-well microplate at 8e5 cells/well and left to attach for 4–6 h at 37 °C, 5% CO2 prior to transfection. The cells were then transfected with the following transfection mix (per well): 92 μL of OptimMEM, 0.2 μg of CECR2-NanoLuc (obtained from Promega), and 8 μL of FuGENE HD.
Following an overnight incubation at 37 °C, 5% CO2, cells were washed with PBS and then detached by trypsinization using TrypLE Express. Cells were then centrifuged at 1500 rpm for 5 min, the supernatant discarded, and the cell pellet resuspended in OptiMEM + 4% USA FBS at 2e5 cells/mL. BSP-BODIPY was then added to the cell solution at a FAC of 150 nM. Forty nanoliters of the cell suspension was dispensed per well into the prestamped compound microplates and then incubated for 4–6 h at 37 °C, 5% CO2; this timepoint was chosen to give the optimal signal-to-background (S/B) ratio, data not shown. NanoLuc substrate solution was prepared by performing 1:100 dilution in OptiMEM. Ten microliters of this solution was added per well, and plates were centrifuged at 1000 rpm for 1 min and shaken at 1000 rpm for 1 min, followed immediately by data capture. Subsequent data analysis was performed as in the BRD2, BRD3, and BRD4 PPI methodology except for the use of another GSK proprietary compound at 10 μM, as a low control.
HiBiT BRD4 Tracer Assay
Compounds were titrated 1:4 from 10 mM stock solutions in 100% DMSO, with 50 nL transferred per well to a white TC-treated 384-well microplate (Nunc 164610; Thermo Fisher Scientific) using a Labcyte Echo 555 (Labcyte Inc.). CRISPR
Results and Discussion
Lack of efficacy is the greatest cause of drug discovery failure during clinical trials.2–4 Demonstrating clear proof-of-mechanism evidence that a lead molecule engages with its molecular target and affects the biology of the target cell as intended within the discovery phase provides an opportunity to significantly reduce this element of clinical attrition. Here we describe the implementation of NanoBRET technology at scale to probe intracellular ligand–target engagement within drug discovery campaigns focused on the epigenetic landscape.
The Missing Link: Embedding High-Throughput Target Engagement Assays within Lead Discovery
Traditionally, linear drug discovery campaigns progress from high-throughput biochemical assays that monitor the specificity and affinity of target engagement, to the low-throughout complex phenotypic cellular assays that demonstrate physiological modulations based on compound activity. A clear disconnect within this process is the absence of monitoring drug–target engagement within a native cellular context to ensure drug–target engagement is linked to cellular pathophysiology.
In this report we focus our attention on epigenetic protein targets, whereby GSK has developed a wide range of biophysical, biochemical, and cellular assay technologies to probe ligand function (see
Bromodomain Proteins: A Case Study in Ligand Identification
BET bromodomain proteins are important epigenetic regulators of gene expression that bind acetylated histone tails and regulate the formation of acetylation-dependent chromatin complexes.14,15 Small-molecule inhibitors targeting BD proteins compete for binding to acetylated histones and have demonstrated strong anticancer and anti-inflammatory properties within different in vitro cell models and in vivo preclinical models, making them an attractive drug target.16–27 Historically, for hit identification efforts, we have developed recombinant, purified protein-based FP and TR-FRET assays to probe ligand binding and identify novel chemical equity (

Primary compound profiling assays typically used for BET proteins. (), BRD4 Y97A ( ), BRD4 Y390A (
 ), and BRD4 Y97A Y390A (
 ) from 2 μM, prior to the addition of 5 nM BET-647 and detection of FP signal change. Data fitted to the Hill–Langmuir equation. (
To validate the BRD4 BD1 and BD2 TR-FRET assays prior to deployment for screening activities a number of known BET inhibitors were tested ( Fig. 1B ). The pIC50 values achieved in the TR-FRET assays are in agreement with literature-reported IC50 values. For example, when we tested the active enantiomer of (+)-JQ1, documented to inhibit BRD4, the reported pIC50 values for BRD4 BD1 and BD2 are 7.11 and 7.48, respectively, 32 while the measured pIC50 values for the BRD4 mutant TR-FRET assays were 7.40 and 7.28 ( Fig. 1B ). 33 Furthermore, the inactive stereoisomer (–)- JQ1, documented to show no significant interaction with BD proteins, is approximately 100-fold less active; however, it should be noted that an IC50 of approximately 10 μM was detected. Reassuringly, the reported bromosporine pIC50 values for BRD4 BD1 and BD2 are within the range of 6.5–7.5, which is broadly in agreement with the values presented in Figure 1B . 11 Finally, the BRD4 pIC50 value for the GSK BET inhibitor, I-BET151 (I-BET151), is within the expected range.34,35
Although such biochemical approaches provide useful and powerful assay systems for measuring target engagement, they represent an oversimplification of a complex biological system, unable to assay whether compounds are cell penetrant or if they disrupt native binding with BET protein intracellular partners. To therefore bring forward a more physiologically relevant representation of drug–target engagement, we applied the NanoBRET technology from Promega, which utilizes BRET to reveal the binding characteristics of a drug with selected targets within intact cells.8,9 We initially focused our attention on generating a BRD4–Histone H3.3 PPI assay that would enable us to monitor BRD4 dissociation from chromatin upon ligand treatment. Assay development consisted of multiple parameters to investigate and optimize, with stable cell line generation, transient transfection of both NanoLuc BRD4–HaloTag Histone H3.3 bicistronic constructs or individual plasmids, the DNA–FuGENE ratio, and the NanoLuc BRD4–HaloTag Histone H3.3 ratio all assessed (data not shown). We found that the major condition influencing assay quality and robustness was the ratio utilized between the NanoLuc-labeled BRD4 protein and the HaloTag-labeled Histone H3.3 ( Fig. 2A ). Significant increases in the S/B window could be obtained by altering and titrating this ratio. Interestingly, we found this parameter to be key when developing PPI assays for other BRD family members (data not shown), demonstrating the importance of optimizing individual plasmid DNA concentrations for cellular transfection.

Development of BRD4 NanoBRET target engagement assays. () and (+)-JQ1 ( ). Data measured as milliBRET (mB) units and then normalized to microplate control populations before fitting the percentage inhibition data to a four-parameter logistic equation (eq 2). (
 ), bromosporine (
 ), I-BET151 (
 ), and (+)-JQ1 (
 ). Data measured as mB units and then normalized to microplate control populations before fitting the percentage inhibition data to a four-parameter logistic equation (eq 2).
Having developed and established a robust BRD4–Histone H3.3 PPI assay, we next sought to profile ligands previously documented in the literature to elicit a phenotypic response through BET protein inhibition.25,36 Treatment with (+)-JQ1 and I-BET151 demonstrated clear target engagement profiles with BRD4 through dose–response curves showing an inhibition in BRD4–Histone H3.3 PPI at increasing ligand concentrations ( Fig. 2B ).
To further validate and monitor intracellular target engagement, we developed and optimized an assay that utilizes competitive displacement of a bromosporine-based tracer, BSP-BODIPY, reversibly bound to a NanoLuc luciferase–BRD4 fusion in cells. Initial tracer characterization was carried out to optimize the concentration of bromosporine required to achieve maximal BRET signal in our assay format ( Fig. 2C ). With assay conditions defined, we profiled a set of tool BET inhibitors that included I-BET151 and (+)-JQ1, where we observed clear dose-dependent inhibition of the BRET signal demonstrating competitive displacement of the NanoBRET tracer by tool ligands, and thus additional confirmation of ligand–target engagement ( Fig. 2D ).
Of note, both the NanoBRET PPI and tracer assays were developed in a 384-well microplate format to facilitate high-throughput screening, thus enabling intracellular target engagement assays as a front-end primary format to drive SAR profiling of molecules within GSK. This step change has positioned intracellular drug–target binding as a key decision-making assay earlier in drug discovery screening cascades than has previously been feasible.
Hitting the Right Target: Offsetting Liability Risk and Enhancing Efficacy
Previously we have discussed lack of efficacy as the primary failure behind phase II clinical trials.2–4 Another major issue for clinical drug failure is due to safety concerns, with one recent report documenting that nearly 17% of drug failures were due to drug polypharmacology with off-target proteins. 7 Drug–target specificity and selectivity is therefore key to mitigate potential safety concerns. Within the epigenetic BD landscape, inhibition of specific members of the BET family, such as BRD4 and BRD2, has been widely documented to elicit anti-inflammatory effects across a range of therapeutic modalities (e.g., arthritis and fibrosis) and cellular systems such as macrophages, endothelial cells, and T cells.17,37–41 In clinical studies, however, pan-BET inhibitors manifest a wide range of safety liabilities, with reversible hematological toxicities such as thrombocytopenia, anemia, and neutropenia, as well as gastrointestinal events, documented.42,43 Utilizing NanoBRET PPI assays to monitor target engagement across multiple family members or isoforms therefore provides a key opportunity to drive ligand selectivity for drug efficacy, define the specificity of compound mode of action, and reduce off-target or liability risks that may be posed by closely related protein family members.
To investigate the above, we developed NanoBRET PPI assays for two additional BET family proteins, BRD2 and BRD3, allowing drug–target profiles to be obtained for differing BET family members (
Fig. 3
). We screened a diverse collection of BET inhibitors that comprised both proprietary and GSK chemical series, and published compound classes from competitors and academic institutes. Data generated from NanoBRET PPI assays were reproducible, as demonstrated across all BET isoforms tested with r2 values of 0.79 (
Fig. 3A
) and 0.99 (
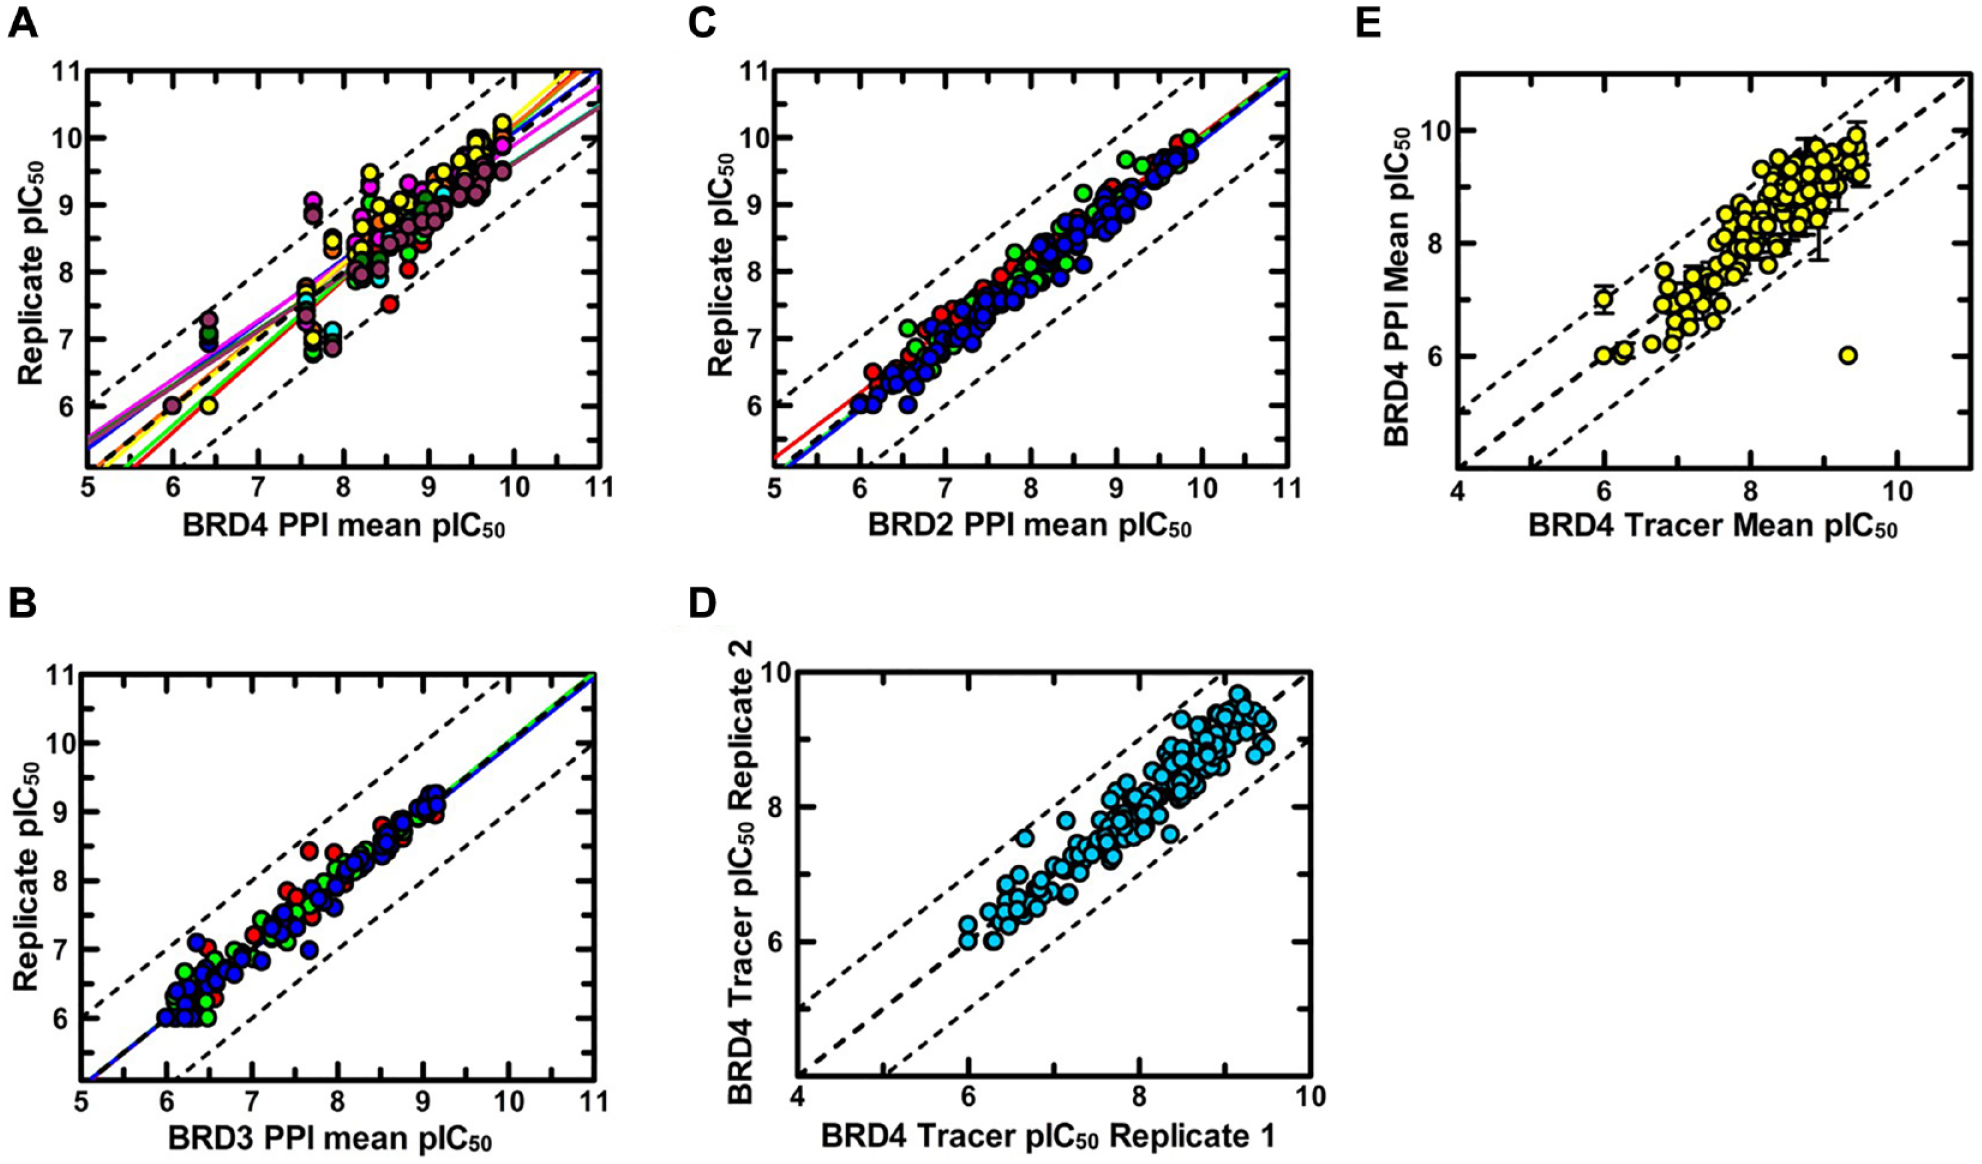
Reproducibility of BET NanoBRET target engagement assays. (
Although integrating and embedding drug–target engagement assays will enhance confidence in ligand mechanism of action and efficacy, it is essential to link the specificity and affinity of ligand–target interaction to complex cellular phenotypic endpoints. BET proteins, by binding to acetylated lysine residues in histones and transcription factors, regulate the expression of key genes in the inflammatory response, such as the pro-inflammatory cytokine IL-6 and chemokines CCL2/MCP-1 and CCL5/RANTES, which in turn facilitate the recruitment of pro-inflammatory immune cells to the sites of physiological damage.15,16,44 We therefore developed two primary cell phenotypic 96-well cytokine release assays to measure the secretion of MCP-1 from both whole blood cell and PBMC assay systems. For the measurement and quantification of MCP-1 secretion, we utilized two methodologies: an electro-chemical enzyme-linked immunosorbent assay, using the MesoScaleDiscovery (MSD) platform and a bead based immunoassay method, specifically the BD Cytometric Bead Array (CBA) technology. The BD CBA methodology has provided an enabling technology for high-throughput multiplexed cytokine profiling at GSK, as we are able to screen large numbers of molecules at a cost-effective price while maintaining the sensitivity and large dynamic range that MesoScaleDiscovery technology provides (see

Inhibition of a BET-driven, downstream phenotypic response correlated with BRD4 primary profiling and target engagement assays. (, ;
;  ,
, ;
;
First, we correlated the BRD4–Histone H3.3 PPI data with the phenotypic MCP-1 release data and were able to demonstrate a correlation between the differing cellular assay systems (

Application of screening strategies refined with BET to a non-BET BD, CECR2. () or BRD-647 ( ) and detection of FP signal change. Data fitted to the Hill–Langmuir equation (eq 1). (
 ) or bromosporine (
 ) from 100 μM and measuring the inhibitory effect on the CECR2 interaction with BRD-647. Data fitted to a four-parameter logistic equation (eq 2). (
 , compound 17), iCECR2-2 (
 ), and iCECR2-3 (
 ), which are all related to GNE-886, an inhibitor of CECR2, disclosed by Crawford et al. in 2017.
49
Data measured as mB units and then normalized to microplate control populations before fitting the percentage inhibition data to a four-parameter logistic equation (eq 2).
), which are all related to GNE-886, an inhibitor of CECR2, disclosed by Crawford et al. in 2017.
49
Data measured as mB units and then normalized to microplate control populations before fitting the percentage inhibition data to a four-parameter logistic equation (eq 2).
Taken together, these data demonstrate the opportunity for utilizing such NanoBRET target engagement assays at high throughput to provide a more detailed mechanistic understanding of ligand–target selectivity profiles. One could envisage such assay approaches being utilized to drive selectivity across differing protein members to improve ligand specificity and efficacy. Furthermore, such approaches are able to bridge the biological gap between assaying isolated binding interactions and complex phenotypic physiological outcomes to directly link drug mechanism of action to physiological endpoints within intact cellular systems.
Broader Implementation Across the Epigenetic Landscape—Opportunities to Probe Ligand Function Where a Phenotypic Screen Is Absent
The above data, focused on the BET family of proteins, clearly demonstrate an intricate link between intracellular target engagement and phenotypic endpoints. With this in mind, we proposed that such cell-based target engagement assays could prove valuable in screening for ligands whereby a defined phenotypic assay for that target is unavailable. To investigate this, we developed both recombinant, purified protein, TR-FRET and intracellular NanoBRET tracer assays to allow a comparison between biochemical and cellular target engagement profiles for the BRD of a non-BET protein. The BRD of cat eye syndrome chromosome region candidate 2 (CECR2) 46 was selected as the subject of this study. CECR2 is involved in the heterodimeric chromatin remodeling complex CERF (CECR2-containing remodeling factor) and is believed to have an important function in DNA damage response.47,48 The biological role of the CECR2 BRD remains to be fully characterized and, until recently, the paucity of selective tools has hindered efforts to elucidate its function. The recent discovery of potent and selective inhibitors by Crawford et al. will enable more detailed biological studies in the future and, in the context of this study, provided small-molecule benchmarks, alongside GSK proprietary compounds (Lucas et al., data not shown), for the aforementioned TR-FRET and NanoBRET assays. 49
Configuration of a tracer-based TR-FRET assay, utilizing either Alexa Fluor 647-conjugated versions of a GSK proprietary compound or bromosporine, BRD-647 and BSP-647, respectively, began with determination of Kd for the interactions between these probes and the BRD of CECR2. Previously, bromosporine has been reported as a potent, nonselective CECR2 BRD-interacting compound.
50
The data presented in
Figure 5A
demonstrate that binding was detected with both tracers, with Kd values of 540.70 ± 28.10 nM and 184.32 ± 11.18 nM determined for BRD-647 and BSP-647, respectively. We next developed a TR-FRET assay utilizing BRD-647 and observed that competition with either the parent compound of BRD-647 or bromosporine yielded IC50 values of 145.59 ± 11.22 nM and 73.49 ± 4.84 nM, respectively (
In order to configure a CECR2 target engagement assay, the bromosporine tracer BSP-647 was used to monitor binding to NanoLuc-fused full-length CECR2. The initial configuration of this NanoBRET tracer assay involved the titration of BSP-647, which yielded a saturation binding curve (
Fig. 5C
). The Kd value determined from this NanoBRET experiment was 110.13 ± 12.30 nM, which is in agreement with the Kd value determined by FP using the purified CECR2 BRD (
Collectively, the above data highlight a novel approach to utilize combinatorial biochemical and cellular target engagement screening to identify and optimize molecules against a protein of interest where a defined cellular phenotypic readout is absent. Furthermore, application of this type of strategy can enable the identification of potent, selective, and cell-penetrant probes to facilitate a deeper understanding of the biological roles that discrete domains such as CECR2 BRD play within a native cellular context.
Faithfully Representing the Native Intracellular Environment: HiBiT for Endogenous Tagging
The assay work described above utilized transient transfections of plasmid constructs to enable the assessment of drug–target engagement within a cellular context. Through the use of SILAC mass spectrometry, we were able to quantify the protein abundance of BRD4 in wild-type HELA cells, and HELA cells overexpressing BRD4 through transient transfection. We observed that in the overexpressed cells, the levels of BRD4 were approximately two- to threefold higher than the wild-type control cells (data not shown). Although it may be possible to further titrate the transiently expressed levels of BD proteins, we noted a loss of signal window when reducing the quantity of DNA transfected (data not shown). We therefore next sought to develop experimental systems that would bring us closer to assaying target engagement in the native biological context of a cell.
To investigate this, we have utilized the HiBiT technology developed by Promega that enables endogenous protein tagging with a small 11-amino-acid peptide. This peptide tag is capable of producing bright and quantitative luminescence through high-affinity complementation (Kd = 700 pM) with an 18 kDa subunit derived from NanoLuc (LgBiT).
51
Using CRISPR/Cas9, we have been able to demonstrate that HiBiT can be rapidly and efficiently integrated into the genome to serve as a reporter tag for the BRD4 protein within HEK293-wt cells (

Future development and refinement of BRD4 NanoBRET target engagement approaches. () or PBMCs ( ) and monitoring the effect on MCP-1 (y axis). Dashed lines are for reference and represent the following relationships: x = y, x = y + 1, or x = y – 1.
Such CRISPR-mediated HiBiT tagging of endogenous proteins provides a strategy for probing more physiologically relevant native biological mechanisms and enables a move away from the more traditionally used recombinant overexpression approaches. Furthermore, from an assay development stance, genome-edited NanoLuc-tagged proteins of interest provide a more stable level of expression that reduce both intra- and interassay variability, as well as opening up the possibility of carrying out such edits in more complex phenotypically relevant cell models such as induced pluripotent stem cells (iPSCs). Such data as that described above further helps to build confidence in using the HiBiT technology to monitor target engagement within future drug discovery programs.
Summary: Mind the Gap—Bridging Reductionist Biochemistry and Advanced Physiological Cellular Phenotypes through Target Engagement Approaches
Determining how, when, and where ligands engage their targets inside living cells is of key importance in pharmacological research to attribute compound efficacy to a defined mode of action. Traditionally, biochemical techniques have been used to detect protein–ligand interactions through purified protein assay systems, with more complex advanced cellular assay systems used to probe physiological outputs. In this report we describe the wide-scale use of Promega’s NanoBRET technology to develop target engagement assays within intact cellular systems to bridge this artificial biochemical-cellular gap within a traditional screening cascade. We feel that future screening strategies could utilize such target engagement approaches early in the drug discovery cascade as primary screening “workhorse” assays to understand and dial in ligand selectivity while concomitantly measuring efficacy. Such approaches may be key to increasing the success rates of molecule translation to the clinic.
Supplemental Material
2019_SLAS_DISCO_TEG_GSK_MS_FINAL_Version_191113_Supporting – Supplemental material for Cellular Target Engagement Approaches to Monitor Epigenetic Reader Domain Interactions
Supplemental material, 2019_SLAS_DISCO_TEG_GSK_MS_FINAL_Version_191113_Supporting for Cellular Target Engagement Approaches to Monitor Epigenetic Reader Domain Interactions by Alexander N. Phillipou, Charles S. Lay, Charlotte E. Carver, Cassie Messenger, John P. Evans, Antonia J. Lewis, Laurie J. Gordon, Mahnoor Mahmood, Luke A. Greenhough, Douglas Sammon, Aaron T. Cheng, Syandan Chakraborty, Emma J. Jones, Simon C. C. Lucas, Kelly M. Gatfield, David J. Brierley and Peter D. Craggs in SLAS Discovery
Footnotes
Acknowledgements
We thank Ryan Bingham, Melanie Leveridge, Daniel Thomas, and Sarah Nickolls for useful discussions regarding experimental design and comments on the manuscript. In addition, we thank Alan Nadin and Albert Isidro Llobet for preparation of the tracers used throughout this study. At the genesis of this work and throughout the study we have been ably supported by the Promega teams in both the United Kingdom and United States, most notably by Danette Daniels, Jacqui Mendez, Matt Robers, Jim Vasser, Kristen Riching, Cesar Corona, Craig Malcolm, and Ciaran Sewter. Finally, we thank Chun-Wa Chung, Emmanuel Demont, Alex Preston, Stephen Atkinson, and Paul Bamborough for their scientific input, support, and insightful discussions throughout the course of this work.
Supplemental material is available online with this article.
Declaration of Conflicting Interests
The authors declared the following potential conflicts of interest with respect to the research, authorship, and/or publication of this article: All authors are employed by GlaxoSmithKline, and their research and authorship of this article was completed within the scope of their employment with GlaxoSmithKline.
Funding
The authors received no financial support for the research, authorship, and/or publication of this article.
References
Supplementary Material
Please find the following supplemental material available below.
For Open Access articles published under a Creative Commons License, all supplemental material carries the same license as the article it is associated with.
For non-Open Access articles published, all supplemental material carries a non-exclusive license, and permission requests for re-use of supplemental material or any part of supplemental material shall be sent directly to the copyright owner as specified in the copyright notice associated with the article.