
Abstract
Histone deacetylases (HDACs) are epigenetic modulators linked to diseases including cancer and neurodegeneration. Given their therapeutic potential, highly sensitive biochemical and cell-based profiling technologies have been developed to discover small-molecule HDAC inhibitors. Ultimately, the therapeutic action of these inhibitors is dependent on a physical engagement with their intended targets in cellular and tissue environments. Confirming target engagement in the cellular environment is particularly relevant for HDACs since they function as part of cell type-specific multiprotein complexes. Here we implemented two recently developed high-throughput target engagement technologies, NanoBRET and SplitLuc CETSA, to profile 349 compounds in the Epigenetic-Focused collection for HDAC1 binding. We found that the two HDAC1 target engagement assays correlated well with each other and with orthogonal activity-based assays, in particular those carried out in cellular environments rather than with isolated HDAC proteins. The assays detected a majority of the previously described HDAC1 inhibitors in the collection and, importantly, triaged HDAC inhibitors known to target other HDACs.
Introduction
Histone deacetylase (HDAC) enzymes catalyze the removal of the acetyl group from ε-N-acetyl lysine residues on histones and nonhistone proteins. Human HDACs are classified into two major groups based on homology and mechanism of action. 1 The first group comprises the class I (HDAC1–3 and 8), class IIa (HDAC4, 5, 7 and 9), class IIb (HDAC6 and 10), and class IV (HDAC11) enzymes, which require Zn2+ for catalytic activity. The second group comprises class III enzymes, called sirtuins (SIRT1–7), which require nicotinamide adenine dinucleotide (NAD+) as a co-substrate. HDACs form the catalytic core of large protein complexes involved in chromatin remodeling and are considered important epigenetic factors. Deacetylation of histones by HDAC action leads to chromatin condensation and repression of gene expression. 1 Importantly, aberrant HDAC expression has been implicated in various diseases, including several cancer types, as well as various neurologic and neurodegenerative disorders.2–5 Therefore, the development of HDAC inhibitors has been an intensive area of research for the past two decades.4,6 The majority of HDAC inhibitors lack selectivity and target all HDACs (pan-inhibitors) or a subset of HDACs (class-selective inhibitors). To date, there are five Food and Drug Administration (FDA)-approved HDAC inhibitors: the pan-inhibitors vorinostat (SAHA), belinostat, and panobinostat, and the class I inhibitor romidepsin, for cancer indications (cutaneous T-cell lymphoma and multiple myeloma), and the class I and IIa inhibitor valproic acid for neurological disorders (migraine, epilepsy, and bipolar disorder). The development of isoform-selective inhibitors is of great interest, not only as chemical tools for dissecting the roles of specific HDACs, but also as potential therapeutics with limited side effects. Although challenging, several isoform-selective HDAC inhibitors, mainly targeting HDAC6, have recently been described.7–9
Multiple high-throughput profiling technologies have been developed to discover and characterize HDAC inhibitors.10,11 Highly sensitive biochemical assays are amenable to large compound library screens and can be used to determine compound potency and selectivity across a panel of HDAC proteins. Biochemical assays typically rely on purified HDACs (or HDAC fragments) and isolated histone substrates (small peptides, histones, nucleosomes). Multiple detection formats are available, including mass spectrometry, lysine-specific antibodies, and protease-coupled assays with fluorogenic or luminescent peptide substrates, to name a few. However, biochemical assays do not assess HDACs in their native multiprotein complexes. To this end, cell-based technologies have been developed to discover and characterize HDAC inhibitors in native environments. Two commonly used approaches are antibody-based assays to detect endogenous levels of acetylated lysine residues in intact cells or cell lysates (such as enzyme-linked immunosorbent assay [ELISA], AlphaLISA, LANCE, and high-content imaging) and cell-permeable fluorogenic or luminogenic HDAC substrates.10,11 While high-throughput, these assays are confounded by a myriad of indirect effects. More recently, mass spectrometry-based thermal profiling and chemoproteomic studies have been implemented to characterize HDAC inhibitor potency and selectivity in cells. These studies have not only identified off-targets but also demonstrated that the target engagement profile for HDAC inhibitors is different in a cellular context compared with isolated recombinant enzymes.12,13 Although powerful, mass spectrometry-based proteomic profiling assays are not amenable to the characterization of a large number of inhibitors. Two high-throughput-amenable methods for assessing HDAC engagement in cells have been recently reported: SplitLuc CETSA, a cellular thermal shift assay (CETSA) that detects compound-mediated thermal stabilization of targets using a split Nano Luciferase (NanoLuc) approach, 14 and NanoBRET, a commercially available assay that utilizes a fluorescent probe that is detected when in close proximity to a NanoLuc-labeled HDAC. 15 Although amenable to high-throughput settings, to our knowledge, these methods have not been applied to the profiling of large compound collections for HDAC binding. Here, we applied SplitLuc CETSA and NanoBRET assays to characterize HDAC target engagement using a collection of 349 small molecules enriched for epigenetic modulators. We focused on the class I member HDAC1 because of its therapeutic potential16–19 and the availability of high-throughput assays.14,15,20 We compared the HDAC1 target engagement results with biochemical and cell-based HDAC1 activity assays using a luminogenic peptide, as well as phenotypic cell viability assays.
Materials and Methods
Compounds
The Epigenetic-Focused compound collection contains 349 clinical- and preclinical-stage compounds that inhibit one or more epigenetic factors as well as nonepigenetic controls (
Cell Lines and Culture Conditions
HEK293T and HeLa cells were obtained from ATCC (Manassas, VA; CRL-1573 and CCL2, respectively). HEK293T and HeLa cells were cultured in Dulbecco’s modified Eagle’s medium (DMEM; 4.5 g/L glucose; Thermo Fisher, Waltham, MA) supplemented with 10% fetal bovine serum (FBS; Hyclone, GE Healthcare, Piscataway, NJ), 6 mM
HDAC-Glo I/II Enzymatic Assay
Recombinant human HDAC1 enzyme was purchased from Reaction Biology (Malvern, PA; cat. KDA-21-365) and mixed with the HDAC-Glo I/II Reaction Buffer (Promega, Madison, WI) at a final concentration of 10 nM. Three microliters of enzyme solution was dispensed into Greiner Bio-One (Monroe, NC) 1536-well, solid, white, medium-binding plates using the BioRaptr Workstation (Beckman Coulter, Fullerton, CA). Twenty-three nanoliters of compounds and controls (neutral control DMSO or positive control panobinostat at a final concentration of 46 µM; final DMSO concentration of 0.38%) were subsequently transferred via pintool (Wako Automation, Richmond, VA) and plates were incubated for 15 min at room temperature. Three microliters per well of HDAC-Glo I/II Reagent activated with Developer Reagents as per the manufacturer’s instructions were dispensed into the plates, and after a 30 min incubation at room temperature, luminescence intensity was measured using a ViewLux high-throughput CCD imager (PerkinElmer, Waltham, MA) equipped with clear filters.
HDAC-Glo I/II Cellular Assay
Five microliters per well of HEK293T or HeLa cells in growth media was seeded into Greiner 1536-well, solid, tissue culture (TC)-treated plates at a density of 2 × 10⁵ cells/mL. Following an overnight incubation to allow cell attachment, 23 nL of compound and controls (neutral control DMSO or positive control panobinostat at a final concentration of 27 µM; final DMSO concentration of 0.46%) was delivered via pintool transfer. The assay plates were then incubated for 1 h at 37 °C/5% CO2 before 5 µL of HDAC-Glo I/II Reagent activated with the Developer Reagent as the per manufacturer’s instructions was added using the Multidrop Combi Dispenser (Thermo Fisher). Luminescence intensity was measured using a ViewLux imager as above.
HDAC-Glo I/II Counterscreens
The HDAC-Glo I/II-coupled assay utilizes Ultra-Glo luciferase and ATP to quantify aminoluciferin substrate produced from the HDAC enzymatic reaction. The CellTiter-Glo (Promega) assay contains the same Ultra-Glo luciferase and a luciferin substrate but lacks ATP. To profile the effect of the compound collections on Ultra-Glo luciferase, 3 µL of CellTiter-Glo solution was dispensed into Greiner 1536-well, solid, white, medium-binding plates using the BioRaptr Workstation. Twenty-three nanoliters of compounds and controls (neutral control DMSO or positive control PTC124 at a final concentration of 46 µM; final DMSO concentration of 0.57%) was subsequently transferred via pintool and plates were incubated for 15 min at room temperature. One microliter per well of an ATP solution in growth media (final concentration of 10 µM) was dispensed into the plates, and after a 30 min incubation at room temperature, the luminescence intensity was measured using a ViewLux high-throughput CCD imager equipped with clear filters.
In addition to inhibition of luciferase activity, reduction in HDAC-Glo I/II signal could be attributed to acute compound-mediated cell death. To rule out assay artifacts due to acute cell death, we profiled the compound collection in a CellTiter-Glo cell viability assay as described below, with the difference that HEK293T cells were incubated with compounds for 1 h, the same time frame of the HDAC-Glo I/II assay.
CellTiter-Glo Viability Assay
Five microliters per well of HEK293T or HeLa cells in growth media was seeded into Greiner 1536-well, solid, TC-treated plates at a density of 1 × 10⁵ cells/mL using the Multidrop Combi Dispenser. Following a 5 h incubation to allow cell attachment, 23 nL of compound and controls (neutral control DMSO or positive control Digitonin at a final concentration of 27 µM; final DMSO concentration of 0.46%) was delivered via pintool transfer. After a 72 h incubation at 37 °C and 5% CO2, 3 µL of CellTiter-Glo Reagent was added to each well and luminescence was measured using the ViewLux imager as above.
HDAC1-86b SplitLuc CETSA
The HDAC1 open reading frame was cloned as an in-frame fusion to the 86b tag (C-term, GSVSGWRLFKKISGS) into the acceptor pcDNA3.1-86b C-terminal backbone using NheI/BamHI sites by PCR amplifying the coding region with InFusion-compatible oligonucleotides, as described before.14 Primers used are forward 5′-ACCCAAGCTGGCTAGCCACCATGGCGCAGACGCAGG-3′ and reverse 5′-AGCCACTCACGGATCCGGCCAACTTGACCTCCTCCT-3′. The source of DNA template was pDONR-223_HDAC1_WT (Addgene, cat. 82212). The fusion construct was sequenced and SplitLuc CETSA was performed as described.14 Briefly, cells were transfected in T75 flasks using a reverse transfection procedure, where 9 mL of Opti-MEM containing Lipofectamine 2000–DNA complex (45 μL and 22.5 μg, respectively) was combined with 10 mL of cell suspension (1 × 10⁶ cells/mL, 10 million cells total). After 24 h, cells were harvested by trypsinization and resuspended at a density of 3 × 10⁵ cells/mL. Cells were dispensed (5 μL cells/well) into cyclic olefin polymer 1536-well white plates (Aurora Microplates, Whitefish, MT) using a Multidrop Combi. Following an overnight incubation at 37 °C and 5% CO2, 23 nL of compounds or controls (neutral control DMSO or positive control panobinostat at a final concentration of 27 µM; final DMSO concentration of 0.46%) was pinned and plates were incubated for 1 h at 37 °C. Plates were heated at 49 °C for 9 min using a heating block. One microliter of 6% NP40 with 6× protease inhibitor cocktail was added per well, and plates were incubated for 15 min to allow cell lysis followed by the addition of 3 μL of 11S (final concentration of 100 nM), 0.5× furimazine substrate, and 1× protease inhibitor cocktail. Plates were centrifuged and analyzed for luminescence intensity using a ViewLux reader.
Nano Luciferase Counterscreen
Artifacts of the SplitLuc CETSA and NanoBRET assay due to NanoLuc inhibition or 86b-11S complementation inhibition were assessed in a biochemical format as follows: 5 μL of growth media containing 86b (final concentration of 0.5 nM) and 1× protease inhibitor was dispensed into Greiner 1536-well, white, TC-treated assay plates using the Multidrop Combi. Twenty-three nanoliters of compound and positive control (neutral control DMSO and positive control cilnidipine at a final concentration of 39 μM; final DMSO concentration of 0.46%) were pinned into the assay plates. Following a 15 min incubation at room temperature, 1 μL of 6% NP40 with 1× protease inhibitor was dispensed into the plates using the Multidrop Combi. After a brief spin, 2 μL of 11S and furimazine (final concentrations of 100 nM and 0.5×) in growth media containing 1× protease inhibitor was added. After a 5 min incubation at room temperature, luminescence was measured using the ViewLux plate reader.
HDAC1 NanoBRET Assay
The NanoBRET Target Engagement HDAC Assay kit was purchased from Promega (cat. N2170) and used as follows: HEK293T cells were reverse transfected as described above with the HDAC1-NanoLuc FL Fusion Vector. Briefly, 9 mL of Opti-MEM containing Lipofectamine 2000–DNA–DNA carrier complex (45 μL of L2000, 2 μg of HDAC1-NanoLuc FL Fusion Vector, and 20 μg of DNA carrier) was added to a T75 cell culture flask. Ten microliters of HEK293T cells in suspension (1 × 10⁶ cells/mL) were then mixed and allowed to incubate for 24 h at 37 °C and 5% CO2. Cells were harvested and resuspended in phenol red-free Opti-MEM at a density of 2 × 10⁵ cells/mL, and 38 μL/well was dispensed into 384-well, white, solid-bottom, medium-binding assay plates (Corning, NY). The BioRaptr Workstation was then used to dispense 2 μL of 20× NanoBRET Tracer Reagent activated with Tracer Dilution Buffer at a 1:4 ratio, per the manufacturer’s instructions. Following a brief spin to ensure reagent mixing, the assay plates were pinned with 116 nL of compound and controls (neutral control DMSO and positive control panobinostat at a final concentration of 29 μM; final DMSO concentration of 0.28%) and incubated at 37 °C and 5% CO2 for 2 h before being equilibrated to room temperature for 15 min. The assay plates then received 20 μL of 3× Complete Substrate Plus Inhibitor Solution (1:166 dilution of NanoBRET Nano-Glo Substrate plus 1:500 dilution of Extracellular NanoLuc Inhibitor in phenol red-free Opti-MEM assay medium). Following a brief spin to remove bubbles, a PHERAstar plate reader (BMG Labtech, Ortenberg, Germany) equipped with the LUM 610 LP 450-48 module was used to measure the resulting emission wavelengths (donor emission 450 nm, acceptor emission 610 nm). The final BRET ratio was calculated by dividing the acceptor emission (610 nm) by the donor emission (450 nm).
Fluorescence Counterscreen
Artifacts of the NanoBRET assay due to intrinsic fluorescence in the 610 nm range were identified using the Tecan Infinite M1000 Pro (Mannedorf, Switzerland). Forty microliters of growth media was dispensed using the Multidrop Combi into Corning 384-well, white, solid-bottom, medium-binding assay plates, and 116 nL of compound was pinned into the plates (final DMSO concentration of 0.28%). Wells were excited at 450 nm and scanned for emission every 10 nm from 500 to 750 nm to generate a full emission spectrum.
qHTS Data Analysis and Statistics
The screening data were analyzed using software developed internally. Data from each assay were normalized plate-wise to corresponding intraplate controls as described previously. The same controls were also used for the calculation of the Z′ factor index for each assay.
Results
Compound Profiling in Activity-Based Assays Identifies HDAC1 Inhibitors with Cellular Potency
To carry out a comparative analysis of target engagement for HDAC1, we expanded on the previously described NCATS Epigenetic-Focused small-molecule collection.
14
The current collection contains a total of 349 small molecules, both commercially available and developed in-house, that have progressed through different stages of clinical and preclinical development (
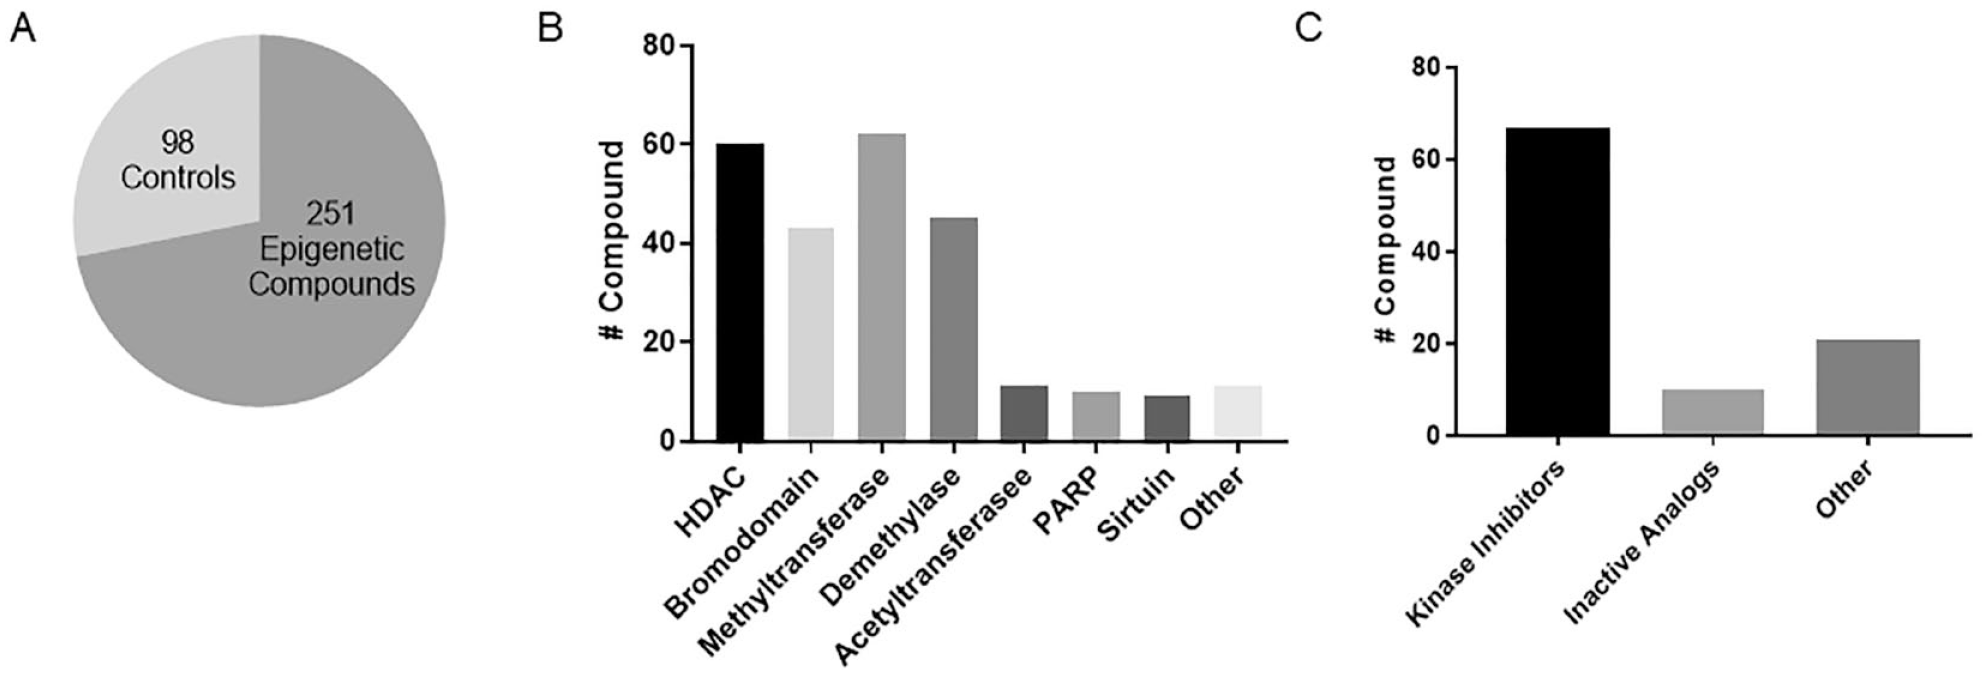
NCATS Epigenetic-Focused collection. (
We first sought to profile the Epigenetic-Focused library in biochemical and cellular HDAC1 activity-based assays. For this purpose, we used the commercially available HDAC-Glo I/II assay (Promega). The assay uses an acetylated, cell-permeable, luminogenic peptide substrate that can be deacetylated by the activity of HDAC class I and II enzymes. Deacetylation of the substrate is measured using a coupled enzymatic system that quantifies aminoluciferin. This assay is compatible with either purified enzymes, extracts, or cells. To test the Epigenetic-Focused collection, we miniaturized the HDAC-Glo I/II assay for quantitative high-throughput screening (qHTS) in 1536-well format as previously described.
20
Each compound was tested at 11 concentrations, which allowed us to generate CRCs directly from the screen. We then calculated AUC values,26,27 which take into account both compound potency and efficacy and standardize them to Z scores to identify compounds with robust bioactivity profiles (see Materials and Methods for analysis details and activity cutoffs). First, we profiled the library against purified human HDAC1 enzyme. This screen identified 47 compounds that inhibit HDAC1 activity. Excluding the BET bromodomain inhibitor RVX-208, the kinase inhibitor KW-2449, and the PARP inhibitor A-966492, all other hits were annotated HDAC inhibitors (
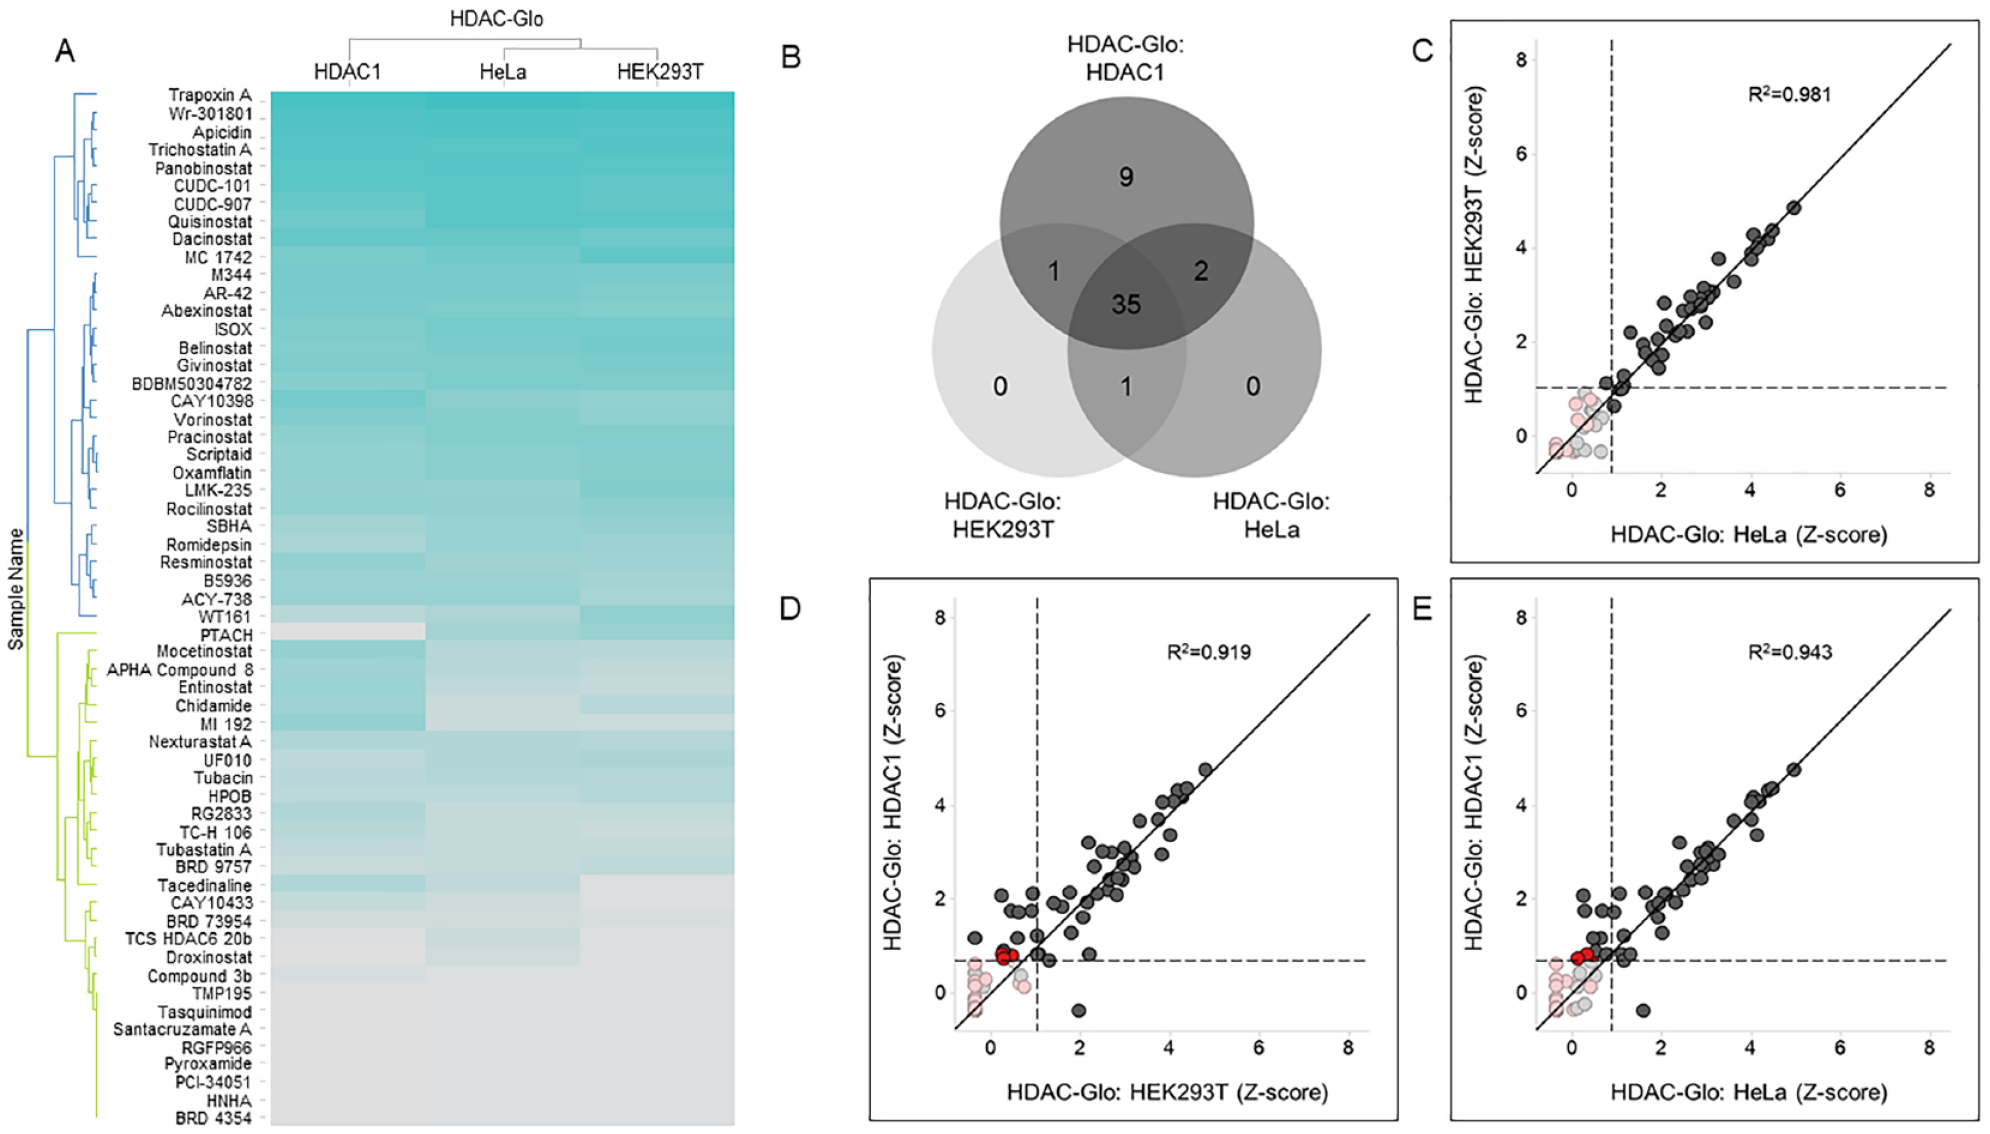
Compound profiling in HDAC1 activity-based assays. (
Compound Profiling in Target Engagement Assays Identifies On-Target HDAC1 Inhibitors
After profiling the Epigenetic-Focused collection in activity-based assays, we sought to characterize HDAC1 engagement in the cellular environment. The first cell-based target engagement assay implemented for HDAC1 was SplitLuc CETSA. CETSAs enable the detection of direct drug–target interactions by quantifying the changes in the thermal stability of proteins upon ligand binding in intact cells. We recently developed a homogeneous, standardized, target-independent and high-throughput CETSA platform that uses a split NanoLuc approach. In this platform, a 15-amino acid small fragment of NanoLuc (HiBiT variant, referred to as 86b) is appended to the target of interest and expressed in cells. Subsequent CETSA and addition of the complementing large fragment of NanoLuc allows for the detection of drug-bound thermally stable target. We have applied SplitLuc CETSA to C-terminal tagged HDAC1 (HDAC1-86b) in HEK293T cells and shown thermal stabilization of the target by the broad-spectrum inhibitor panobinostat as a proof of principle.
14
To test the Epigenetic-Focused collection, we miniaturized the HDAC1-86b SplitLuc CETSA for qHTS in 1536-well format as previously described. Of the 349 compounds tested, 35 showed thermal stabilization (at 49 °C) of HDAC1-86b. Importantly, all active compounds are annotated HDAC inhibitors, indicating that the assay did not detect any spurious activity (
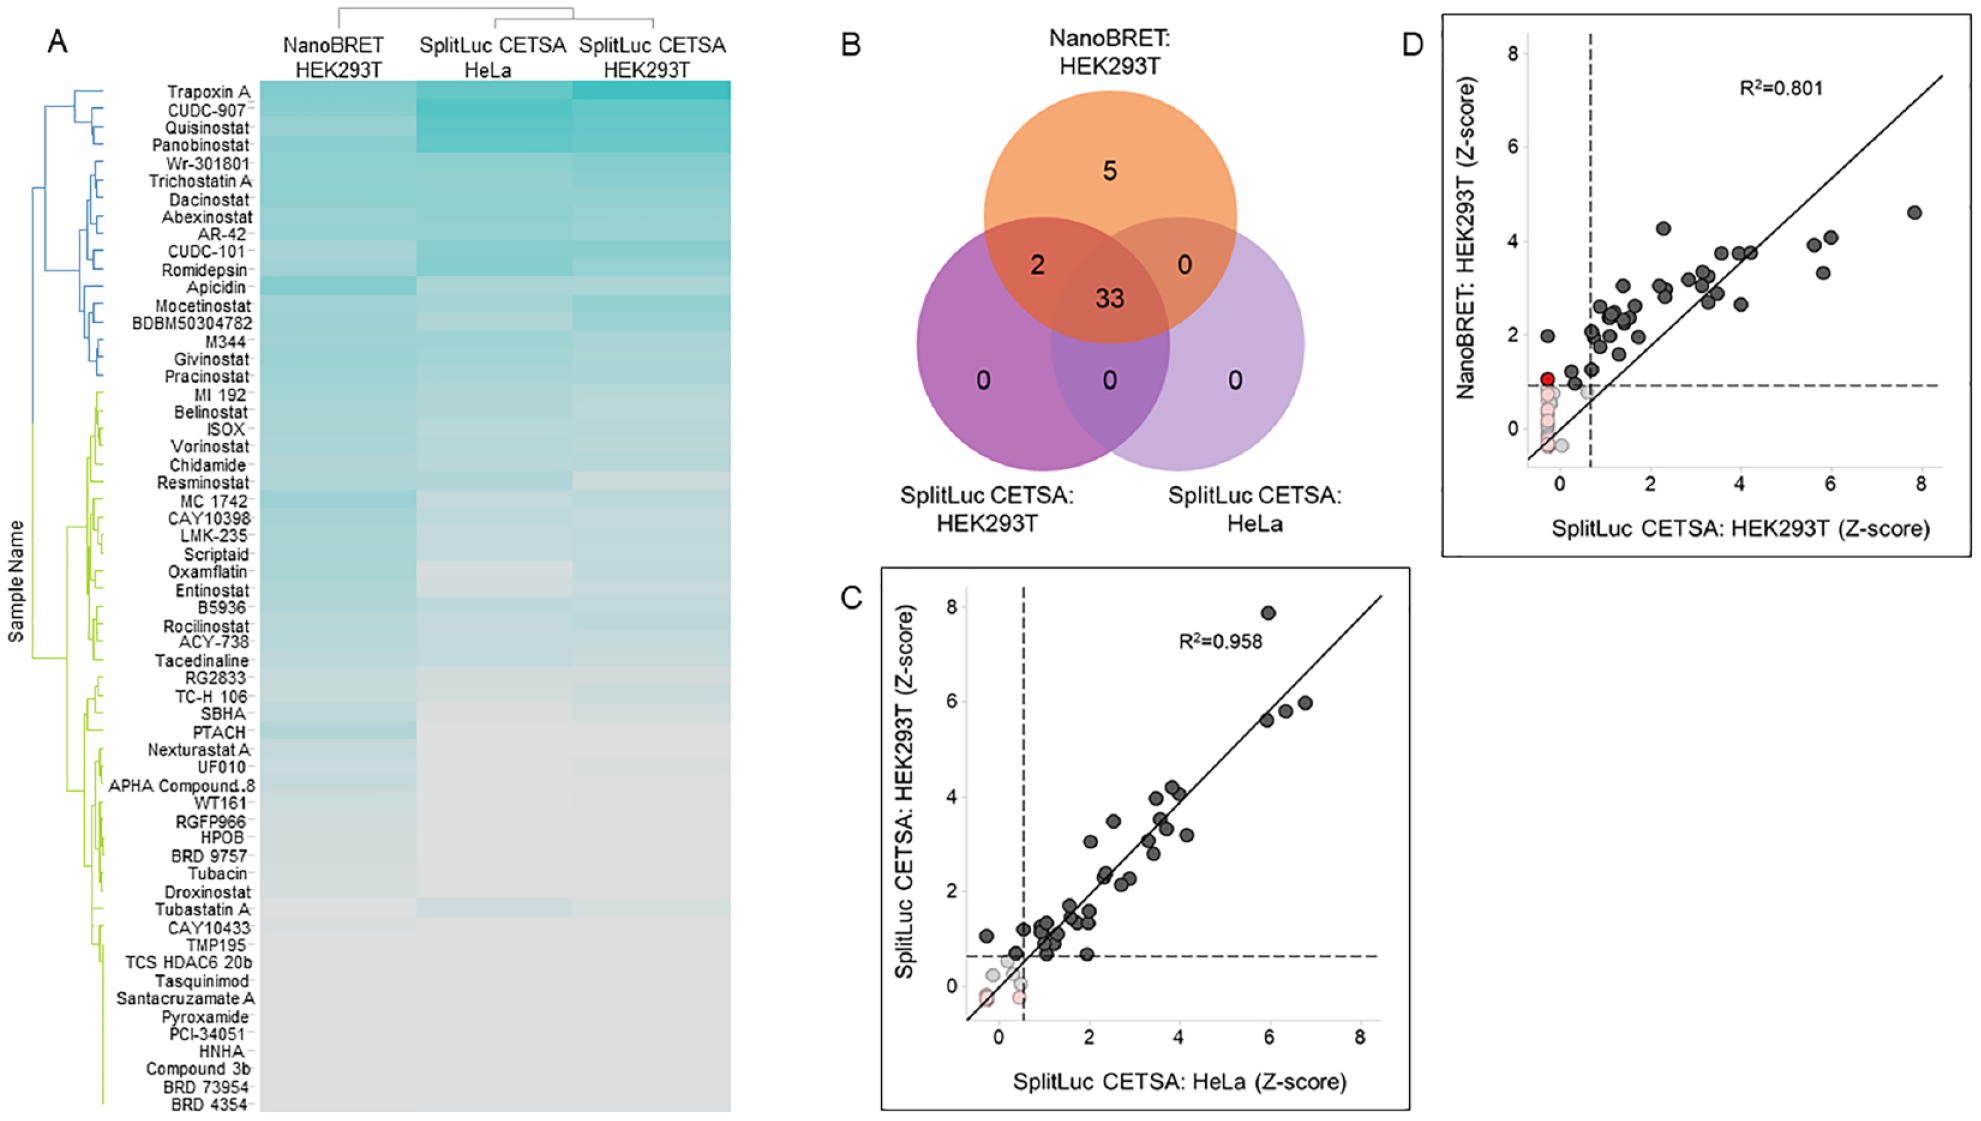
Compound profiling in HDAC1 target engagement assays. (
Overall, cellular target engagement assays correlated well with activity-based assays for HDAC1, indicating that the majority of HDAC inhibitors identified in activity-based assays are on target (
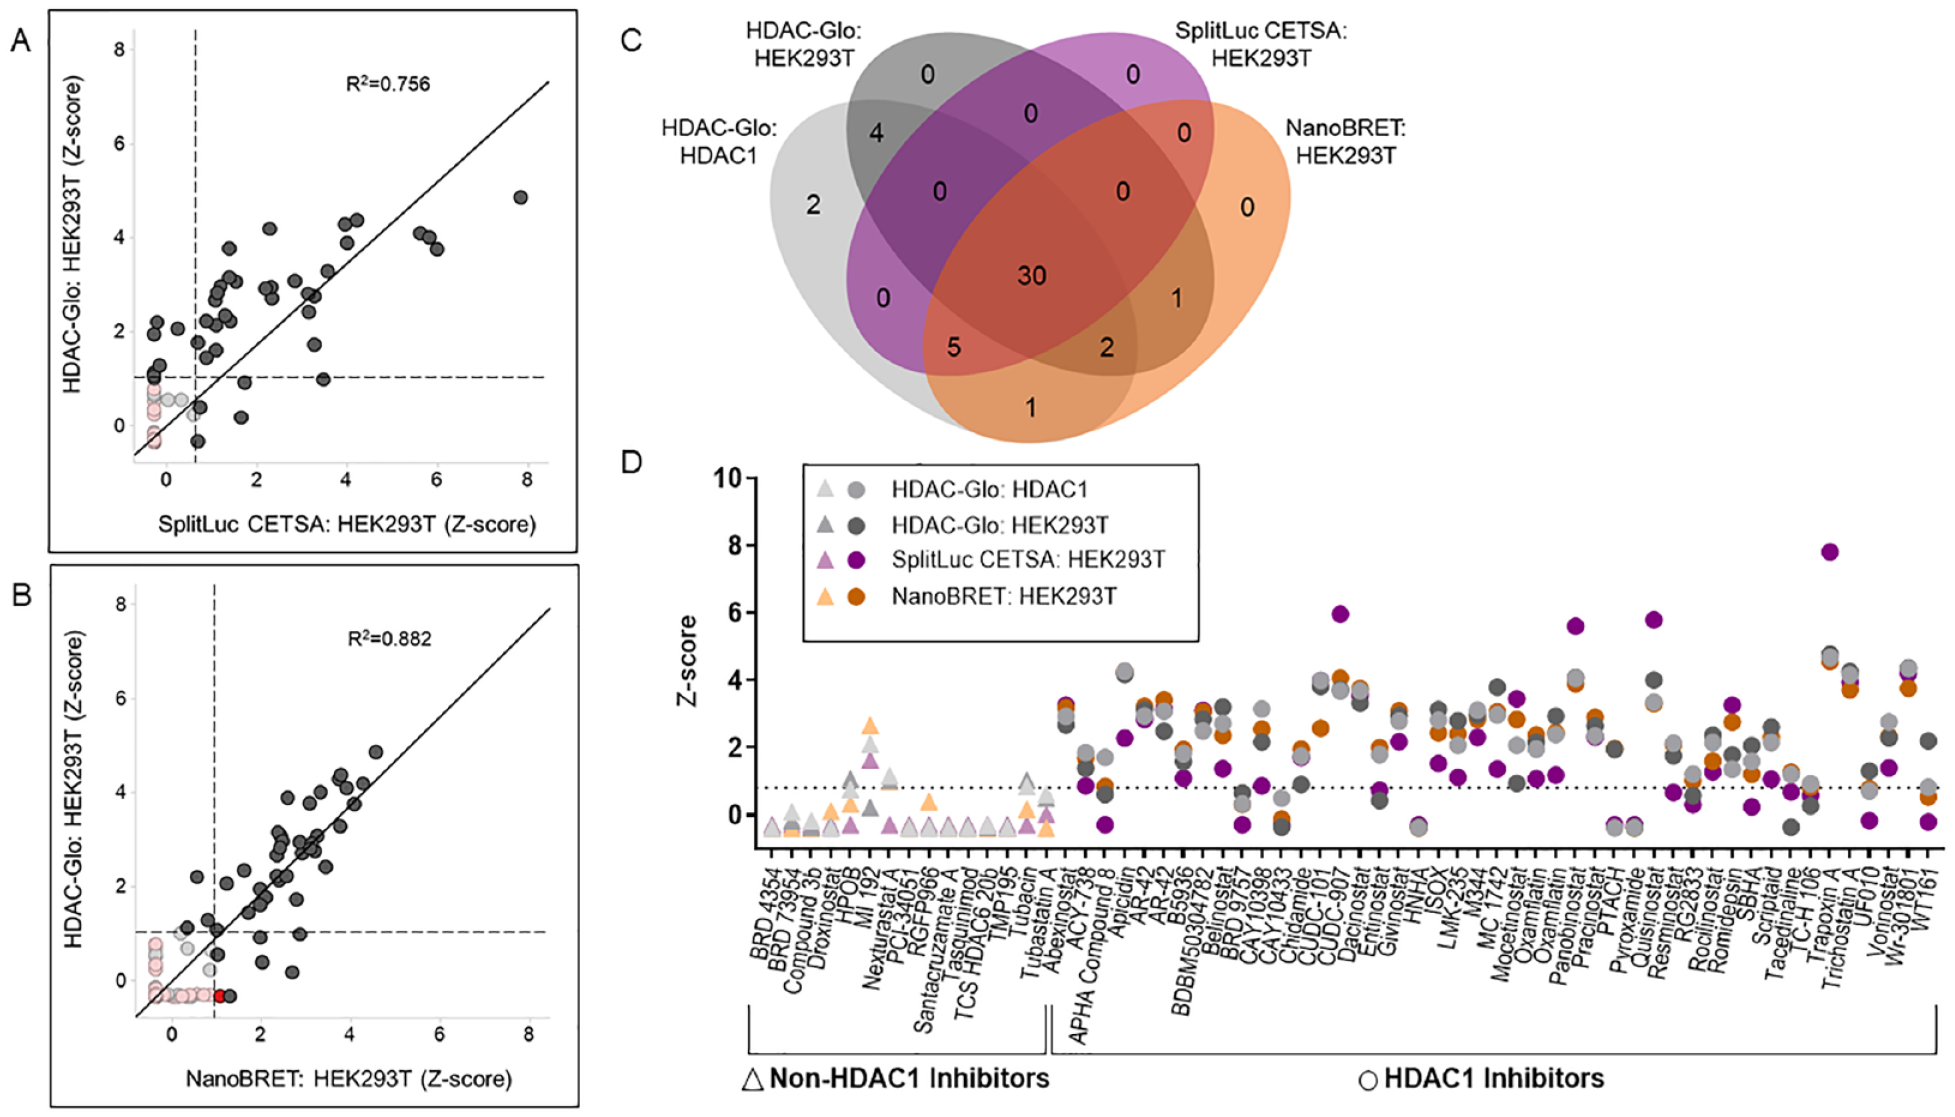
Comparison of HDAC1 activity-based and target engagement assays. (
Target Engagement Assays as Compound Triaging Strategies in Drug Discovery Campaigns
To assess these target engagement assays in the context of de novo drug discovery campaigns, we tested a set of potential HDAC inhibitors previously identified by Hsu et al.
20
Screening the NCATS Pharmaceutical Collection (NPC) of 2527 small-molecule drugs against the HDAC-Glo I/II assay in multiple cell lines, including HEK293T, the authors identified a set of potentially novel HDAC inhibitors. Based on availability, we selected 14 of these compounds, henceforward referred to as the “potential HDAC inhibitor set” (
Table 1
). The known SIRT inhibitors resveratrol and piceatannol were included in this set because they were not part of the Epigenetic-Focused collection. In accordance with Hsu et al., all compounds in the set were active in the HDAC1 biochemical HDAC-Glo I/II assay (passed the AUC activity cutoff as described in Materials and Methods;
Potential HDAC Inhibitor Set Identified in Hsu et al.
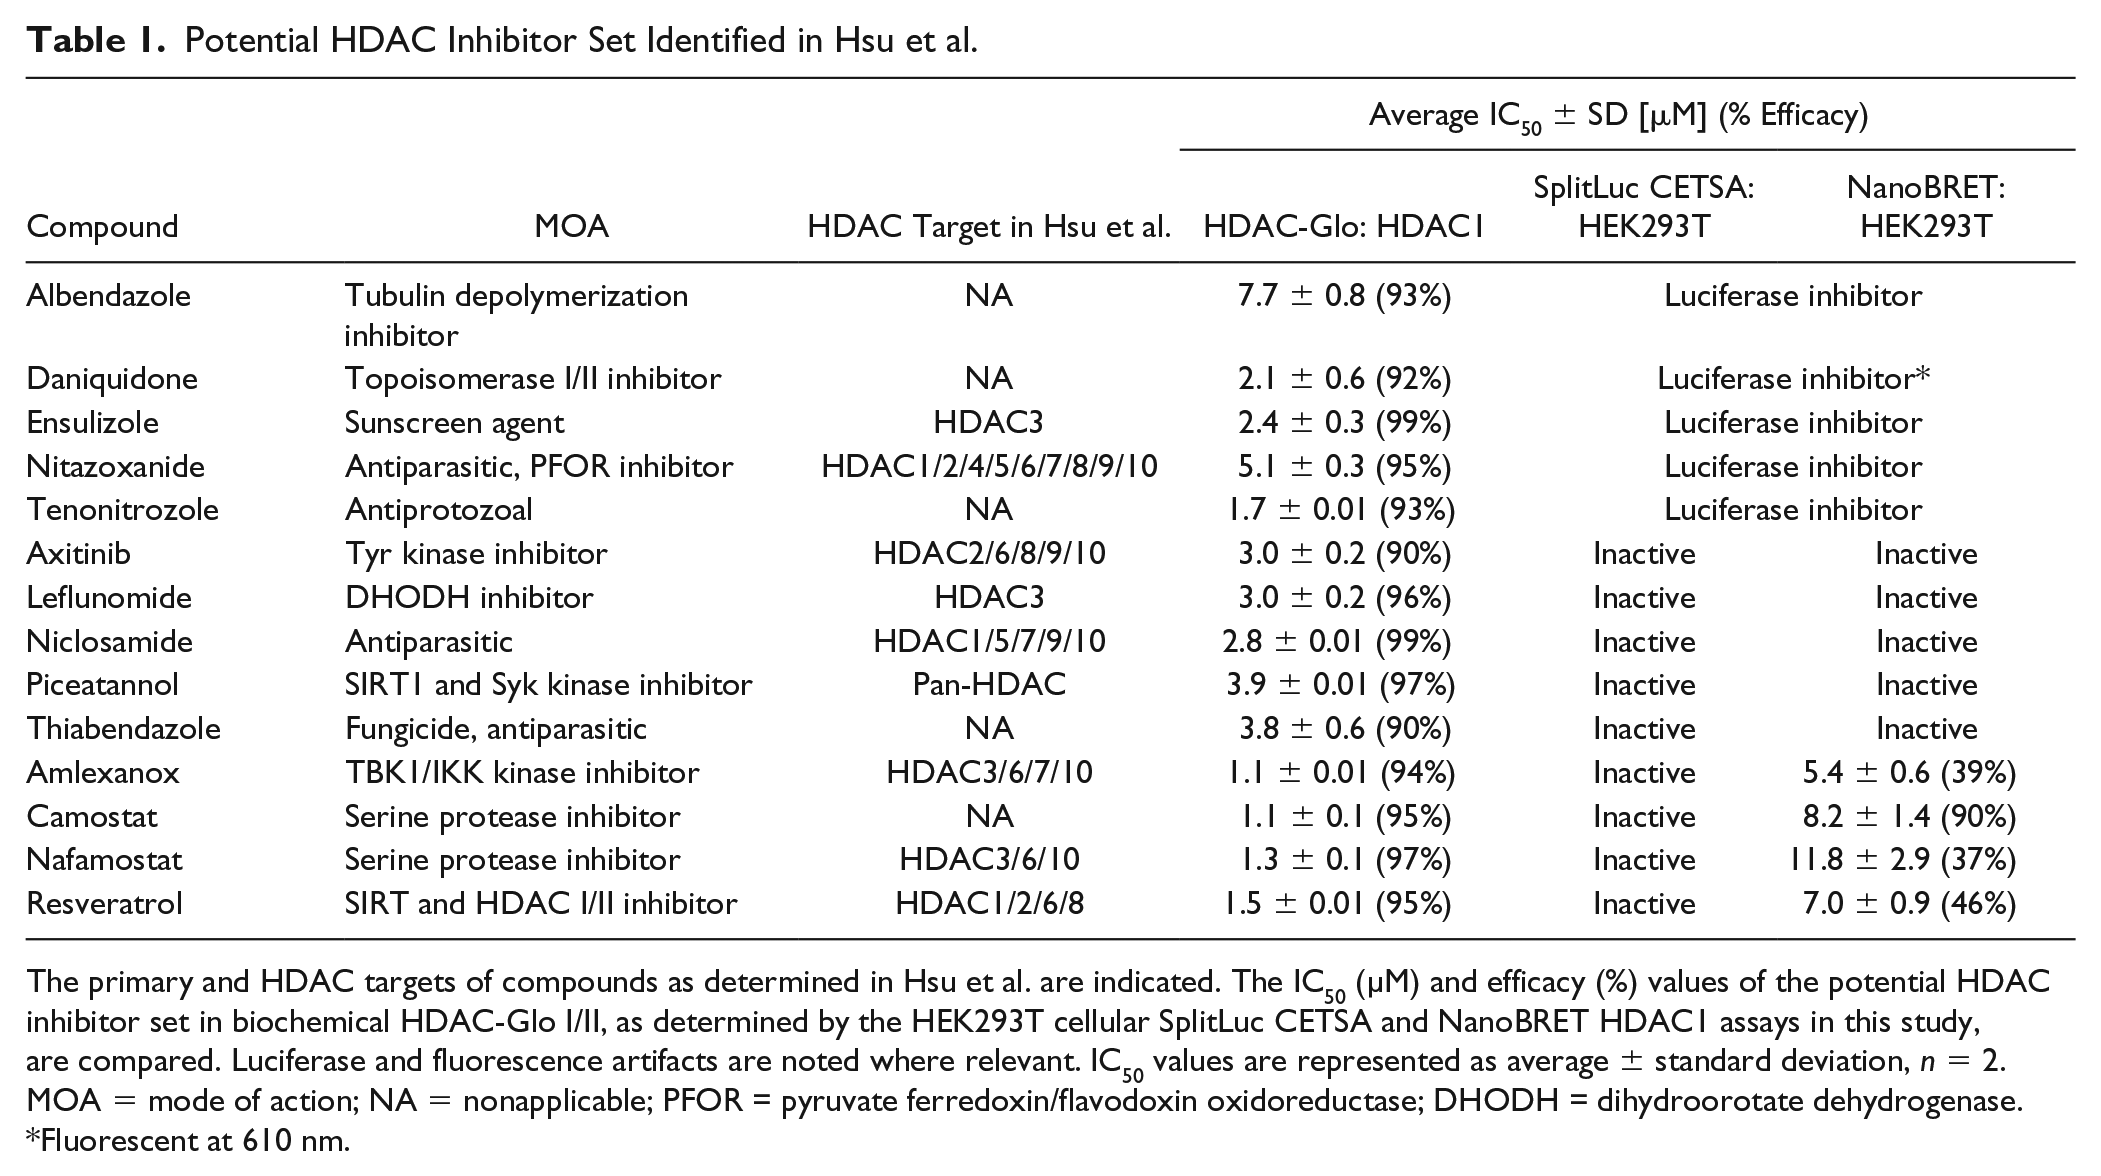
The primary and HDAC targets of compounds as determined in Hsu et al. are indicated. The IC50 (µM) and efficacy (%) values of the potential HDAC inhibitor set in biochemical HDAC-Glo I/II, as determined by the HEK293T cellular SplitLuc CETSA and NanoBRET HDAC1 assays in this study, are compared. Luciferase and fluorescence artifacts are noted where relevant. IC50 values are represented as average ± standard deviation, n = 2. MOA = mode of action; NA = nonapplicable; PFOR = pyruvate ferredoxin/flavodoxin oxidoreductase; DHODH = dihydroorotate dehydrogenase.
Fluorescent at 610 nm.
Compound Profiling in Phenotypic Assays
HDAC inhibitors, as well as other epigenetic modulators, can regulate the expression of cell cycle and tumor suppressor genes in cancer and in some cases normal cells, leading to a reduction in cell proliferation. In addition, HDAC inhibitors can influence cell viability by activating multiple cell death pathways.2,4–6,34 Therefore, to compare the HDAC1 target engagement results with a phenotypic viability readout, we profiled the Epigenetic-Focused collection using CellTiter-Glo. We found that 80 compounds, 39 of which are HDAC inhibitors, affect the viability of HEK293T cells. In the case of HeLa cells, 54 compounds reduce cell numbers, of which only 23 are annotated HDAC inhibitors. Activity in the cell viability assay correlates only moderately for the two cell lines (R2 = 0.622), indicating cell type-specific compound effects (
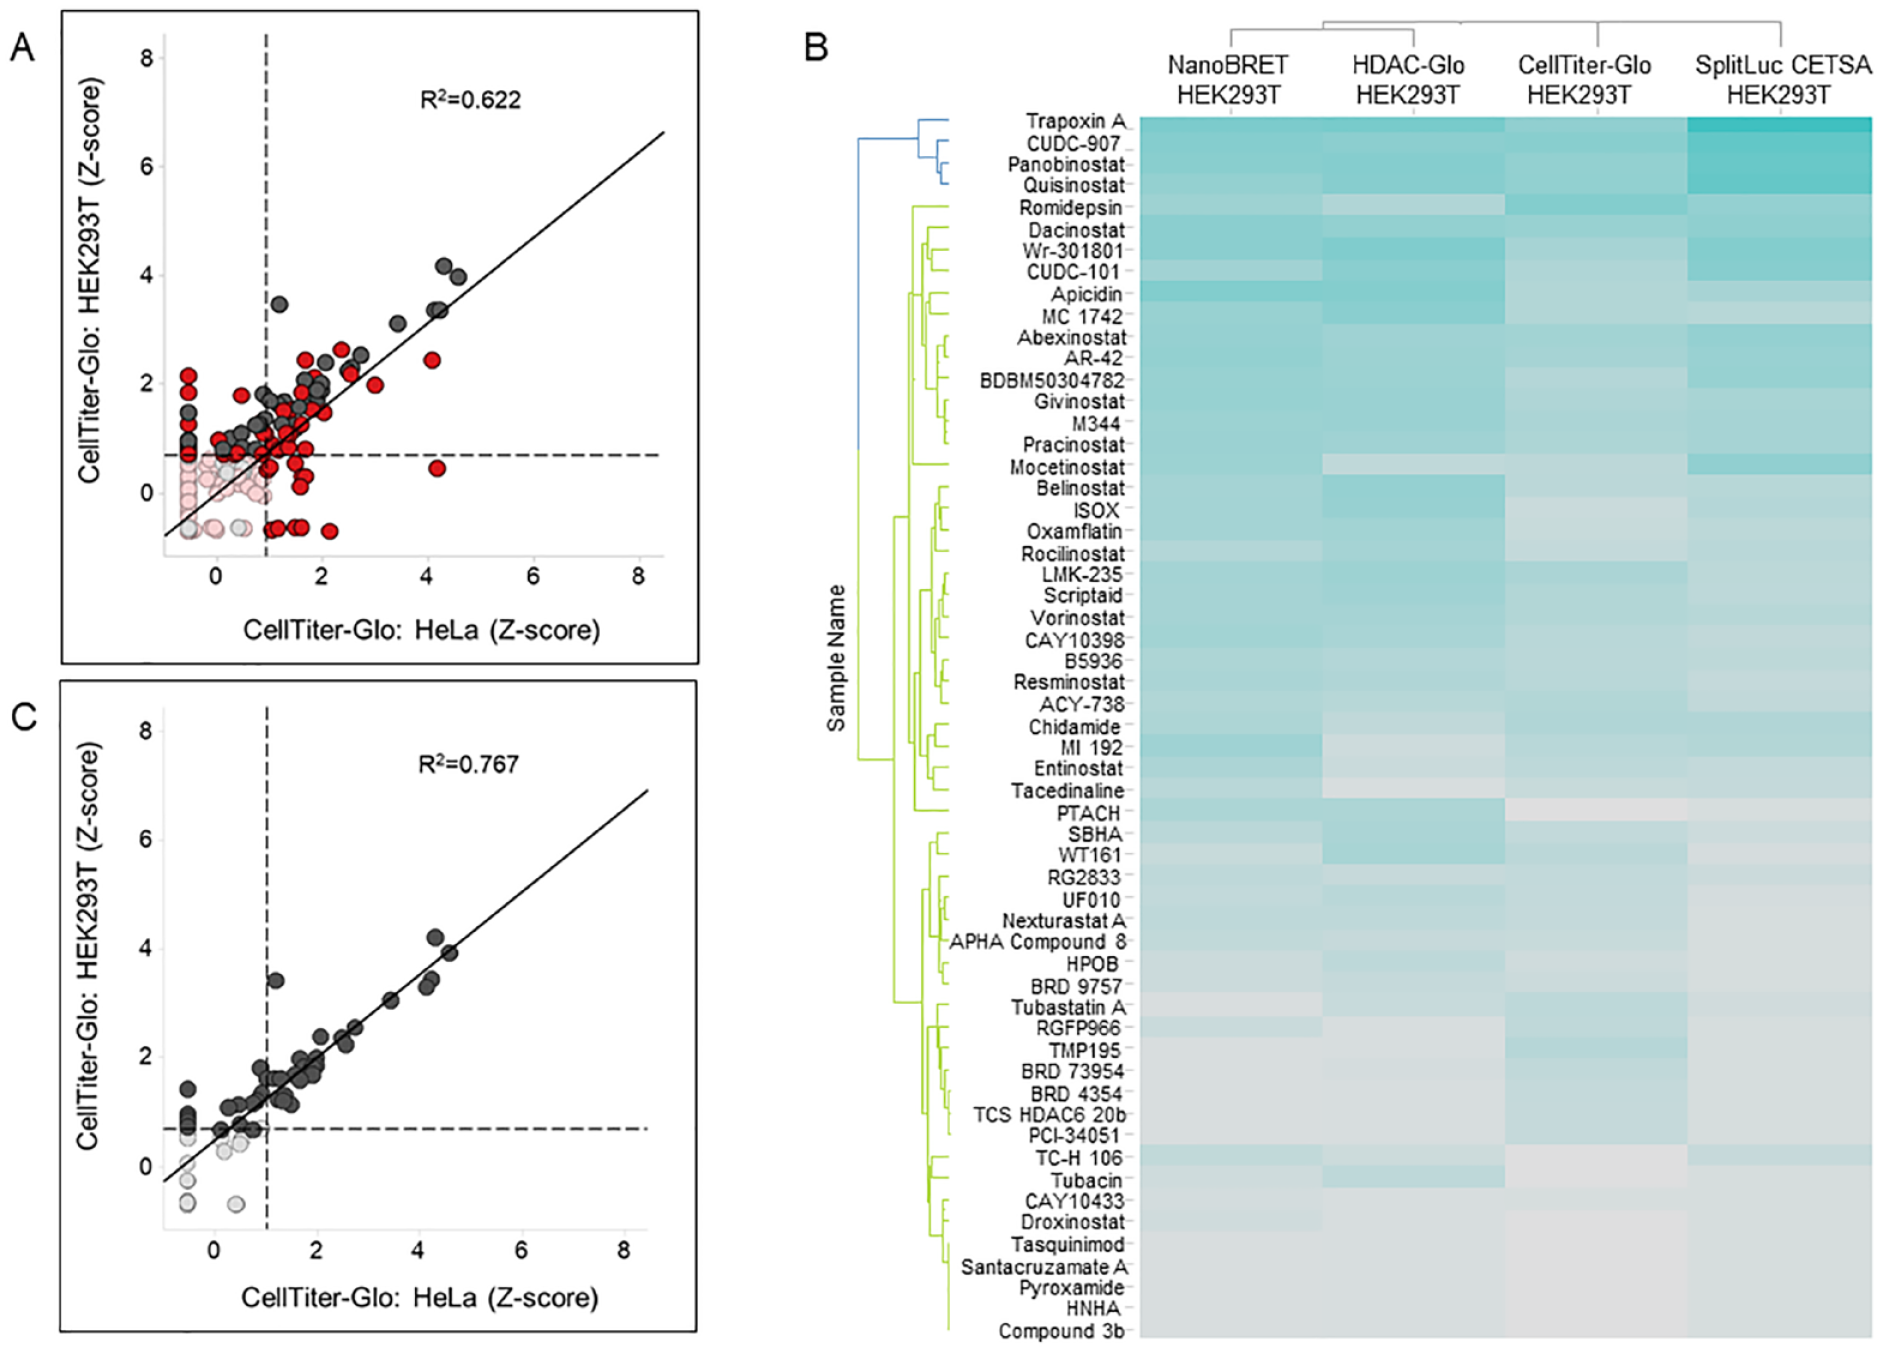
Phenotypic cell viability outcomes do not correlate with HDAC1 activity-based or target engagement assays. (
Discussion
In this study, we performed a comparative analysis of target engagement assays for HDAC1 against the Epigenetic-Focused collection of 349 compounds. Characterization of the compound library against isolated HDAC1 enzyme identified most HDAC inhibitors in the collection; however, it also identified non-HDAC inhibitors as targeting HDAC1. In contrast, an activity-based cellular assay utilizing the same substrate as the biochemical assay identified only HDAC inhibitors, highlighting the importance of assaying HDAC activity in the native cellular environment. A limitation of the activity-based cellular assay, however, is the inability to attribute observed activity to a specific HDAC protein. Protein-specific target engagement assays circumvent this limitation. The two HDAC1 target engagement studies implemented here, NanoBRET and SplitLuc CETSA, utilize exogenously expressed tagged HDAC1 protein. Although the incorporation of tagged HDAC1 in native multiprotein complexes has not been verified in this study, both assays correlated well with each other and with activity-based assays and detected mostly annotated HDAC inhibitors. Importantly, most inactive HDAC inhibitors are those specifically targeting other HDACs, indicating the ability of these assays to pick up on-target interactions. Although NanoBRET is more sensitive than SplitLuc CETSA, as it identified four additional compounds, it also detected a non-HDAC inhibitor, which might represent a false positive as this inhibitor did not affect HDAC1 enzymatic activity. These outcomes were also observed when we tested the set of potential HDAC inhibitors identified from the literature, as NanoBRET only identified very weak activity of four compounds—only one of them validated as an HDAC1 inhibitor. One factor contributing to the difference in sensitivity between assays is likely the expression levels of tagged HDAC1. While both assays rely on transfection of a tagged HDAC1 reporter from the cytomegalovirus (CMV) promoter, NanoBRET requires 10 times less DNA than SplitLuc CETSA. In contrast to SplitLuc CETSA, our attempts to miniaturize the NanoBRET assay to 1536-well format failed, which limited the throughput and increased the cost of the assay. One additional factor contributing to the difference between NanoBRET and SplitLuc CETSA outcomes is the potential of compounds to bind and inhibit HDAC1 without triggering thermal stabilization.
Finally, a comparison of activity-based and target engagement to phenotypic viability assays indicated a poor to moderate correlation between assays. This could be explained in part by the fact that epigenetic modifications lead to gene expression changes that might take a long time to manifest into quantifiable changes in cell proliferation/viability, which in turn might not be captured within the 72 h of compound exposure during our viability assay. However, when focusing on the set of annotated HDAC inhibitors, compound activity correlation between assays improved, suggesting that at least for HDAC1, compounds that faithfully inhibit enzymatic activity lead to reduced cell numbers.
To our knowledge, this is the first comparative study of HDAC1 target engagement for a compound collection of this size. From the perspective of a drug discovery campaign, our study suggests that both target engagements assays are suitable and have enough throughput to be used as validation screens. For example, an activity-based assay could be used to screen large compound collections, followed by SplitLuc CETSA or NanoBRET as validation of target engagement. Our study indicates that both NanoBRET and SplitLuc CETSA are able to identify relevant, on-target HDAC1–inhibitor interactions. Both assays will prove valuable to the discovery of HDAC1-specific inhibitors, which to date have not been described. In the future, it will be interesting to compare these two technologies for other epigenetic and nonepigenetic targets.
Supplemental Material
Supplemental_Material-Asawa_et_al – Supplemental material for A Comparative Study of Target Engagement Assays for HDAC1 Inhibitor Profiling
Supplemental material, Supplemental_Material-Asawa_et_al for A Comparative Study of Target Engagement Assays for HDAC1 Inhibitor Profiling by Rosita R. Asawa, Alexey Zakharov, Taylor Niehoff, Ata Chitsaz, Ajit Jadhav, Mark J. Henderson, Anton Simeonov and Natalia J. Martinez in SLAS Discovery
Supplemental Material
Supplementary_Table_1_Asawa_et_al – Supplemental material for A Comparative Study of Target Engagement Assays for HDAC1 Inhibitor Profiling
Supplemental material, Supplementary_Table_1_Asawa_et_al for A Comparative Study of Target Engagement Assays for HDAC1 Inhibitor Profiling by Rosita R. Asawa, Alexey Zakharov, Taylor Niehoff, Ata Chitsaz, Ajit Jadhav, Mark J. Henderson, Anton Simeonov and Natalia J. Martinez in SLAS Discovery
Footnotes
Acknowledgements
We thank Carleen Klumpp-Thomas and Jamie Travers for assistance with assay automation; the NCATS compound management group for sourcing, quality control, formatting, and the plating of all compounds; Kelli Wilson and Jacob Roth for assistance with Spotfire analysis; and Hui Guo for data loading.
Supplemental material is available online with this article.
Declaration of Conflicting Interests
The authors declared no potential conflicts of interest with respect to the research, authorship, and/or publication of this article.
Funding
The authors disclosed receipt of the following financial support for the research, authorship, and/or publication of this article: This work was supported by the intramural research program of the National Center for Advancing Translational Sciences (NCATS), National Institutes of Health (NIH).
References
Supplementary Material
Please find the following supplemental material available below.
For Open Access articles published under a Creative Commons License, all supplemental material carries the same license as the article it is associated with.
For non-Open Access articles published, all supplemental material carries a non-exclusive license, and permission requests for re-use of supplemental material or any part of supplemental material shall be sent directly to the copyright owner as specified in the copyright notice associated with the article.