
Abstract
Cell-based phenotypic screening is a commonly used approach to discover biological pathways, novel drug targets, chemical probes, and high-quality hit-to-lead molecules. Many hits identified from high-throughput screening campaigns are ruled out through a series of follow-up potency, selectivity/specificity, and cytotoxicity assays. Prioritization of molecules with little or no cytotoxicity for downstream evaluation can influence the future direction of projects, so cytotoxicity profiling of screening libraries at an early stage is essential for increasing the likelihood of candidate success. In this study, we assessed the cell-based cytotoxicity of nearly 10,000 compounds in the National Institutes of Health, National Center for Advancing Translational Sciences annotated libraries and more than 100,000 compounds in a diversity library against four normal cell lines (HEK 293, NIH 3T3, CRL-7250, and HaCat) and one cancer cell line (KB 3-1, a HeLa subline). This large-scale library profiling was analyzed for overall screening outcomes, hit rates, pan-activity, and selectivity. For the annotated library, we also examined the primary targets and mechanistic pathways regularly associated with cell death. To our knowledge, this is the first study to use high-throughput screening to profile a large screening collection (>100,000 compounds) for cytotoxicity in both normal and cancer cell lines. The results generated here constitute a valuable resource for the scientific community and provide insight into the extent of cytotoxic compounds in screening libraries, allowing for the identification and avoidance of compounds with cytotoxicity during high-throughput screening campaigns.
Keywords
Introduction
The development of new chemical probes enables therapeutic target validation, hypothesis testing, and new insight into the biological role of genes and proteins.1–3 At the National Institutes of Health (NIH) National Center for Advancing Translational Sciences (NCATS), the development of small-molecule probes for the scientific community allows understanding of rare and neglected diseases and novel targets and enables basic biological understanding of the “undrugged” genome. This is accomplished through a team science approach that begins with assay development and automated quantitative high-throughput screening (qHTS) with a small-molecule library to identify active hits. 4 One or more chemotypes that emerge in a qHTS campaign may progress to medicinal chemistry to develop a small-molecule probe with strong biochemical and/or cell-based activity, specificity, and optimized properties to enable use in in vivo models. To accommodate unbiased qHTS discovery for medicinal chemistry, large libraries of small molecules are created and curated, containing molecules that capture diverse chemical space that are synthetically tractable. These large libraries of small molecules are generally referred to diversity libraries or collections. 5
A second significant discovery screening strategy involves the creation of libraries of annotated small molecules. Annotated libraries contain drugs, probes, and tool molecules with one or more known mechanisms of action. 6 They have emerged as information-rich databases to integrate both biological and chemical data. These can be screened in (primarily) cell or organism-based assays to identify targets relevant to a phenotype or for potential drug repurposing. 7 Although compounds in a diversity library are expected to demonstrate weak biological activity, annotated libraries by definition are medicinal chemistry-optimized products with known activity and, in many cases, known mechanism of action (MOA). Both diversity collection and annotated library screening are important components of the NCATS Chemical Genomics Center (NCGC) program. 8
Throughout a qHTS campaign, the activities of hits are confirmed in a retest, and a number of orthogonal and counterassays are performed to confirm that the observed modulatory activity of is on target. This is also to ensure that compounds demonstrating artifactual activity in an assay are triaged. For example, biochemical and cell-based assays that use firefly luciferase (fLuc) are sensitive to compounds that modulate luciferase activity. 9 To ensure this is not the case, the screening libraries at NCATS are profiled for inhibitory activity of fLuc, allowing compounds that interfere with luciferase to be automatically triaged from hit lists without the need for additional screening. In one study, it was shown that ~5% of compounds in a qHTS library inhibit fLuc. 10 Perhaps the most notorious example of the need to perform counterassays is the drug ataluren (PTC124), approved for treatment of patients with Duchenne muscular dystrophy, that may have been discovered due to fLuc inhibition rather than on-target activity. 11
A resurgence in cell-based screening, both target based and phenotypic, means that an increasing number of cell-based qHTS campaigns are performed. Although a number of phenotypic screening approaches to library profiling have been taken,12–23 the profiling of a big library using direct cytotoxicity readout is less frequently reported. An early report of the assessment of compound cytotoxicity across a library of 1408 compounds appears in the literature, 24 and more recently, two studies examining cell killing with multiplexed assays were reported: one using a high-content assay against a screening library (diversity) of ~12,000 compounds 25 and the other using a multiplex assay against ~10,000 environmental toxins. 26 A significant collection of disease-agnostic annotated small molecules exist in libraries at NCATS, including a collection of drugs approved by American, European, and Japanese therapeutic regulatory agencies (such as the NCATS Pharmaceutical Collection 27 ) and many small molecules reported as tools, probes, or clinical/preclinical candidates. Understandably, a significant proportion of these molecules arose from oncology programs, and a portion of NCATS’s collaborations are oncology-related phenotypic screens. We were motivated to profile the activity of our annotated libraries for two reasons: first, to allow scientists to have a reference data set for discerning compounds whose activity is selective for cancer cell lines versus a set of noncancer normal cell lines and, second, to enable scientists to discriminate promiscuous/cytotoxic compounds when reviewing data from cell-based/phenotypic assays and provide valuable input for prioritizing compounds for further evaluation.
To this end, we assessed the cytotoxicity of NCATS annotated libraries of nearly 10,000 compounds against four normal cell lines (HEK 293, NIH 3T3, CRL-7250, and HaCat) and a cancer cell line (KB 3-1, a HeLa subline) and examined the hit rates and mechanistic pathways regularly associated with cell death. Furthermore, we assessed that activity of a diversity library (>100,000 compounds) against two normal cell lines (HEK 293 and NIH 3T3), assessed hit rate, and compared active compounds against a cancer cell line (KB 3-1). This study provides insight into the extent of cell-based killing activity in annotated and diversity libraries and the importance of confirming that active compounds in phenotypic screens are not cytotoxic.
Materials and Methods
Profiling Annotated/Diversity Libraries and Cherry-Picked Compounds
HEK 293, NIH 3T3, CRL-7250, HaCat, and KB 3-1 cells were seeded into white 1536-well plates using a Multidrop Combi peristaltic dispenser (ThermoFisher, Waltham, MA) at a density of 250, 400, 500, 500, and 500 cells/well in 5 µL of medium, respectively. A pin tool (Kalypsys, San Diego, CA) was used to transfer 23 nL of compound solution to the 1536-well assay plates. After a 48 h incubation at 37 °C, 5% CO, and 85% humidity, 2.5 µL of CellTiter-Glo (Promega, Madison, WI) was dispensed into each well using a dispenser (Aspect Automation, St. Paul, MN) with solenoid valves (Lee Valves, Westbrook, CT). Plates were left at room temperature for 10 min before imaging the adenosine triphosphate (ATP)–coupled luminescence using a ViewLux microplate imager (PerkinElmer, Waltham, MA).
Luciferase Assay Protocol
Assays determining firefly luciferase inhibition were performed as previously described. 28 Briefly, 3 µL of luciferase substrate solution (10 µM ATP, 10 µM D-luciferin, 10 mM Mg-acetate, 0.01% Tween-20, 0.05% bovine serum albumin, 50 mM Tris acetate, pH 7.6, in final 4 µL volume) was dispensed into each well of white, solid bottom, 1536-well plates using a dispenser. A pin tool (Kalypsys) was used to transfer 23 nL of compound solution to the assay plates. Following a 15-min incubation at room temperature protected from light, 1 µL of purified luciferase enzyme solution was added to a final concentration of 10 nM Photinus pyralis luciferase (Sigma). Luminescence was detected by Viewlux (PerkinElmer) using a 10 s exposure time and 2X binning.
Data Analysis and Clustering of Compounds by Activity Outcomes
To determine compound activity in the qHTS assay, the concentration-response data for each sample was plotted and modeled by a four-parameter logistic fit yielding EC50 and efficacy (maximal response) values as previously described. 29 Raw plate reads for each titration point were first normalized relative to positive control (9.2 µM bortezomib, –100% activity, full inhibition) and DMSO-only wells (basal, 0% activity). Data normalization and curve fitting were performed using in-house informatics tools. Compounds were designated as class 1 to 4 according to the type of concentration-response curve (CRC) observed. In brief, class –1.1 and –1.2 were the highest-confidence complete CRCs containing upper and lower asymptotes with efficacies ≥80% and <80%, respectively. Class –2.1 and –2.2 were incomplete CRCs having only one asymptote with efficacy ≥80% and <80%, respectively. Class –3 CRCs showed activity at only the highest concentration or were poorly fit. Class 4 CRCs were inactive, having a curve fit of insufficient efficacy or lacking a fit altogether.
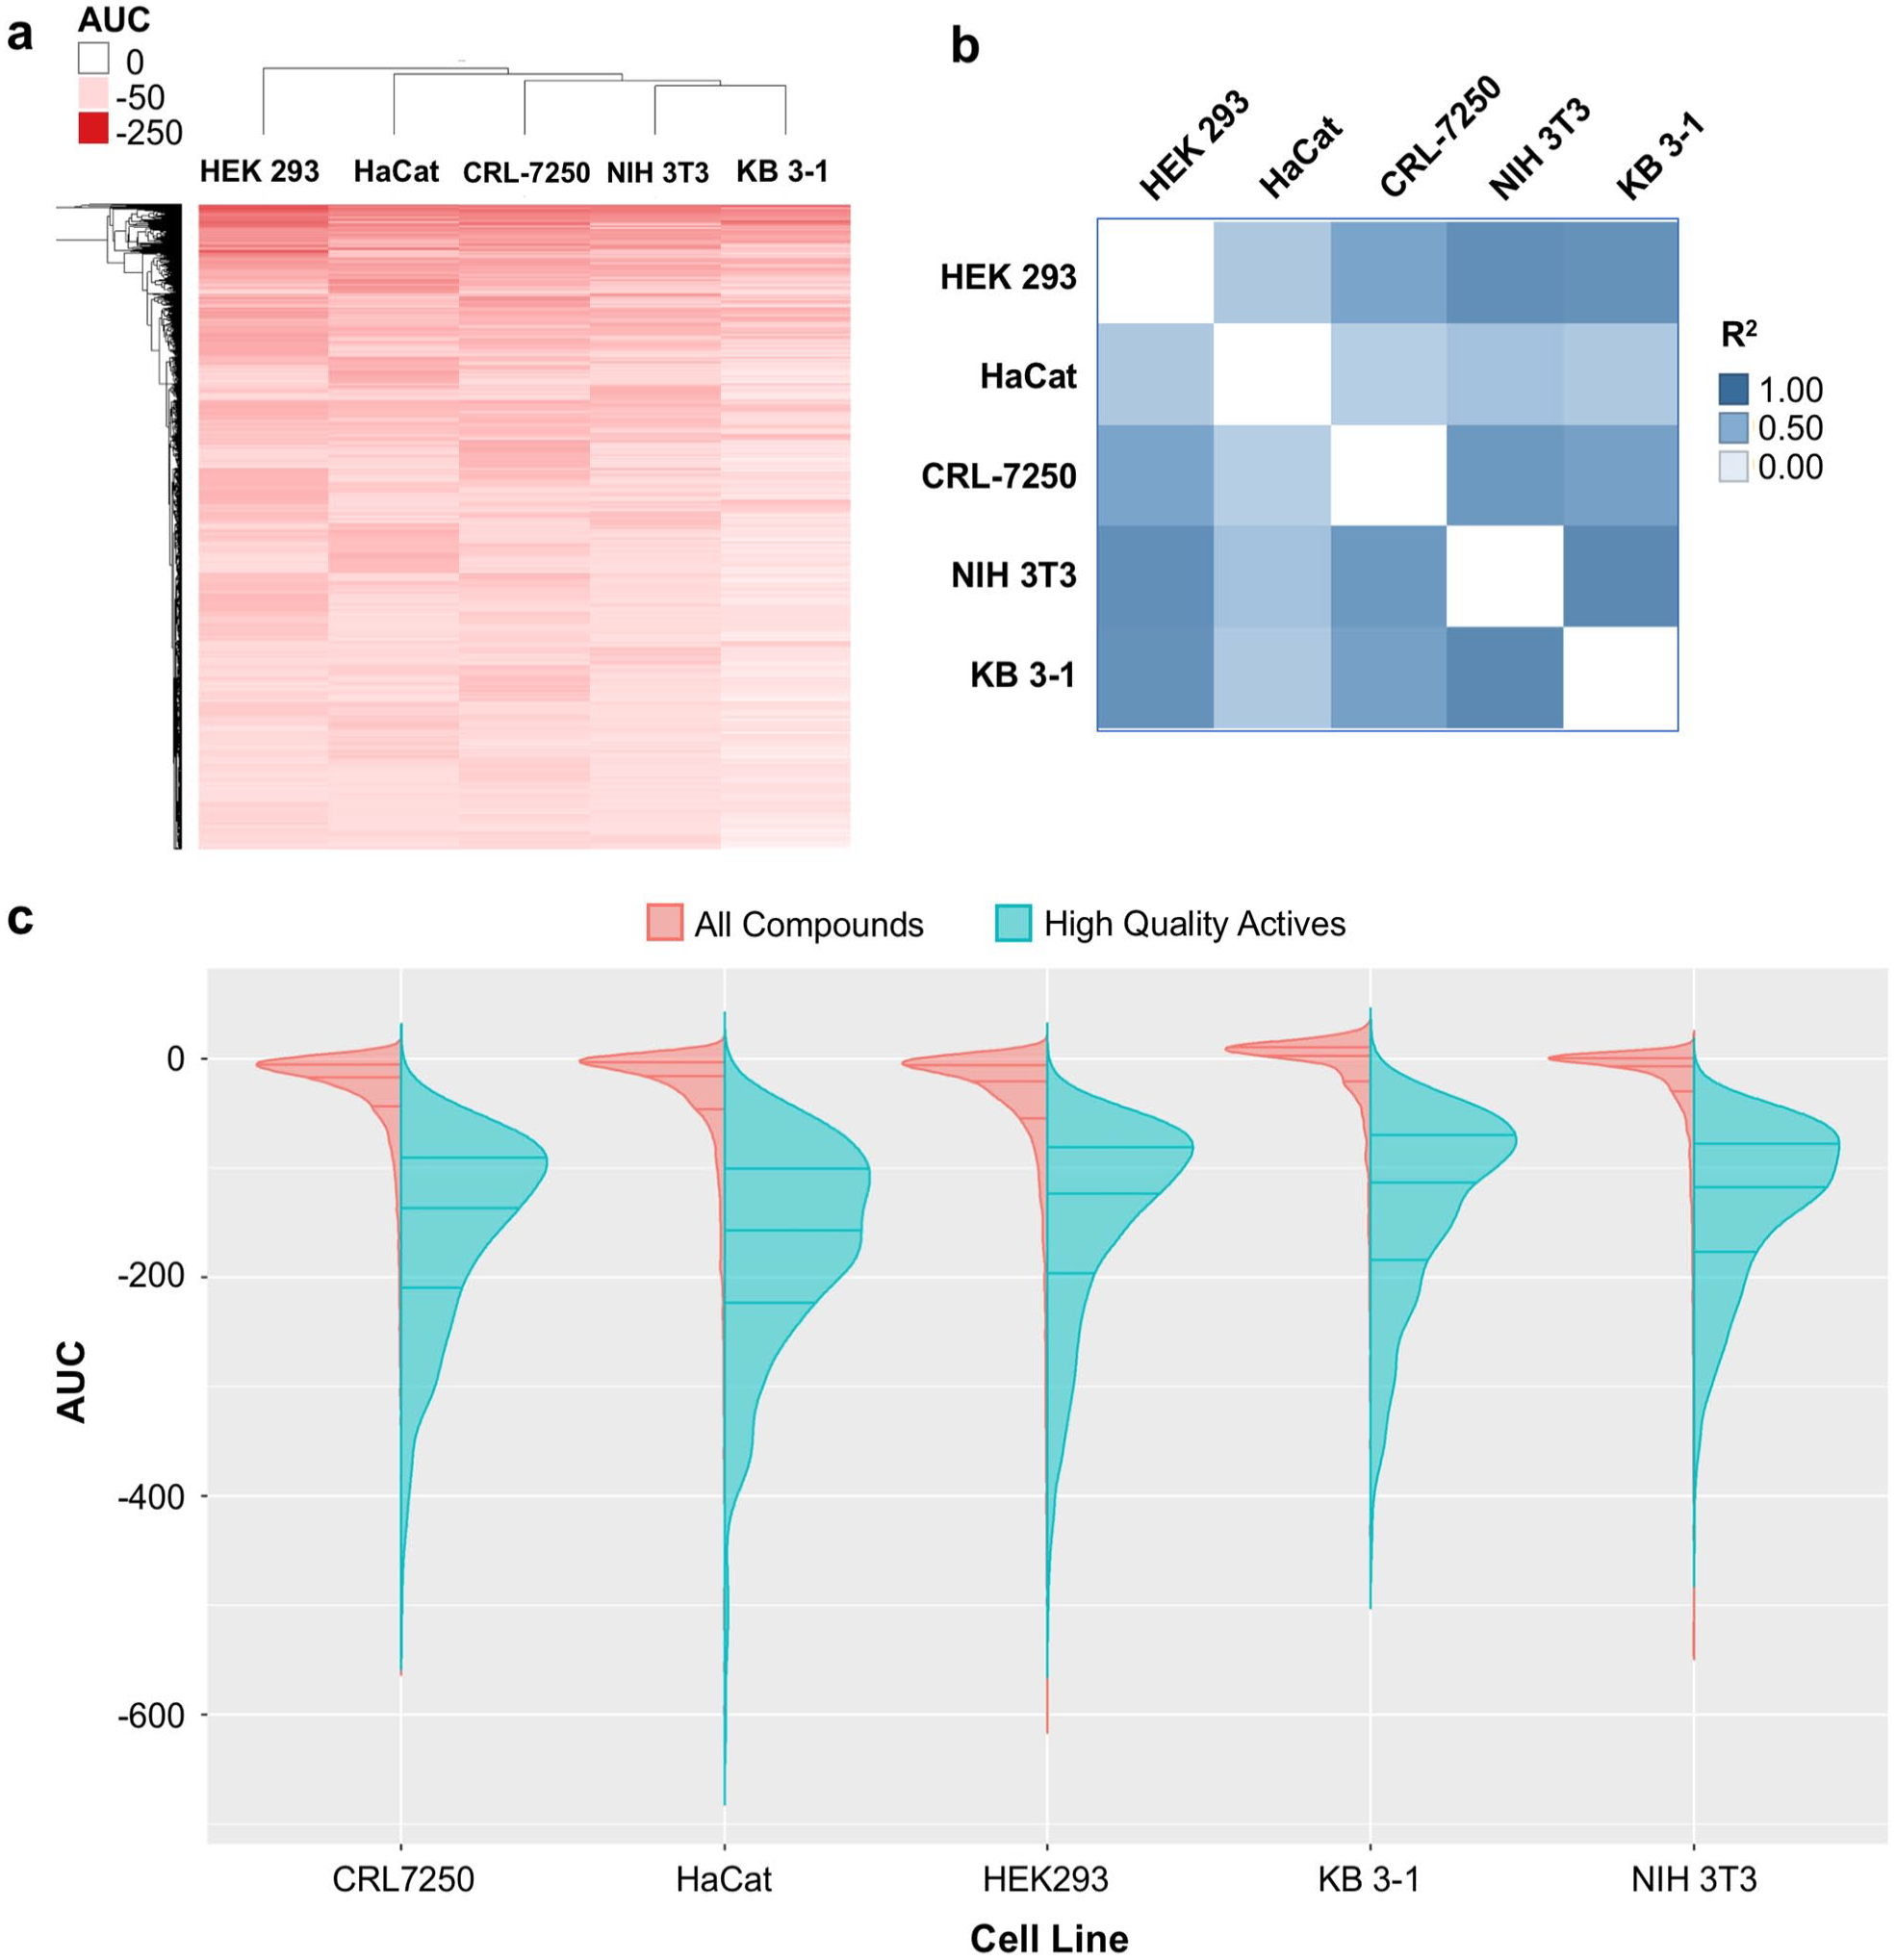
Compounds were further clustered hierarchically using TIBCO Spotfire 6.0.0 (Spotfire Inc., Cambridge, MA; https://spotfire.tibco.com/) based on their activity outcomes from the primary or follow-up screen across different cell lines. The compound’s area under the dose-response curve (AUC), calculated based on the qHTS data analysis and curve fittings, was used for clustering. In the heat map, the darker color indicates compounds that are more potent and efficacious (i.e., high-quality actives), and the lighter color indicates less potent and efficacious compounds. If a compound did not show any activity in an assay, it was highlighted as white in the heat map.
Statistical Analysis
To determine whether the hits predominantly identified from the specific therapeutic categories were overrepresented in the chemical library, an enrichment analysis was implemented against the drug library. A total of 9893 compounds in the annotated library were broken down to different therapeutic categories based on their primary mechanisms of action and pharmaceutical indications, and the enrichment was calculated from the following formula: E = a/n, given a is the number of actives and n is the total number of drugs in each therapeutic category. Fisher’s exact test was used as a measure of the consensus cytotoxicity potential of compounds in each MOA; all calculations were performed in R statistical computing software (https://www.r-project.org/).
Results
Profiling of an Annotated Library
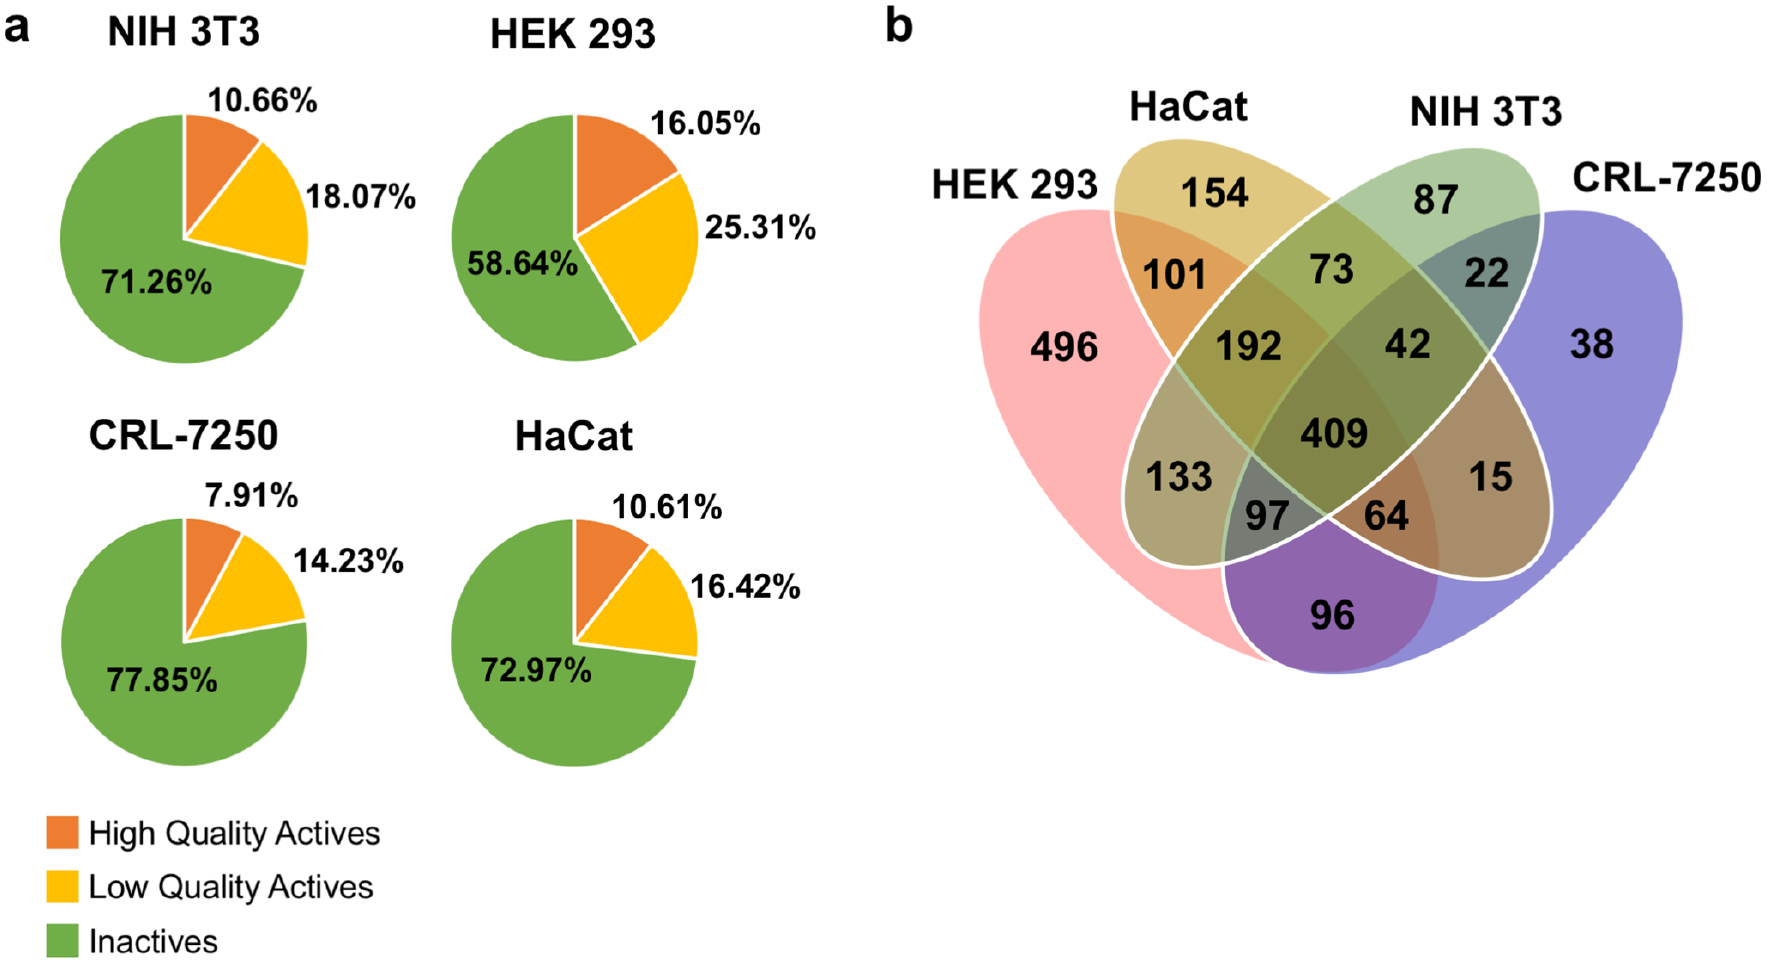
Annotated libraries were profiled for cell viability by performing a primary screen against four normal cell lines using CellTiter-Glo (CTG) as the assay readout (screening assay protocol displayed in
Variation of sensitivity was observed across all four cell lines, as shown in
(
Comparison of the AUC values of each compound using unbiased hierarchical clustering across four cell lines revealed some cross-correlation of activity, with the HEK 293 cells clustering away from the other cell lines (
(
One strength of the annotated compound libraries is the ability to integrate compound MOAs and targets into downstream analysis. Each compound that met the criteria for high-quality active in each cell line was aggregated by MOA. The tree map shown in
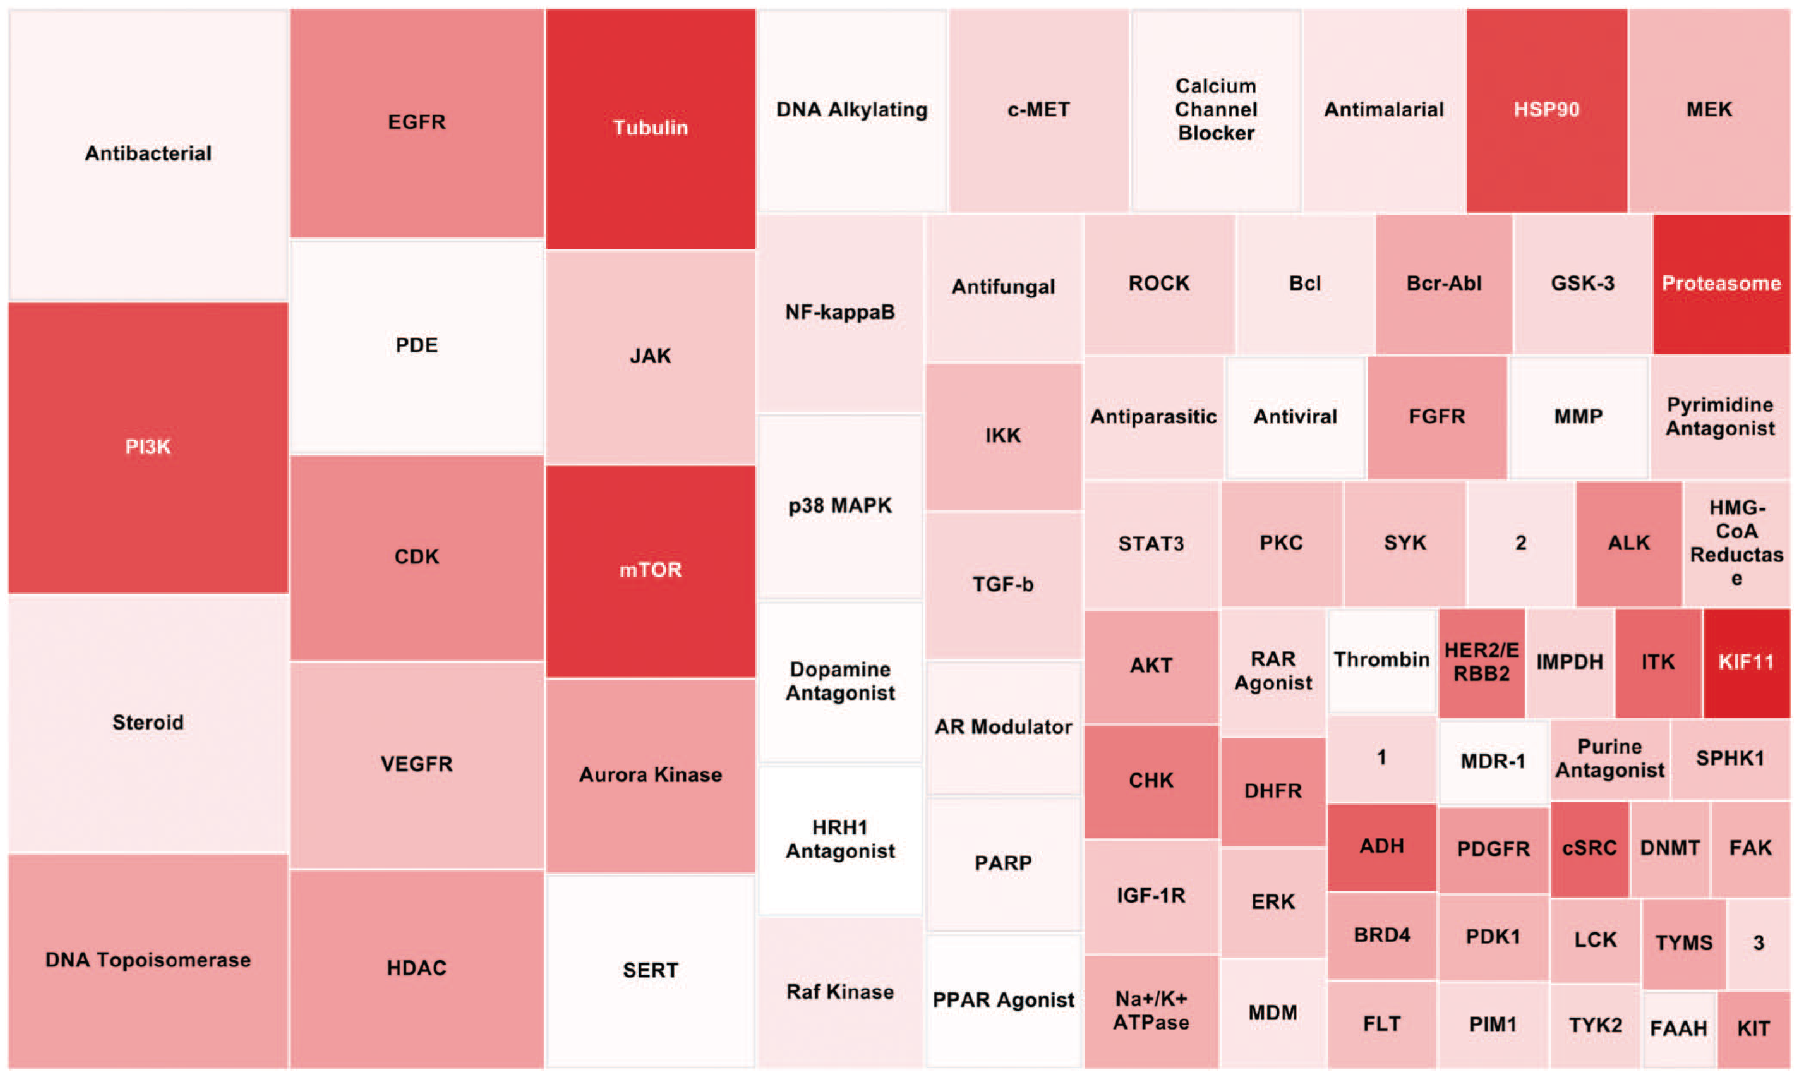
Tree map representation of the mechanisms of action (MOAs) of all high-quality actives from the annotated library compounds screened. The box size represents the total number of compounds representing each MOA (a bigger box size indicates more compounds present in the high-quality actives). Color represents the average area under the dose-response curve (AUC) from the cytotoxicity screen in four normal cell lines (darker red indicates a lower AUC, meaning a more potent and efficacious hit). 1 = lineage-specific differentiation; 2 = RNA polymerase; 3 = immunosuppressant.
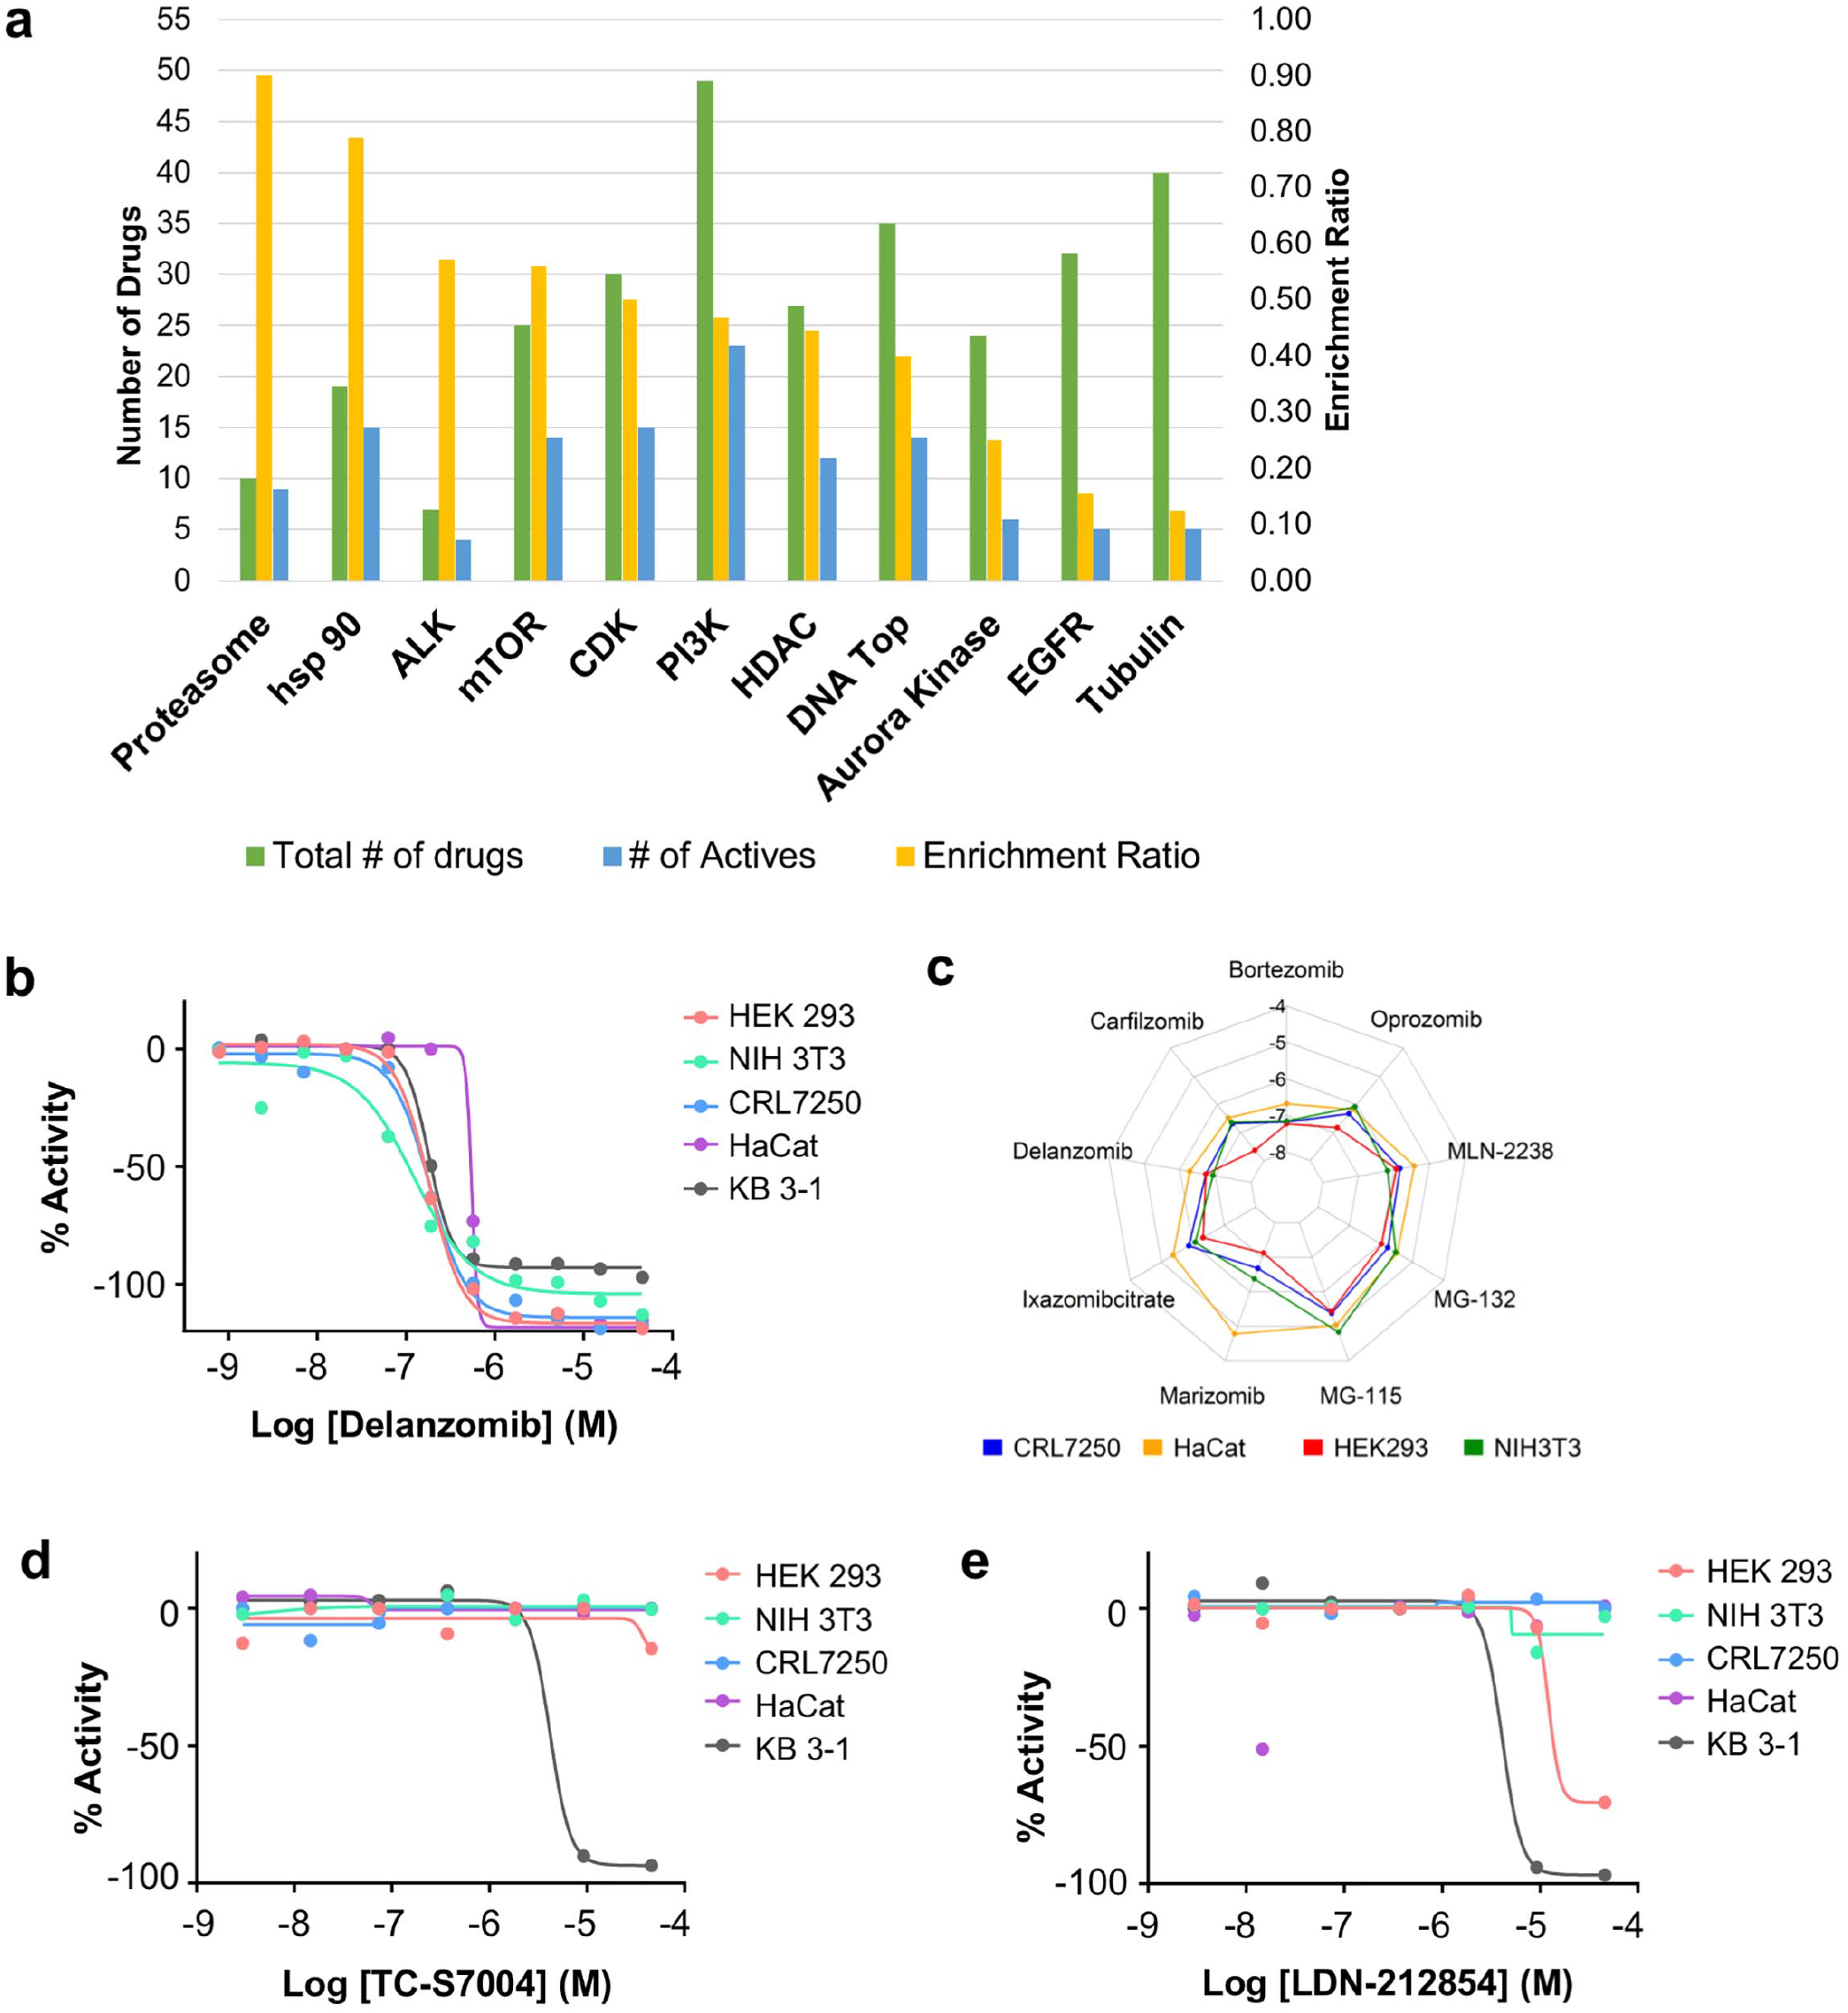
There were several instances in which multiple molecules with the same target were screened. To examine which MOAs were enriched among molecules active against cell lines, the proportion of active drugs to total drugs for each MOA target was used to derive an enrichment ratio (
(
As outlined, one use of cell-profiling data for mechanistically annotated screening libraries is to enable the identification of targeted agents selectively killing cancer cells. Here, we designated that a selective agent should show strong cell killing to KB 3-1 cells with EC50 ≤10 µM and have no effect on normal cell lines or at least 10-fold of EC50 shift in normal cell lines. Two such examples of selective killing are displayed in
Data for the annotated library screen was deposited in PubChem with AID 1296008. This assay can be accessed via the following link: https://pubchem.ncbi.nlm.nih.gov/assay/assay.cgi?aid=1296008.
Profiling of a Diversity Library
The diversity library was profiled for cell viability by performing a primary screen against HEK 293 and NIH 3T3 cell lines, using CTG as the assay readout (screening assay protocol displayed in
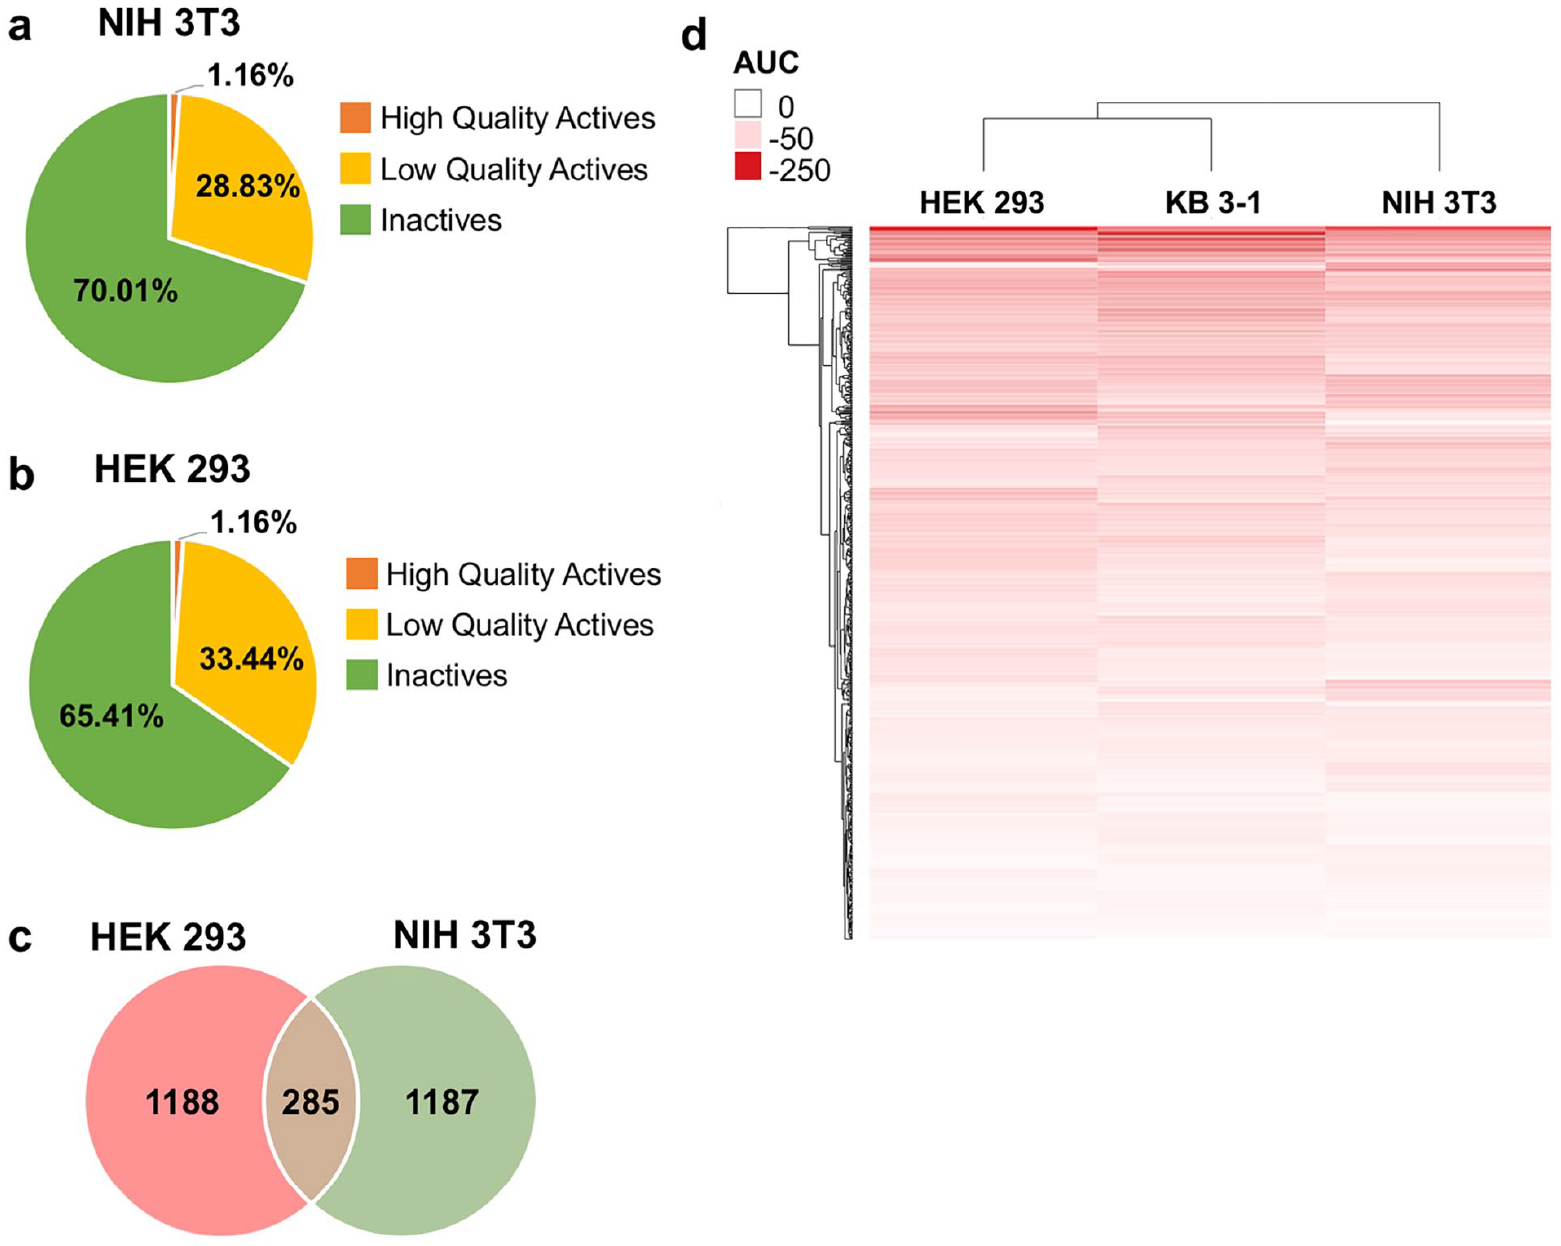
(
After cherry-picking 588 hits based on their potency, the maximal response in the primary qHTS assay, and structural features, confirmation of activity was performed in 12 dose-point testing for all cherry-picked compounds against HEK 293 and NIH 3T3 along with an orthogonal test against the KB 3-1 cell line. The final concentration of the compounds in the 5 µL assay volume ranged from 0.3 nM to 46 µM. To analyze the data, we generated a heat map with hierarchical clustering analysis (dendrogram) of compound activities based on their activity outcomes, which showed that NIH 3T3 clusters away from HEK 293 and KB 3-1 (
The Promega CTG reagent uses an engineered version of firefly luciferase to measure ATP concentrations. As such, we tested compounds that appeared cytotoxic against recombinant fLuc in a biochemical assay to triage any compounds that were inhibiting fLuc rather than reducing cell viability. A number of compounds inhibited fLuc, and two examples from a novel fLuc inhibitor chemotype are shown in
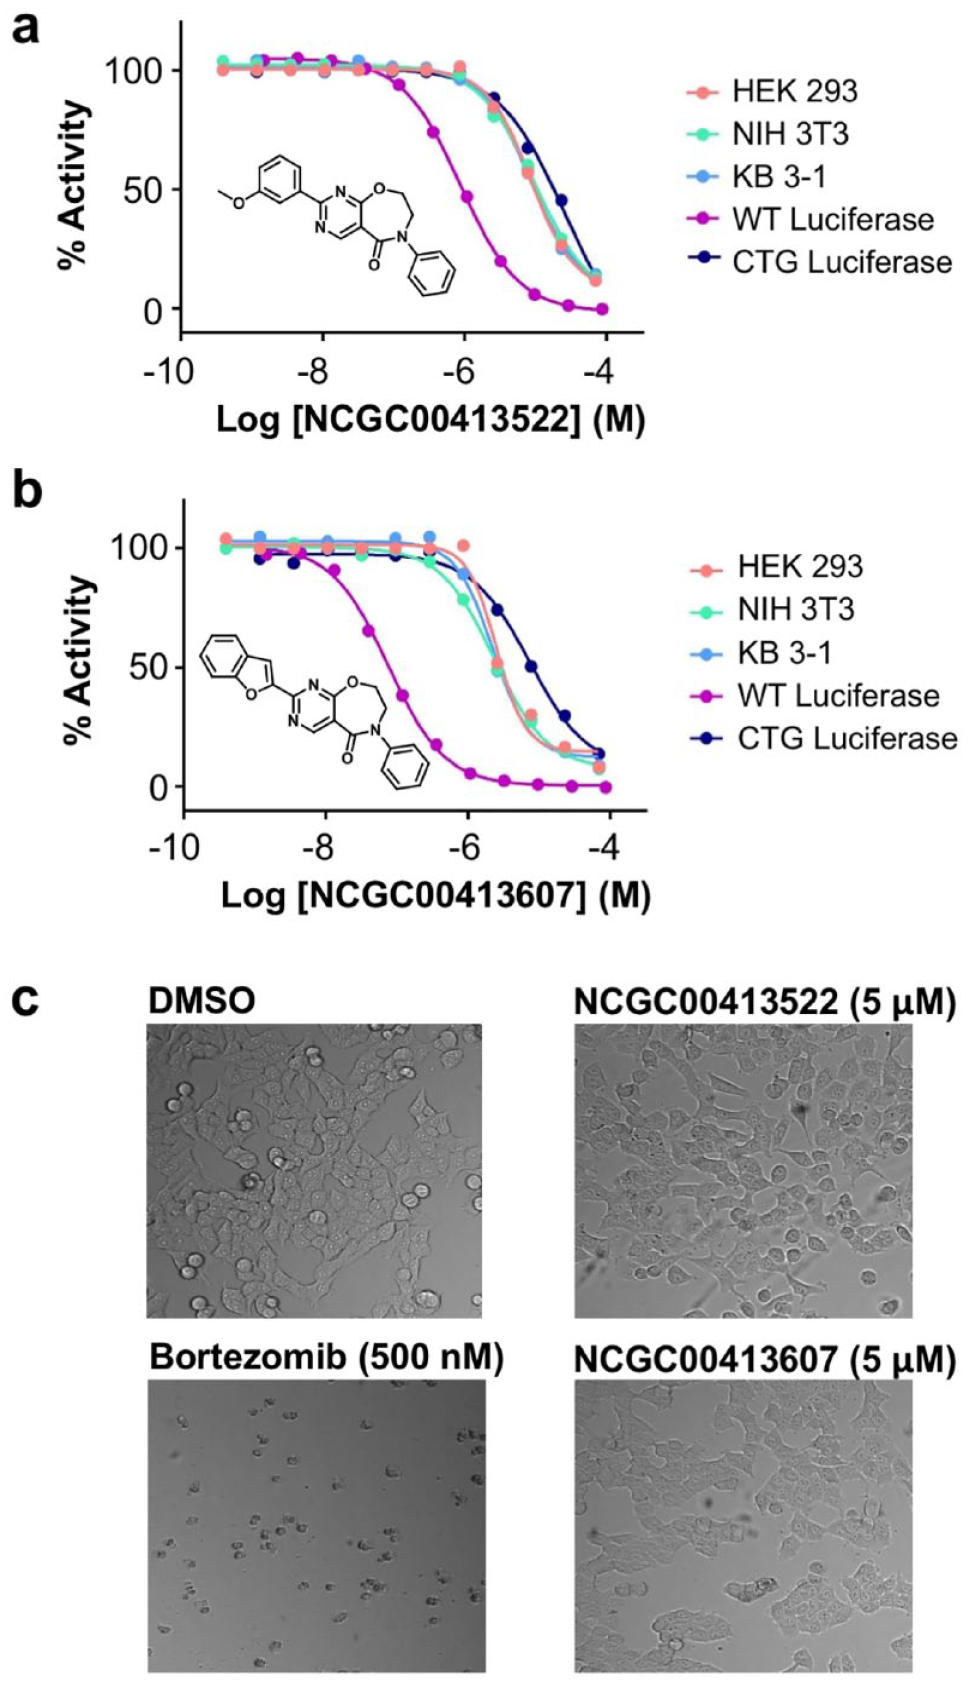
(
Moreover, comparing the AUC values of high-quality actives in the three cell lines, we found that they moderately correlated: NIH 3T3 versus HEK 293, R2 = 0.77; NIH 3T3 versus KB 3-1, R2 = 0.59; KB 3-1 versus HEK 293, R2 = 0.61 (
The remaining 56 pan-actives were cytotoxic across all three cell lines and lacked any selectivity toward either normal or cancer lines. Representatives of the top-ranking pan-actives are shown in
Data for the diverse chemical library screen were deposited in PubChem with AID 1345083 for the HEK 293 cell line and AID 1345082 for the NIH 3T3 cell line. The assay data can be accessed via the following links: https://pubchem.ncbi.nlm.nih.gov/assay/assay.cgi?aid=1345083 and https://pubchem.ncbi.nlm.nih.gov/assay/assay.cgi?aid=1345082.
Discussion
Here, we describe our effort to profile the cytotoxicity of two distinct libraries: (1) our annotated libraries (nearly 10,000 compounds of known MOAs or therapeutic indications) against four normal cell lines (HEK 293, NIH 3T3, CRL-7250, and HaCat) and a cancer cell line (KB 3-1, a HeLa subline) and (2) a diversity library (>100,000 compounds) against two normal cell lines (HEK 293 and NIH 3T3) and a cancer cell line (KB 3-1, a HeLa subline). The assays were performed in qHTS format. Hit rates and mechanistic pathways regularly associated with cell death are described. As one might reasonably anticipate, annotated (or mechanistic) libraries containing small molecules developed against targets or known to possess phenotypic activity have a high hit rate (7.91%–16.05%) against the cell lines, especially for many annotated molecules developed against oncology targets.
The large diversity collection revealed a low rate of profound cytotoxicity (1.2%), which is consistent with the fact that the majority are not optimized against targets but also reinforces the need to confirm the toxicity of such compounds through counterassays as part of the screening process for compound prioritization and triage. In our case, these profiling data are now used at NCATS to allow for rapid cross-referencing of active compounds in a screen against our data set of general cytotoxicity in normal cell lines. To facilitate the use of these data by the broader research community, we have also made a significant amount of these data available through PubChem.
What is a “normal” cell line, and what are its limitations? The four normal cell lines used in this study were selected for a number of reasons. HEK 293 and NIH 3T3 cell lines are very commonly employed in the scientific literature as control, normal, or comparator cell lines, along with conventional research uses. A common criticism of these lines is how normal they are given their capacity for uncontrolled cell growth. The HEK 293 cell line is one of the most used tool cell lines. It is a neuronal lineage line, generated in 1973 from embryonic kidney cells from an aborted fetus immortalized by transformation with adenovirus. 33 The NIH 3T3 murine fibroblast cell line was generated in 1962 from a Swiss albino mouse embryo that spontaneously immortalized after multiple passages. 34 The HaCat human keratinocyte cell line was spontaneously immortalized in culture and was first reported in 1988. 35 All three of the aforementioned immortalized cell lines are adherent, and all are nondiploid despite being noncancer, nontumorigenic cells. The CRL-7250 cell line differs from the others in that it is a primary, nonimmortalized fibroblast cell line generated from human foreskin. 36 The HEK 293 cell line demonstrated greater sensitivity than the other three normal cell lines in the annotated library screen.
One potential use for normal cell line–profiling data is to enable the identification of compounds selectively active against cancer cell lines based on their target biology. A well-known example is the inhibitors of MAPK/ERK kinase (MEK), which elicits acute cell killing in cells harboring somatic activating mutations of Ras but not in cells expressing wild-type Ras (such as the normal cells discussed here 37 ). As a proof-of-concept comparison, we tested the KB 3-1 adenocarcinoma cells against the annotated libraries. KB 3-1 cells are a subclone of HeLa cells, 38 originally called KB squamous cell carcinoma before it was identified as a HeLa contaminant, 39 and have subsequently been studied and acknowledged as such. KB cells do not possess activating Ras mutations, but selective activity was seen by a DYRK1A/B inhibitor that killed KB 3-1 cells without affecting the normal cells, demonstrating the utility. These profiling data have already been applied to the analysis of multiple oncology-related screens across NCATS.
Perhaps the key result (reassuring from a screening perspective) from cytotoxicity profiling of >100,000 diversity library compounds was the very low rate of cytotoxicity observed, although some chemotype-related activity was observed. Cell lines such as HEK 293 (along with cell lines such as the Chinese hamster ovary cell line) are commonly used to engineer reporter cell lines for cell target-based and high-content assays, and the relative insensitivity to diversity libraries supports their utilization. The only prior study we have identified (also from NCATS but not involving any of the current authors) tested 1408 compounds against 13 cell lines, including a number of cancer cell lines along with HEK 293 and NIH 3T3 cells. 24 Although the compound number was relatively modest in scale, the normal HEK 293 and NIH 3T3 cells were reported to be among the least sensitive, supporting the basis for utilization of normal cell lines rather than cancer cell lines for designing cell-based assays for discovery screening.
The data reported here are made available through PubChem, and it is hoped that these data will act as a general guide for normal cell-line sensitivity to killing and assist in guiding others in the design of counterassays for HTS of cell-based assays.
Supplemental Material
CellProfilingPaperSupplementary20190805 – Supplemental material for Cytotoxic Profiling of Annotated and Diverse Chemical Libraries Using Quantitative High-Throughput Screening
Supplemental material, CellProfilingPaperSupplementary20190805 for Cytotoxic Profiling of Annotated and Diverse Chemical Libraries Using Quantitative High-Throughput Screening by Olivia W. Lee, Shelley Austin, Madison Gamma, Dorian M. Cheff, Tobie D. Lee, Kelli M. Wilson, Joseph Johnson, Jameson Travers, John C. Braisted, Rajarshi Guha, Carleen Klumpp-Thomas, Min Shen and Matthew D. Hall in SLAS Discovery
Footnotes
Acknowledgements
We thank Dr. Aleksandra Michaloa for advice regarding data analysis.
Supplemental material is available online with this article.
Declaration of Conflicting Interests
The authors declared no potential conflicts of interest with respect to the research, authorship, and/or publication of this article.
Funding
The authors disclosed receipt of the following financial support for the research, authorship, and/or publication of this article: This work was supported by the NCATS Division of Pre-Clinical Innovation Intramural Program.
References
Supplementary Material
Please find the following supplemental material available below.
For Open Access articles published under a Creative Commons License, all supplemental material carries the same license as the article it is associated with.
For non-Open Access articles published, all supplemental material carries a non-exclusive license, and permission requests for re-use of supplemental material or any part of supplemental material shall be sent directly to the copyright owner as specified in the copyright notice associated with the article.