
Abstract
Hepatocellular carcinoma (HCC), a major histological subtype of liver cancer, is the third most common cause of cancer-related death worldwide. Currently, many curative standard treatments using target-specific chemotherapeutic agents are being developed. However, drug efficacy tests based on the 2D monolayer cell culture model do not effectively screen the best drug candidates because they do not accurately reflect in vivo tumor microenvironments. Thus, to select the best drug candidates or repositioning drugs, we developed new 3D in vitro hepatic tumor models, including 3D forming and preformed sphere models. A micropillar and microwell chip platform was used for the 3D in vitro liver cell-based model for high-throughput screening. We measured the efficacy of 60 drugs and sorted the most efficacious drugs by comparing the drug response of the 2D monolayer model with the 3D forming and preformed sphere models. Among the 60 drugs, 17 drugs (28.3%) showed a significant high efficacy in the 3D preformed sphere model, while 45 drugs (75%) showed an efficacy in the 2D model. We also calculated the IC50 values of the 17 drugs and found that 7 drugs exhibited a high sensitivity in HCC, which was in agreement with previous studies.
Keywords
Introduction
Hepatocellular carcinoma (HCC), a major histological subtype of liver cancer, is the third most common cause of cancer-related death worldwide. It has a poor prognosis, and the current therapy is associated with poor outcomes. Despite the many standard treatment options, such as transarterial chemoembolization (TACE), intraarterial chemoinfusion, systemic chemotherapy, radiotherapy, immunotherapy, and hormonal therapy, the 5-year relative survival rate for patients with HCC is only 7%. 1 Many patients are refractory to treatment and have poor outcomes.2,3 Thus, the development of effective and well-tolerated treatments is of key importance for HCC patients. 4 Among them, target-specific chemotherapeutic agents are the most actively developed research areas. Much of the preclinical studies on liver cancer, however, have focused on targeted drug development in 2D cell culture systems. 2D cell culture systems are well established and provide reliable data. However, those systems are simple models that do not reflect the cell–cell contact environment typically observed in vivo, such as the tumor microenvironment in a patient.
To overcome these drawbacks, 3D cell culture methods have facilitated in vitro examination of the in vivo biological features of liver cancer cells. 5 Additionally, performing HTS assays on in vitro 3D liver models has supported the understanding of the in vivo-like morphological and functional features, 6 overcoming the limitations of 2D monolayer cell-based HTS assays. Therefore, during drug development, in vitro modeling using 3D liver cell-based efficacy assays is a viable method to determine efficacious drugs with good anticancer responses in drug development as well as in drug repositioning.
There were several ongoing studies investigating the integration of a 3D cell culture method into HTS. Many successful cases have been reported,7–18 including our previously developed assay system.10–13 For example, one study developed a high-throughput clonogenic assay using a micropillar/microwell chip platform. The high-throughput clonogenic assay is a drug efficacy analysis method that quantitatively measured the 3D cell colony formation of glioblastoma multiforme (GBM) patient-derived cells (PDCs) according to various drugs. 13 It can determinate which drugs inhibit colony formation from a single cancer cell. Other papers14–18 have successfully reported 3D cell culture models that showed the high resistance of the drug compared with the 2D monolayer cell culture model. However, in clinics, cancer colonies already formed in vivo are treated with many anticancer drugs. Thus, the evaluation of drug efficacy in fully formed cancer colonies is necessary to select highly efficacious drugs among many candidates.
In this paper, we proposed two 3D cell-based in vitro hepatic tumor models: 3D forming sphere and 3D preformed sphere models. In the 3D forming sphere model, the alginate spots 1 day after cell seeding were treated with the drugs. Drug efficacy including inhibition of colony formation could be evaluated. In the 3D preformed sphere model, the alginate spots 7 days after cell seeding were treated with the drugs. The HCC cell lines formed big colonies in the alginate spots. Thus, this model could measure the efficacy of drugs inducing cancer cell death. In the experiment, we used 60 drugs, which were already approved by the FDA, and their targets are well known. Common drugs in HCC, such as cabozatinib and regorafenib, were also included. In the two proposed 3D models and one 2D in vitro cell model, we were able to evaluate the efficacy of those and selected highly sensitive drugs in HCC, which means our proposed 3D preformed sphere model could be used in screening systems for drug development or drug repositioning. Figure 1 shows the protocol and representative results of the 3D forming and preformed sphere models. We also compared these 3D models with a 2D monolayer cell model. The 3D in vitro liver cell-based model used a micropillar and microwell chip platform to better reflect tumor microenvironments and to enable high-throughput screening.
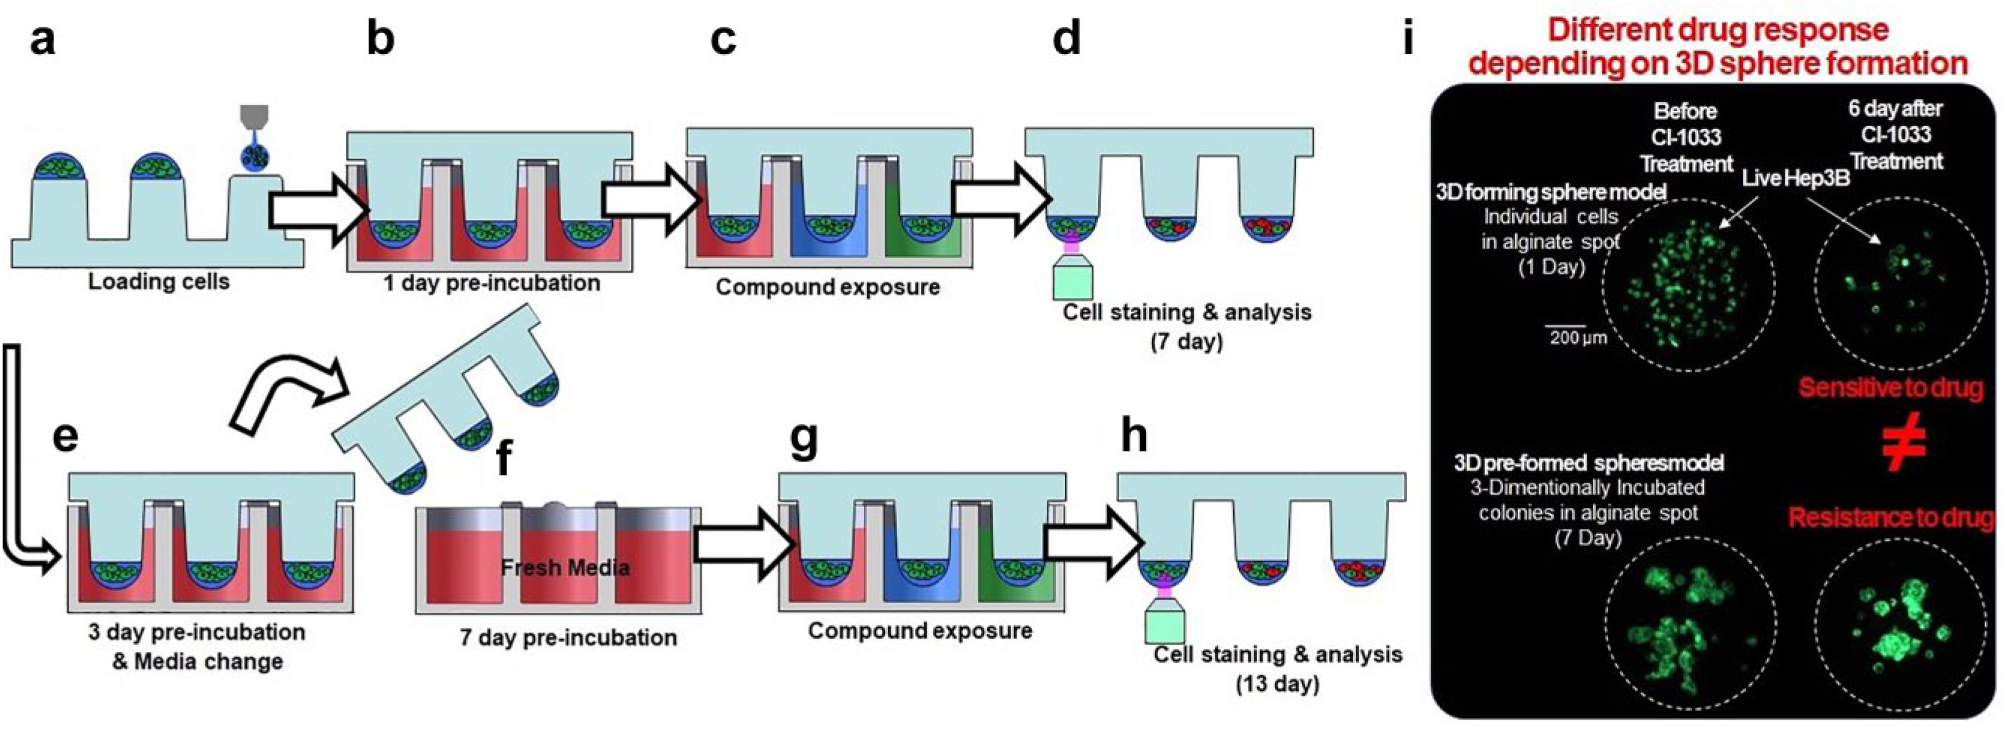
Experimental procedures for the 3D cell-based high-throughput screening. (
Materials and Methods
HCC Cell Line Culture
Hep3B, HCC cell line, was from the American Type Culture Collection (ATCC, Manassas, VA; HB-8064). Hep3B was cultured with Dulbecco’s modified Eagle’s medium (DMEM; Gibco, Dún Laoghaire, Ireland, cat. 11995-073) combined with 10% fetal bovine serum (FBS; Gibco, cat. 16000-044) and 1% antibiotic-antimycotic (AA; Gibco, cat. 15240-062). Cells were maintained in an incubator (95% humidified atmosphere and 5% CO2) at 37 °C. Cells were grown in a polystyrene-coated T-75 cell culture flask (Eppendorf, Seoul, South Korea, cat. 0030-711-122). The cells were routinely passed every 3 days at 80% confluence from the initiation of the experiment using the following protocol. All medium was removed from the flask. The flask was then rinsed using 1× phosphate-buffered saline (PBS; Gibco, 10010-023) 5 mL, and the remains were discarded. Next, 1 mL of TrypLE Express (Gibco, 12605-010) was added, and the flask was placed in an incubator for 3 min. After trypsinization, the TrypLE Express was collected in a 50 mL Falcon tube, and the flask was rinsed with 1× PBS 10 mL. The washed PBS was then added to the Falcon tube containing the TrypLE Express. After centrifugation at 1500 rpm for 3 min, the supernatant was removed, and the cells were resuspended in 1 mL of fresh cell culture media. The cell number in the medium was calculated using disposable hemocytometer C-chips (iNCYTO, Seoul, South Korea, I5.NO15). The cells were seeded at a concentration of 1 × 10⁶ in a T-75 flask containing 15 mL of DMEM.
2D Monolayer Cell Viability Screening
The Hep3B, HCC cell line, was seeded in 384-well plates at a density of 500 cells per well with technical duplicates. The 2D monolayer cells were treated with 60 drugs using a Janus Automated Workstation (PerkinElmer, Waltham, MA). Six days after the drug treatment, cell viability was accessed using an adenosine triphosphate (ATP) assay system based on the firefly luciferase (ATPLite 1step, PerkinElmer, Shelton, CT). Cell viability was measured using an EnVision Multilabel Reader (PerkinElmer, Waltham, MA). Control wells, containing only cells with vehicle (DMSO), were included on each assay plate. These controls were used to calculate the relative cell viability for each plate and to normalize the data on a per plate basis. After normalization, the relative 2D monolayer cell viability was calculated using GraphPad Prism 6.
Drug Library for Efficacy Test
We searched for clinical cancer drugs that were undergoing clinical trials and for the standard targeted oncology drugs. Using various drug libraries, we selected 60 drugs whose targets are well known, including the following: epidermal growth factor receptor (EGFR), phosphoinositide 3-kinase (PI3k), mechanistic target of rapamycin (mTOR), vascular endothelial growth factor (VEGFR), c-mesenchymal-epithelial transition factor (c-Met), and fibroblast growth factor receptor (FGFR). Those drugs included were in either phase III or phase IV trials or are approved oncology drugs from public data provided by the U.S. Food and Drug Administration (FDA). We applied 60 drugs to the 3D preformed Hep3B cells to identify possible new indications from existing drugs in drug repositioning for HCC. Six days after treating the cells with the drugs, the 3D cultured colonies on the micropillar chips were stained. Then, a further process was carried out as described in Figure 1 . To check which of the drugs were efficacious, we calculated the relative colony viability based on the colonies in the DMSO controls.
Experimental Procedure
As in our previous works,10–13 the microwell chip was divided into 62 lines (60 drugs and 2 controls), and each line had 1 × 6 microwell arrays for replicates. The colony viability was measured from six replicates for each line. For the drug analysis, about 100 cells (3D single Hep3B cells) in 50 nL with a 0.75% alginate concentration by volume (0.75 w/w) were automatically dispensed onto a spot surface of the micropillar chip by the ASFA Spotter ST (Medical & Bio Device, Suwon-si, South Korea). The ASFA Spotter ST uses a solenoid valve (Lee Company, Westbrook, CT) to dispense the 50 nL droplets of the cell–extracellular matrix (ECM; alginate) mixture and 950 nL of media or drugs. After dispensing the cells, as shown in
Figure 1a
, the micropillar chip containing the Hep3B cells in alginate was combined (or “stamped”) with the microwell chip, to support the 3D cell incubation and the drug efficacy tests. Next, 950 nL of cell culture media was dispensed into each microwell, and the micropillar chip was combined with the microwell chip shown in
Figure 1b
. A single chip can screen the 3D cell viability for 60 drugs and six replicates. One day after incubating the cells, to stabilize the 3D cultured cells, the micropillar chip with the 3D cells was moved to another microwell chip containing the 60 drugs. In the 3D forming sphere model,
Figures 1b
Results and Discussion
Workflow of the High-Dose Drug Efficacy Test
The high-dose drug efficacy test for measuring drug efficacy in HCC cells was quantified with a 3D hepatic tumor model using a micropillar and microwell chip. Sixty drugs at 20 µM each and two DMSO controls were screened against a 2D monolayer model, a 3D forming sphere model, and a 3D preformed sphere model to measure the drug efficacy, respectively. Based on 50% cell viabilities in the 2D monolayer model and the 3D forming and preformed sphere models, the high-efficacy drugs were selected in each model. For the drugs that showed high efficacy in the 3D preformed sphere model, we tested again to draw the dose–response curve (12 dose points; threefold dilution from the maximum 20 µM; three replicates) and calculated the IC50 to quantify the efficacy of the drugs.
3D Cultured Cell Growth Check by Measuring the Average Area of the Colonies
Figure 2 shows the mean colony area after 1, 3, 7, 9, and 13 days, respectively. Representative enlarged images for each time point are shown in Figure 2b . The green fluorescence represents live cells, stained by calcein AM. From the intensity distribution of the green fluorescence, the boundary of each spot could be defined for the analysis. The software counts the number of pixels within the defined area and converts this number into square micrometer (μm2) units. This provided both the number and area of the colonies. Figure 2a shows the 3D cultured cell growth curve based on the mean colony area and the number of colonies. Importantly, the mean cell area was saturated after 7 days, while the number of colonies decreased due to cell-to-cell merging. Based on the results, the cells were cultured sufficiently and no longer grew after 7 days in the 3D environment.
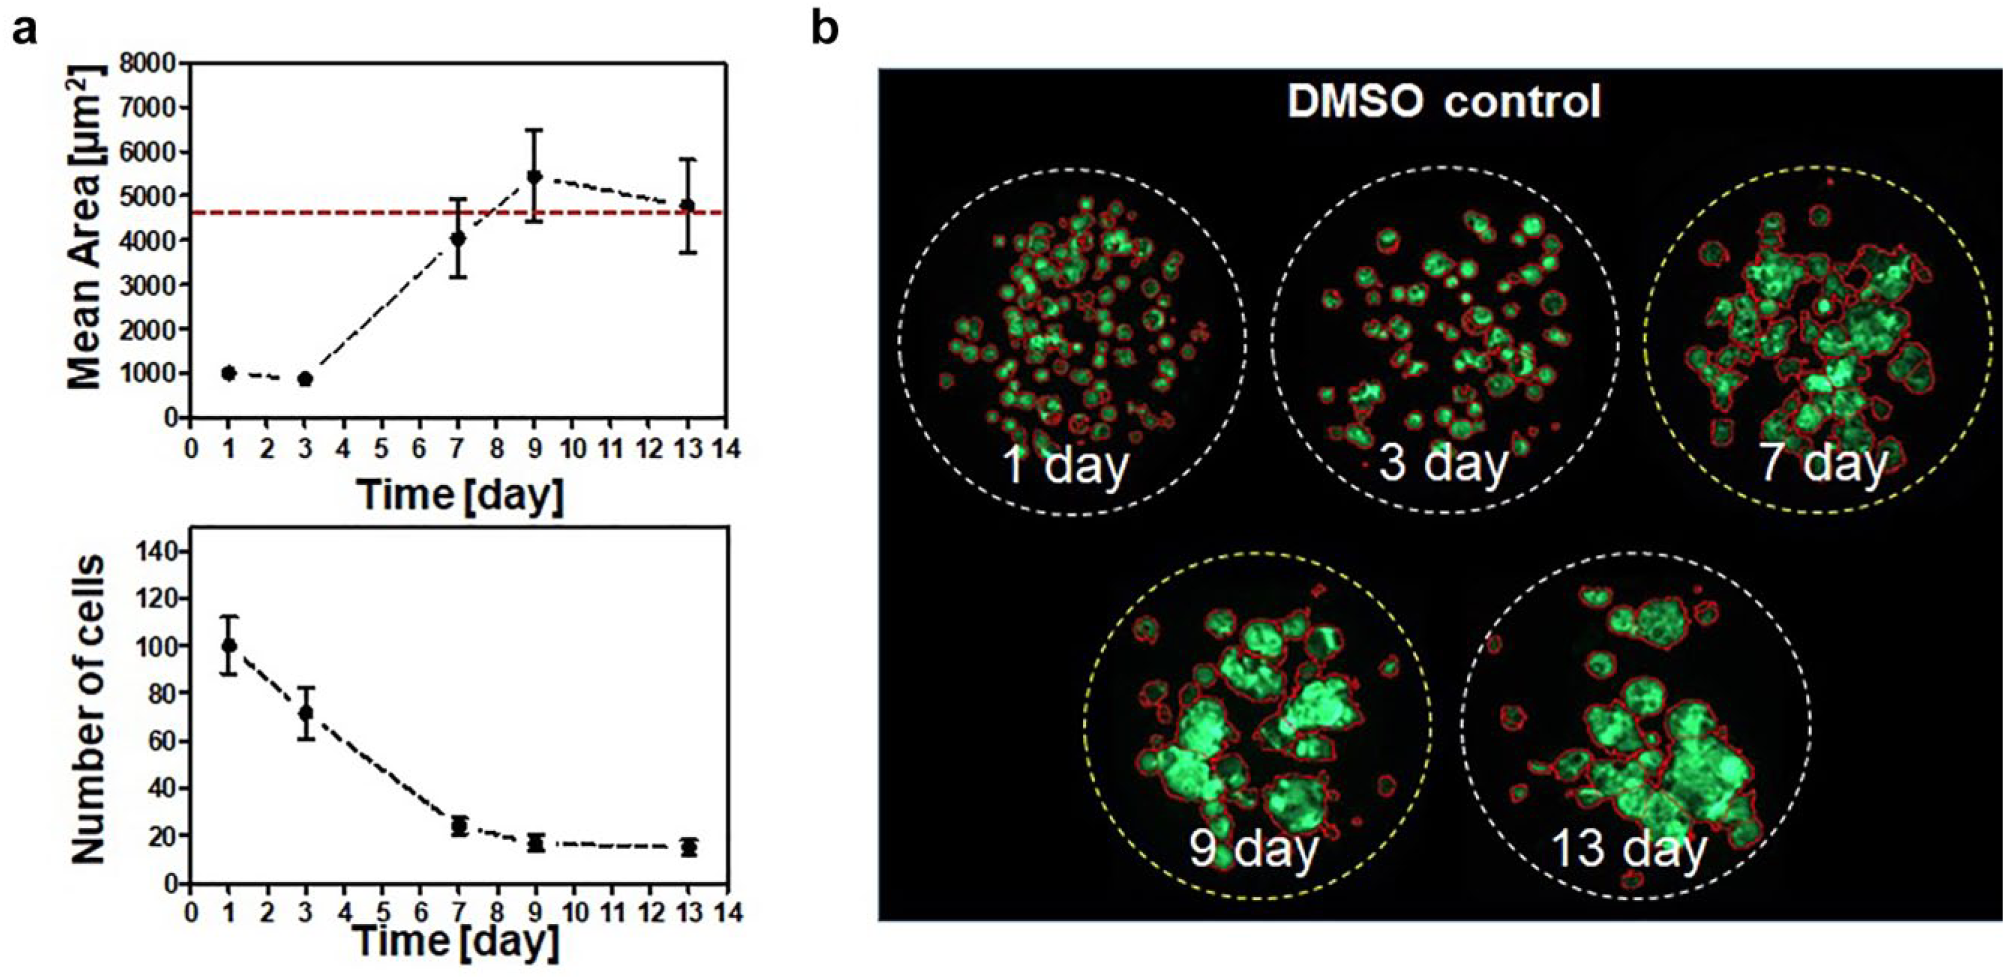
3D cultured cell growth assessment by measuring the mean area of the colonies. (
Efficacy Test of the 60 Drugs in the 3D Cultured Cells
Figure 3
shows the cell viability comparison graphs according to the cell culture models.
Figure 3a
compares the 2D monolayer model and the 3D forming sphere model,
Figure 3b
compares the 2D monolayer model and the 3D preformed sphere model, and
Figure 3c
compares the 3D forming sphere model and the 3D preformed sphere model. The axes of the graphs represent the cell viabilities for the 60 drugs (including two DMSO controls), each at a concentration of 20 µM. To calculate the IC50 within the maximum 20 µM drug concentration range, the cell viability at the maximum 20 µM drug concentration should be below 50%. Thus, based on 50% viability, we selected sensitive drugs whose respective IC50 values were below 20 µM. In
Figure 3
, the blue lines mean 50% viability, and we selected drugs (dots in the graph) below the blue lines. We divided the cell viability comparison graph into four regions, based on 50% cell viability in the three different cell culture models shown in
Figure 3
. Region 3 shows highly sensitive drugs in both cell culture models. In
Figure 3a
, 24 drugs in region 3 showed a sensitive response, while only 17 drugs showed a sensitive response in region 3 (
Fig. 3b
). It means the 3D preformed sphere model exhibited high resistance to the drugs and could be screening highly sensitive drugs among the many drug candidates. In region 2 of
Figure 4a
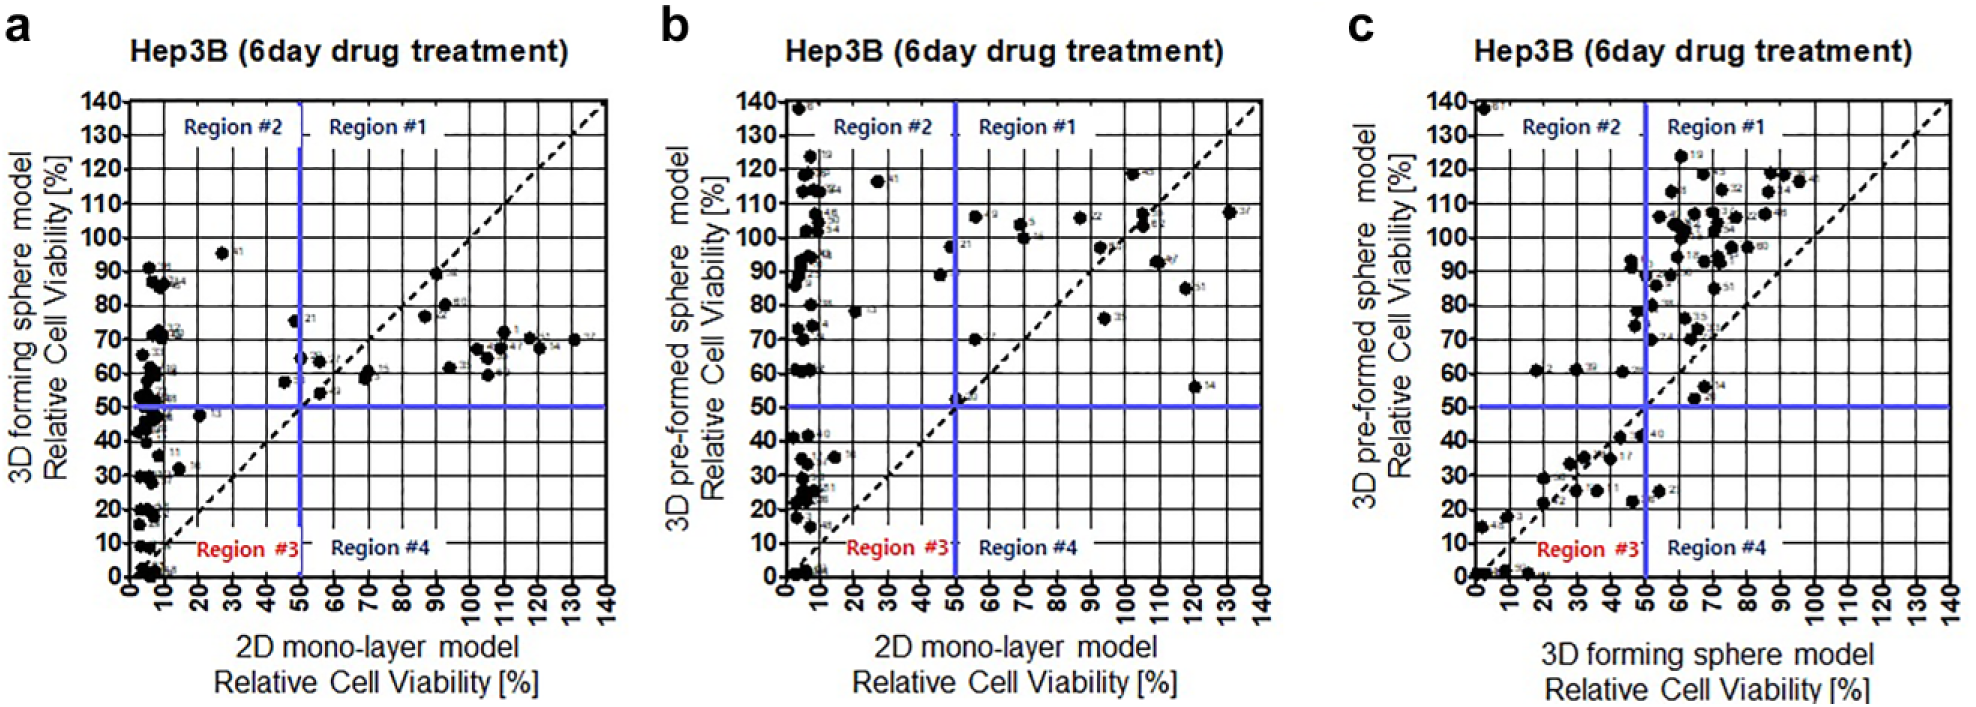
Cell viability comparison graphs: effect of 20 μM drug concentration in 2D monolayer cell, 3D forming sphere, and 3D preforming sphere models. (
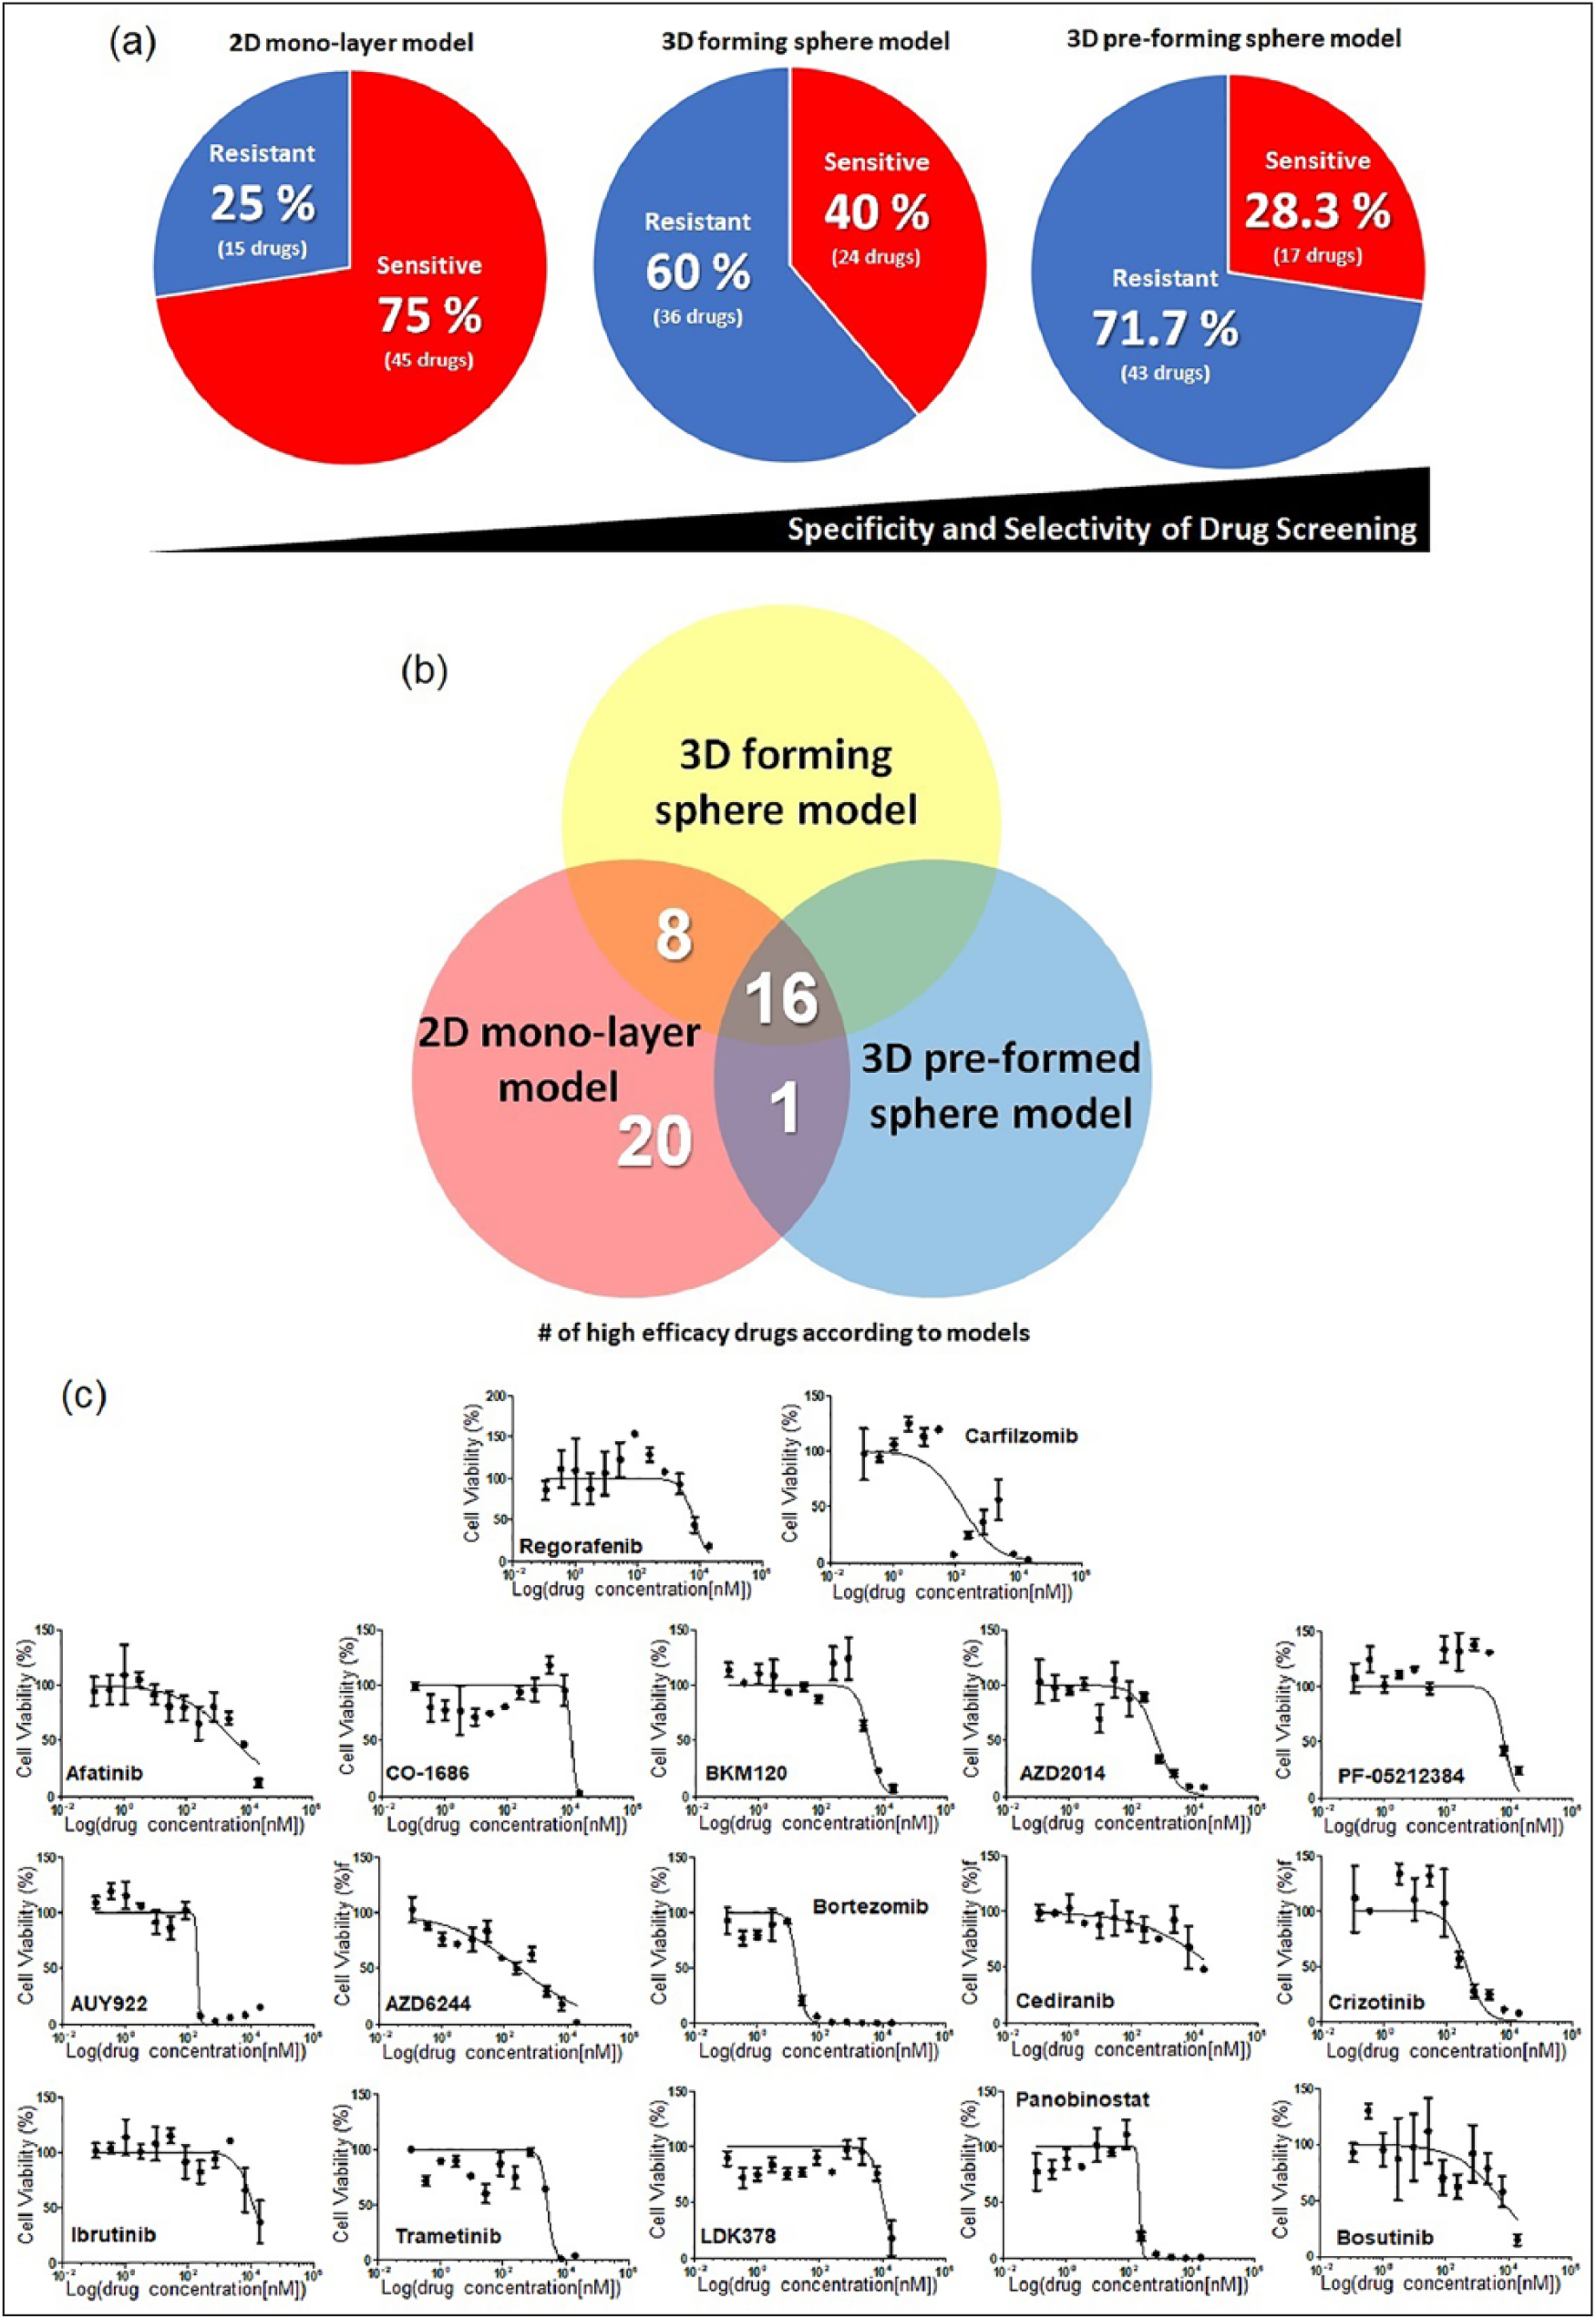
Quantitative analysis of efficacious drugs in the 2D and 3D cell culture models. (
For further study, we drew dose–response curves (12 dose points; threefold dilution from the maximum 20 μM; three replicates) and calculated the IC50 values of 17 drugs that were highly sensitive in the 3D preformed sphere model. Figure 4c shows the dose–response curves of the 17 drugs, and the IC50 values are listed in Supplemental Table S1 . Among the 17 drugs, including regorafenib (Stivarga), which was one of the popular drugs to treat HCC patients in clinics, 7 drugs (AZD2014, AUY922, AZD6244, bortezomib, crizotinib, panobinostat, and carfilzomib) showed a highly sensitive response in the 3D sphere cell models, which means the IC50 values of the 7 drugs were lower than the one for regorafenib (IC50 = 5.9 μM). Previous studies have reported on the efficacy of the seven drugs in HCC cells. AZD2014 has been used in a phase II trial (ClinicalTrials.gov identifier: NCT03166176) in solid cancers that were TSC 1 or 2 Null or had TSC 1/2 mutations, as well as in liver cancer patients. AZD2014 has also been reported to have efficacy in Hep3B cell lines. 19 AUY922 has been reported to be active against angiogenesis in human HCC. 20 AZD6244 increases the efficacy of sorafenib in the combination treatment of HCC. 21 Bortezomib overcame tumor necrosis factor-related apoptosis-inducing ligand resistance in HCC. 22 Crizotinib induced autophagic cell death in HCC. 23 Panobinostat and carfilzomib increased the efficacy of sorafenib in the combination treatment of HCC.24,25
The main targets of the 60 drugs are EGFR, PI3k, mTOR, VEGFR, c-Met, and FGFR. Among the 60 drugs, 11, 3, 6, 9, 4, and 3 drugs target EGFR, PI3k, mTOR, VEGFR, c-Met, and FGFR, respectively. Interestingly, 10 drugs targeting EGFR were very sensitive in the 2D monolayer cell model. However, just two drugs (afatinib and CO-1686) were highly sensitive in the 3D preformed sphere model. Two drugs among the mTOR targeting drugs were sensitive in the 3D preformed sphere model, while four were sensitive in the 2D monolayer cell model.
For VEGFR targeting drugs, two drugs were sensitive in the 3D preformed sphere model, while eight drugs were sensitive in the 2D monolayer cell model. For PI3K and c-Met targeting drugs, one drug was highly sensitive in the 3D preformed sphere model, while two and three drugs were highly sensitive in the 2D monolayer cell model, respectively. For FGFR targeting drugs, there were no drug responses in the 3D preformed sphere model, while all three of the FGFR targeting drugs responded well in the 2D monolayer cell model. From those results, among the drugs related to six well-known targets, 66%–100% of the drugs showed a sensitive response in the 2D monolayer cell model, while only less than 33% of the drugs showed a sensitive response in the 3D preformed sphere model. Thus, a high-dose drug efficacy test based on the 3D preformed sphere model could reduce the possible drug candidates to select highly efficacious drugs in drug development or drug repositioning.
The 3D cell-based HTS assay, using the micropillar/microwell chip platform, was used in the high-dose drug efficacy test for the selection of drugs in HCC. Although some drugs showed efficacy in the 2D monolayer cell model, the lack of efficacy in in vivo models, or in actual patients, remains an issue. The 3D cell-based in vitro hepatic tumor model could be considered a more efficient screening method when comparing high-dose drug responses. To accurately reflect the in vivo-like tumor microenvironment, Hep3B cells (one of the HCC cell lines) were encapsulated with alginate, which was used as an ECM, and cultured three-dimensionally using the micropillar and microwell chip platform. In the experiment, 60 drugs at a concentration of 20 µM each, which included specific target or general chemotherapeutic agents, were used in the 3D cell models and screened to select the most efficacious drugs. Among the 60 drugs, 17 drugs (28.3%) showed a high efficacy in the 3D preformed sphere model. We demonstrated that this 3D preformed sphere model is a more selective method to screen for highly efficacious drugs.
Supplemental Material
Supplemental_Table_1 – Supplemental material for Drug Efficacy Comparison of 3D Forming and Preforming Sphere Models with a Micropillar and Microwell Chip Platform
Supplemental material, Supplemental_Table_1 for Drug Efficacy Comparison of 3D Forming and Preforming Sphere Models with a Micropillar and Microwell Chip Platform by Il Doh, Yong-Jun Kwon, Bosung Ku and Dong Woo Lee in SLAS Discovery
Footnotes
Supplemental material is available online with this article.
Declaration of Conflicting Interests
The authors declared no potential conflicts of interest with respect to the research, authorship, and/or publication of this article.
Funding
The authors disclosed receipt of the following financial support for the research, authorship, and/or publication of this article: This research was supported by a grant from the Korea Health Technology R&D Project through the Korea Health Industry Development Institute (KHIDI), funded by the Ministry of Health & Welfare, Republic of Korea (HI17C2412); by a National Research Foundation of Korea (NRF) grant funded by the Korea government (MSIT) (no. 2018R1C1B5045068); and by the X-mind Corps program of the NRF funded by the Ministry of Science, ICT (2018025568).
References
Supplementary Material
Please find the following supplemental material available below.
For Open Access articles published under a Creative Commons License, all supplemental material carries the same license as the article it is associated with.
For non-Open Access articles published, all supplemental material carries a non-exclusive license, and permission requests for re-use of supplemental material or any part of supplemental material shall be sent directly to the copyright owner as specified in the copyright notice associated with the article.