
Abstract
Conventional cell-counting software uses contour or watershed segmentations and focuses on identifying two-dimensional (2D) cells attached on the bottom of plastic plates. Recently developed software has been useful tools for the quality control of 2D cell-based assays by measuring initial seed cell numbers. These algorithms do not, however, quantitatively test in three-dimensional (3D) cell-based assays using extracellular matrix (ECM), because cells are aggregated and overlapped in the 3D structure of the ECM such as Matrigel, collagen, and alginate. Such overlapped and aggregated cells make it difficult to segment cells and to count the number of cells accurately. It is important, however, to determine the number of cells to standardize experiments and ensure the reproducibility of 3D cell-based assays. In this study, we apply a 3D cell-counting method using U-net deep learning to high-density aggregated cells in ECM to identify initial seed cell numbers. The proposed method showed a 10% counting error in high-density aggregated cells, while the contour and watershed segmentations showed 30% and 40% counting errors, respectively. Thus, the proposed method can reduce the seed cell-counting error in 3D cell-based assays by providing the exact number of cells to researchers, thereby enabling the acquisition of quality control in 3D cell-based assays.
Introduction
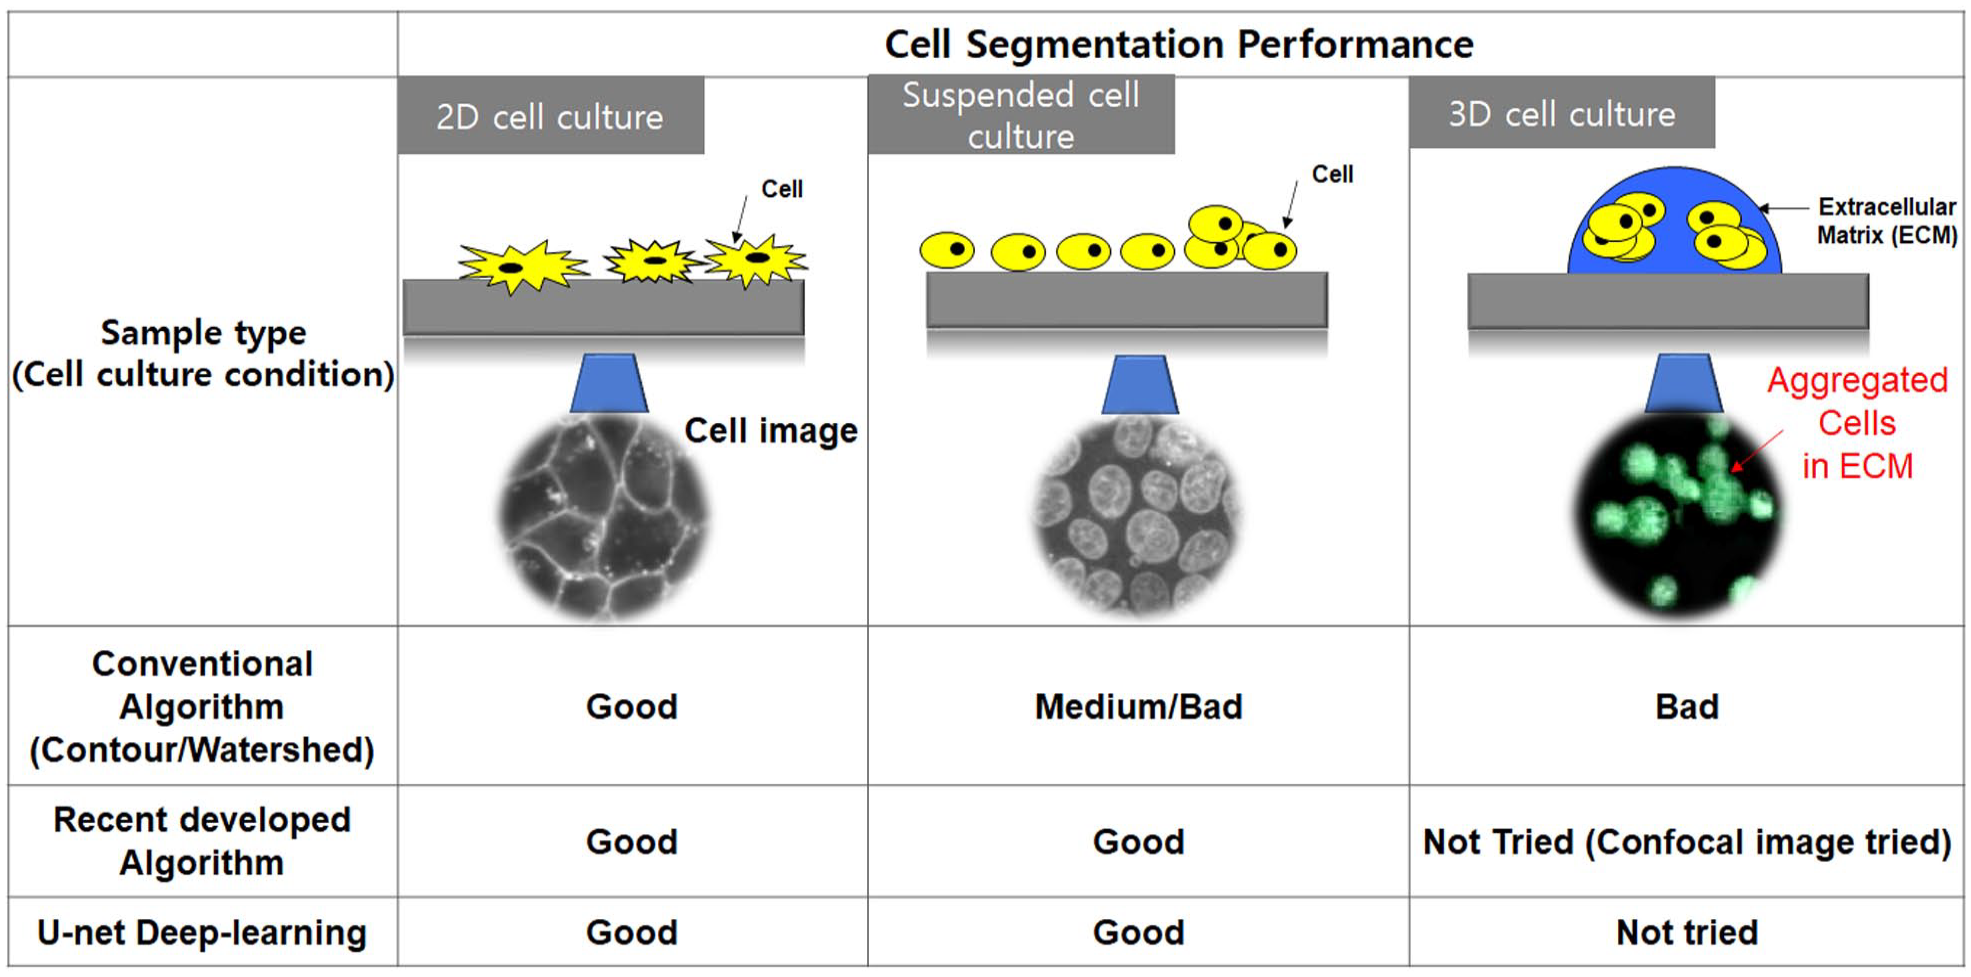
Identifying and counting seed cells in cell-based assays are important for cell culture and cell research. It is important to determine the number of seed cells to standardize experiments and ensure reproducibility, and therefore researchers use visual methods (e.g., a hemocytometer) to identify the number of cells.1,2 Although this method allows obtaining the true value, there are limitations such as its high standard deviation and long computation time.1,3 Furthermore, it cannot be used for a large number of samples at one time in high-throughput screening. 1 To address these problems, automatic cell-counting systems were developed. 3 These systems analyze a large number of samples in a short time and minimize human error. These systems are useful when counting two-dimensional (2D) cells;1,3 however, they are not effective for three-dimensional (3D) cells. As an increasing number of experiments are being conducted using 3D cell cultures, the errors in these conventional current cell-counting methods have become evident.3,4 Unlike 2D cell culture in which cells are separate, in a 3D cell culture, cells grow together and are three-dimensionally located in extracellular matrix (ECM).4,5 Thus, it is easy to count 2D cells; however, it is difficult to count 3D cells because they agglomerated and were three-dimensionally located in the ECM. 5 The largest error is that conventional methods cannot recognize overlapping cells as separate cells; they can find only the boundaries of the clustered cells.3,5 To solve this problem, many advanced algorithms and U-net deep learning applied to cell segmentation and counting in 2D and 3D cultured cells.6–9 Figure 1 shows the schematic performance of conventional algorithms (contour and watershed), 10 recently developed algorithms,6–8 and the U-net deep-learning method9,11 applied to cell images from various cell culture conditions. Conventional and recently developed cell segmentation algorithms were applied to attached cells (2D monolayer cell culture) and suspended cells (2D or semi-3D cell culture), and showed good cell segmentation performance from cell images. In cases of 3D cell culture (embedding cells in the ECM), aggregated cells were not well segmented in conventional algorithms (contour and watershed). Recent cell segmentation algorithms (included U-net deep learning) well differentiated cells from images of the suspended cells and confocal images of aggregated ones. These algorithms did not, however, quantitatively show the cell segmentation performance for cells aggregated in the ECM.
Results of cell detection using active contour algorithms. (
In this article, we proposed a deep-learning-based 3D cell-counting method for 3D cultured cells in the ECM. We apply a 3D cell-counting method using U-net deep learning to identify the number of cells seeded in the ECM for quantification of 3D cell-based assays. Artificial neural networks were used for biology 12 and could recognize, infer, and determine cell count by learning the image of the cells you want to know. Deep learning is a subset of machine learning that detects data patterns using artificial neural networks and distinguishes objects. 13 The proposed method uses a U-net model, which is convolutional neural network (CNN) architecture, because it has a convolutional network that segments images quickly and accurately. Furthermore, it is possible to deduce patterns by seeing only a part of the images, and therefore, it has very good image division characteristics. In particular, U-net is useful in applications involving a structural division of the neural system, such as in cell tracking or cell nucleation. Thus, it is a good model for cell detection and morphology measurement. 11 Thus, the proposed 3D cell counter reduced the seed cell-counting error in 3D cell-based assays by providing an exact number of cells in the ECM, thereby enabling the acquisition of high-quality experimental data in 3D cell-based assays.
The network shape of the U-net resembles the letter U, and it is divided into a contracting path that reduces the images and an extending path that grows the images (
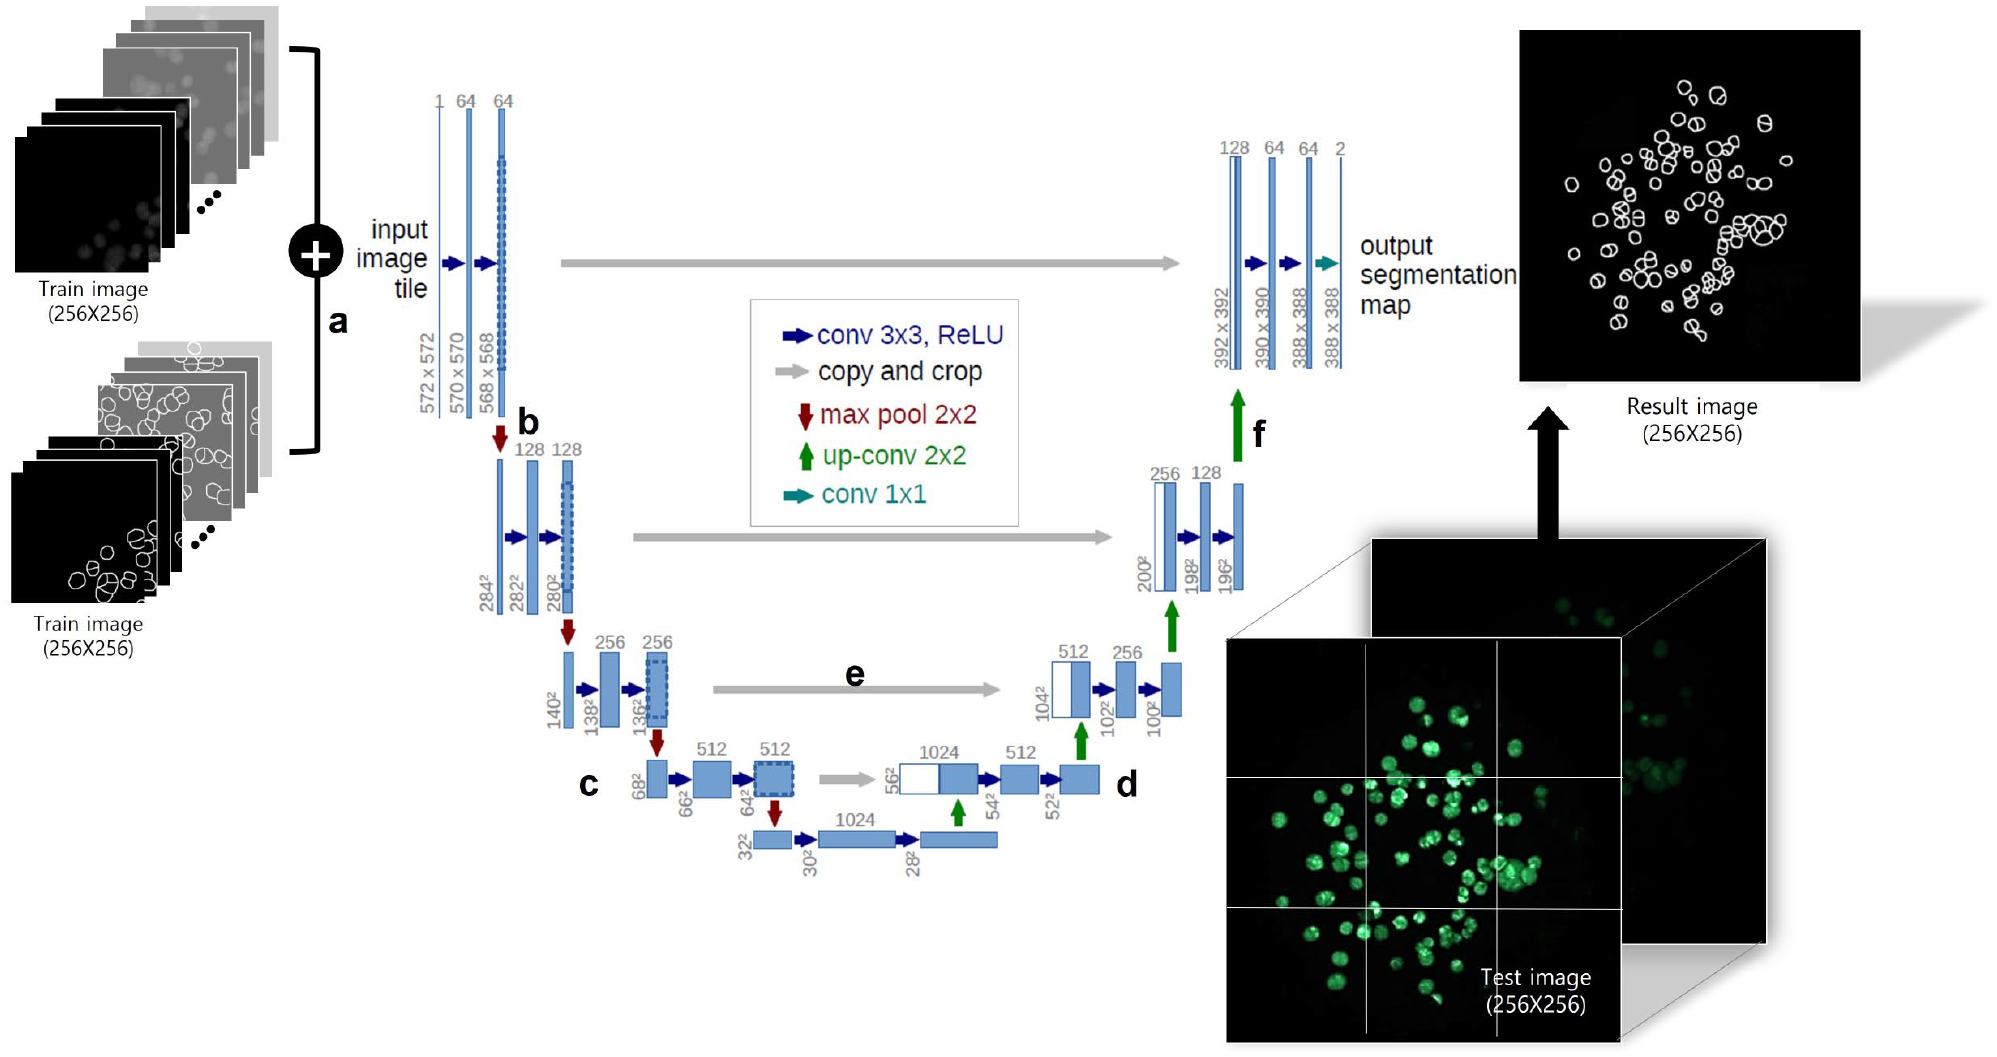
U-net model for three-dimensional (3D) cell counting. (
Methods
Cell culture and 3D cell experiments to obtain 3D cell images were followed in our previous studies.4,14,15 The purpose for our experiment is to quantitatively confirm that the U-net deep-learning algorithm exhibits low counting errors for cells aggregated on the ECM. It is hard to use recently developed algorithms and adapt those to aggregated cells in ECM. So, this study compared the U-net deep-learning algorithm with the conventional algorithms (contour and watershed) to verify that U-net deep learning could be a useful tool to segment aggregated cells in ECM.
Cell Culture
Human lung carcinoma (A549) cells were purchased from the Korean Cell Line Bank (Seoul, South Korea) and cultured in T-75 cell culture flasks (Eppendorf, Vienna, Austria) filled with RPMI 1640 medium (Gibco, Waltham, MA) supplemented with 10% fetal bovine serum (FBS, Gibco). Cell lines were cultured at 37 °C in a 5% CO2-humidified cell incubator (Sheldon Manufacturing, Cornelius, OR) and passaged every 4 days at 60% confluence. For the experiment, 2D incubated cells were treated with 1× TrypLE Express enzyme (Gibco) to separate from the T-75 flask bottom. Then, the cells were collected in a 50 ml falcon tube. After centrifugation at 2000 rpm for 3 min, the supernatant was removed, and the cells were resuspended with RPMI 1640 conditioned medium to a final concentration of 10×106 cells/mL. The number of cells in the RPMI 1640 conditioned medium was calculated with the AccuChip cell-counting kit (Digital Bio, Seoul, South Korea). The rest of the cells were seeded at a concentration of 1×10⁶ cells in a T-75 flask containing 15 mL of RPMI 1640 conditioned medium. In addition, we used the A549 cell line for 20 passages after thawing from a frozen cell stock. After 20 passages, we observed that the A549 cell line easily formed 3D cells in 0.75% (w/w) alginate on the chip platform.
Experimental Procedure of 3D Cell Culture
We chose alginate as the ECM and a microchip platform (micropillar/microwell chips) for cell culture. In a previous study, our group developed a 3D cell culture platform called “micropillar/microwell chips.”4,14,15 We created a 3D cell culture to acquire 3D cell images for data learning and evaluate the performance of the proposed 3D cell-counting method. Figure 3 shows the experimental procedure for the 3D cell culture. The cell and ECM mixture was dispensed on a micropillar chip; before loading the cells, pillar surfaces were coated with poly-L-lysine (PLL, Sigma-Aldrich, St. Louis, MO) and barium chloride (BaCl2, Sigma-Aldrich) for gelling alginate. 13 Then, the pillar was placed on the well plate chip that dispensed the growth medium ahead of time. After 1 d of incubation, the cells on the pillar were stained with calcein AM that can make the viable cells in green fluorescence. 14 A staining dye solution was prepared by adding 1.0 µL of calcein AM (4 mM stock from Invitrogen, Waltham, MA) in 8 mL of 140 mM NaCl supplemented with 20 mM CaCl2. Each cell spot was detected by imaging the entire micropillar chip using the ASTA Scanner (Medical & Bio Decision, Su-won si, South Korea) equipped with a mercury light source (Olympus U-RFL-T, Olympus, Tokyo, Japan), a CCD camera (Point Grey, Richmond, Canada), 4× objective lenses (Olympus UPlanFLM), and excitation/emission filters (Thorlab, Newton, NJ). An excitation filter of 475±35 nm and an emission filter of 530±43 nm, which are optimum for detecting green fluorescence from live cells stained with calcein AM, were used. The microscope on a moving stage in the scanner automatically focused on cell spots by moving in the z-direction and selecting the highest fluorescent cell image; it captured 532 individual pictures from a single stained micropillar chip at 4× magnification. The 532 pictures of the cell spots were then consolidated into a single JPEG image for data analysis.
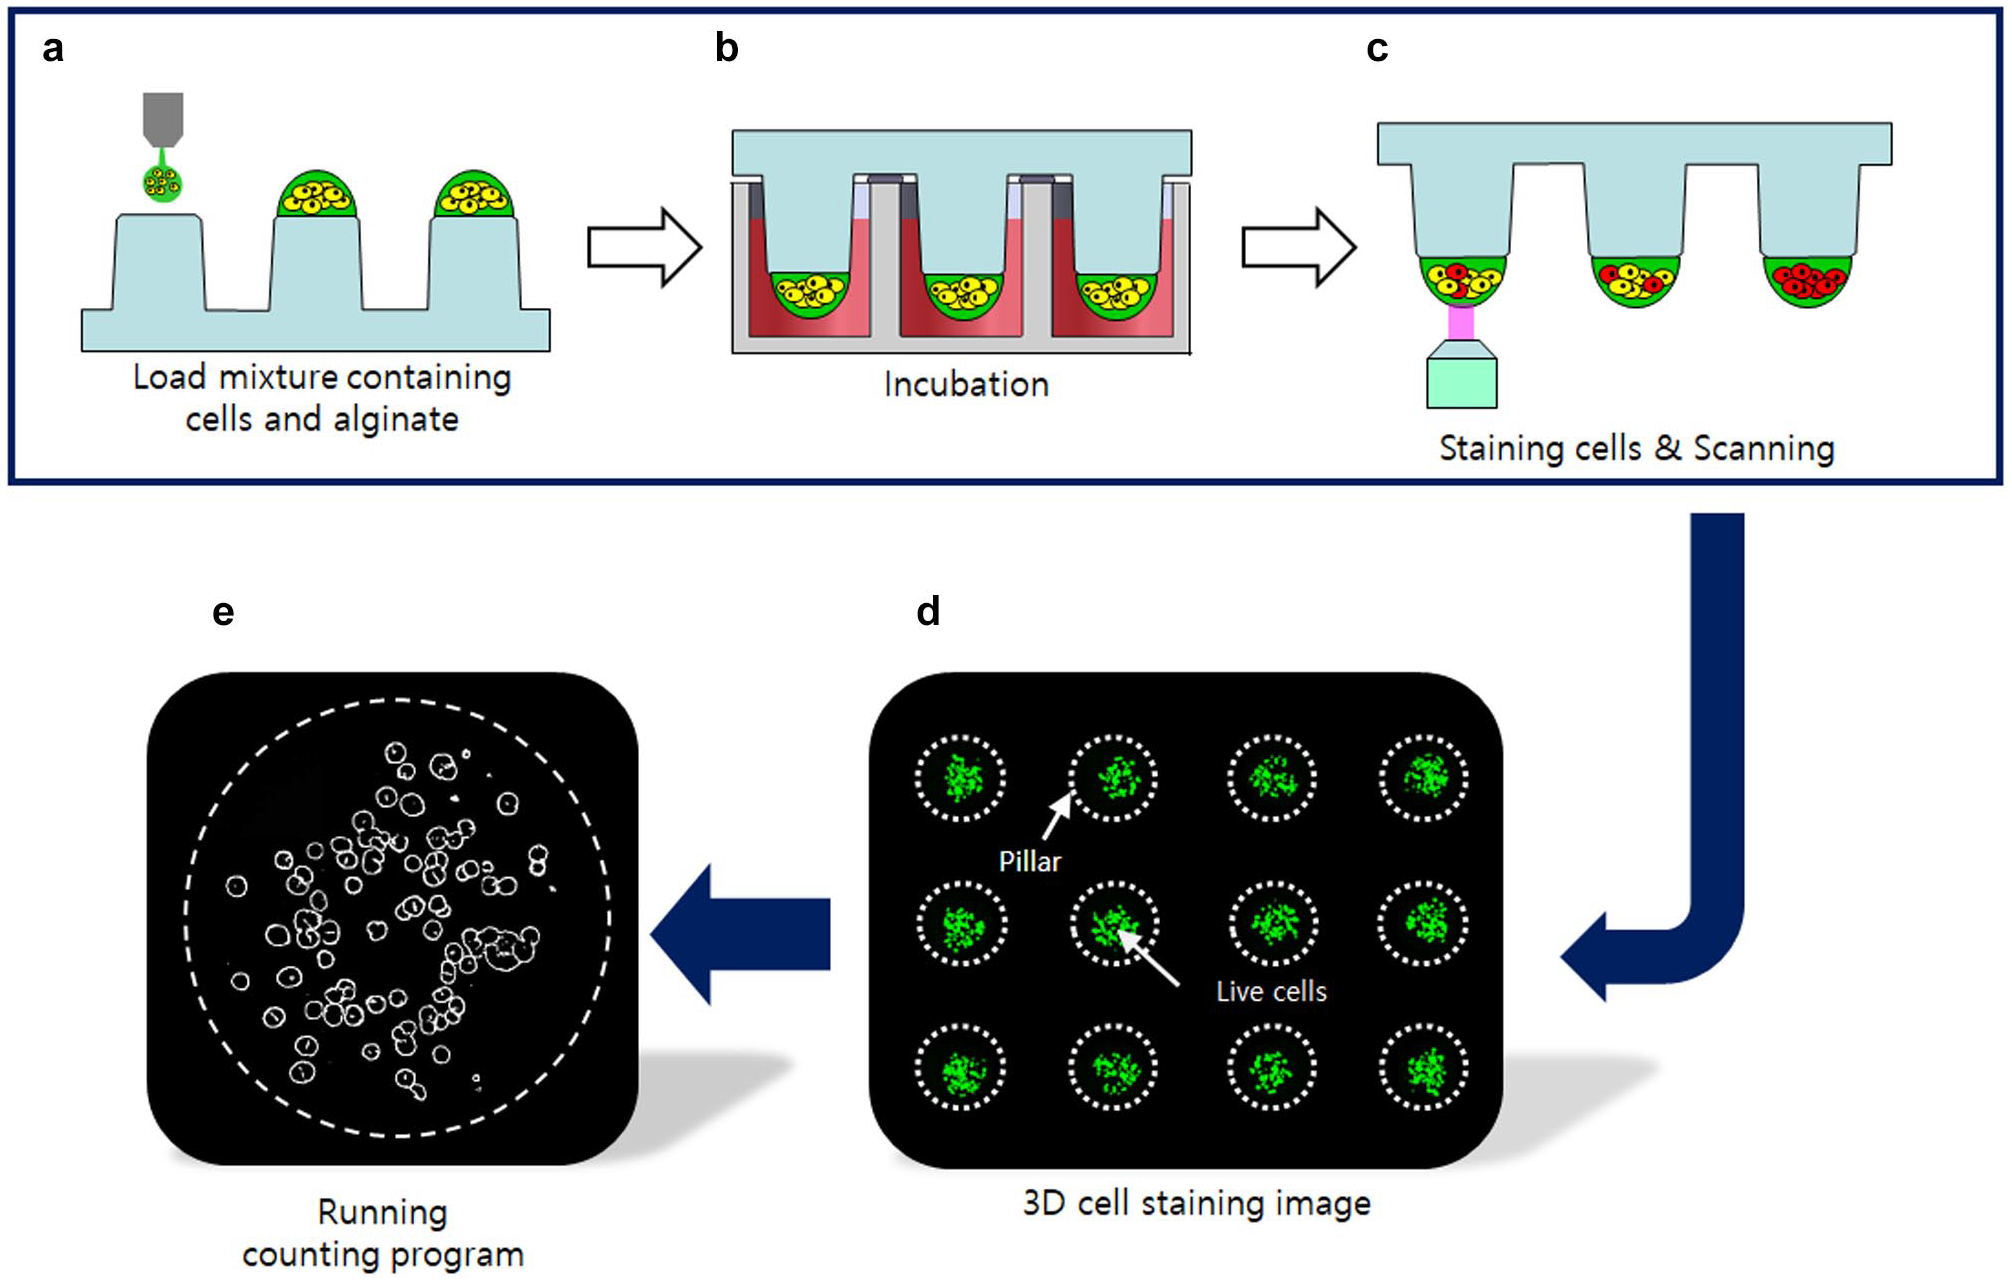
Procedure of seed cell counting and three-dimensional (3D) cell image acquisition. (
Preparation of 3D Cell Images for Deep Learning
The original cell images obtained through cell culture eliminate the unnecessary background and convert them into grayscale images. The mask images were created by drawing the contours of cells from the grayscale images. At the end of this process, the two images (the original grayscale image and the mask image) were divided into nine parts (3×3). The reason for dividing images is to train them accurately.
To create the training images, the original grayscale images and mask images were combined. Next, the test images were used to evaluate the performance of the proposed method. The test images need to be categorized into low, medium, and high densities (30, 90, and 150 cells/spot, respectively). Once the segmentation is complete, the test image is ready (
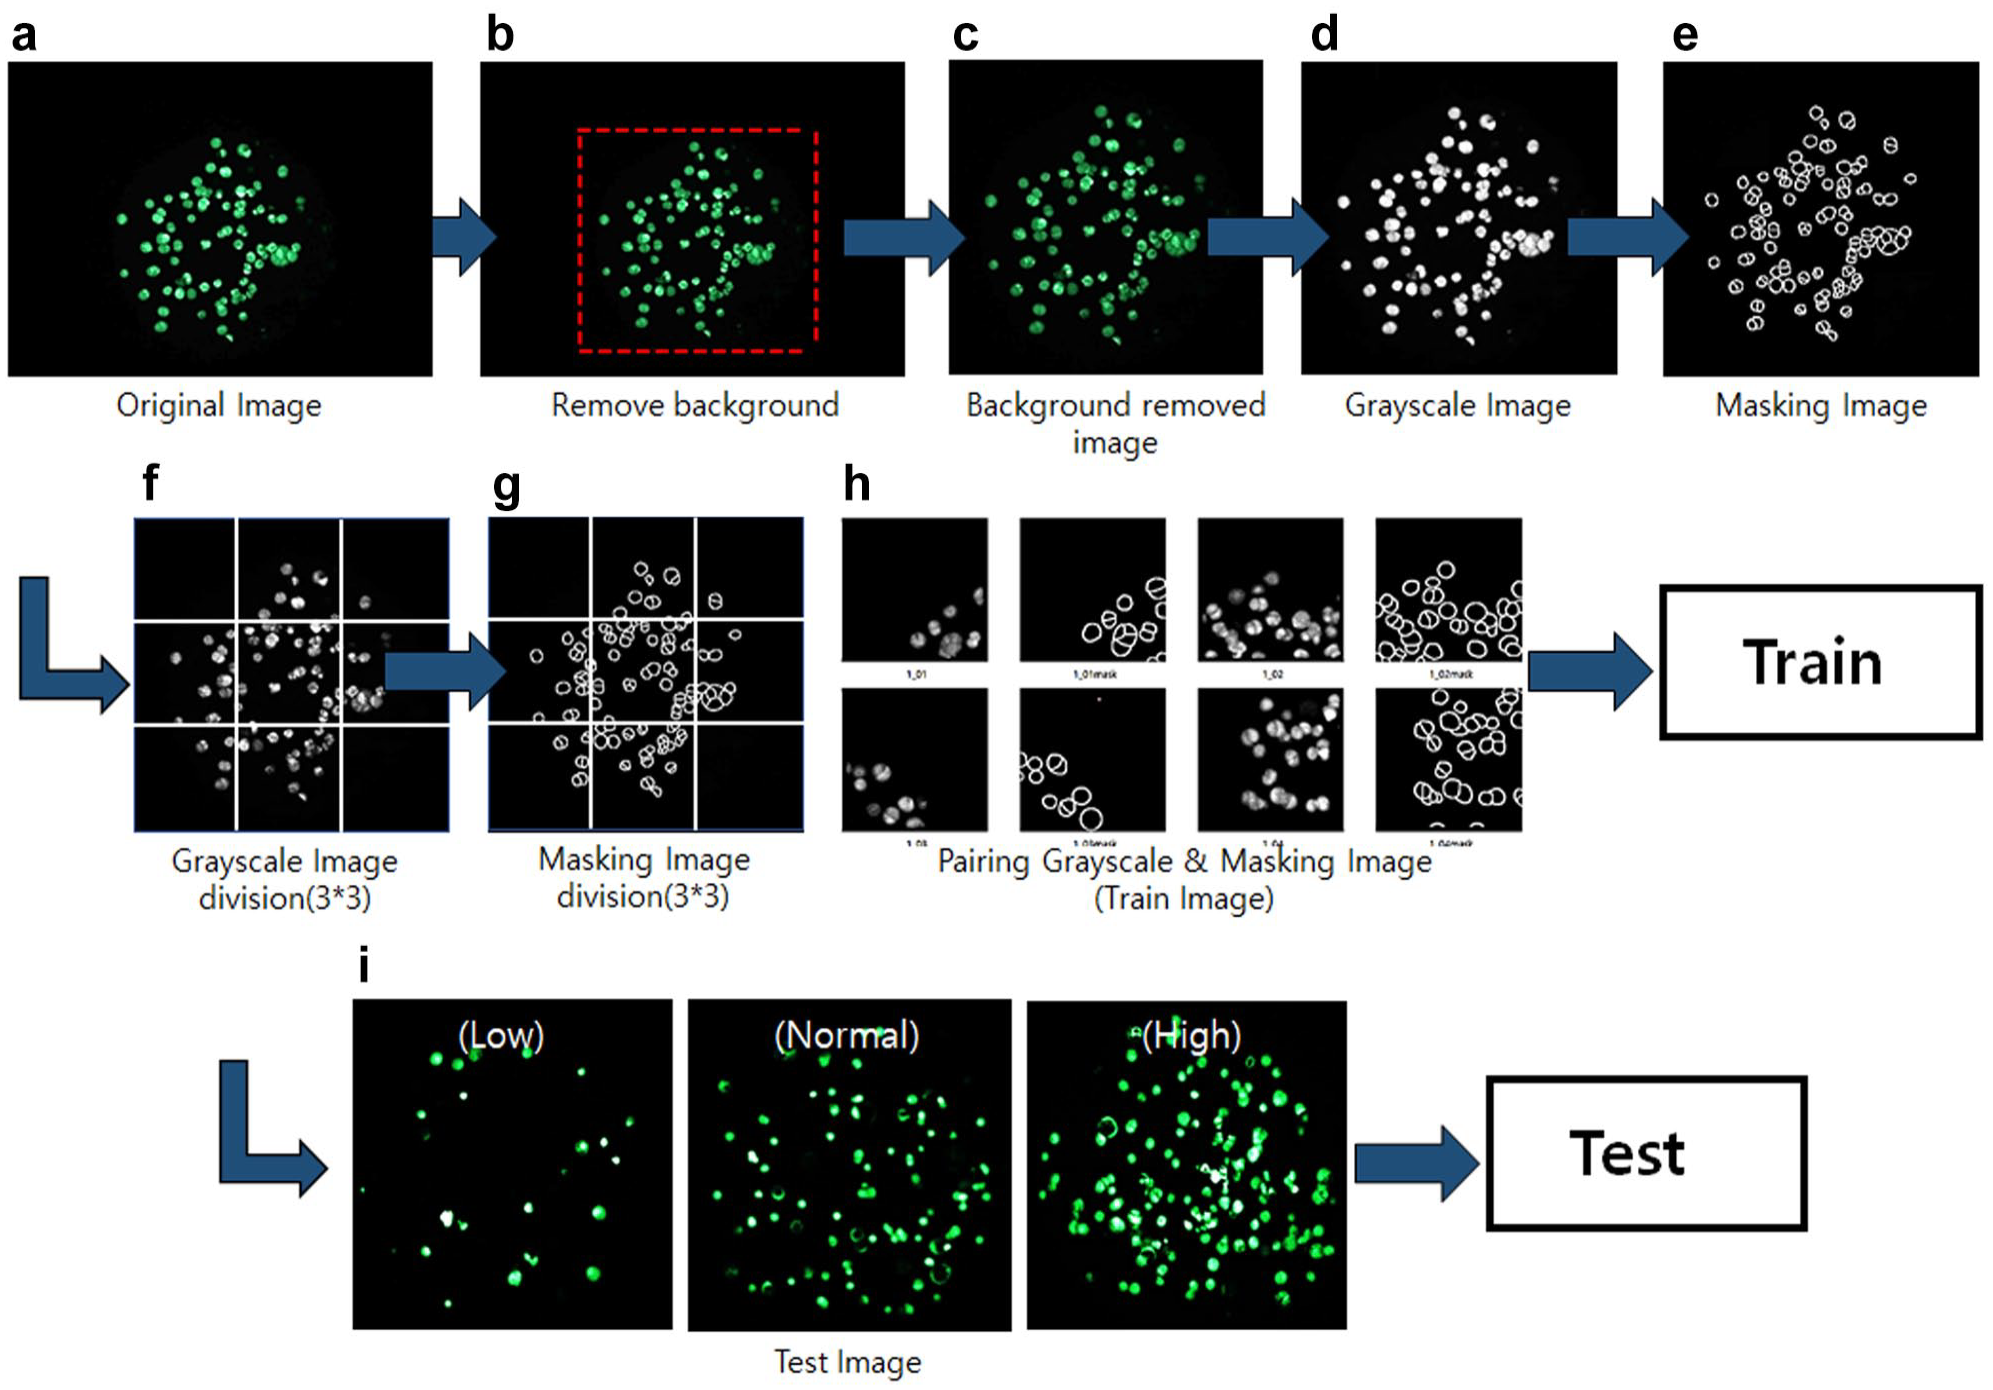
Procedure of deep learning. (
Procedure of Deep Learning
When the training and test images were ready, we proceeded to learn the data with Python 3.8. The training process was performed for different training images and learning times (or epochs). The numbers of training images (the numbers of mask images) were 15, 24, and 39. The images were divided into a 3×3 array (9 images). In terms of artificial neural networks, an epoch refers to one cycle through the full training dataset. The training epochs were 60,000, 100,000, and 150,000 times for each deep-learning condition ( Table 1 ). That is, 15 images were trained 60,000, 100,000, and 150,000 times. At the end of the training, the results of the different deep-learning conditions were compared and analyzed.
Test Conditions of Deep-Learning Training and Performance Evaluation.
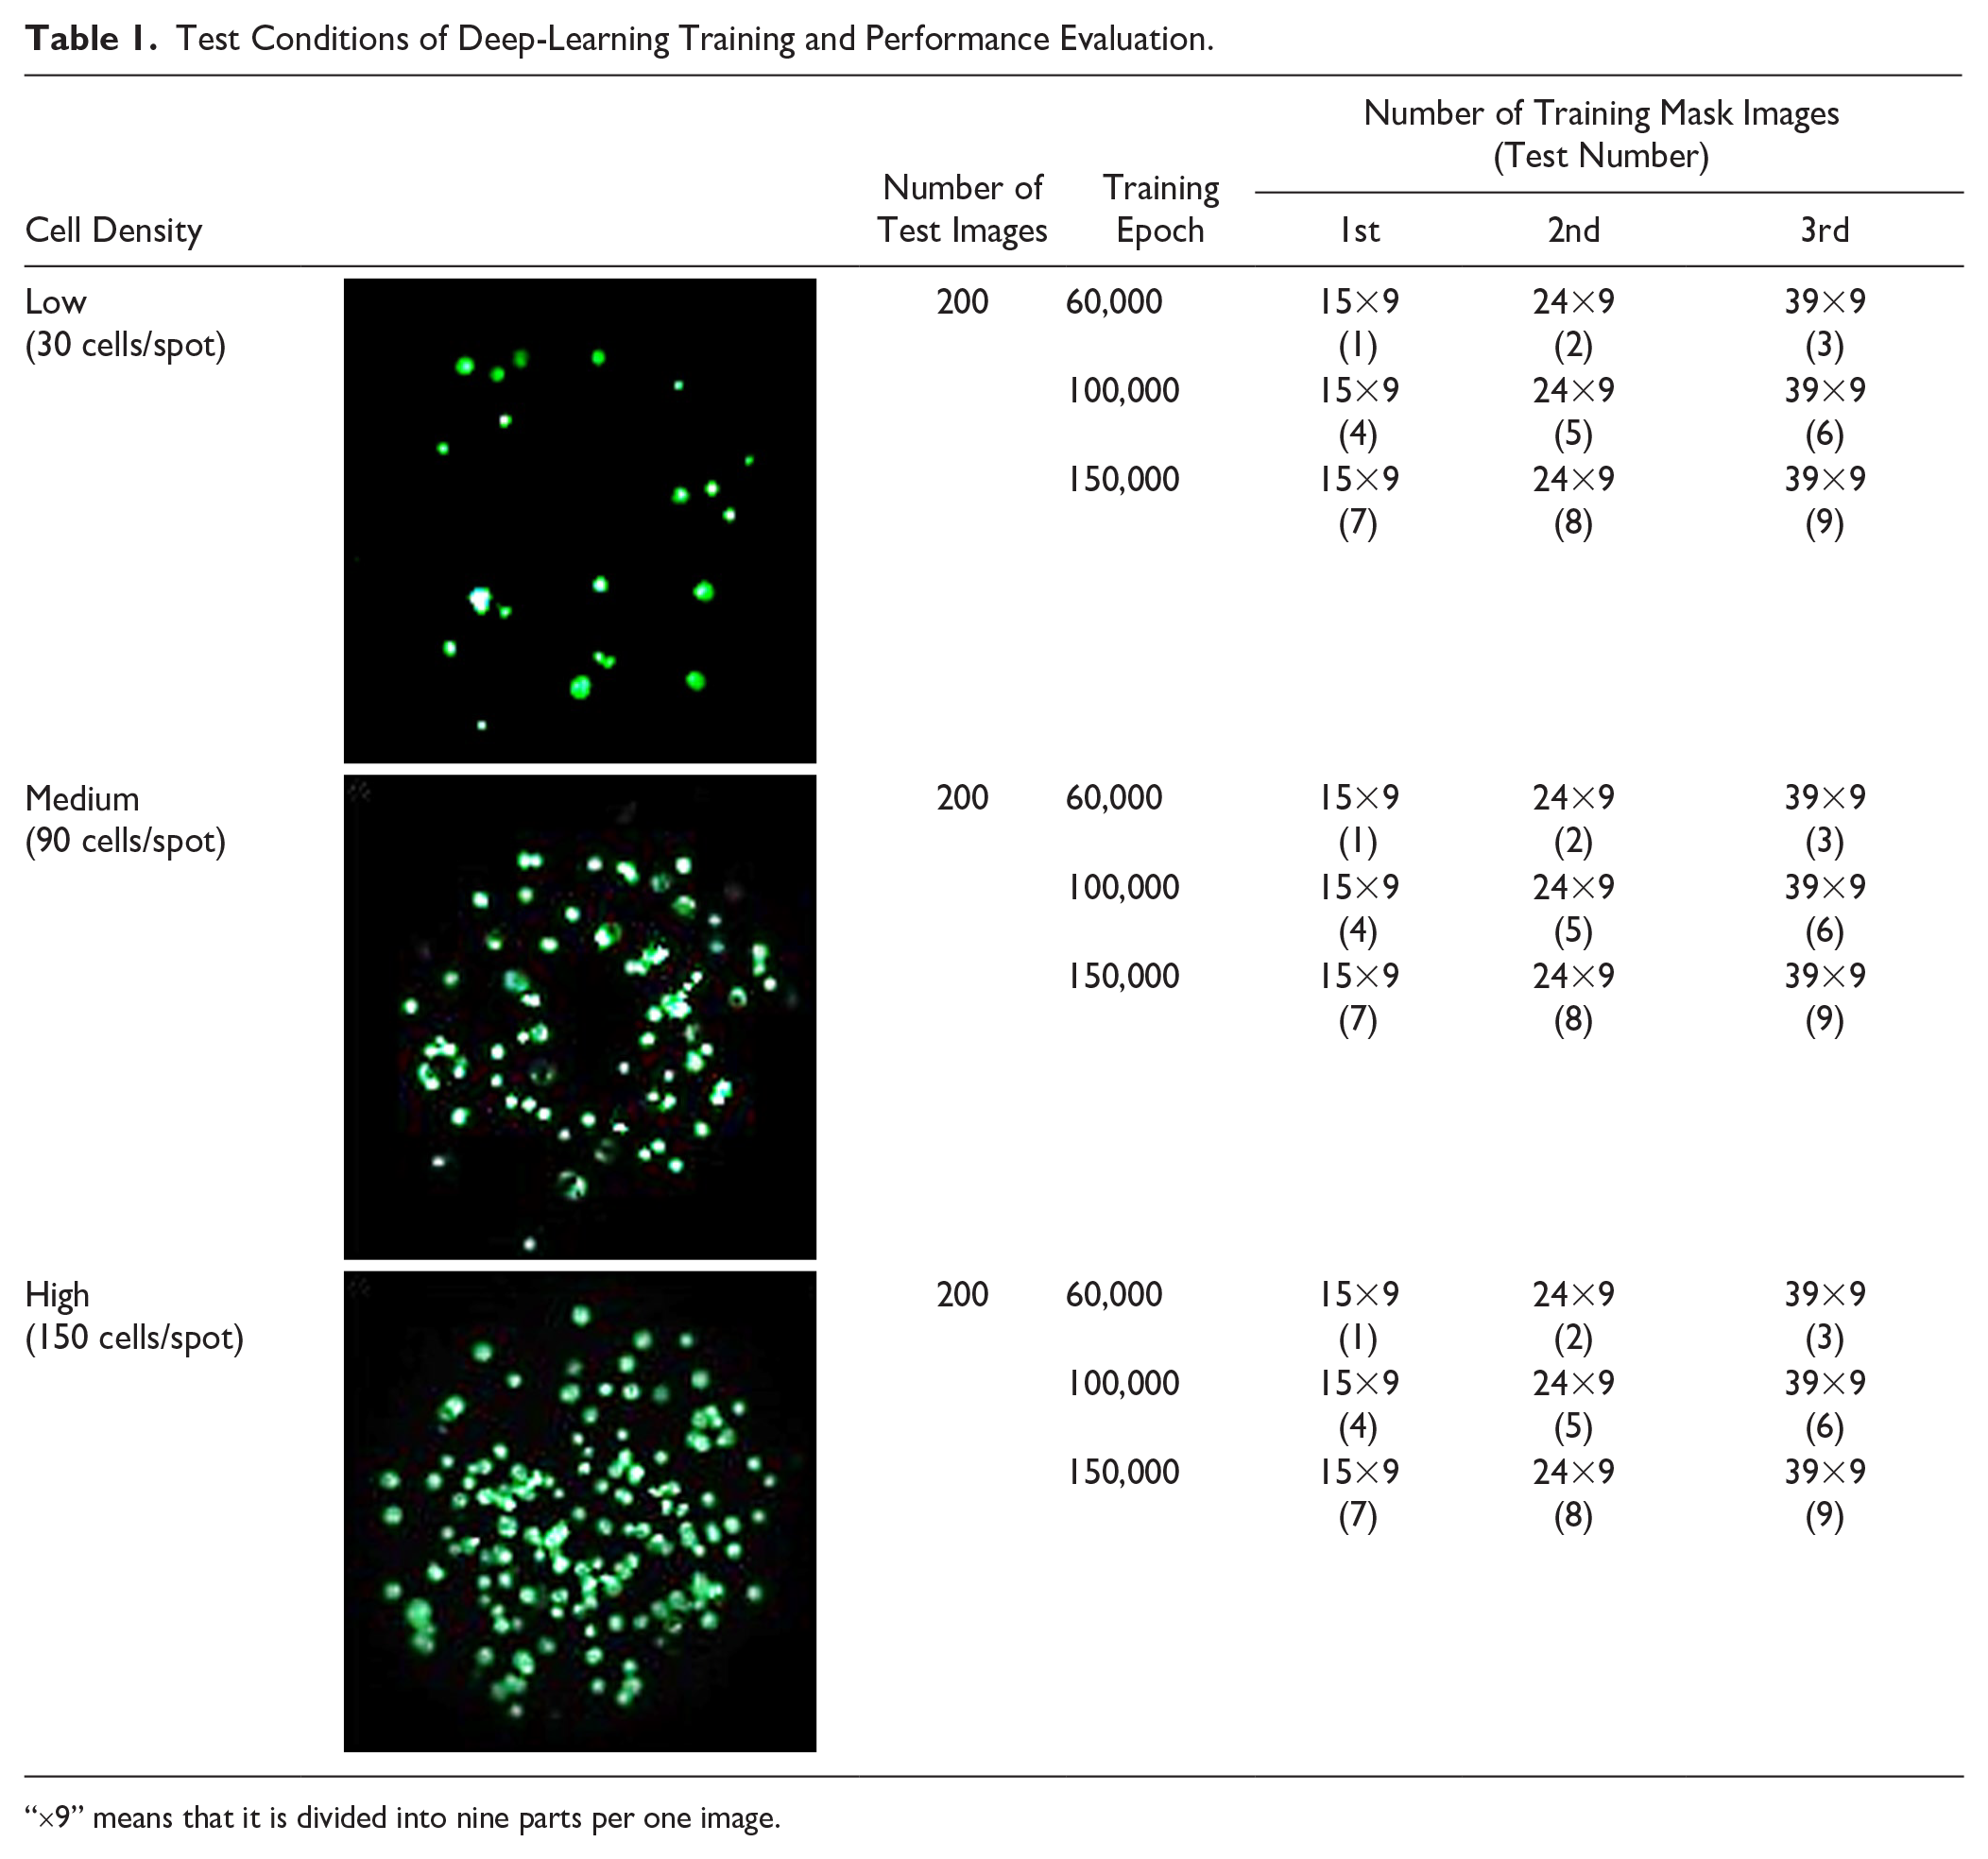
“×9” means that it is divided into nine parts per one image.
Results
Data Training of U-Net Deep Learning
The training process involves pairing the original and corresponding mask images and varying the number of training images and learning epochs (number of trainings). The number of training images is the same as the number of mask images. Each of the original and mask images is divided into nine parts (3×3 divisions). Data training was conducted three times for each training epoch. The first training had 15 images; the second, 24; and the third, 39. The epochs were 60,000, 100,000, and 150,000, respectively (
Table 1
).
Figure 3
shows the cell-counting errors of the deep-learning-based 3D cell counter based on the number of training images and epochs. The higher the number of training images and epochs, the better is the deep-learning result. Therefore, the third training with 39 images and epochs of 150,000 indicated the best results (
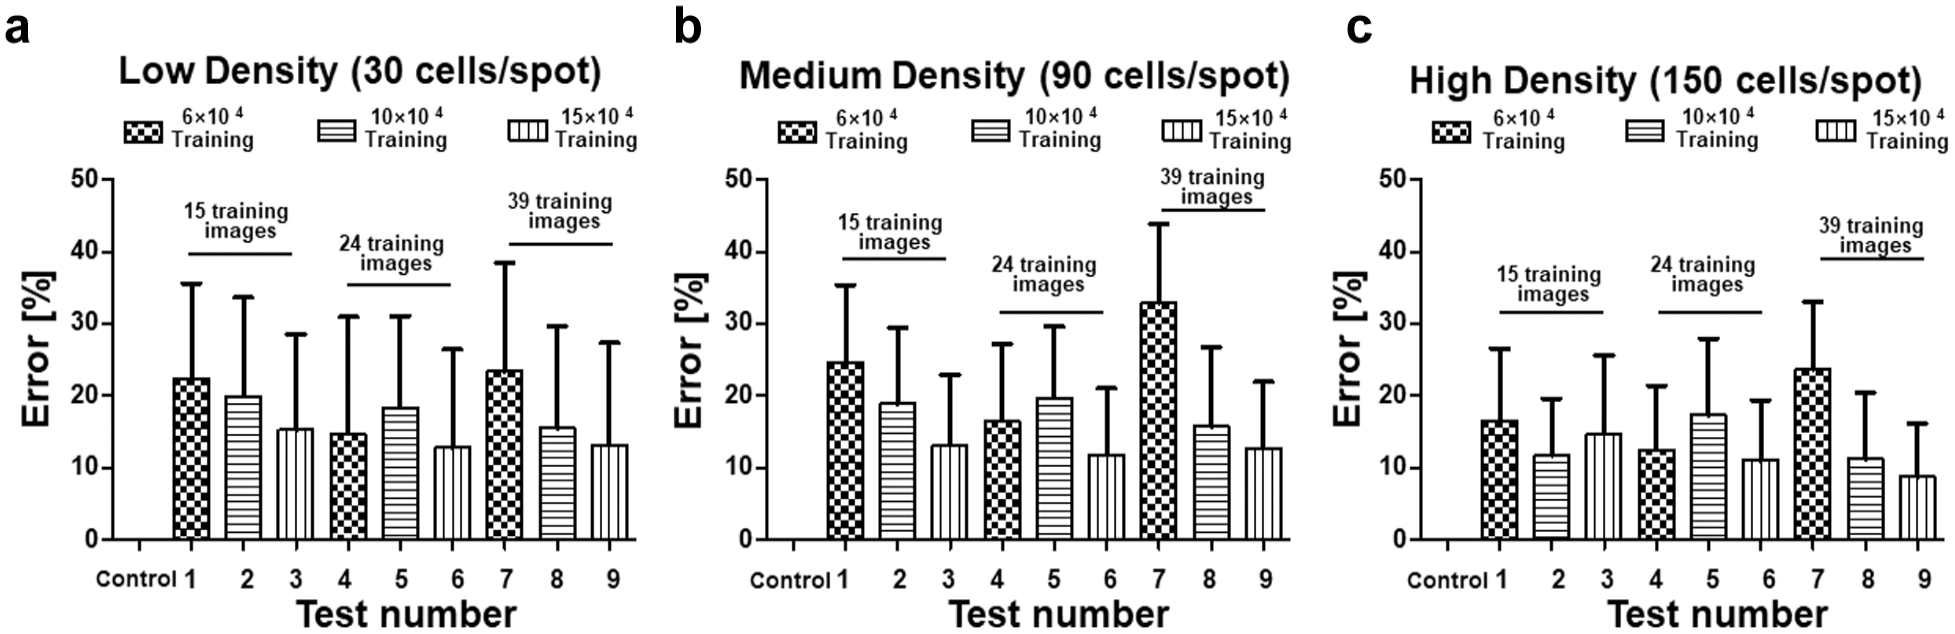
Cell-counting errors according to variations in training epochs and the number of training images for each cell density. Furthermore, the numbers on the horizontal axis are the “Test Numbers” listed in
Table 1
. (
Performance Evaluation of the U-Net-Based Cell Counter
The 3D cell-counting method was tested on low, medium, and high cell density images, and the number of images was unified to 200 each. Furthermore, cell images used in the test process are different from the training images to ensure that it does not affect the accuracy of the method. Performance evaluation is performed by comparing accuracies of cell-counting methods used previously (contour and watershed segmentations) and of the proposed deep-learning method. The cell numbers of 600 images were measured by eye inspection, contour, watershed, and deep learning according to three cell-seeding numbers.
Figure 6
shows that the three methods indicate no difference in accuracy for the low cell density images; however, clear differences are evident in normal and high cell density images. In
Figure 6a
, the deep-learning method shows good correlation with eye inspection according to cell densities. For high cell density images, the number of overlapping cells is high, which means difficult-to-count cell numbers; therefore, the differences in the accuracies of the method are large.
Figure 7
shows that the proposed method captures the most perfect cell outline compared to the existing methods. Thus, the proposed method can count cells most accurately regardless of image density (
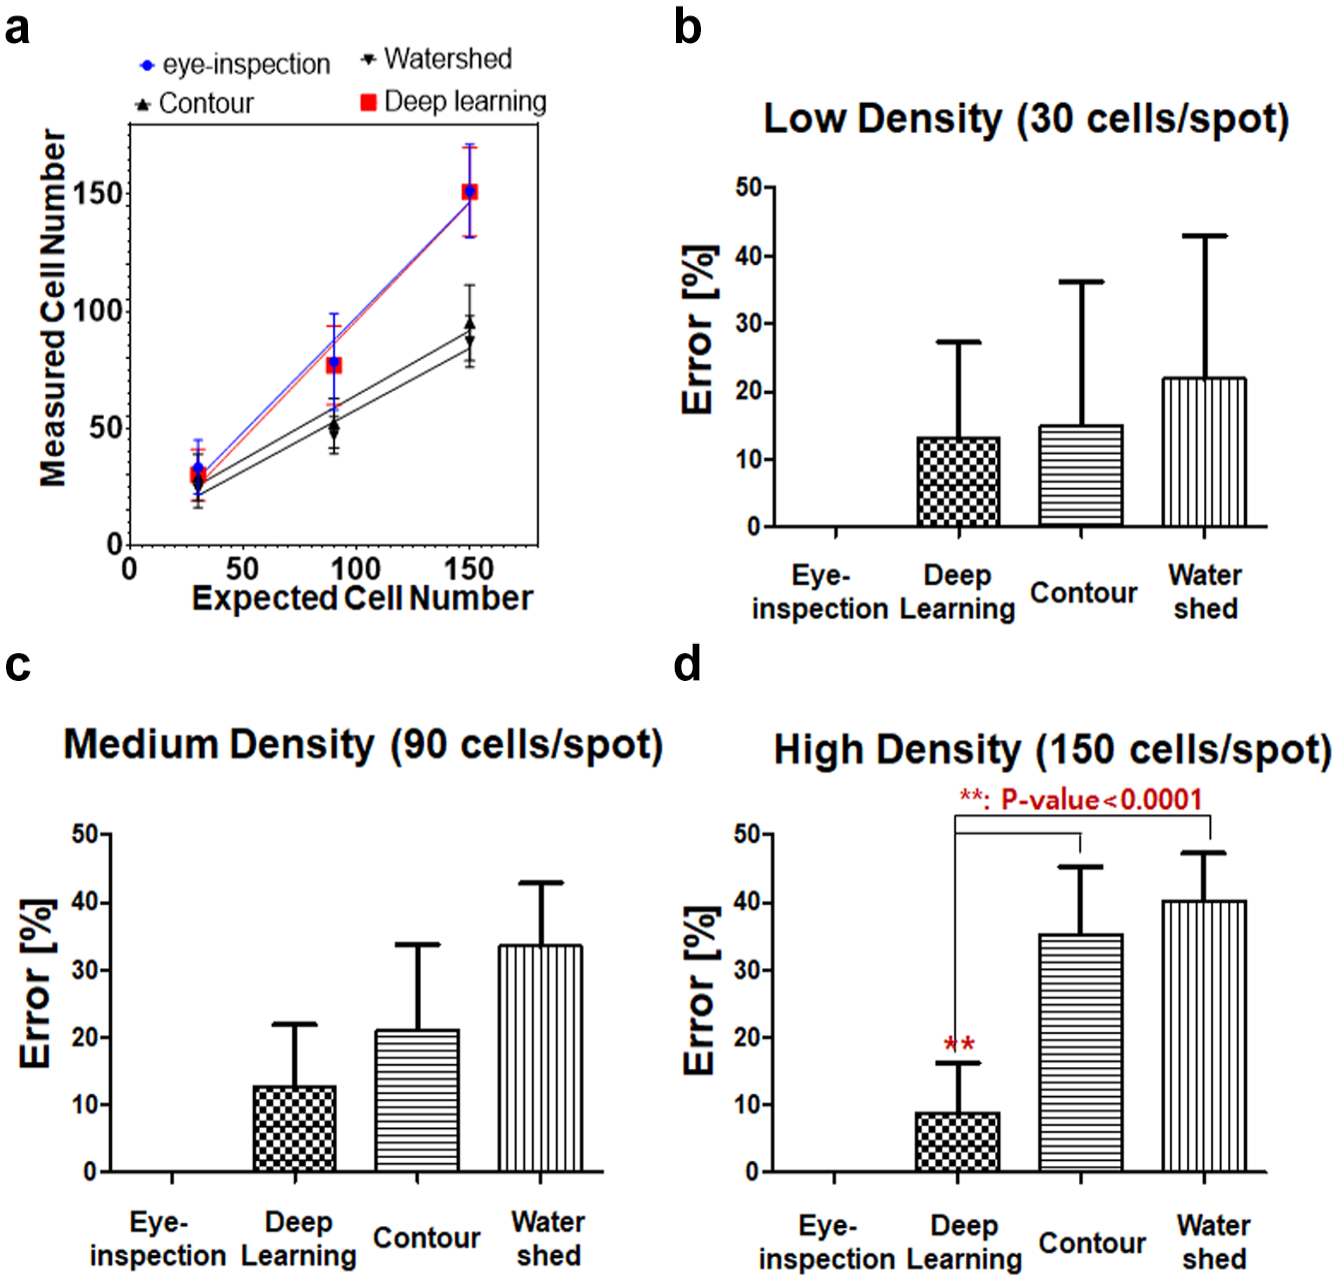
Comparison of cell-counting results according to counting method. The measured cell numbers of eye inspection, contour, watershed, and deep learning, according to three cell-seeding numbers. Cell-counting errors in (
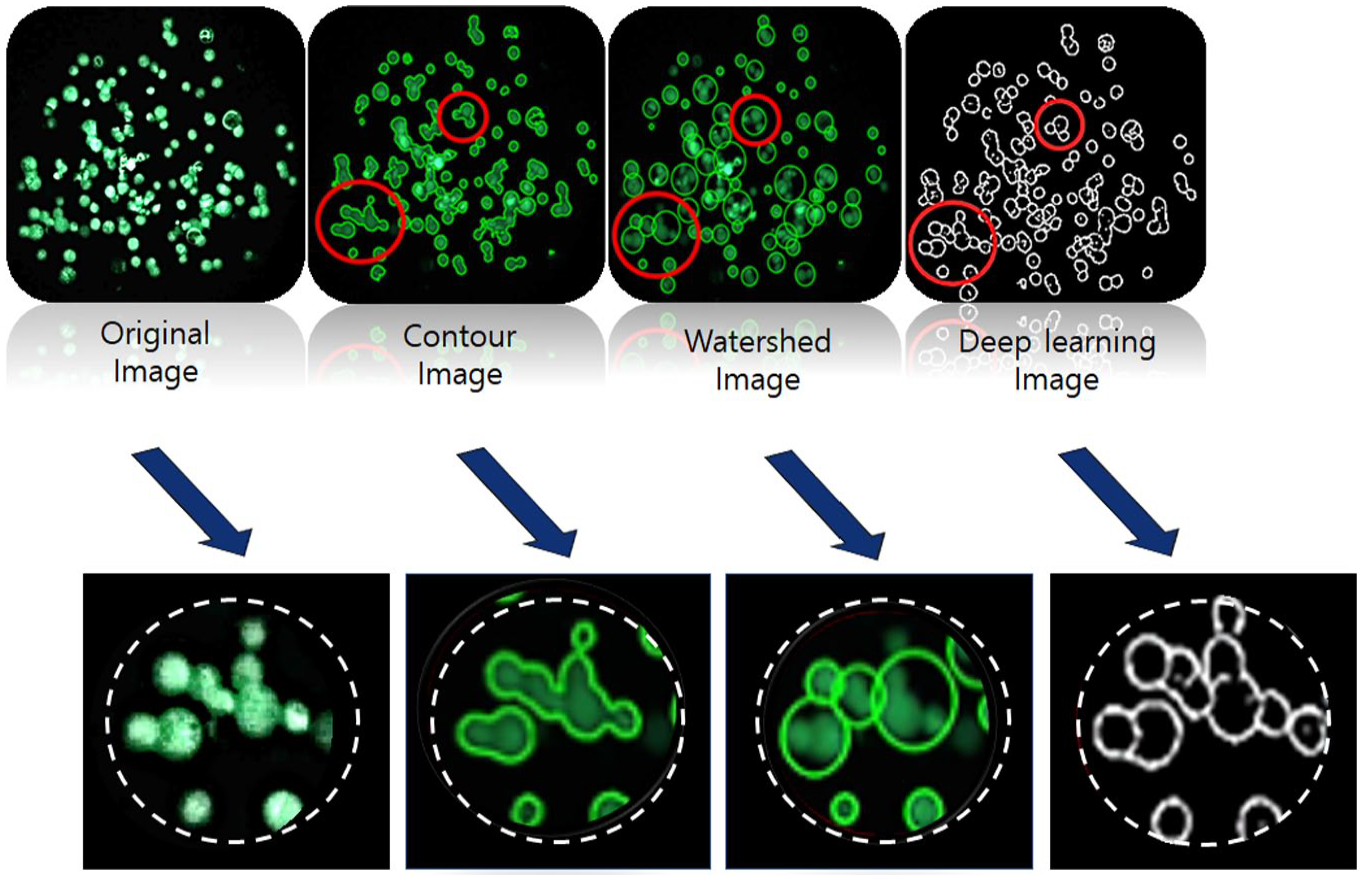
Cell-counting images for the different counting methods. These image data can be used to visually check the accuracy of each method.
Discussion
Image processing uses a wide range of techniques to avoid noise or signal distortions that affect the information in the image. Among these techniques, segmentation is used for region separation, and it is used to separate the information needed from the data.16,17 Segmentation is primarily used to segment meaningful areas of interest and simplify or change the image representation. 17
Active contour and watershed are commonly used segmentation methods for medical image processing.17,18 Watershed segmentation represents an image as a topography in which the value of each image element characterizes its height at some point. The algorithm then proceeds by identifying the water rises from the minimum height. Next, it creates lines to avoid mixing where water rises and joins different basins; when the water reaches its maximum height, all catchments are covered with watershed lines after the process ends.17,19
A contour is the boundary of an area designed for the area of interest required for an image, and it has the same intensity. The contour model creates parametric curves or contours that describe the boundaries of objects or other features of the image, and it defines minimum values of energy functions to achieve the desired contours. The curvature of the model is determined using various contour algorithms with applied external and internal forces.16,18,19
On comparing the two algorithms, it is evident that watershed segmentation is faster than contour segmentation; however, it has a disadvantage of oversegmentation.17,20 Contour segmentation is more accurate and complex than watershed; however, it is sensitive to noise.18,20 In comparison to these two methods, the proposed method requires a longer computation time; however, it achieves the lowest seed cell-counting error regardless of cell density (
Conclusions
The proposed 3D cell counter that uses U-net deep learning was applied to high-density aggregated cells in ECM to identify seeding cell numbers in a 3D cell-based assay. The proposed method increased accuracy as the number of training epochs and images increased. In the experiment, the proposed method was able to pinpoint the cell boundaries, unlike conventional methods, and the difference in accuracy was verified numerically and visually. The proposed method reduced cell-counting errors to about 10% in three-dimensionally located cells from those in the conventional methods (contour segmentation, 30%; watershed segmentation, 40%). Thus, the proposed method can reduce the counting error of seed cells in 3D cell-based assays by providing the exact number of cells to researchers, thereby enabling the acquisition of high-quality experimental data.
Footnotes
Declaration of Conflicting Interests
The authors declared no potential conflicts of interest with respect to the research, authorship, and/or publication of this article.
Funding
The authors disclosed receipt of the following financial support for the research, authorship, and/or publication of this article: This article was supported by the Konyang University Research Fund in 2019. This work was also supported by the Korea Medical Device Development Fund grant funded by the Korea government (the Ministry of Science and ICT, the Ministry of Trade, Industry and Energy, the Ministry of Health & Welfare, the Ministry of Food and Drug Safety) (Project Number: KMDF_PR_20200901_0153-2021).