
Abstract
Area-based and intensity-based 3D cell viability measurement methods are compared in high-throughput screening in order to analyze their effects on the assay results (doubling time and IC50) and their repeatability. Many other 3D cell-based high-throughput screening platforms had been previously introduced, but these had not clearly addressed the effects of the two methods on the assay results and assay repeatability. In this study, the optimal way to analyze 3D cultured cells is achieved by comparing day-to-day data of doubling times and IC50 values obtained from the two methods. In experiments, the U251 cell line is grown in chips. The doubling time, based on the area of the 3D cells, was 27.8 ± 1.8 h (standard deviation: 6.6%) and 27.8 ± 3.8 h (standard deviation: 13.7%) based on the intensity of the 3D cells. The doubling time calculated by area shows a smaller standard deviation than one calculated by intensity. IC50 values calculated by both methods are very similar. The standard deviations of IC50 values for the two methods were within ±3-fold. The IC50 variations of the 12 compounds were similar regardless of the viability measurement methods and were highly related to the shape of the dose–response curves.
Introduction
Over the past few decades, cell-based assays have become the gold standard in drug development and biological testing. 1 In recent years, most pharmaceutical companies have been using various high-throughput screening (HTS) systems to select or optimize best lead compounds from candidate compounds targeting many molecules or genes related to diseases. 2 HTS systems have been commercially well developed and fully validated for more than a decade. However, these systems are based on two-dimensional (2D) cell monolayer cultures where some cells lose their phenotypic properties.3–6 Compared to three-dimensional (3D) environments in the original tissue, 2D cells are cultured as a monolayer on a surface that changes their original morphology and biochemical features.7–10 Thus, the ability to predict the clinical response of new compounds in 2D cell-based HTS is limited.2,7,11 This lack of predictability may arise because such systems do not mimic the response of cells in the 3D microenvironment of in vivo tissues or tumors.
To overcome environmental issues, numerous 3D cell culture systems have been introduced.12–14 3D cell culture systems can be divided into two categories: (1) cultures with extracellular matrices (ECMs) or scaffolds and (2) spontaneous cell aggregation, such as a hanging drop, U-shape well plate, and others. These systems have successfully grown cells in a 3D manner, but the miniaturization and automation issues in relation to the adaptation of 3D culture systems to HTS still remain. Specifically, media changes without imposing any damages to the 3D ECM structures or cells can become tedious and very carefully executed tasks. Correspondingly, these represent the bottlenecks for the miniaturization and automation of 3D cell cultures. To solve these issues, our group proposed a micropillar and microwell chip platform 15 that changes the media by replacing the microwell chip containing media. The micropillar and microwell chip platform conducts media changes by transferring the micropillar chip containing the 3D cells to other microwell chips containing fresh media or compounds. This medium-changing method can be applicable to the exposure of cells to different compounds as well as cell staining, thus allowing us to perform complicated miniaturized 3D cell-based assays in a high-throughput manner. Our group has successfully tested many compounds with several 3D cultured cell lines (Hep3B, HepG2, A395, A549, HT29, SW48, SW620, etc.) and patient-derived cells in the micropillar and microwell chip platform.
However, previous 3D cell culture systems,12–15 including the micropillar and microwell chip platform, do not clearly address the effects of assay repeatability and the area-based or intensity-based 3D cell viability measurement on the assay results (doubling time and IC50, i.e., concentration of the compound where 50% of the cell growth was inhibited). Particularly important are the assay repeatability effects on the robustness of the assay, which constitutes a critical barrier for the application of 3D cell-based assays to HTS.
In this study, automatic 3D cell analysis of the micropillar and microwell chip platform is fully addressed by measuring 3D cell viability, based on the area and intensity of the cells for the calculation of doubling times and IC50 values of 12 compounds in U251 brain cancer cell lines. In previous studies analyzing 3D cultured cells,12–15 the cell viability was measured by the area or by the fluorescence intensity of the cells. However, these studies have not addressed the effects of the two different methods on calculations of cell viability or assay repeatability.
In this paper, automatic 3D cell analysis with high-throughput makes it possible to statistically compare the two methods with many replicates in the chips. By comparing the doubling time and IC50 calculated based on the area and intensity of the cells in 3D, and in many repeated tests, the optimal way to analyze 3D cultured cells is deduced and presented.
Materials and Methods
Cell Preparation
The U251 brain cancer cell line was obtained from ATCC and cultured in the Roswell Park Memorial Institute (RPMI) medium 1640 (CellGro, New York, NY, USA), supplemented with 10% fetal bovine serum (FBS; CellGro) and 1% penicillin–streptomycin (Invitrogen, Grand Island, NY) in cell culture petri dishes (100 mm in diameter; Corning, Lowell, MA) in a humidified 5% CO2 incubator (Sheldon Manufacturing, Inc., Cornelius, OR, USA) at 37 °C. The cells were routinely passaged every 4 days at 70% confluence. The cell suspensions were prepared by trypsinizing a confluent layer of the cells with 0.3 mL of 0.25% trypsin in 0.53 mM EDTA (Invitrogen) from the culture dish, and by resuspending the cells in 7 mL of RPMI supplemented with 10% FBS. After centrifugation at 2000 revolutions per minute (rpm) for 3 min, the supernatant was removed and the cells were resuspended with RPMI supplemented with 10% FBS to a final concentration of 10 × 106 cells/mL. The number of cells in RPMI was calculated using the automatic cell counting kit of AccuChip (Digital Bio, Seoul, Korea). For the passage of the cells, 1 × 10⁶ cells were seeded in a 100 mm petri dish containing 20 mL of growth medium.
Micropillar and Microwell Chips
The micropillar and microwell chips are made by plastic injection molding, which is a more robust and flexible system for mammalian cell cultures, enzymatic reactions, viral infection, and compound screening (
Fig. 1a
). Polystyrene, a widely used biocompatible plastic, is used for the micropillar and microwell chips. The micropillar chip contains 532 micropillars (0.75 mm pillar diameter and 1.5 mm pillar-to-pillar distance). In order to polymerize alginate, 80 nL of poly-
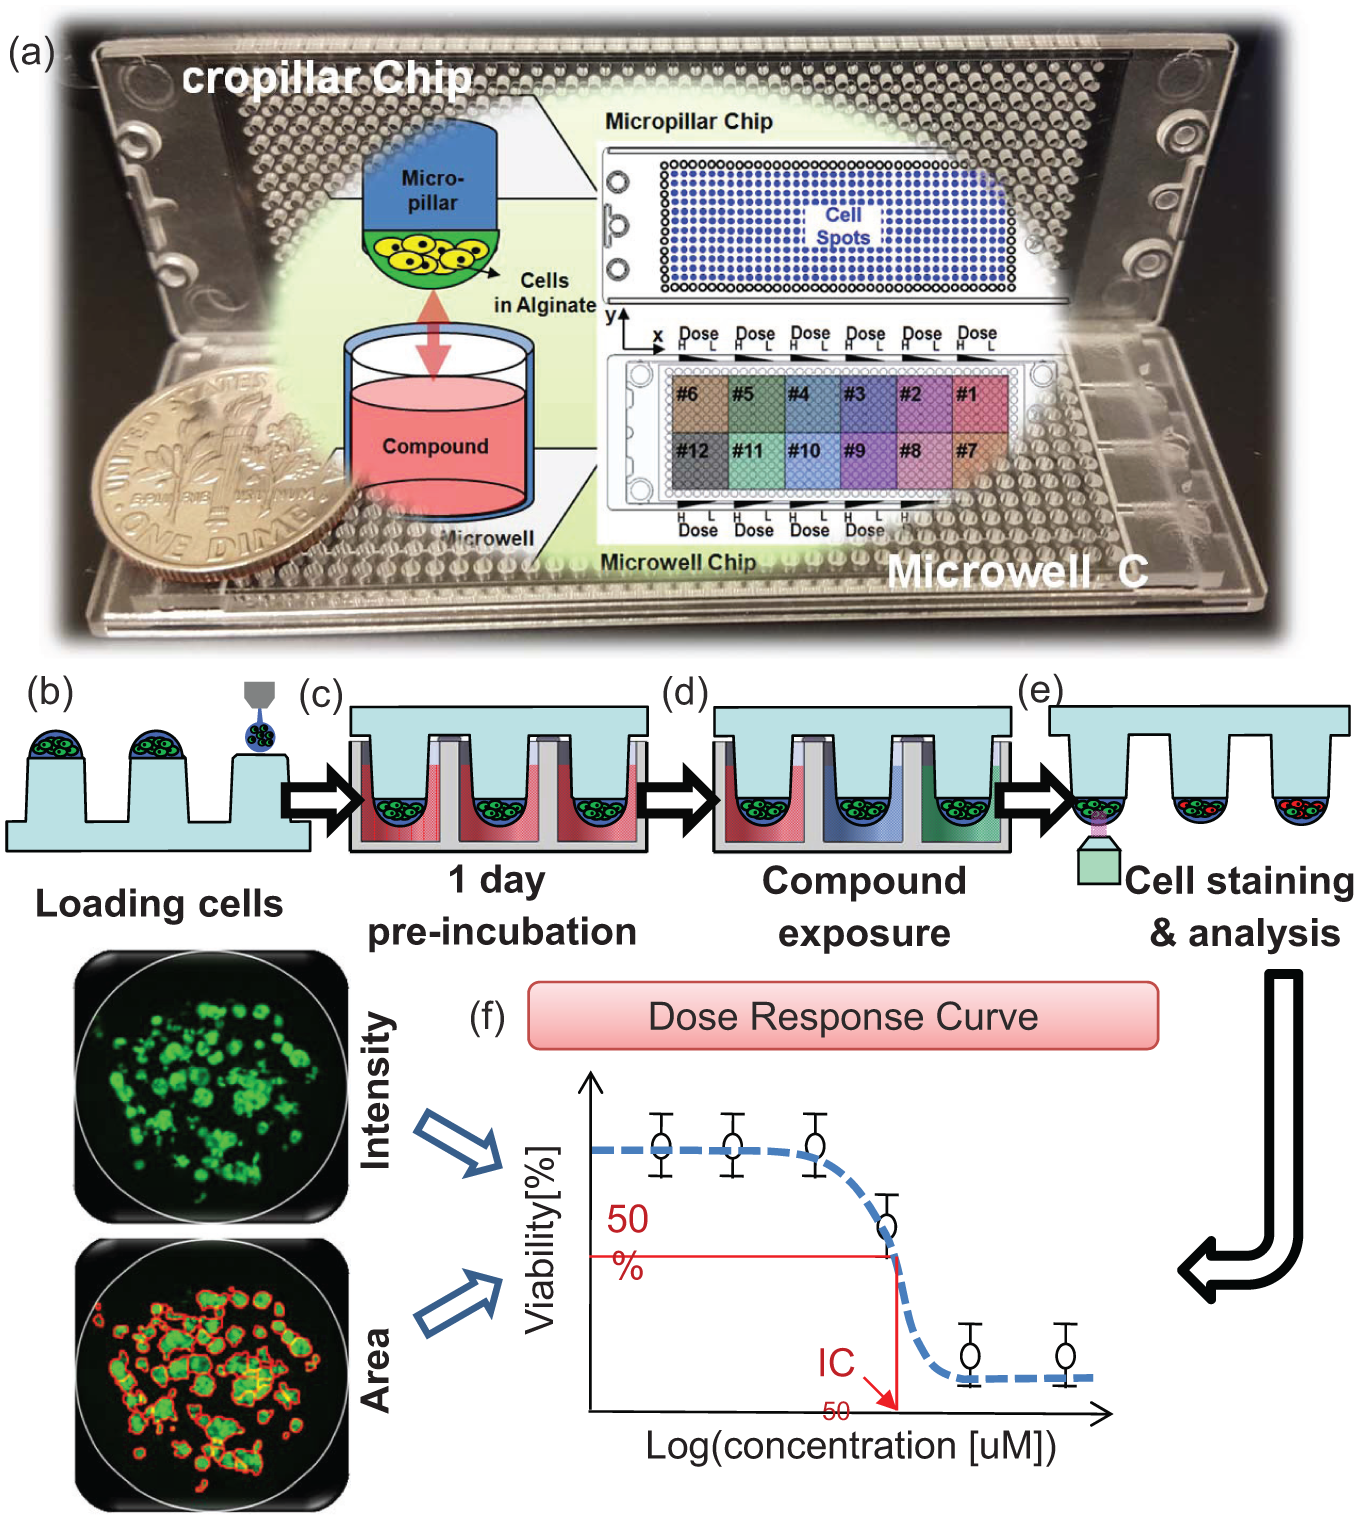
A schematic and photograph of the micropillar and microwell chip platform and its experimental procedure: (
Chip Layout and Experimental Procedure
The chip layout for the screening of the 12 studied compounds in a single micropillar or microwell chip is shown in Figure 1a . In the micropillar chip, approximately 80 cells were immobilized with 0.5% alginate in each micropillar. The microwell chip was divided into 12 regions, and each region consisted of a 6 × 6 microwell array, as shown in Figure 1a . Each region contained six compound entities (five dosages plus one control) along the x axis of the array, and each dose was replicated six times along the y axis. The control was growth media without any compound substance. Each region could elicit one dose–response curve for each compound. Thus, one chip has a capacity for screening 12 compounds by drawing 12 dose–response curves and calculating the corresponding IC50 values.
As shown in Figure 1 , the micropillar chip containing human cells in alginate was sandwiched (or stamped) with the microwell chip for 3D cell cultures and compound efficacy tests. As shown in Figure 1b , the micropillar chip consisted of 532 pillars with a diameter of 750 µm, onto which 40 nL alginate droplets of human brain cancer cells were dispensed with the S+ microarrayer. The S+ microarrayer used a solenoid valve (Lee Company, Westbrook, CT, USA) to dispense 40 nL droplets of the cell/alginate mixture and 950 nL of media or compounds. For stabilizing the cells, the micropillar chip containing the cells was sandwiched with the complementary microwell chip, which consisted of 532 wells with a 1.2 mm diameter each, into which 950 nL of growth media ( Fig. 1c ) had been previously dispensed. After 1 day of incubation, the micropillar chip containing the cells moved to the new microwell chip filled with various test compounds. The combined chips were incubated for 3 days for the compound efficacy test, as shown in Figure 1d . To measure cell viability, cells on the micropillar chip were stained and scanned ( Fig. 1e ). The scanned images of Figure 1f on the left were obtained using an optical fluorescence scanner (S+ chip scanner, SEMCO). Green dots represent stained live cells. A staining dye solution was prepared by adding 1.0 µL of Calcein AM (4 mM stock from Invitrogen) in 8 mL of 140 mM NaCl supplemented with 20 mM CaCl2. By extracting the intensities of the green fluorescence, the viability could be calculated according to compound doses (see dose–response curve in Fig. 1f ). Based on the dose–response curves, IC50 values are calculated using the micropillar and microwell chip platform for determining the efficacy of the 12 tested compounds.
3D Cell Image Analysis for Doubling Time and IC50 Calculation
The S+ chip analyzer (SEMCO) analyzed the image of the 3D grown cells in a sampled droplet extracted from each micropillar based on the intensity and area. In the case of the intensity, the software defined the boundary of the analysis as the micropillar and calculated the mean intensity by dividing the total green fluorescence intensities in the micropillar (8-bit green color code representation among all possible RGB color codes, ranging from 0 to 255) by the total number of pixels of the micropillar (boundary of analysis). In the case of the area, the software counted the number of pixels whose intensity was higher than that of the background (30 green codes) and calculated the area of the colonies.
Based on the intensity and area of the colonies on the micropillar, the doubling time for 3 days of incubation was calculated using the following equation:

where P1 day and P4 day denote representative parameters relevant to 1 and 4 days, respectively. For example, the intensity and area of the colonies could be denoted by the parameters P1 day and P4 day.
To calculate IC50, the percentages of live cells (cell viabilities) are calculated according to compound concentrations using the intensity and area values. The cell viabilities were normalized as the no-compound condition was 100%. The sigmoidal dose–response curves (variable slope) and the IC50 values were obtained using the following equation:
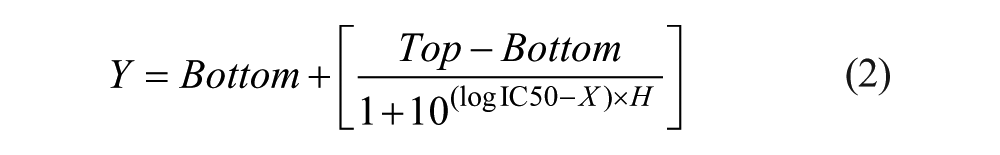
where IC50 is the midpoint of the curve, H is the hill slope, X is the logarithm of the compound concentration, and Y is the response (cell viability), starting at the bottom and going to the top, based on a sigmoidal response shape. The S+ chip analyzer (SEMCO), which is an optimized software to the micropillar and microwell chip platform, assigned the bottom to zero and the top to 100 when it drew the fitting curve.
Results and Discussion
The doubling time could be calculated based on the intensity and area of the cells. In three repeated tests, the same Calcein AM was used for staining cells, but the stained green intensities showed a higher variation in day-to-day experiments. The 4-day cell image for test 1 in Figure 2 shows a faint green color compared to the images for tests 2 and 3. The intensity of the 4-day cell image for test 1 was 14.2 ± 4, which was lower than the elicited values of 29.1 ± 0.6 and 24.1 ± 1.2 for tests 2 and 3, respectively. In three tests, the mean intensity in the 4-day cell image was 22.4 ± 7.5, which showed a 33.6% difference from the intensity of test 1. However, the areas of the cells extracted from the 4-day cell images for the three tests were similar. The area of the cells for test 1 was 21,159 ± 2845 pixels2, which was similar to 24,805 ± 1026 pixels2 for test 2 and 25,118 ± 799 pixels2 for test 3. In the three tests, the area of the cells in the 4-day cell image was 23,694 ± 2200 pixels2, which showed a 9.2% difference from the intensity of test 1. The area-based cell viability shows smaller variation than the intensity-based cell viability. The doubling times based on the green intensity of the cells were 31.3, 23.8, and 28.3 for the three tests. The doubling time of 31.3 was longer than the two others due to the faint 4-day cell image of test 1. However, doubling times based on the area of the cells yielded similar values for the three conducted tests and equaled 27.3, 26.3, and 29.8. Doubling times calculated based on the intensity and areas of the cells were 27.8 ± 3.8 and 27.8 ± 1.8 in the three day-to-day experiments, respectively. The doubling time based on the intensity of the cells showed a higher variation than the variation based on the cellular area. Throughout the three repeated tests, the analyses of the area of the cells showed a better day-to-day repeatability in the calculation of the doubling time than the color intensity analysis of the cells.
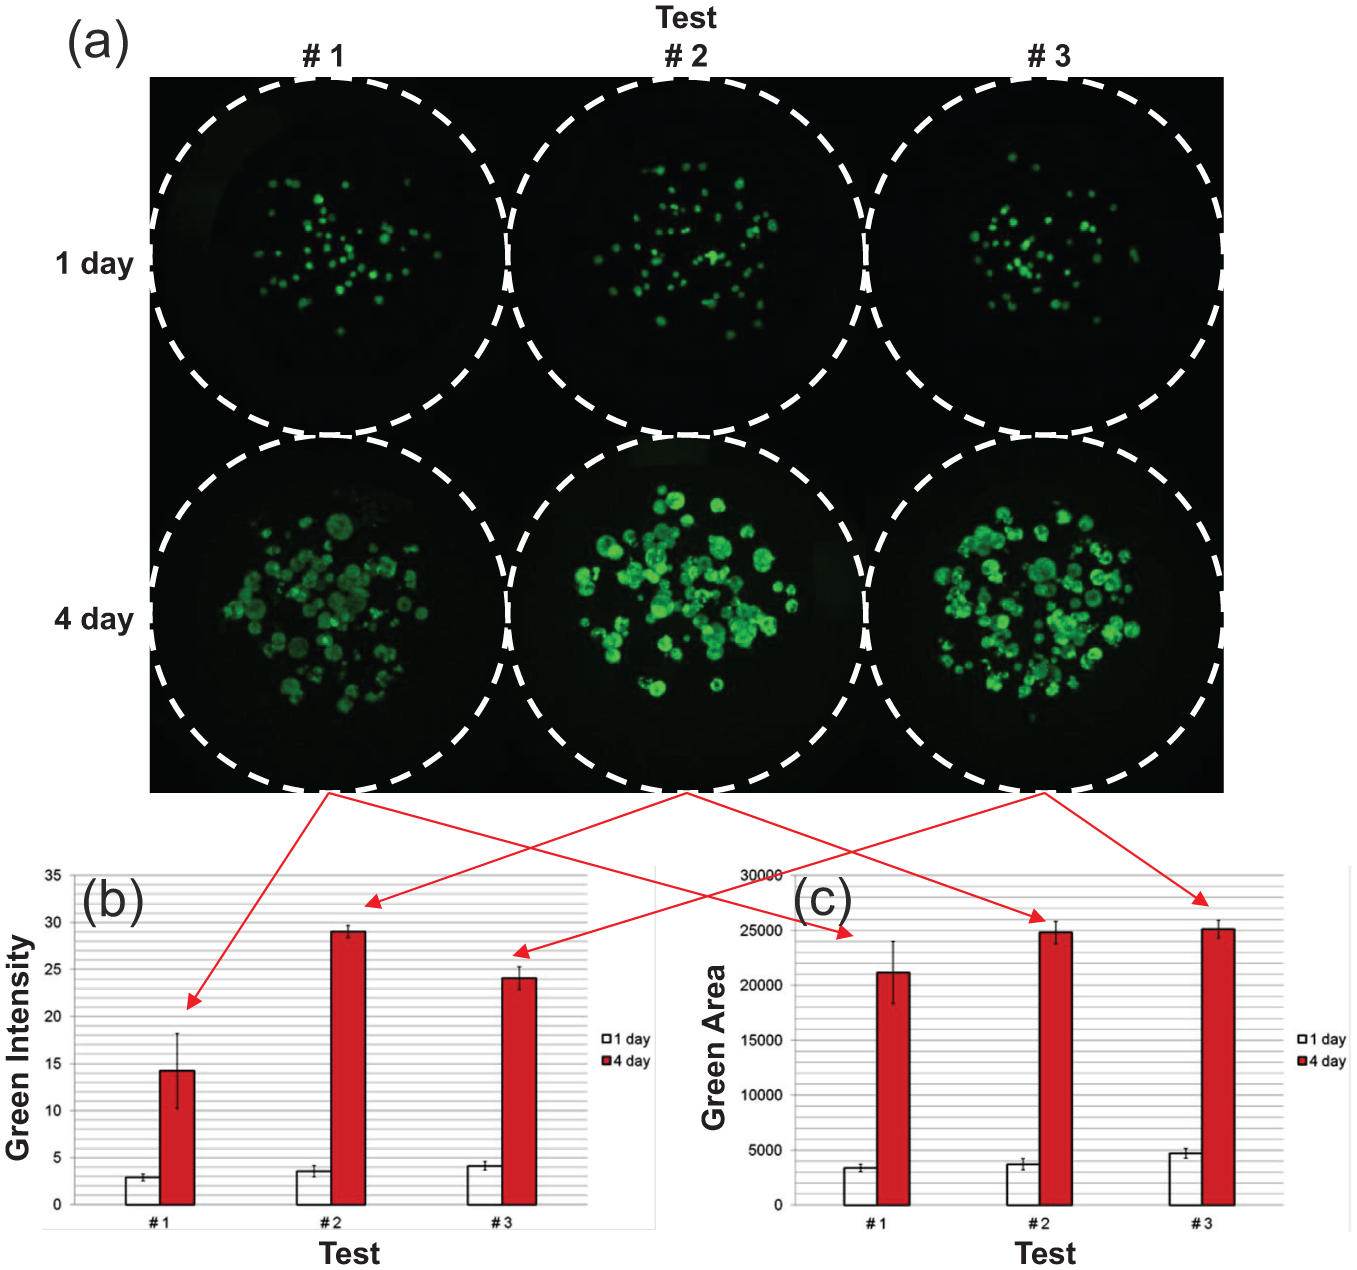
Cell growth analysis based on the intensity and area of the green fluorescence of the cells: (
Figure 3
shows the scanning image of the single micropillar chip containing 12 dose–response curves and IC50 values with six dosages. As shown by the compound layout of
Figure 1
, the efficacy of the 12 tested compounds was estimated against a U251 brain cancer cell line in the micropillar and microwell chip platform. The percentage cellular viability in the dose–response curve could be calculated by the intensity and area of the green-stained U251 cell line, as shown in
Figure 3a
. Although the absolute value of the intensity and area of the cells was different, the percentage viabilities calculated based on the intensity and area of the cells, which were normalized since the no-compound condition was 100%, showed very similar values within a 10% marginal difference.
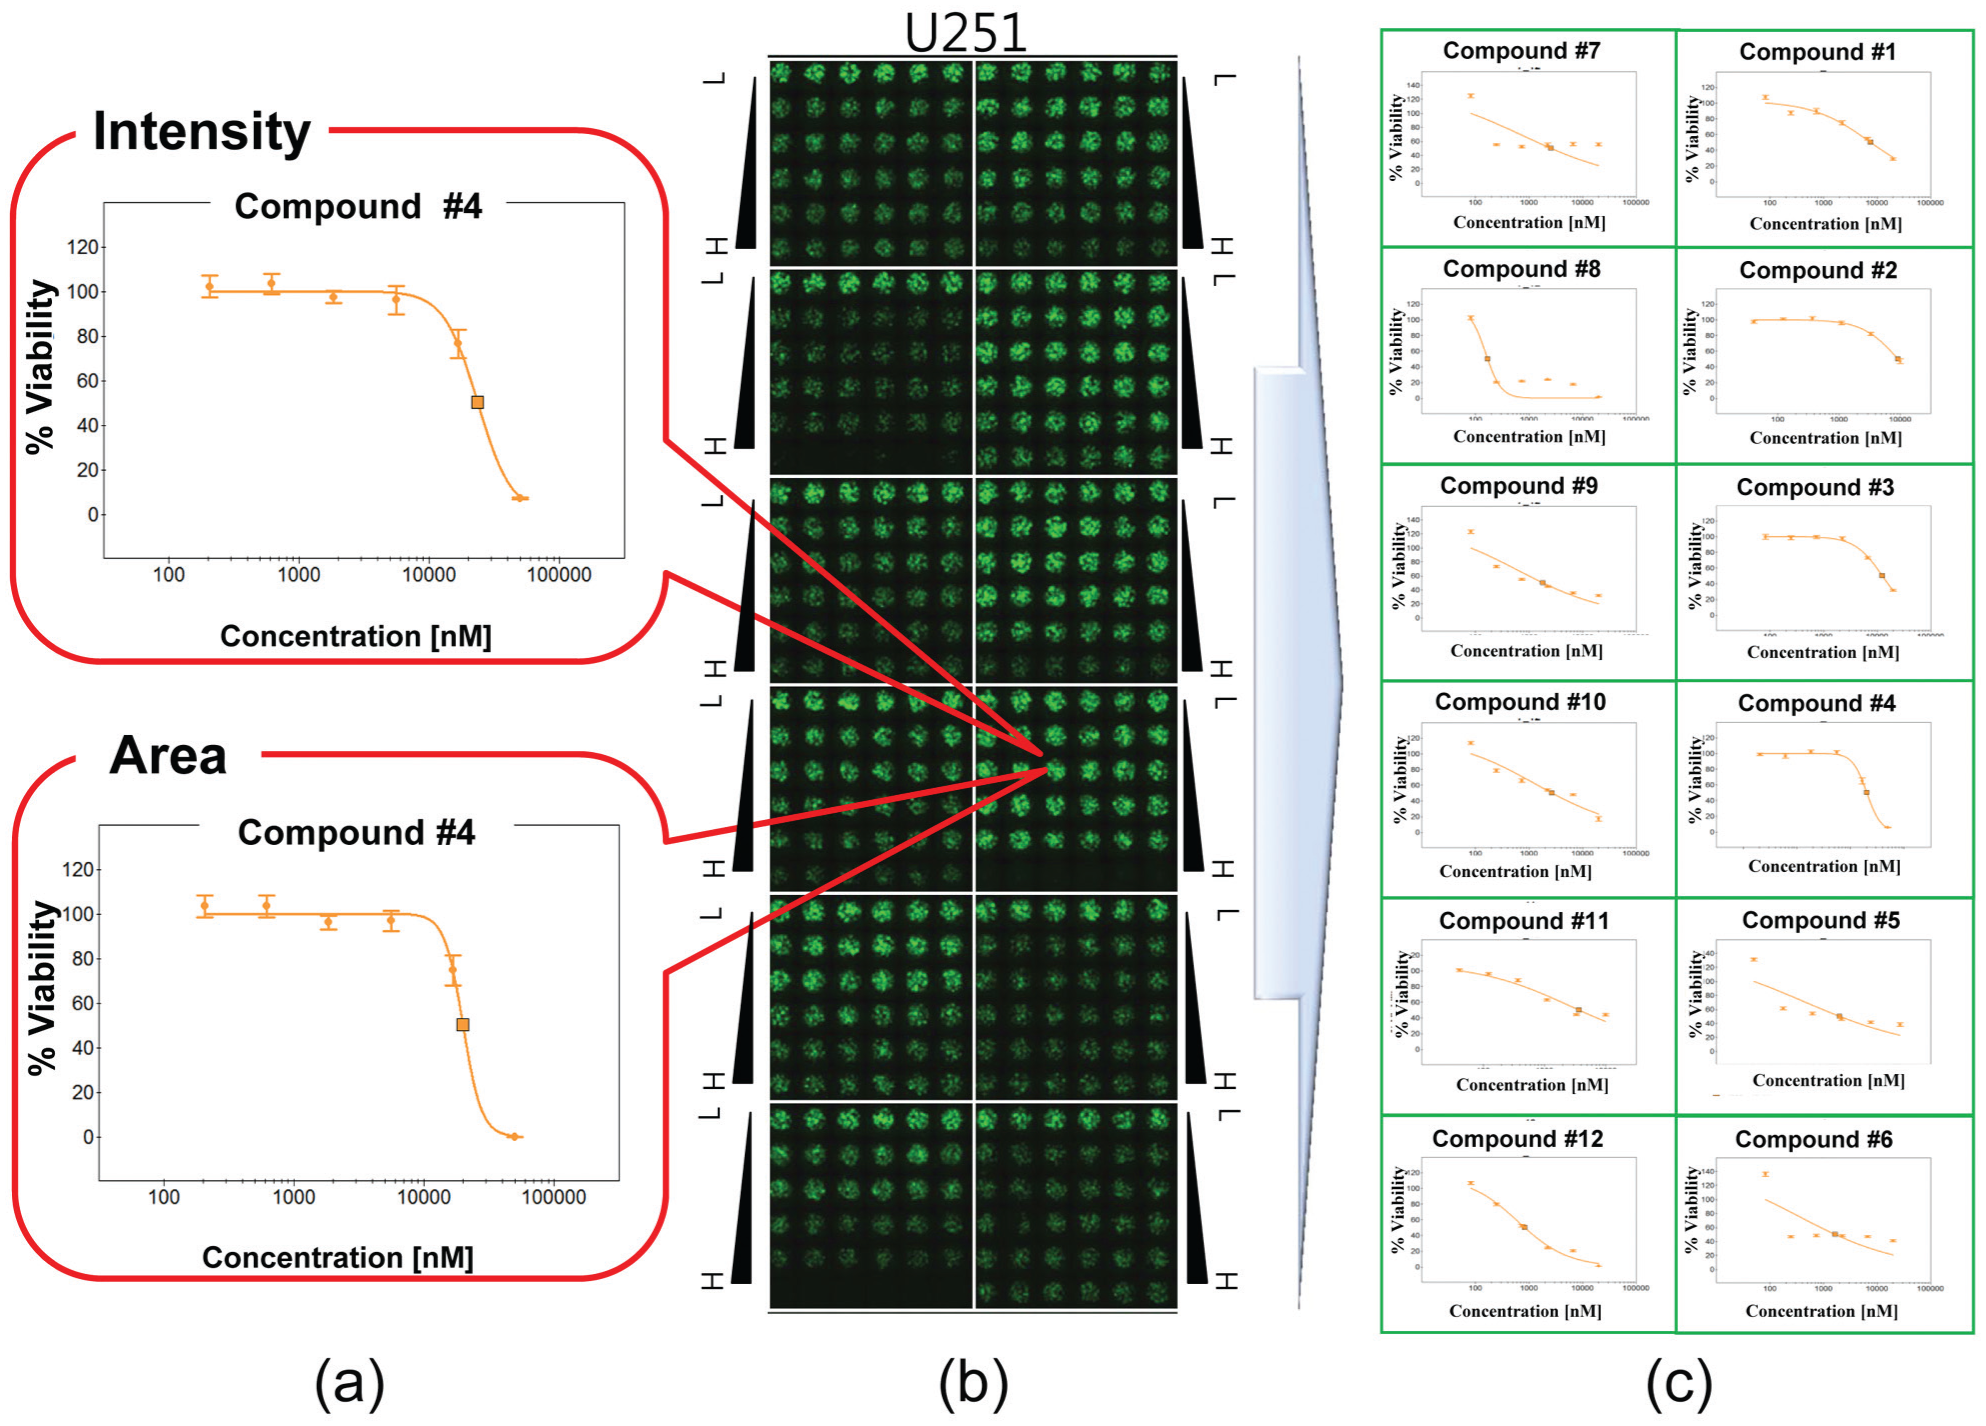
Dose–response curves of the studied 12 compounds in a micropillar chip: (
The maximum IC50 difference between the intensity and the area values is 32% in all 21 tests (7 day-to-day tests with 3 chip-to-chip tests), as shown in Figure 4a . Figure 4a shows five compounds that yield IC50 value differences greater than 5%. However, all other IC50 values exhibited very similar values. Thus, both analysis methods, based on the intensity and area of the cells, yielded the same performance in the IC50 calculation. IC50 was calculated as a relative value, such as percent viability of cells, and was estimated within one micropillar chip. If the cells stained faintly, all the cells in the same micropillar were stained based on the same condition. Thus, the percent viability of the cells, which is a relative value, showed values similar to those of other micropillar chips and elicited similar IC50 values.
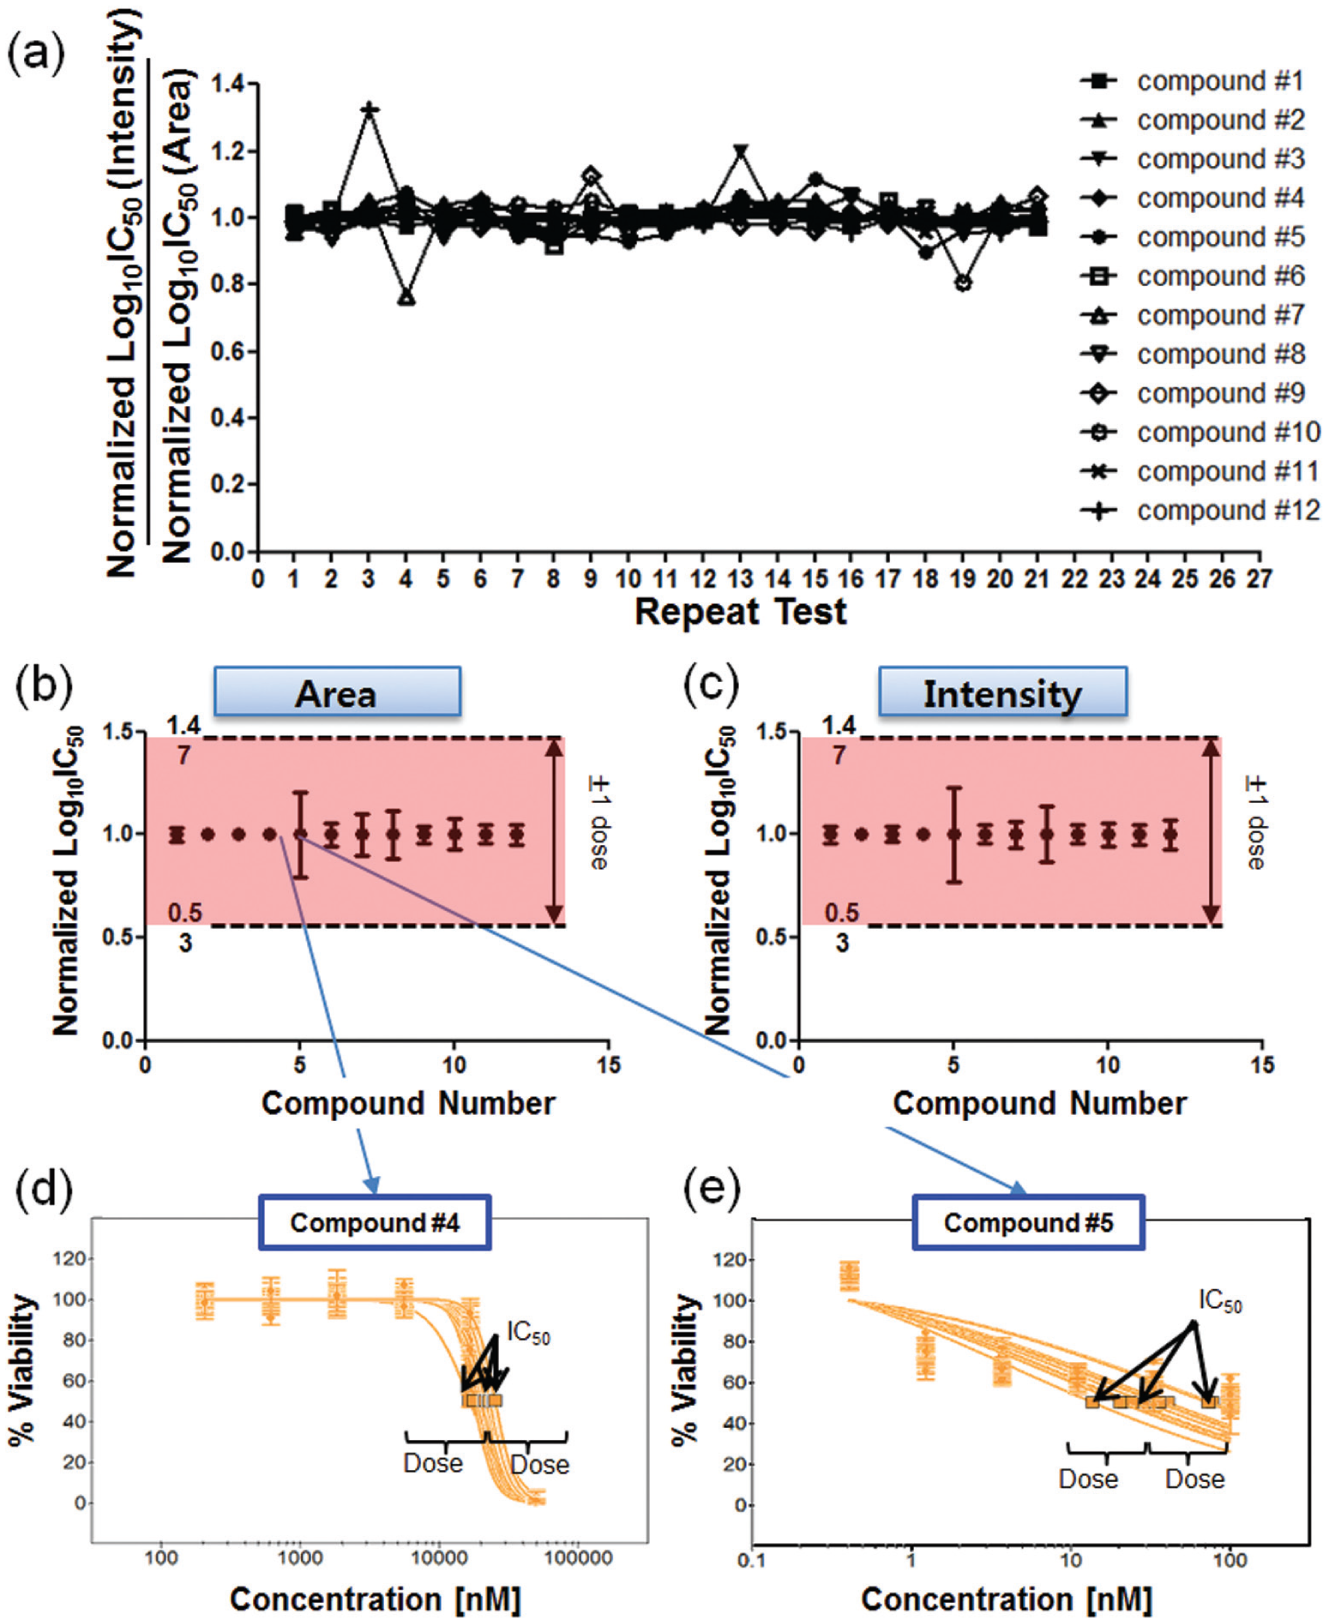
IC50 repeatability analysis of the 12 studied compounds based on 21 repeated tests. The 21 conducted tests refer to 7 day-to-day tests with 3 chip-to-chip tests: (
Figure 4b , c shows the normalized IC50 values of the 12 tested compounds based on intensity and area, respectively. All variations of the IC50 values in the 12 tested compounds at the 21 tests were within ±1 dose (three times the dilution ratio of the compound) in the case of the intensity and area methods. The trend of the IC50 variation was very similar in both methods. Among the 12 tested compounds, Docetaxel (compound 5) showed the highest IC50 variation in the 21 tests, while PHA665752 (compound 4) showed the lowest IC50 variation. In the case of PHA665752 (compound 4), shown in Figure 4d , the dose–response curve shows an excellent fitting with the use of a sigmoid curve. All R2 values of the dose–response curves were higher than 0.9. However, the dose–response curves of Docetaxel (compound 5) shown in Figure 4e yielded a poor fitting with the sigmoidal curve. All R2 values of the dose–response curve are lower than 0.5, which elicit a poor repeatability and high variation of the IC50 value in the 21 repeated tests. Although Docetaxel (compound 5) shows a very high variation in the values of IC50, the variation is within one dose (a three times dilution ratio of the compound), as shown in Figure 4e .
The micropillar and microwell chip platform is now fully developed for 3D cell-based high-throughput screening assays. The area-based or intensity-based 3D cell viability measurement methods in the platform are fully studied and optimized for robust assay repeatability of the doubling time and IC50. Previously, many 3D cell-based compound efficacy test platforms were introduced, but the repeatability of those platforms according to 3D cell viability measurement methods (area or intensity of studied cells) was not adequately analyzed, thereby establishing the need for further confirmation of the applicability of 3D cell-based platforms to high-throughput screening systems. In this study, the intensity and area of the cells were extracted from 3D cell images and used for calculating the doubling times and IC50 values for the repeated tests. Both these values are compared with each other in order to find the optimal procedure for the analysis of 3D cells in the chip platform. The doubling time of 27.8 ± 1.8 h (standard deviation: 6.6%) calculated based on the area of the cells shows more repeatability than the doubling time of 27.8 ± 3.8 h (standard deviation: 13.7%) calculated based on the intensity of the cells. IC50 values, calculated based on both the area and intensity estimates from the cells, show very similar repeatability, with elicited standard deviations being within ±3-fold (compound dilution ratio). The IC50 variations of the 12 tested compounds are highly related to the compound characteristics, such as the shape of the dose–response curve. Among the IC50 values of the 12 tested compounds, compounds that showed poor sigmoidal curve fitting yielded relatively higher standard deviations for IC50 than the compounds that showed good sigmoidal curve fitting.
Footnotes
Declaration of Conflicting Interests
The authors declared no potential conflicts of interest with respect to the research, authorship, and/or publication of this article.
Funding
The authors disclosed receipt of the following financial support for the research, authorship, and/or publication of this article: This research was supported by a grant of the Korea Health Technology R&D Project through the Korea Health Industry Development Institute (KHIDI), funded by the Ministry of Health and Welfare, Republic of Korea (HI14C3418).
References
Supplementary Material
Please find the following supplemental material available below.
For Open Access articles published under a Creative Commons License, all supplemental material carries the same license as the article it is associated with.
For non-Open Access articles published, all supplemental material carries a non-exclusive license, and permission requests for re-use of supplemental material or any part of supplemental material shall be sent directly to the copyright owner as specified in the copyright notice associated with the article.