
Abstract
A high-throughput clonogenic assay with a micropillar–microwell chip platform is proposed by using the colony area of glioblastoma multiforme (GBM) patient-derived cells (PDCs) from colony images. Unlike conventional cell lines, PDCs from the tumor are composed of heterogeneous cell populations, and some clonogenic populations form colonies during culture while the rest die off or remain unchanged, thus causing the diverse distribution of colony size. Therefore, area-based analysis of the total colonies is not sufficient to estimate total cell viability or toxicity responses. In this work, the average and standard deviation of an individual colony’s area calculated from the colony images were used as indicators for cell clonogenicity and heterogeneity, respectively. Two parameters (the total and average area of colonies) were compared to draw the colony’s growth curve and measure a doubling time and dose–response curve (IC50). Based on both analyses of two PDCs, 464T PDCs show a higher heterogeneity and clonogenicity than 448T PDCs. The differences in the doubling time and the IC50 according to the analysis methods suggest that the average area of colonies, rather than their total area, is suitable for heterogeneous and clonogenic samples.
Keywords
Introduction
Clonogenicity of tumor cells is widely known as an indication for cancer stem cells (CSCs).1,2 CSCs are of great interest in ongoing in-depth research in cancer treatment for their abnormal and distinct characteristics in tumor cell proliferation, division, migration, invasion, and more. They are gaining even more attention, especially in studies with patient-derived cells (PDCs). PDCs usually consist of heterogeneous populations, even when they are from the same tumor from a single biopsy. Although usually starting in a small population within a solid tumor, CSCs in PDCs replicate exponentially and become a major population, thus making it hard to predict cancer therapy responses. Hence, it is essential to observe and measure colonies formed from CSCs with their maintained self-renewal and tumor initiation properties.3,4 To support further studies on CSCs in PDCs, advanced clonogenic analysis methods also need to be developed accordingly. Although three-dimensional (3D) cell-based screening systems are essential for clonogenic assays, currently available high-throughput screening (HTS) systems are based on the 2D cell environment, which does not perfectly reflect the in vivo microenvironment. Studies on integrating a 3D experimental environment into HTS are ongoing, and there are some successful cases,5–10 including our previously developed system.8–10
In 3D cell-based screening systems, however, quantifying 3D colonies is still a difficult task, especially when colonies form in the thick extracellular matrix (ECM) (10~100 µl). There are significant technical challenges, including loss of image quality (signal-to-noise loss) and long measurement time due to the long imaging depths of colonies in the thick ECM.11,12 Those issues are very significant in HTS. To overcome those issues, our previous micropillar–microwell chip platform dispenses a 40 nl alginate–cell spot onto a micropillar and 950 nl of media or a compound into a microwell chip. The cells in the 40 nl alginate spot are immersed in media or a compound by combining the micropillar chip with the microwell chip. This easy media-exchanging method combining and separating two chips could miniaturize cell–ECM spots and increase assay throughput. The thickness of the 40 nl cell–alginate spot is less than 500 µm, and the spots are dried before imaging, which makes it easy to inspect colonies in a short time. From the total colony intensity, the total colony area, and the maximum area of colonies in each alginate spot on the micropillars, we calculated the viability 8 and clonogenicity, 9 respectively. Previously, we reported that total colony area-based 3D cell analysis is more suitable to a 3D cell growth curve than total colony intensity-based analysis due to low day-to-day cell-staining repeatability. 10 The total area obtained from a colony image or the biggest area of colonies on each spot did not, however, fully represent the live cell number of 3D colonies or the heterogeneity in heterogeneous PDCs. Thus, in this article, we calculated the average area from individual colonies in a spot ( Fig. 1 ) instead of the total colony areas, and we applied it to the clonogenicity and heterogeneity measurements of PDCs as well as the growth curve (doubling time) and dose–response curve (IC50). The average and standard deviation of the individual colony’s area in each spot are used as indicators of the clonogenicity and heterogeneity, respectively.
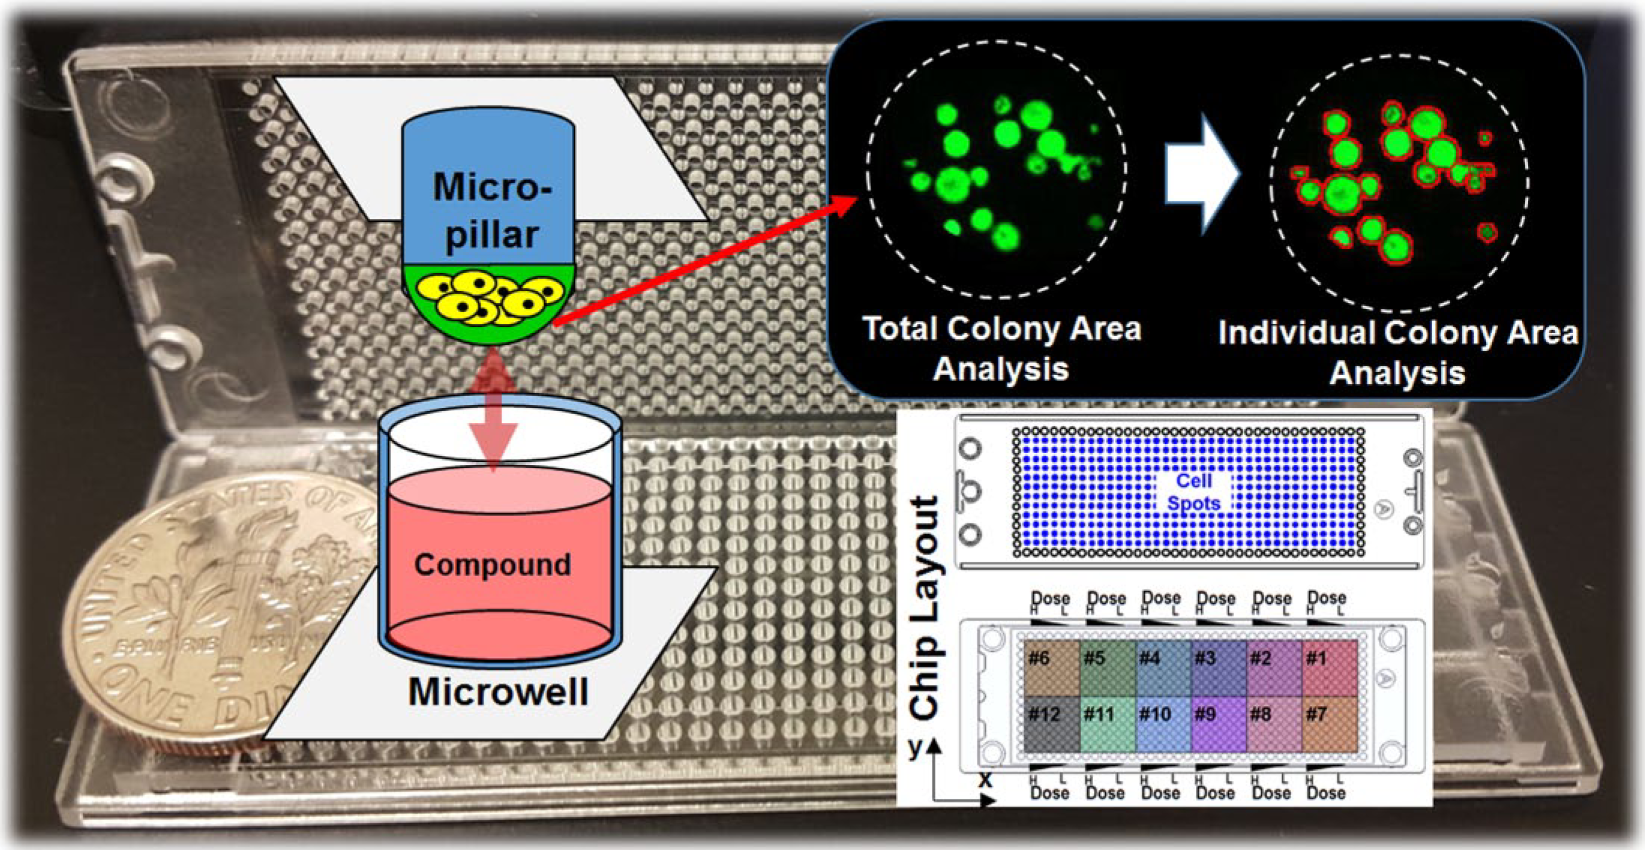
A clonogenic analysis based on an individual colony’s areas in an alginate spot. The colonies were cultured three-dimensionally with 12 drugs in a chip (6 doses and 6 replicates), and alginate spots containing colonies were dried for quick image scanning. The individual colony areas were calculated from the colony image. Background photo is the fabricated micropillar–microwell chips with a 1-cent coin.
Materials and Methods
Patient-Derived Cell Culture
Glioblastoma multiforme (GBM) PDCs were obtained from GBM patients who had brain tumor removal surgery at Samsung Medical Center (Seoul, Korea). Informed consent was obtained from all patients. Following the procedure previously reported, 13 surgical samples were enzymatically dissociated into single cells. Two PDCs, 448T and 464T, were from different GBM patients. Dissociated GBM cells were cultured in Eppendorf T-75 cell culture flasks (Eppendorf, Vienna, Austria) filled with Neurobasal-A (NBA)-conditioned media (Thermo Fisher, Waltham, MA). The NBA-conditioned media was neurobasal media containing N2 and B27 supplements (0.53 each; Invitrogen, Waltham, MA) and human recombinant basic fibroblast growth factor (bFGF) and epidermal growth factor (EGF) (25 ng/ml each; R&D Systems, Minneapolis, MN). Cell flasks were in a humidified 5% CO2 incubator (Sheldon Manufacturing, Cornelius, OR) at 37 °C. The cells were routinely passed every 4 days at 70% confluence. For the experiment, the cell suspensions were collected in a 50 ml falcon tube from the culture flask. GBM cells were then suspended in 5 mL of NBA-conditioned media. After centrifugation at 2000 rpm for 3 min, the supernatant was removed, and the cells were resuspended with NBA-conditioned media to a final concentration of 10 × 106 cells/mL. The number of cells in the NBA-conditioned media was calculated with the AccuChip automatic cell-counting kit (Digital Bio, Seoul, Korea). The rest of the cells were seeded at a concentration of 2 × 10⁶ cells in a T-75 flask containing 15 mL of NBA-conditioned media.
Chip Layout and Experimental Procedure
The basic layout of the micropillar–microwell chip for a 12-compound screening is shown in Figure 1 . The microwell chip is divided into 12 regions, and each region has 6 × 6 microwell array. A single dose–response curve for a compound was obtained from each region. Each region had a six-concentration gradient consisting of one control well and five different dosages along the x-axis. Each dose has six replicates along the y-axis. For the drug analysis, about 70 cells (GBM PDCs) in 40 nl with a 0.75% alginate concentration by volume (0.75 w/w) were automatically dispensed onto a micropillar chip by a ASFA Spotter HE (Medical & Bio Device, Seoul, South Korea). The ASFA Spotter HE uses a solenoid valve (Lee Company, Westbrook, CT) in dispensing the 40 nl droplets of a cell–alginate mixture and 950 nl of media or compounds. After dispensing the cells, as shown in Figure 1 , the micropillar chip containing human cells in alginate was sandwiched (or “stamped”) with the microwell chip for the 3D cell cultures and compound efficacy tests. In addition, the same volume of growth media was printed into the microwells located in the periphery of the microwell chip (i.e., sacrificial regions) to avoid the edge-drying issue during incubation. A single chip can screen 12 compounds for 6 dose–response curves and IC50s. Figure 2a shows a micropillar chip with alginate dispensed on each pillar spot. The micropillar chip with cells dispensed is stamped together with its complementary microwell chip consisting of 532 wells that are 1.2 mm in diameter; 950 nl of growth media was previously dispensed into each well. Figure 2b shows the micropillar and microwell chip in the combined form. After 1 day of incubation to stabilize the cells, the micropillar chip containing cells was moved to a new microwell chip filled with various test compounds. Then, the combined chips were incubated for 7 days, as shown in Figure 2c .
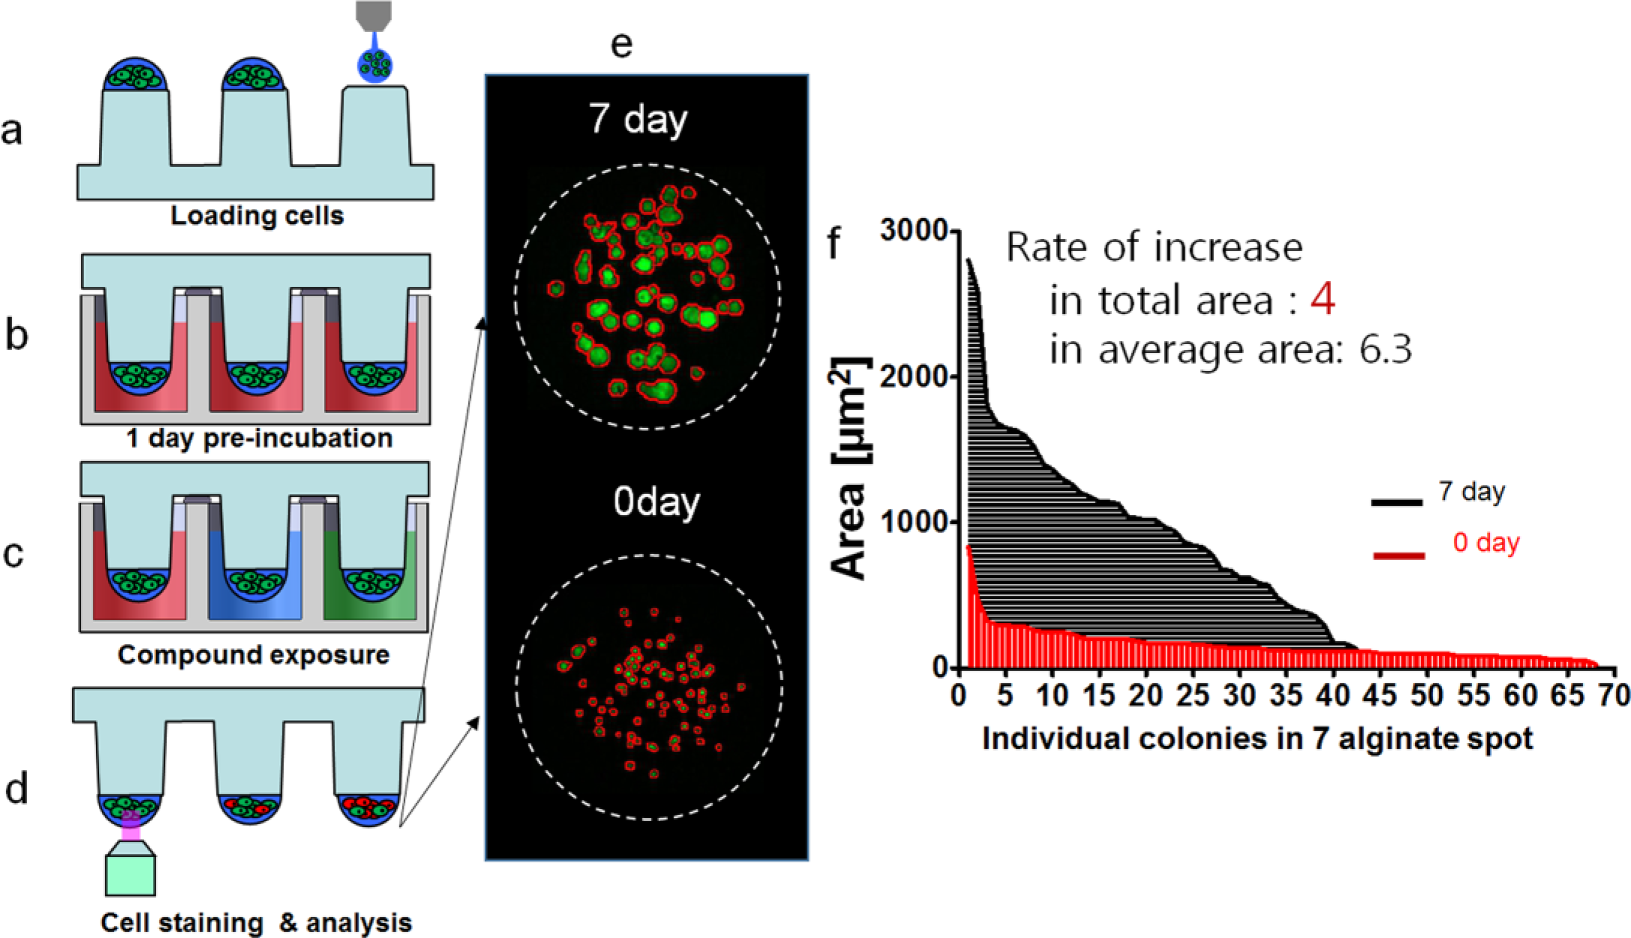
Experimental and analysis procedures for the compound efficacy test: (
The efficacy of the compounds was measured with Calcein AM live cell-staining dye (4 mM stock; Invitrogen), which stains live cells with green fluorescence. Thus, green dots represent live cells. The staining dye solution was prepared by adding 1.0 µL of Calcein AM (4 mM stock; Invitrogen) in 8ml staining buffer (Cellvitro ST A 500; Medical & Bio Device, South Korea). To measure cell viability quantitatively after staining the alginate spots, cells on the micropillar chip were scanned. As shown in Figure 2d , scanned images were obtained with an automatic optical fluorescence scanner (ASFA Scanner ST; Medical & Bio Device, South Korea).
Doubling Time and IC50 Calculation
The ASFA Ez SW (Medical & Bio Device, South Korea) computes the total and average areas of the colonies for the scanned images of 3D-grown cells in an alginate spot on each micropillar spot. Based on the intensity of the green fluorescence scanned, the software defines the boundary of each spot for the analysis. The software counts the number of pixels within the defined area and converts the number into µm2 units. From this, both the number and area of the colonies are obtained. The total colony area is the sum of all colonies in an alginate spot. Based on the area of each individual colony in a spot, we calculated the average area of an individual colony. The average area was calculated by dividing the total area of all colonies in one spot by the number of colonies.
Based on the total and average areas of the colonies on a micropillar spot, the doubling time for 7 days was calculated with the following equation:

where P0 day and P7 day represent day 0 and day 7, respectively. Different values for the doubling time and IC50 are calculated depending on whether to base the equation on the total or average areas.
Because not all controlled conditions represent 100% cell viability, the resulting values for the cell viability were normalized to the control wells (no drug treatment). The sigmoidal dose–response curves (variable slope) and IC50 values (i.e., concentration of the compound when 50% of cell growth is inhibited) were obtained with the following equation:
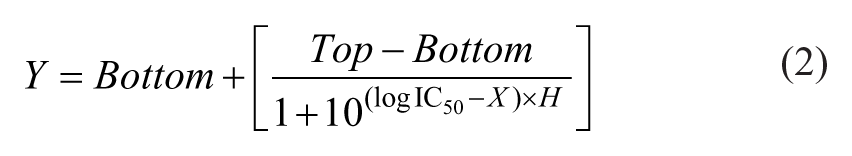
where IC50 is the midpoint of the curve; H is the hill slope; X is the logarithm of the compound concentration; and Y is the response (cell viability). The ASFA Ez SW (Medical & Bio Device, South Korea) sets Bottom as zero and Top as 100 when it plots the fitting curve.
Results and Discussion
The two GBM PDCs, 448T and 464T, behaved differently in terms of colony formation. 448T formed comparably small colonies with low variation in the colony-to-colony areas, whereas 464T formed larger colonies and showed quite significant colony-to-colony area divergence. Because the total area of the colonies did not reflect the clonogenicity (the ability to form a colony) and heterogeneity (the divergence of colony size distribution), we characterized an individual colony on a spot by determining the average and standard deviation of the individual colony’s areas. The average area of a colony was calculated by dividing the total area by the number of colonies in a spot. The average area represents the ability of cells to form colonies (i.e., the clonogenicity). The standard deviation of the areas of all colonies in a spot represents the heterogeneity. The different morphologies of each colony are shown in Figure 3 . The average area of the 464T colonies was 3.9 times bigger than that of the 448T colonies, which is a much larger difference compared to their total area comparison (1.68 times). This value is further supported by the images of 448T and 464T in Figure 3 , where 464T shows a higher clonogenicity with bigger colonies. The standard deviation is bigger for 464T than for 448T, implying higher heterogeneity, which is also supported by the image, which shows more varied colony sizes on the 464T spot.
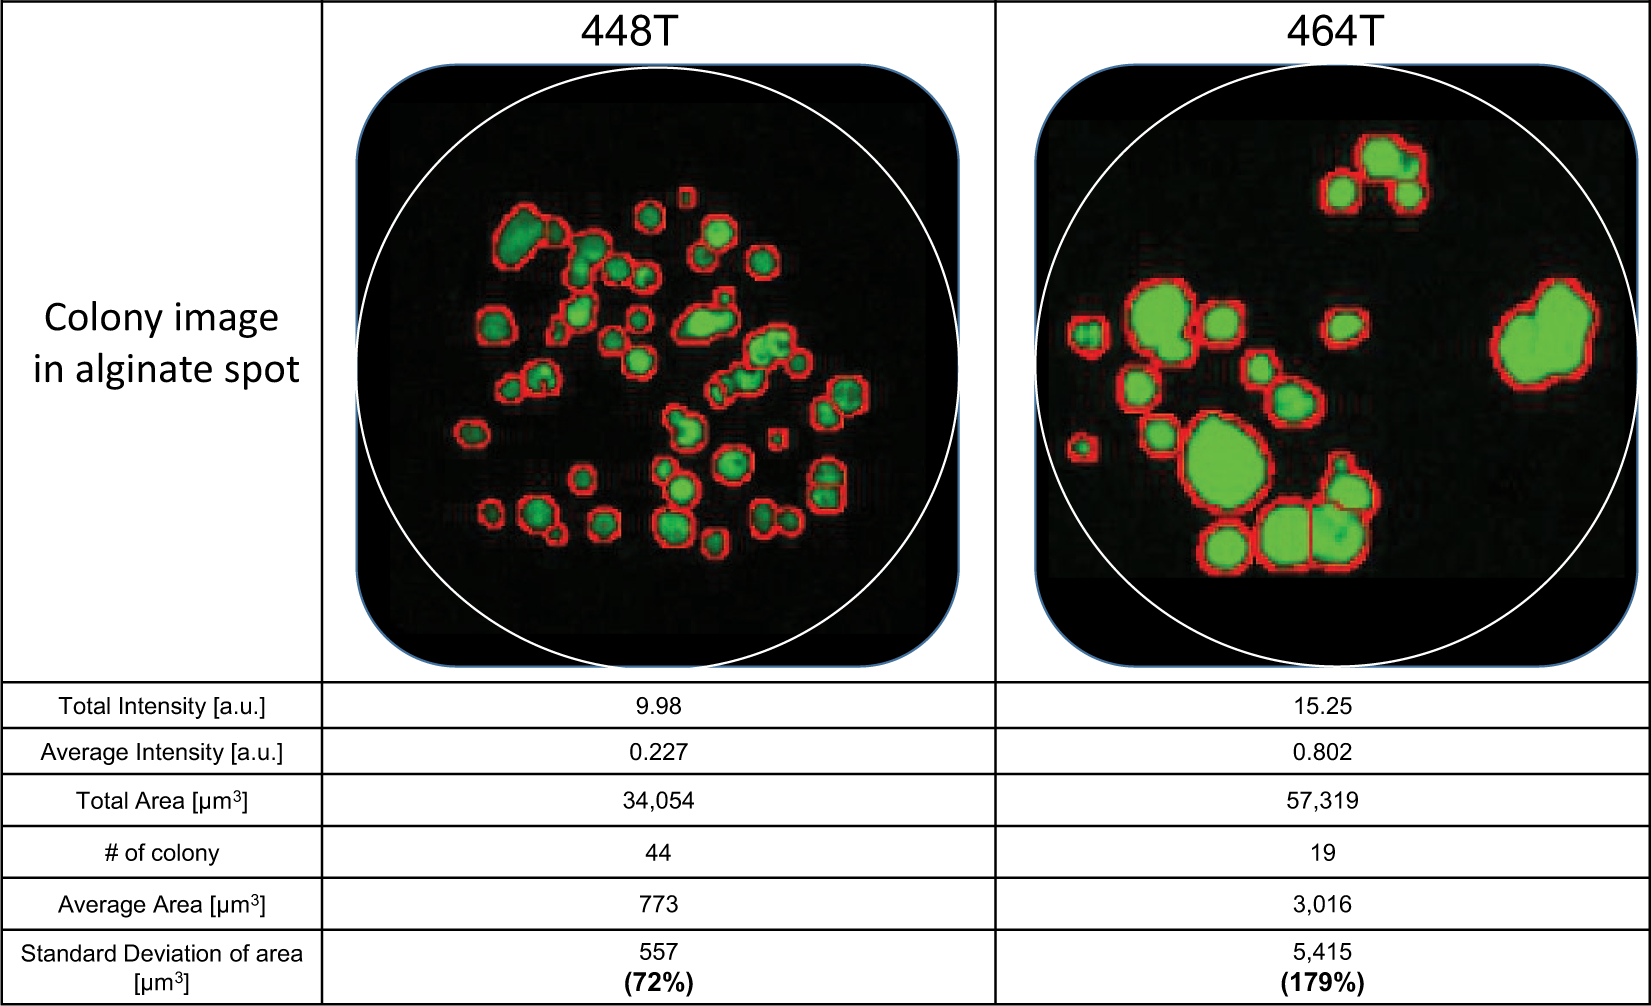
Multiple factors in 448T and 464T. 464T patient-derived cells (PDCs) formed bigger and more heterogeneous colonies than those of the 449T PDCs. The average area and its standard deviation of 464T were higher than those of 448T.
Growth Curves of the PDCs
Figure 2e shows the area and number of colonies at day 0 and day 7. Figure 2f shows the calculated area of colonies for an individual spot. From the side-by-side comparison of values for the area, we noticed that the colony average area increased drastically higher than the colony total area. Figure 4 showed growth curves during 11 days after cell seeding, in terms of the total area, number of colonies, and average area of colonies for 448T and 464T. Interestingly, the total number of 464T colonies decreased dramatically at day 3 with a specific part of the population forming larger colonies, whereas that of 448T showed a slight decrease. 464T had a slower growth than 448T in the growth curve based on the total area of the colonies. The doubling time of 464T was 122.4 h, which was longer than 67.8 h for 448T. In the analysis based on the average area of the colonies, however, 464T had very fast growth with a doubling time of 56.9 h. Based on the image of the colony, 464T formed a few big colonies and grew fast, and some cells died in the heterogeneous population. Thus, we believe that the total area-based doubling time does not reflect 3D colony growth and that the average area of the colonies should be used, which shows a good correlation with big colonies in 464T images. The colony average area increased exponentially from day 3 to day 7 for both 448T and 464T. The doubling time of 464T was 56.9 h, which was lower than that of 448T, shown in Figure 4 . 464T grew much faster and formed bigger colonies compared to 448T throughout time. Thus, we believe that the average area is a more suitable parameter to check growth in a heterogeneous sample.
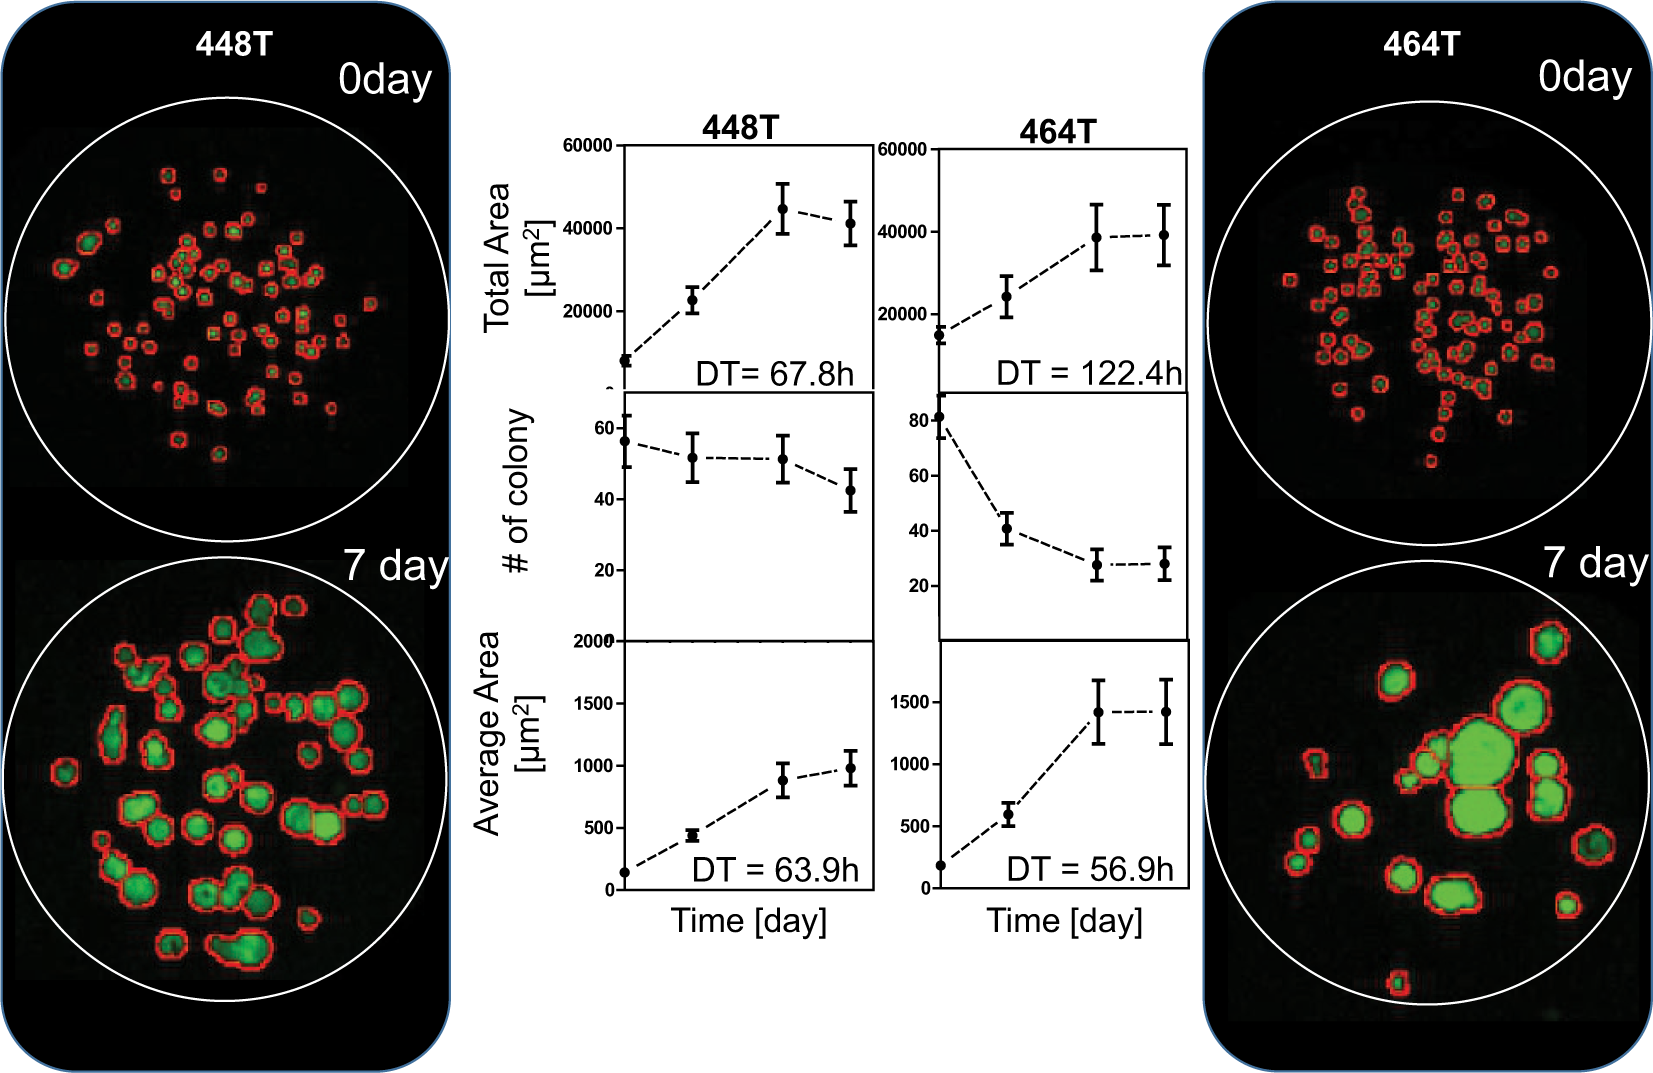
Cell growth analysis based on the total area, number, and average area of the colonies. Eighty-four replicated alginate spots were used for each day. The live colonies were stained with green color. 464T patient-derived cells (PDCs) formed bigger colonies and had a shorter doubling time (DT) than 484T PDCs.
Dose–Response Curve of the PDCs
The 24 drug responses of the PDCs were determined by analyzing the size of colonies in the alginate spots. The drug treatment time was 6 days. Because the total area of the colonies in a spot from the colony image results has limitations in estimating the cell viability of the colony in the dose–response curve, the average areas of the colonies are applied to the dose–response curve. In the 24-drug efficacy tests of 448T and 464T, the IC50s based on total and average area were calculated and compared. The correlations between IC50s obtained from the total and average areas for 448T and 464T were also compared in Figure 5 . Most of the drugs have very similar IC50s. In the 448T PDCs, AZD0503 (#14) showed slightly sensitive responses in the average area-based method analysis. PLX4720 (#3) and Sunitinib malate (#22) showed slightly resistive response in the average area-based method analysis. In homogeneous colony distribution of 448T, IC50s from total and average area-based methods are similar, as shown in Figure 5a . In the case of 464T, higher drug resistance (higher IC50s) was found in an average area-based method, as shown in Figure 5b . Because 464T had heterogeneous big colonies in PD173074 (#13) and SU 11274 (#15), a few big 464T colonies against drugs increase the calculated cell viability based on the average colony area. Thus, the inhibition ratios against PD173074 (#13) and SU 11274 (#15) in the average area-based method were lower than those in the total area-based method, which makes the IC50s higher in the average area-based method. Figure 6a shows the dose–response curve and images of PD173074 (#13) for 464T PDC. As seen in the colonies for the control and 2.2 µM PD173074 (#13) spots, the drug killed many 464T cells compared to the control. Some 464T cells, however, overcame the drug and formed colonies in which the size was similar to that of the colonies in the control spot. Although the total area of the colonies in the 2.2 µM PD173074 (#13) spots decreased up to 60%, the average area of the colonies did not highly decrease. Thus, the IC50s in the average area-based method are higher than those in the total area-based method. Figure 6b shows the IC50s of the 448T and 464T PDCs in PD173074 (#13) calculated by the total and average areas of the colonies. The average area-based method shows a bigger gap for the IC50s between the 448T and 464 PDCs than does the total area-based method. Because the PD173074 drug targets the FGFR1 gene, which is highly expressed in 448T, 8 the average area-based method clearly distinguished the target drug efficacy. Depending on which of the two analysis methods is chosen, the sensitivity of drugs in PDCs may also vary. The change in the IC50 depending on the analysis method suggests that considering the average area rather than the total area may be suitable for heterogeneous and clonogenic samples. Based on the findings of our study, the average area-based method showed its potential as being more representative of the in vivo environment and as a novel approach in studying drug responses in PDCs.
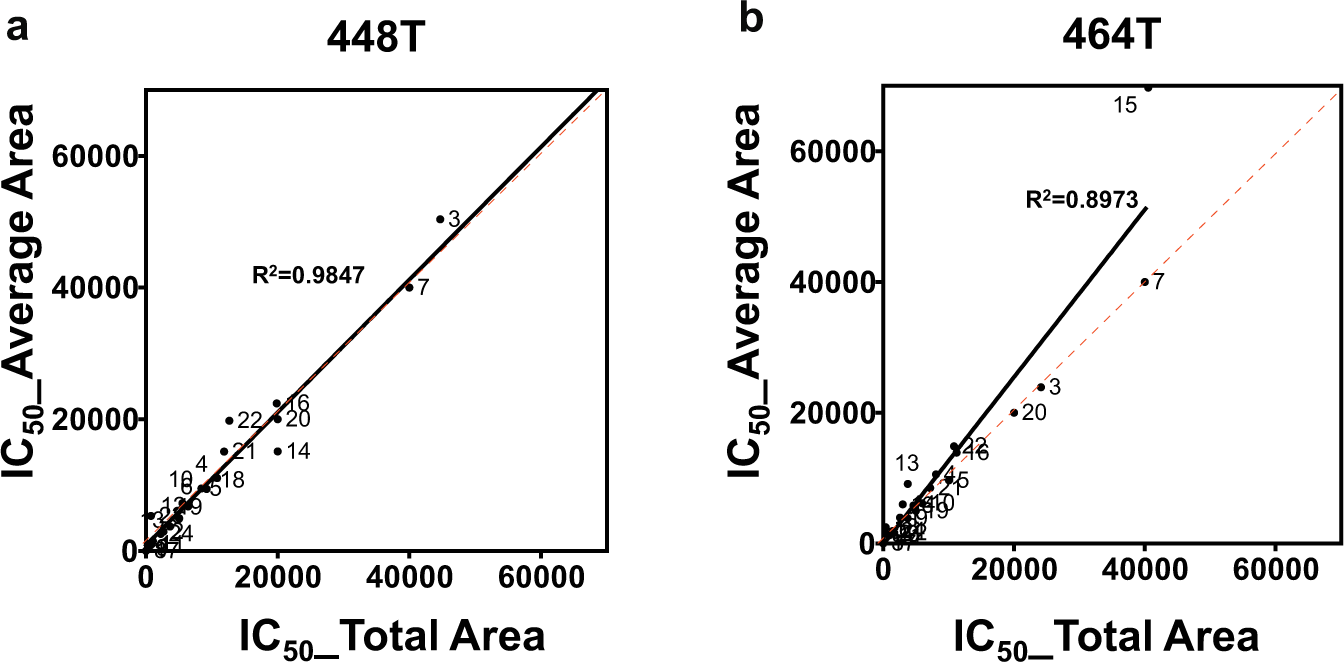
Comparison of the IC50s for the total area-based method and average area-based method: (
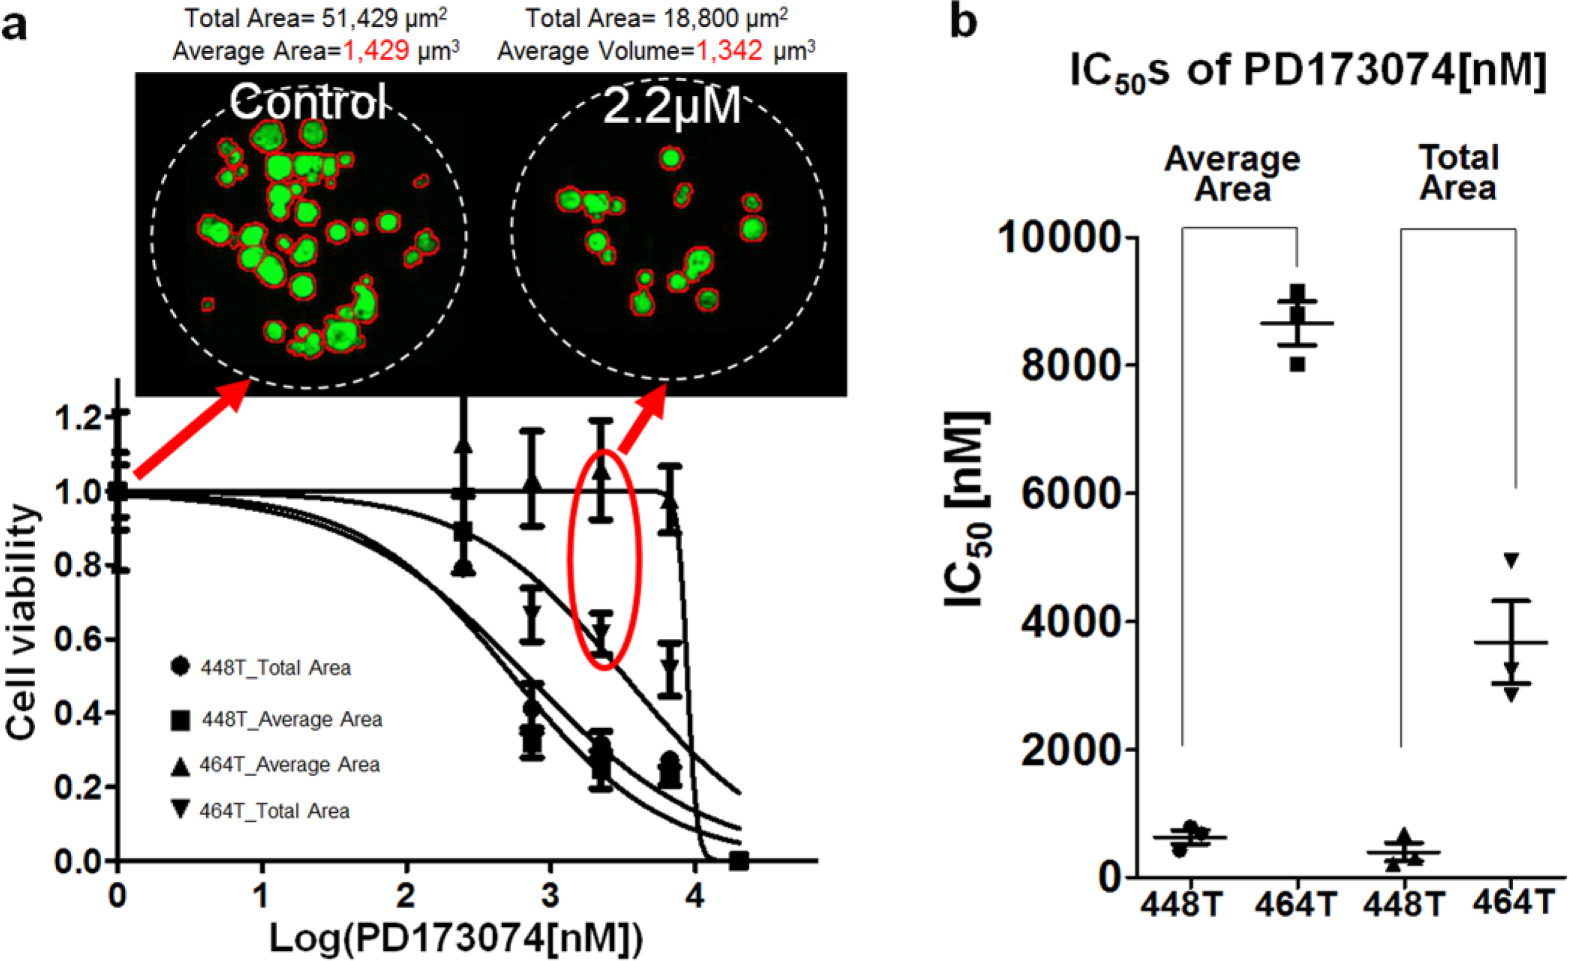
Dose–response curves and IC50s for the 464T and 448T patient-derived cells (PDCs): (
Footnotes
Declaration of Conflicting Interests
The authors declared no potential conflicts of interest with respect to the research, authorship, and/or publication of this article.
Funding
The authors disclosed receipt of the following financial support for the research, authorship, and/or publication of this article: This research was supported by the Bio & Medical Technology Development Program of the National Research Foundation (NRF) funded by the Korean government, MSIP(NRF-2015M3A9A 7029740)