
Abstract
Lysyl hydroxylase-2 (LH2) catalyzes the hydroxylation of telopeptidyl lysine residues on collagen, leading to the formation of stable collagen cross-links that connect collagen molecules and stabilize the extracellular matrix. High levels of LH2 have been reported in the formation and stabilization of hydroxylysine aldehyde-derived collagen cross-links (HLCCs), leading to fibrosis and cancer metastasis in certain tissues. Identification of small-molecule inhibitors targeting LH2 activity requires a robust and suitable assay system, which is currently lacking. Thus, despite being a promising target for these diseases, small-molecule inhibitors for LH2 have yet to be reported. Therefore, we developed a luminescence-based strategy to monitor LH activity and validated its ability to identify new inhibitors in a screen of approximately 65,000 compounds against LH2. Primary hits were confirmed using the same LH assay against mimiviral L230. This newly developed LH assay is robust, suitable for high-throughput screening, and able to identify potent specific inhibitors of LH2.
Introduction
Lysyl hydroxylases (LHs) belong to the large superfamily of 2-oxoglutarate (aka alpha-ketoglutarate)-dependent oxygenases that require alpha-ketoglutarate (α-KG) and Fe(II) for activity. 1 These enzymes couple the two-electron oxidation of substrate to the oxidative decarboxylation of α-KG to yield succinate and carbon dioxide. 1 LHs consist of three family members—LH1, LH2, and LH3. While all LHs catalyze the hydroxylation of lysine residues on collagen, only LH2 can modify telopeptidyl lysine residues. 2 Lysine hydroxylation is important in the formation of stable collagen cross-links, which connect collagen molecules and stabilize the extracellular matrix. 3
LH2-mediated hydroxylation of telopeptidyl lysine residues in collagen has been shown to initiate the formation of hydroxylysine aldehyde-derived collagen cross-links (HLCCs), which are highly stable and resistant to collagenase cleavage. 3 It is reported that high levels of LH2 expression under pathological conditions can lead to the accumulation of these HLCCs in extracellular matrices, causing fibrosis.4,5 In addition, high levels of LH2 expression contribute to metastasis in lung cancer, 6 breast cancer,7,8 and sarcoma, 9 highlighting the therapeutic potential for inhibitors of LH2 to combat fibrosis and cancer.
However, there are no reported inhibitors of LH2 to date, and no high-throughput system to screen for novel LH2 inhibitors has been described. A robust assay system that is amenable to high throughput is important for the identification of small-molecule inhibitors of LH2. Several assay methods for Fe(II)/2-oxoglutarate-dependent dioxygenases have been reported in the literature. One of the earliest and widely adapted methods developed was based on measuring the amount of 14CO2 released during decarboxylation of 2-oxo-[1-14C]glutarate. 10 However, the radioactive nature of such assays makes them impractical to use for high-throughput purposes. Several nonradioactive assay methods have also been developed. For example, a fluorescence-based assay reported by McNeill et al. monitors the depletion of α-KG by its postincubation derivatization with o-phenylenediamine to form a fluorescent product. 11 Similarly, Luo et al. have reported an absorbance assay that couples succinate production to NADH oxidation. 12 However, these assays have limited sensitivity and require a large amount of protein and product turnover to generate reliable signal.
Recently, we reported a luminescence assay that measures LH2 activity based on the amount of succinate production in the assay. 13 The assay was superior in terms of stability and signal-to-noise (S/N) ratio and was used in the kinetic characterization of LH2. As mentioned earlier, there is a need for a robust high-throughput assay for LH in order to identify small-molecule inhibitors for therapeutic purposes. Therefore, in this paper, we utilized this luminescence assay system to develop a robust luminescence-based high-throughput assay platform that can facilitate the identification of potent, specific, small-molecule inhibitors of LH2.
Materials and Methods
Reagents
Recombinant LH2 and L230 proteins were purified according to the methods explained previously.13,14 Unless otherwise stated, all chemicals were purchased from Sigma-Aldrich (St. Louis, MO) and were of the highest purity available. Succinate Glo JMJC Demethylase Assay kit was purchased from Promega (Madison, WI, cat. CS1747A04). Peptide substrates for LH2 (IKGIKGIKG, abbreviated as [IKG]3) and L230 (GTKGETGLKGII, abbreviated as GI-12) were ordered from LifeTein (Somerset, NJ) and the purity was determined to be greater than 98% by HPLC. White Nunc 384-well plates were obtained from Thermo Scientific (Waltham, MA, cat. 262360).
Chemical Compounds
A total of 65,257 compounds were selected for primary screening. Compound libraries consisted of the NIH clinical collection (674 compounds; obtained from Evotec, San Francisco, CA), the Spectrum collection (2000 compounds; obtained from MicroSource Discovery, Gaylordsville, CT), LOPAC (1280 compounds; obtained from Sigma-Aldrich), fragment sets (18,143 compounds; obtained from Chembridge and Chemdiv, San Diego, CA), kinase sets (11,250 compounds; obtained from Chembridge), and diversity sets (29,718 compounds; obtained from NCI, Chemdiv, and Maybridge). In addition, compounds also consisted of the following two library sets: (1) a kinase focused library collection of 600 compounds custom selected by TxSACT (Texas Screening Alliance for Cancer Therapeutics) from various vendors, and (2) a collection of 2000 unique molecules with diverse pharmacophores deposited from chemists at the University of Texas at Austin and University of Kansas.
Bioluminescence-Based LH Assay
Unless otherwise stated, all LH assays were performed in an assay buffer (50 mM HEPES [pH 7.4], 150 mM NaCl, 0.5% DMSO, and 0.01% Triton X-100) containing 1 µM LH2, 1000 µM [IKG]3 peptide, 100 µM ascorbic acid, 10 µM α-KG, and 10 µM FeCl2. Assays were performed in white Nunc 384-well plates using a 10 µL volume. First, 6 µL of 1.67× LH2 mix was aliquoted to a 384-well plate. Second, 2 µL of 5× additive (either detergent, bovine serum albumin [BSA], DMSO, or compound) was added and incubated for 30 min. Third, the reactions were started with 2 µL of 5× substrate mix containing peptide substrate, α-KG, ascorbic acid, and FeCl2. FeCl2 solution was always freshly prepared in 10 mM HCl and then diluted to an assay mixture to minimize iron oxidation in aqueous solution. Reactions were allowed to proceed for 90 min before adding detection reagent (Succinate Glo JMJC Demethylase Assay; Promega), according to the manufacturer’s instruction, unless otherwise stated. Briefly, 10 µL of succinate detection reagent I was added to quench the lysyl hydroxylation reaction and convert succinate product to ATP. After 60 min, 20 µL of succinate detection reagent II was added to convert ATP to light. After 10 min of incubation, luminescence was read using an Envision plate reader (PerkinElmer, Waltham, MA).
Optimization assays for LH2 and peptide substrate were performed by varying LH2 (0–1 µM) and [IKG]3 peptide substrate (0–1000 µM) in the assay. Similarly, tolerance tests were performed by varying DMSO (0%–5%), Triton X-100 (0%–0.16%), Tween-20 (0%–0.16%), NP-40 (0%–0.16%), and BSA (0%–0.8%) in the assay. In all cases, LH2 mix was incubated with different concentrations of tested reagents at room temperature for 30 min. Assays were then initiated with the addition of substrate mix. Succinate detection assays were performed similarly as mentioned above.
A time course experiment for LH2 was performed by varying reaction times. Assays were initiated with the addition of substrate mix. Following 5, 60, 120, or 180 min incubations, assays were quenched with the addition of succinate detection reagent I. Succinate detection assays were then performed as mentioned above.
Finally, the stability of LH2 at room temperature was also tested. LH2 mix was incubated at room temperature for 0, 1, or 2 h. After the respective incubation times, reactions were initiated with the addition of substrate mix. Succinate detection assays were performed similarly as mentioned above.
Assay Validation
Assay validation was performed by plating columns 1–22 of the 384-well plate with positive controls (reaction containing LH2) and columns 23 and 24 with negative controls (reaction containing no LH2). First, 6 µL of enzyme mixture containing 1.67× LH2 in 1× assay buffer (columns 1–22) or 1× buffer only (columns 23 and 24) was dispensed to 384-well plates. Second, 2 µL of 5× DMSO (2.5%) in 1× buffer was added and incubated for 60 min. Third, 2 µL of 5× substrate mixture (containing peptide substrate, α-KG, ascorbic acid, and FeCl2) in 1× buffer was added to start the reaction and incubated for 90 min. Succinate levels were then measured using the Succinate Glo JMJC Demethylase Assay as described above. Enzyme mixture and DMSO were dispensed using the JANUS Automated Workstation (PerkinElmer). Substrate mixture, succinate detection reagent I, and succinate detection reagent II were added using a MicroFlo Select Bulk Dispenser (BioTek, Winooski, VT) equipped with a 1 µL cassette (for substrate dispense) or 10 µL cassette with large bore tips (for succinate detection reagents I and II dispense). The MicroFlo dispenser is an automated reagent dispenser equipped with an eight-tip cassette allowing speedy dispense of bulk reagents from a reservoir.
Primary Screening and Hit Confirmation
High-throughput screening (HTS) was performed as described in the Assay Validation section, except that compounds were used instead of DMSO in columns 3–22. Columns 1 and 2 were positive controls (reaction containing LH2 but no compounds), and columns 23 and 24 were negative controls (reaction with no LH2 or compounds). Columns 3–22 were assayed with library compounds. Hits from the primary screen filtered by pan-assay interference compound (PAINS) and OIDD filters available from FAFDrugs4 (http://fafdrugs3.mti.univ-paris-diderot.fr/references.html) were cherry-picked and confirmed using the same LH assay to eliminate any false hits due to systematic error. Assay interference was tested for the same cherry-picked hits using the same LH assay by replacing LH2 enzyme with succinate at 10 µM concentration. The assay was incubated for 1 h before continuing with the succinate detection assay. Compound competition with Fe(II) was performed using the LH assay at varying concentrations (high, 100 µM; low, 10 µM) of FeCl2. A selectivity test was conducted using the same LH assay but replacing LH2 enzyme and [IKG]3 peptide substrate with mimivirus L230 enzyme and GI-12 peptide substrate at 1 and 1000 µM concentrations, respectively. Compound potency against LH2 was determined by using a threefold serial dose response assay consisting of seven different compound concentrations starting at 100 µM (fragments) or 25 µM (nonfragments). The compound concentrations in all experiments (except dose response assays) were the same as those of the primary screen (i.e., 100 µM for fragments and 25 µM for nonfragments).
Data Analysis
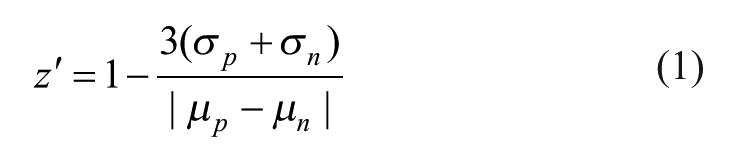
Data calculations were performed using Microsoft Excel, whereas all data plots and fittings were performed using KaleidaGraph 4.0. The z′ factor was calculated using eq 1, 15 where σp and σn are the standard deviations of the positive and negative controls, respectively, and µp and µn are the mean counts (relative luminescence units [RLU]) of the positive and negative controls, respectively. Percent inhibition of enzyme activity was calculated using eq 2, where µp is the average counts of the positive control wells and xi is the counts of the test sample.
Results and Discussions
Assay Development for HTS Application
Recently, we reported a scalable production of active LH2 enzyme and an LH assay to monitor LH2 activity, based on the amount of succinate produced. 13 This LH assay was the first reported luminescence-based strategy for the detection of succinate, by employing a coupled enzymatic assay in collaboration with Promega’s science team. 16 The succinate was quantitated in two steps: first, the succinate product is converted to ATP by a succinate recycling enzyme; and second, the ATP is detected by a luminescent readout. We have demonstrated the superiority of this luminescence strategy over previous technologies in terms of sensitivity and robustness in monitoring LH2 activity. Promega launched this new detection platform as the Succinate Glo JMJC Demethylase assay 16 very recently, claiming that this novel assay technology could be a universal tool for assaying a diverse array of Fe(II)/2-oxoglutarate dioxygenases to efficiently profile inhibitors against a panel of enzyme superfamily as leads for drug development. Although this assay is well proven regarding its advantage in sensitivity, robustness, homogeneity, and compound interference, its application to HTS has not been reported yet. Interestingly, while LH2 is a valid target for fibrotic diseases and cancer, there are currently no inhibitors reported for such important disease targets. Therefore, we sought to develop a suitable and robust HTS platform utilizing this bioluminescence-based assay to identify small-molecule inhibitors of LH2 activity.
While this assay was established for use on a small scale, further optimizations were required in order to use this assay for automated small-molecule screening. Initially, the assay included α-KG, FeCl2, ascorbate, and catalase at 100, 50, 500, and 1.5 µM, respectively, in an assay buffer containing 50 mM HEPES (pH 7.4) and 150 mM NaCl.
13
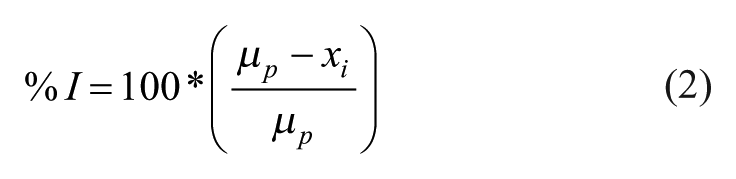
A fourfold signal-to-background (S/B) ratio was achieved when utilizing [IKG]3 at its Km (~179 µM). A higher S/B would increase the robustness of the assay. Thus, in order to achieve this, we first explored if LH2 and the [IKG]3 peptide substrate could be further optimized. Both reagents were varied in the assay optimization experiments. As shown in
LH2 assay optimization. Assays were performed by varying (
In order to confirm the optimum assay time, the LH2 assay was monitored at various time points ( Fig. 1C ). We observed that the luminescence signal increased linearly and proportionally to the assay time for up to 120 min. To estimate the amount of succinate production in the assay, a standard curve was generated using different concentrations of succinate standards ( Fig. 1D ). It was estimated that about ~5 µM succinate was produced in 90 min, which corresponds to ~5% substrate conversion based on 100 µM of α-KG. Therefore, 90 min was confirmed as the optimum assay time.
Since a stable buffer system is an important element for any high-throughput assay, we first explored the buffer components. HTS buffers usually contain small concentrations of additional additives, such as BSA, detergents, and DMSO. BSA and detergents are added to minimize nonspecific binding of enzyme to the plastics, to prevent nonspecific inhibition of enzyme by compounds, and to prevent nonspecific inhibition of aggregated compounds. DMSO is the ideal solvent for compounds, and so a small percentage is usually included in the assays. Therefore, the assay tolerance against these additives should be validated prior to compound screening.
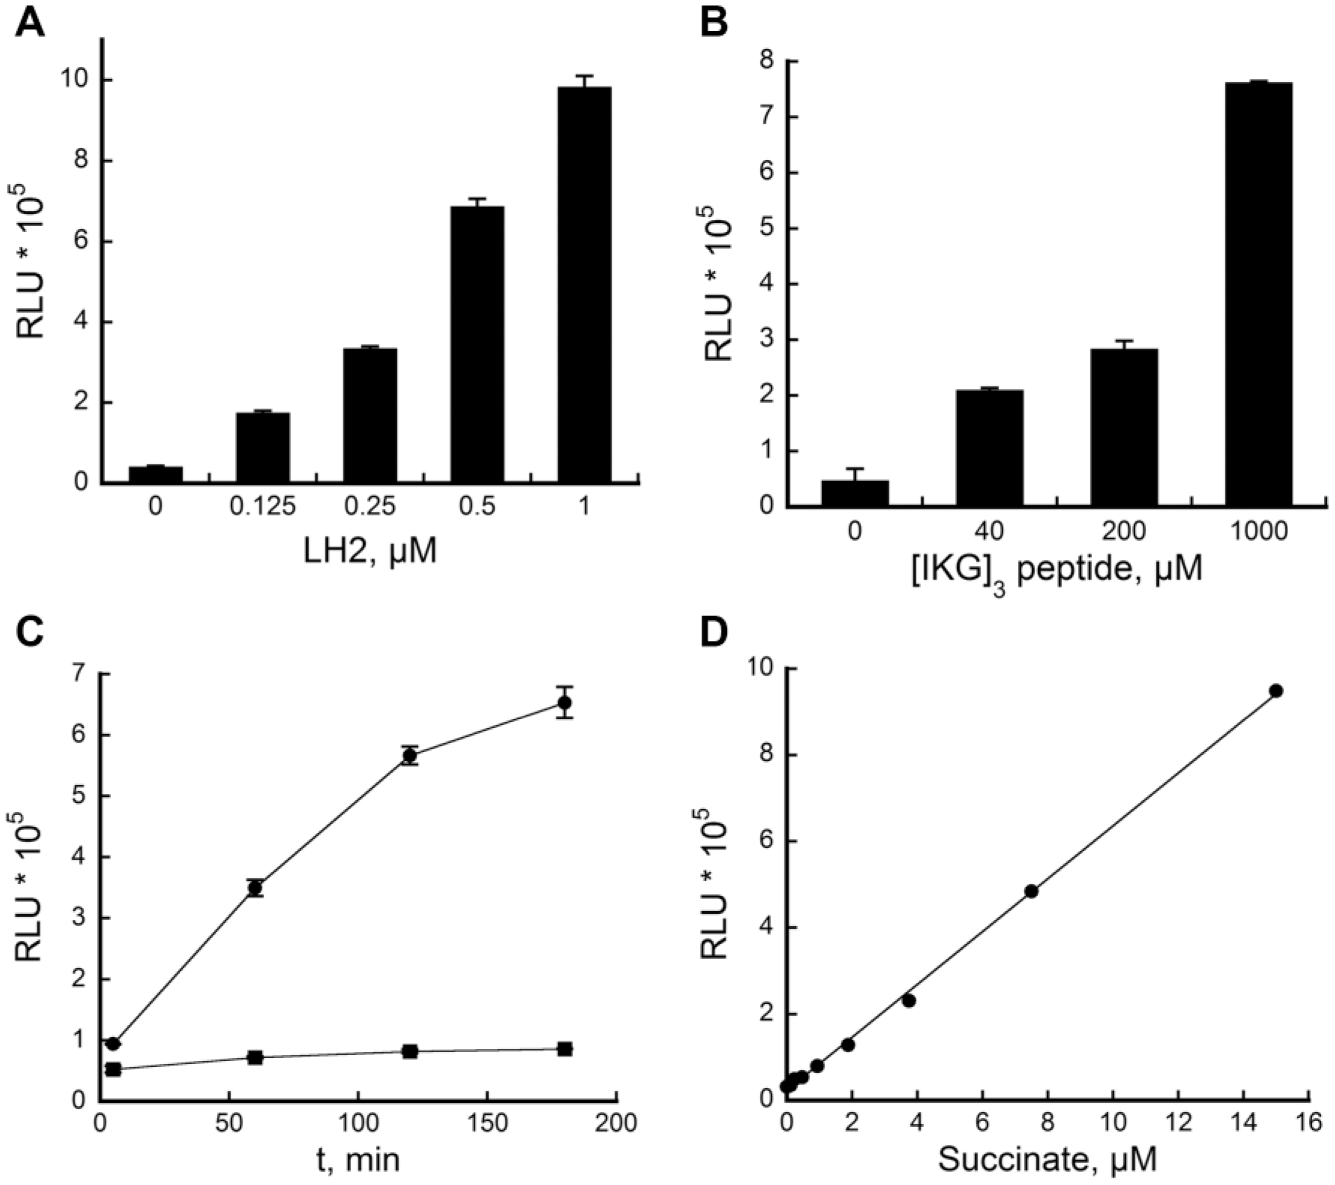
While BSA is commonly used at a concentration of 10 µg/mL or 0.1% in most enzymatic assays, we found that the luminescence signal dropped sharply with increasing concentrations of BSA ( Fig. 2A ), indicating that the assay is very sensitive to BSA. Moreover, the signal dropped by almost half at 0.1% of BSA. In order to confirm whether BSA is interfering with LH2 activity but not with the Succinate Glo reactions, we performed LH assay utilizing 10 µM succinate in the absence of LH2. We did not observe any significant drop in signal with increasing BSA concentrations ( Suppl. Fig. S1 ), confirming that BSA interferes with LH2 activity but not with the Succinate Glo kit components.
Assay stability against additives or time. Activity of LH2 (in %) were measured against variations of (
Furthermore, we examined whether DMSO or detergents interfere with the assay. As shown in
As the assay was originally developed with α-KG, FeCl2, ascorbate, and catalase at 100, 50, 500, and 1.5 µM, respectively, 13 we explored if these concentrations can be reduced further similar to the condition reported by Alves et al. 16 Achieving similar activity at reduced concentrations will be beneficial in reducing reagent usage, as well as assay interference. Although the absolute luminescence counts were lowered with reduced concentrations of α-KG, FeCl2, and ascorbate, the S/B ratio was not altered when their concentrations were reduced by 5- to 10-fold (data not shown). Using these optimized concentrations at 10 µM α-KG, 10 µM FeCl2, and 100 µM ascorbate, we were able to maintain a robust S/B (~12-fold). With the reduced substrate concentrations, a higher product turnover was required to achieve a similar level of assay quality. Therefore, we measured the assay at ~30% product conversion, which was achieved after 90 min (data not shown). As this was above the linear range of the assay, we understand that some weak inhibitors may be missed due to the slight reduction in the assay sensitivity. However, this was necessary to achieve a good assay robustness. We then examined the requirement of catalase, an enzyme that catalyzes the reduction of hydrogen peroxide, in this assay system. Catalase is often utilized in ascorbate/Fe(II) hydroxylase assays, based on its ability to decompose hydrogen peroxide generated by aqueous ascorbic acid, and thus decreases the background noise. 17 Comparing the LH2 activity in the presence and absence of catalase, no change was observed (data not shown), confirming that catalase can be omitted in this assay platform, which will be advantageous for minimizing assay interference. Collectively, we were able to reduce α-KG from 100 µM to 10 µM, FeCl2 from 50 µM to 10 µM, and ascorbate from 500 µM to 100 µM, and eliminate catalase from the reaction entirely.
More importantly, for the LH2 assay, we previously reported a Km of 11 ± 2 µM against α-KG and 169 ± 39 µM against the [IKG]3 peptide. 13 Therefore, our optimized assay is designed at the Km range for α-KG, but at the saturating range for the [IKG]3 peptide. Hence, our assay was designed to include weak competitive inhibitors against α-KG but eliminate weak competitive inhibitors against [IKG]3 the peptide. While this assay setup was suitable for our case, if desired, the concentration of the [IKG]3 peptide can also be lowered to the Km range, with some sacrifice in the S/B ratio and assay robustness.
Finally, a stability test was performed to check how long LH2 can be stored at room temperature before initiating the assay. As shown in Figure 2F , LH2 was fully active at least 2 h before starting the assay with substrate. For stability purposes, succinate detection reagent I was supplemented with 1 mM DTT, which seemed to increase the overall signal stability in our assays.
Once the assay condition was established, the assays were validated using robotic liquid handlers because the compatibility of the assay protocol with an automated system is critical in HTS applications. Assay mixture and compounds were dispensed using a Janus Automated Workstation equipped with a 384 MDT head, while other reagents were dispensed using a Microflo Select bulk dispenser. The assay automation was evaluated in a 384-well plate where columns 1–22 were assayed with positive controls and columns 23 and 24 with negative controls. The quality of the assays was assessed using a statistical parameter called z′ factor, which takes into account the mean and standard deviation values for the positive and negative controls. 15 Notably, there was a left-to-right gradient when succinate detection reagent I was dispensed using a bulk dispenser, resulting in low assay reproducibility and z′ values below 0.5. Oftentimes, this can be caused by biochemical reagents undesirably binding to plastic surfaces in disposable plastics such as tips, plates, or tubings. In our case, the addition of 0.02% Tween-20 into succinate detection reagent I significantly resolved heterogeneity within the plate and reproducibility between assays, improving the z′ over 0.5. The assay produced a reproducible z′ factor of 0.78 ± 0.01 from two consecutive experiments, suggesting a high confidence level in the assay quality. The average S/B and S/N ratios were 15.04 ± 1.75 and 16.28 ± 0.75, respectively, further supporting the robustness of the assay.
Compound Screening and Hit Confirmation
Using this validated assay, ~65,000 compounds were screened, which comprised a total of 210 assay plates. Compounds were screened at two different concentrations depending on their molecular weight distribution: 25 µM for the diverse library and 100 µM for the fragment library. The quality of 210 assay plates was again evaluated by calculating z′ values and their distribution is summarized in Figure 3A . As shown, the z′ values were greater than 0.5 for all plates, with an average z′ value of 0.81 ± 0.07. Furthermore, the average S/B and S/N from HTS were 17.00 ± 3.66 and 22.51 ± 6.84, respectively. These statistics demonstrated that the assay was robust across all 210 plates. Figure 3B shows the distribution of percent inhibition values of all library compounds presented as a histogram. As shown, the two control groups are well separated and a normal-like bell-shaped distribution can be observed for library compounds with a mean value closer to that of 0% inhibition control. The overall hit identification and confirmation flow is illustrated in Figure 3C . In our analysis, compounds were ranked by their inhibition percent and a compound was considered a hit if the percent inhibition value was higher than 50%. Using this cutoff, a total of 2525 hits were identified in the primary screen, and then PAINS and OIDD filters available from FAFDrugs4 (http://fafdrugs3.mti.univ-paris-diderot.fr/references.html) were applied to identify and eliminate any potential promiscuous hits. A total of 912 drug-like compounds were selected to confirm their reproducible inhibitory activity using the same assay. In parallel, these 912 compounds were also subjected to a counterscreen against succinate to eliminate any compounds that interfered with the Succinate Glo kit itself. Compounds that showed lower than 50% activity in the rescreen or higher than 10% activity in the counterscreen were eliminated, resulting in a final total of 160 hits.
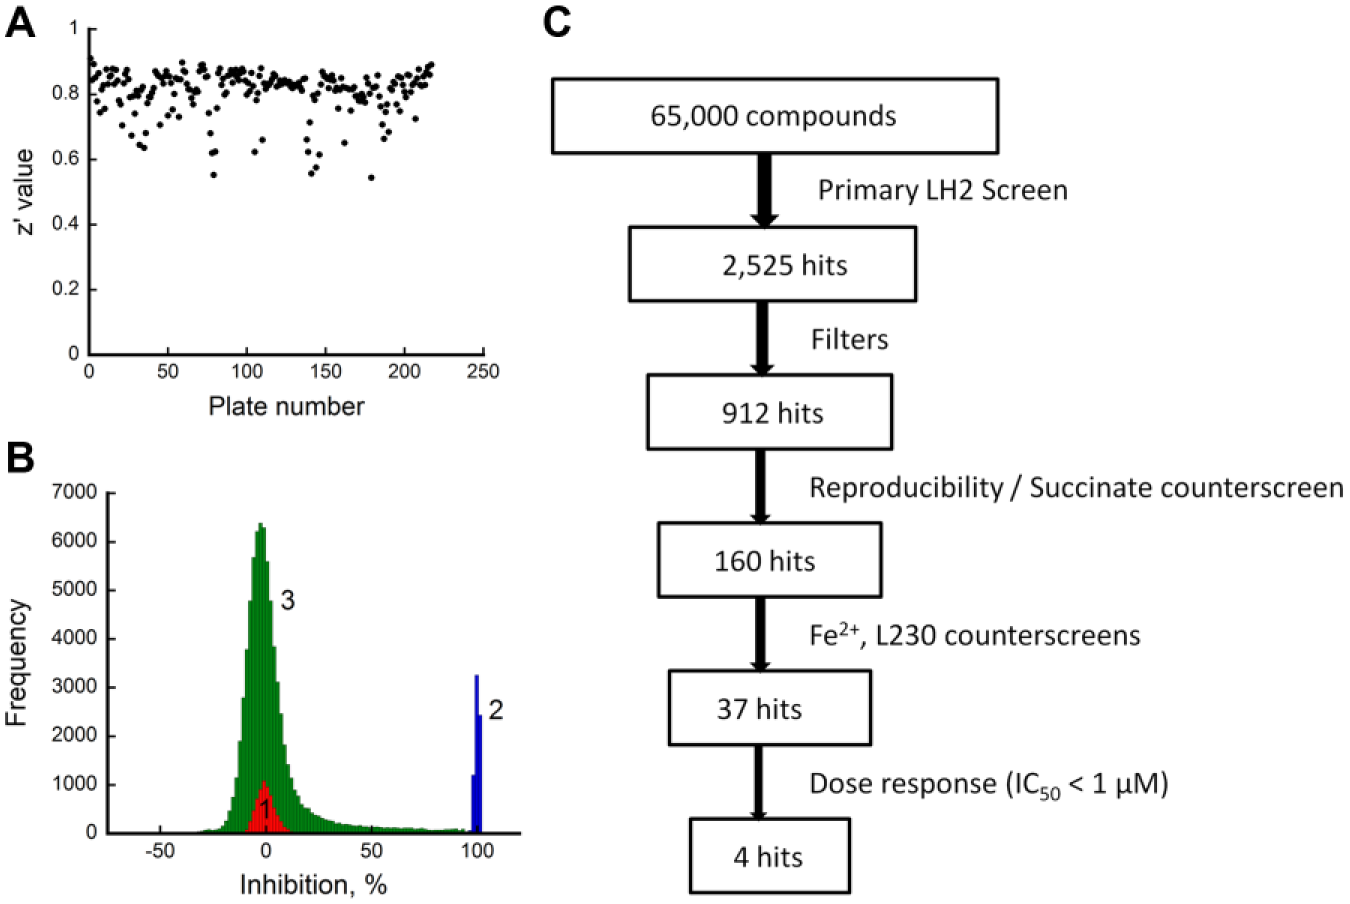
Statistical analysis for the screen. (
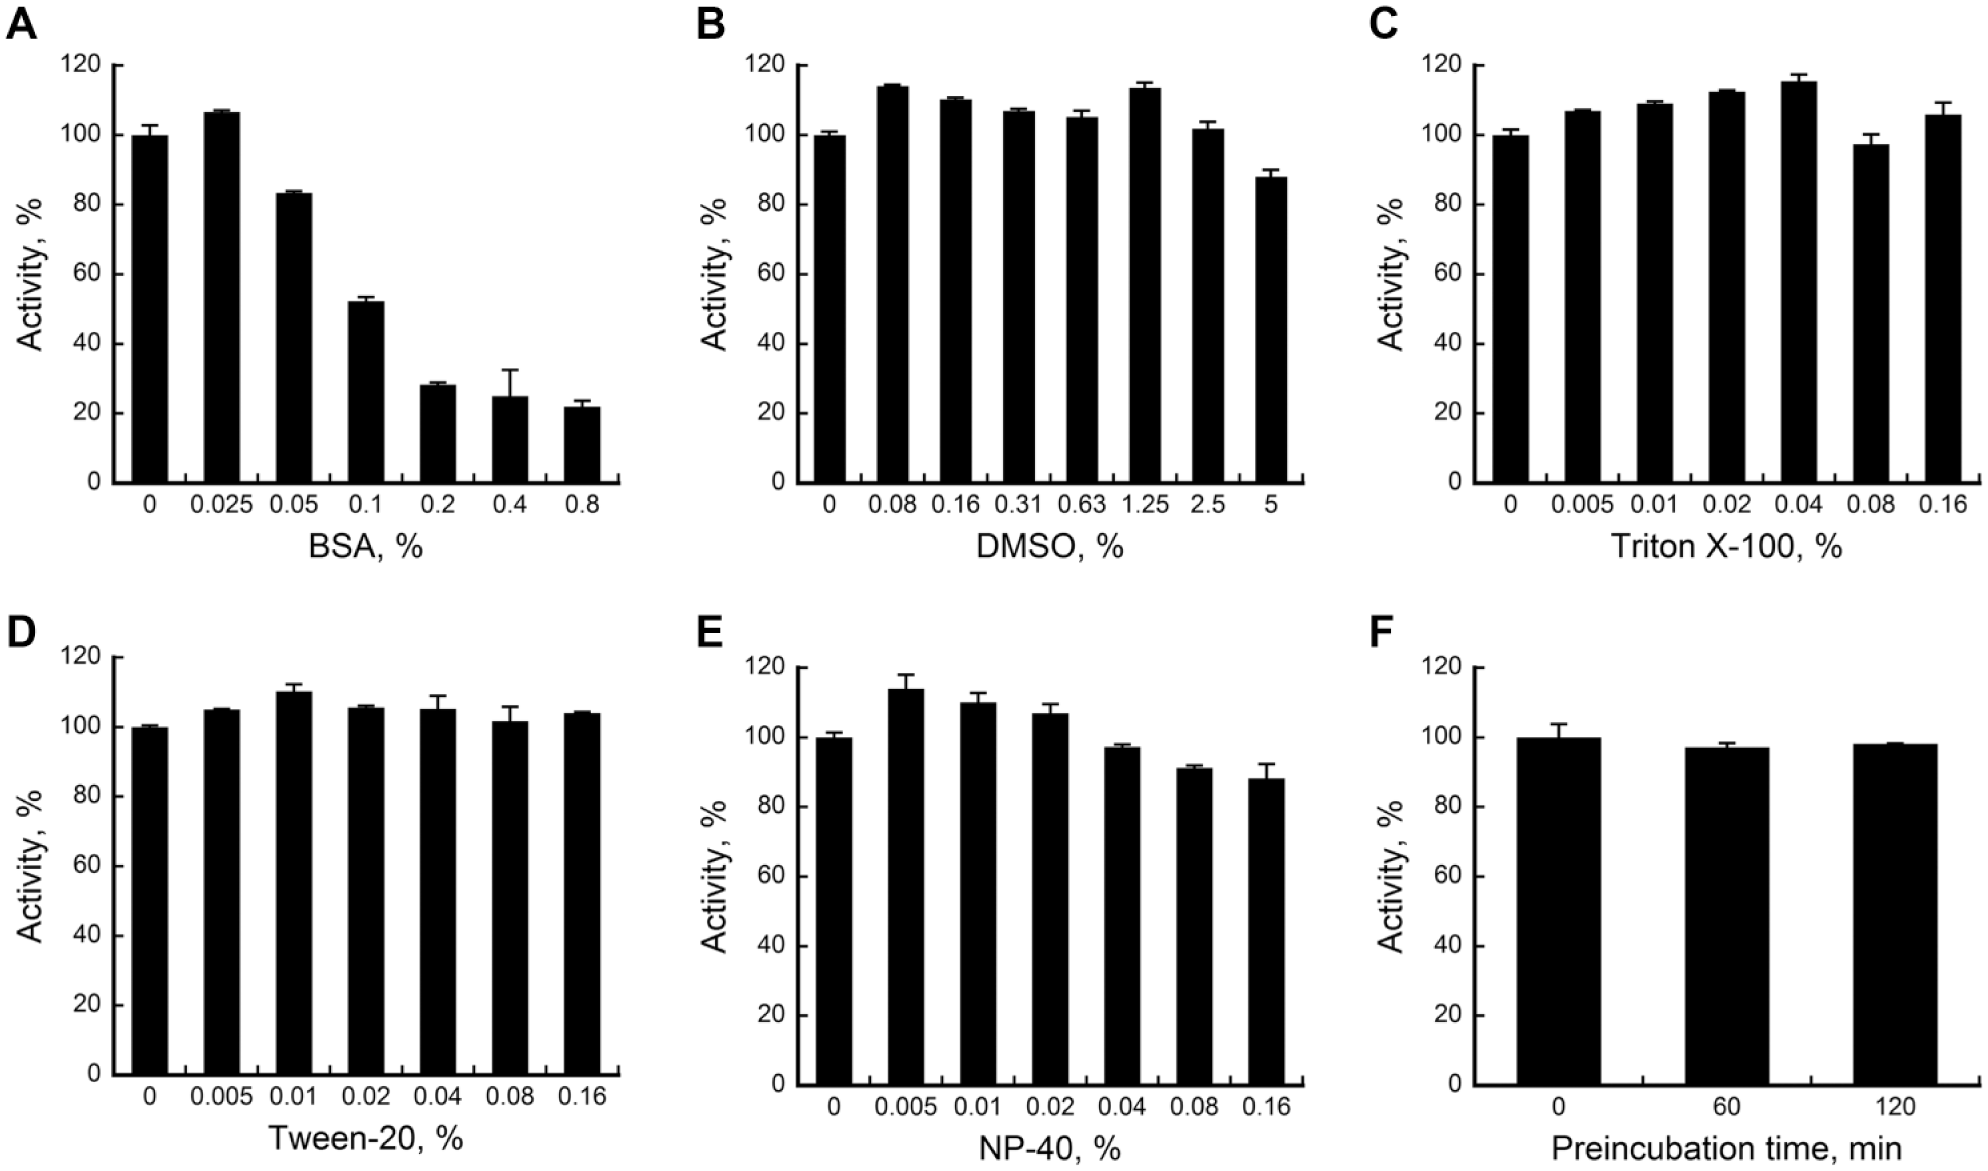
These 160 hits were further analyzed in a competition assay and a selectivity assay. First, hits were subjected to competition with 10 or 100 µM FeCl2 in an LH assay. Any change in compound activity due to the change in the concentration of FeCl2 was considered a nonspecific hit for that compound that acts by sequestering FeCl2. Second, the selectivity assay was performed against a mimivirus L230 enzyme at a single-compound concentration. L230 enzyme has distinct LH and glycosyltransferase domains, which is very similar to the bifunctional architecture of human LHs. 18 The active site of the L230 LH domain is highly conserved and structurally very similar to that of the human LHs. 14 Moreover, the L230 enzyme also has telopeptidyl LH activity similar to that of human LH2, 14 and therefore hits are expected to exhibit similar activity profiles for both LH2 and L230. We first validated the LH assay using L230 enzyme and viral collagen peptide substrate GI-12 without any modification. It was observed that L230 showed similar activity to LH2, exhibiting an S/B of ~12, thus confirming its ability to determine compound selectivity. Compounds showing greater than 50% activity for both enzymes were considered further. These steps narrowed down the hits to 37 compounds, comprising 27 fragments and 10 nonfragments. These final 37 compounds were evaluated in a dose response assay against LH2. Inhibition plots for the top 3 compounds with pIC50 values above 6 in an LH2 assay are shown in Figure 4 .
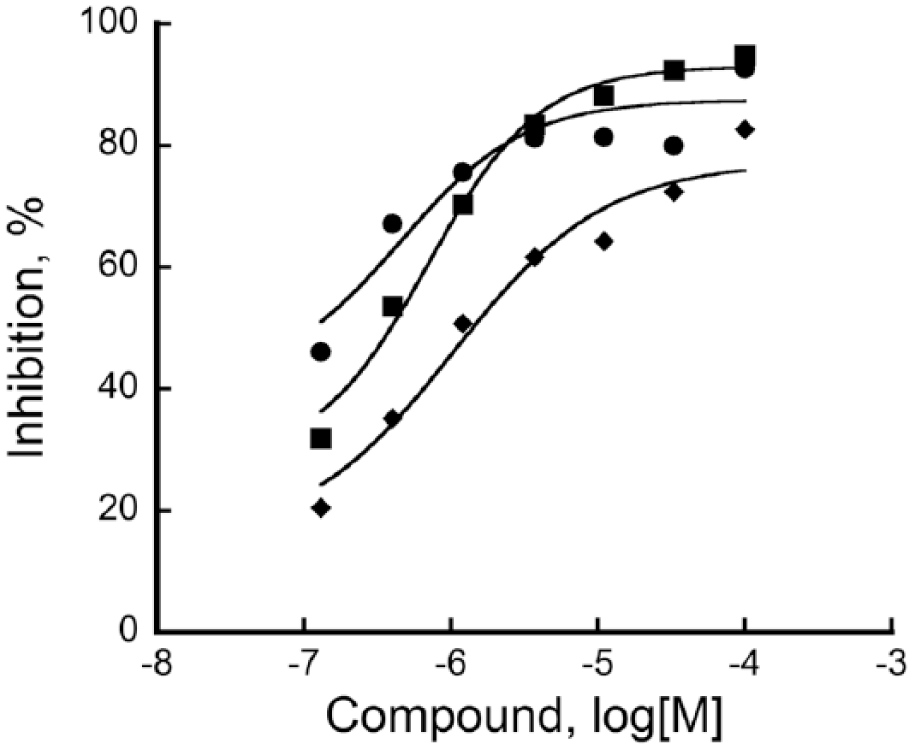
Dose response activity of top 3 compounds against LH2. The X axis represents different concentrations of compounds (in log[M]), the whereas Y axis represents inhibition of LH2 activity (in percent). In all cases, a no compound (0% inhibition) control was included and used as reference to calculate percent inhibition values. Percent inhibition was calculated according to eq 2 and data were fitted to four-parameter logistic nonlinear regression. Compounds 1 (•), 2 (■), and 3 (♦) show pIC50 values of 6.94 ± 0.08, 6.52 ± 0.04, and 6.32 ± 0.10, respectively, where pIC50 = −log(IC50).
In conclusion, we developed an LH assay for detecting inhibitors of LH2 activity in a 384-well plate system that is robust and suitable for use in HTS. This new platform was used to screen approximately 65,000 compounds and identified several potent, specific, small-molecule inhibitors of LH2, which are in the process of further development and modification. This assay, which is ideal for screening large libraries, will facilitate future drug discovery efforts to identify inhibitors of LH2 activity, which may produce new therapeutic molecules to combat fibrosis and cancer.
Supplemental Material
Supplemental_material – Supplemental material for Development of a High-Throughput Lysyl Hydroxylase (LH) Assay and Identification of Small-Molecule Inhibitors against LH2
Supplemental material, Supplemental_material for Development of a High-Throughput Lysyl Hydroxylase (LH) Assay and Identification of Small-Molecule Inhibitors against LH2 by Ashwini K. Devkota, John R. Veloria, Hou-Fu Guo, Jonathan M. Kurie, Eun Jeong Cho and Kevin N. Dalby in SLAS Discovery
Footnotes
Supplemental material is available online with this article.
Declaration of Conflicting Interests
The authors declared no potential conflicts of interest with respect to the research, authorship, and/or publication of this article.
Funding
The authors disclosed receipt of the following financial support for the research, authorship, and/or publication of this article: This work was supported by the Cancer Prevention and Research Institute of Texas (CPRIT), grants RP110532-P1 and RP160657, and by the Welch Foundation, grant F-1390.
References
Supplementary Material
Please find the following supplemental material available below.
For Open Access articles published under a Creative Commons License, all supplemental material carries the same license as the article it is associated with.
For non-Open Access articles published, all supplemental material carries a non-exclusive license, and permission requests for re-use of supplemental material or any part of supplemental material shall be sent directly to the copyright owner as specified in the copyright notice associated with the article.