
Abstract
Apyrase is a calcium-activated enzyme that catalyzes the conversion of adenosine triphosphate (ATP) to adenosine diphosphate (ADP), adenosine monophosphate (AMP), and Pi. It is currently used in studies involving cancer and platelet aggregation in humans, as well as herbicide resistance in plants. Inhibitors of apyrase are being investigated for their use to suppress tumors and combat herbicide resistance. Only a few inhibitors of apyrase have been reported, many of which were identified through automated screening using a 96-well plate format and colorimetric phosphate detection. However, these screens have had limitations, including large volumes, inconsistent reproducibility, high incidence of false hits, and lack of higher-throughput compatibility. A luciferin/luciferase-based detection system has been reported to examine potential inhibitors of apyrase; however, these reactions were performed in tubes with the assay completion in seconds, which necessitate the development of a high-throughput screening (HTS)–compatible format for screening. Therefore, a more cost-effective biochemical assay that improved the limitations of the previous assay formats using a commercially available luminescence-based detection system was developed. This new robust mix-and-read platform incorporates a low-volume luminescence-based protocol, formatted for use in 384-well microplates. This new format provides a simple and cost-effective method to screen for apyrase inhibitors and will facilitate larger HTS efforts to identify potent inhibitors of apyrase.
Introduction
Apyrase (EC 3.6.1.5) is a calcium-activated membrane-bound ATPase that catalyzes the sequential hydrolysis of adenosine triphosphate (ATP) into adenosine diphosphate (ADP), as well as ADP into adenosine monophosphate (AMP), releasing inorganic phosphate with each step. Apyrase has been characterized and studied in many eukaryotic systems and is being examined for its use in thrombosis/platelet aggregation, plant biology, and as a target for anticancer therapy.1–3 In addition, identifying drugs that inhibit apyrase activity will be useful for understanding the mechanism of action of apyrase activity and confirming proof-of-concept studies that incorporate apyrase activity using in vitro and in vivo models.
Although a few inhibitors have been identified,4,5 apyrase and other ecto-ATPases are known for being relatively insensitive to many common ATPase-inhibiting drugs.6,7 Many published apyrase inhibitors have not been effective against all apyrase enzymes,8,9 and we found that a few known apyrase inhibitors were not effective against apyrase (data not shown). This, therefore, highlights the importance for continued screening efforts to identify drugs that inhibit apyrase activity.
Assays that detect ATPase activity have widely incorporated the use of radiolabeled phosphorous or colorimetric-based phosphate detection. However, these detection systems have limitations, as radioactive assays are labor intensive and generate hazardous waste, while colorimetric assays often have issues with chemical solubility, background interference, and signal stability. This suggests that a luminescence-based assay would provide a useful alternative. A real-time luminescence-based assay for detecting apyrase activity has been previously reported, 10 but the format required constant monitoring and was not developed to be compatible with high-throughput screening (HTS). Furthermore, Promega Corporation (Madison, WI) has developed the Kinase-Glo Plus Assay Kit to be a luminescence-based detection assay capable of measuring ATP consumption. Here, we describe the optimization for a simple and robust mix-and-read luminescence-based assay for screening apyrase inhibitors in a low-volume 384-well format using the Kinase-Glo Plus Assay Kit. This improved format will be useful and more cost-effective for screening larger libraries for potent apyrase inhibitors that will be effective against a wide variety of apyrases.
Materials and Methods
Materials
All reagents and chemicals were purchased from Sigma-Aldrich (St. Louis, MO), unless otherwise stated. Ultrapure ATP was purchased from Roche Diagnostics (Indianapolis, IN). HEPES buffer was purchased from ThermoFisher (Waltham, MA). The Kinase-Glo Plus and ADP Glo Assay Kit were purchased from Promega. Potato apyrase was purchased from Sigma Aldrich (A6410) and New England Biolabs (0398S; Ipswich, MA), respectively.
Luminescence Assay Development and Optimization
Assays were initially performed manually in 0.6-mL polypropylene tubes. All reactions were performed in assay buffer, containing 60 mM HEPES (pH 6.0), 2 mM MgCl2, 2 mM CaCl2, 1 mM dithiothreitol (DTT), 0.1 mg/mL bovine serum albumin (BSA), 0.1 mM EDTA, and 0.01% Tween-20, unless otherwise stated. All reaction mixtures were prepared in assay buffer, and ATP was used to initiate the assays. Assays were monitored over time and quenched with Kinase-Glo according to manufacturer’s instructions, and then 20 µL was transferred to a white 384-well low-volume microplate (4512; Corning, Corning, NY) and read using a Synergy H4 plate reader (BioTek Instruments, Winooski, VT).
Apyrase dose response was performed by varying concentrations of apyrase from 62.5 to 2000 pM in the assay. Substrate dose response was performed by varying ATP concentration from 0 to 250 µM using the ADP Glo Assay Kit instead of Kinase-Glo Plus to accommodate a wider range of ATP concentrations. Initial velocity data were fitted against corresponding substrate concentrations using a Hyperbola, Single Rectangular, 2-Parameter equation (SigmaPlot 11.0; Systat Software, San Jose, CA). Finally, reaction times were varied in the assay to determine the optimum assay condition. Unless otherwise stated, further assay validation was performed in assay buffer using 200 pM apyrase and 25 µM ATP.
The inhibition of apyrase activity using sodium orthovanadate was next examined. Apyrase was incubated by varying the concentration of sodium orthovanadate from 0 to 10,000 µM in the assay. Assays consisted of 16 µL apyrase, 2 µL orthovanadate, and 2 µL ATP. Enzyme solution was premixed with orthovanadate, and the assays were initiated with ATP. Reactions were run for 60 min before quenching with Kinase-Glo Plus.
Next, the stability of apyrase at room temperature was tested. Apyrase was incubated at room temperature for 0 to 120 min in assay buffer. After every 30 min, apyrase assays were initiated with the addition of ATP and were run for 60 min before quenching with Kinase-Glo Plus.
To examine assay tolerance in the presence of DMSO and Tween-20, apyrase reactions were incubated with varying concentrations of DMSO or Tween-20 from 0% to 1%. Assays consisted of 16 µL apyrase, 2 µL DMSO (or Tween-20), and 2 µL ATP. Enzyme solution was premixed with DMSO or Tween-20, and the assays were initiated with ATP. Reactions were run for 60 min before quenching with Kinase-Glo Plus.
Reactions were then miniaturized in a 384-well microtiter plate format with reduced assay volume of 10 µL. The reaction time was also reduced to 30 min to prevent the reaction from proceeding near completion. Next, assay validation was conducted by plating columns 1 to 22 of 384-well plates with positive controls that contained apyrase in assay buffer while plating columns 23 to 24 with negative controls only containing assay buffer. First, 6 µL of enzyme solution containing 1.67× apyrase in 1.33× assay buffer (columns 1–22) or 1.33× assay buffer only (columns 23–24) was dispensed using a JANUS Automated Workstation (PerkinElmer, Waltham, MA). Second, 2 µL of 5× concentrations of DMSO diluted in water was dispensed with the MicroFlo Select Bulk Dispenser (BioTek) and allowed to preincubate with apyrase for 30 min at room temperature. The final concentration of DMSO was maintained at 0.1%. Third, 2 µL of 5× ATP diluted in 1× assay buffer was dispensed with the MicroFlo Select Bulk Dispenser to initiate the enzyme reaction and incubated for 30 min at room temperature. The reaction was quenched with addition of 10 µL of Kinase-Glo Plus detection reagent using the MicroFlo Select Bulk Dispenser. Plates were mixed on an orbital shaker for 2 min and incubated at room temperature for 10 min to allow for signal stabilization. Luminescence was then read in a Synergy H4 Plate Reader. Sodium orthovanadate at a 2-mM concentration was used in all plates to serve as a comparison for enzyme inhibition.
Compound Screening
Compound screening was performed as described in assay validation above but with compounds instead of DMSO. In addition, the JANUS Automated Workstation was used for the compound dilution and dispense instead of the MicroFlo bulk dispenser. In detail, 0.5 µL of compounds was diluted in a dilution plate prefilled with 49 µL of water, and then 2 µL of the diluted compounds was transferred to an assay plate. We diluted compounds in water rather than in assay buffer because it is more convenient and cost-effective to fill the dilution plate with water in HTS campaigns. More than 1500 bioactive compounds, which were custom-selected by Texas Screening Alliance for Cancer Therapeutics (TxSACT, Austin, TX), were chosen, and compounds were screened at a final concentration of 10 µM with the DMSO concentration maintained at 0.1%. This unique collection comprises small molecules with known activities against around 100 kinases and other important therapeutic targets, representing a useful panel of compounds for developing leads against novel ATP-dependent proteins based on their off-target activities.
For drug rescreening, assays were performed in 10-µL reaction volumes. However, dispensing steps were slightly modified to accommodate higher drug concentrations. The enzyme dispense was 3 µL, the compound dispense was 5 µL, and the substrate step was 2 µL. The final concentrations of buffer, enzyme, and substrate remained the same as in the validation and initial screens. The new drug concentrations were 50 µM, and the final concentrations of DMSO were maintained at 0.5%.
Statistical Analysis
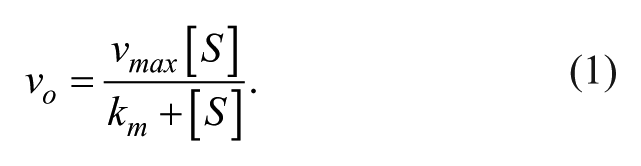
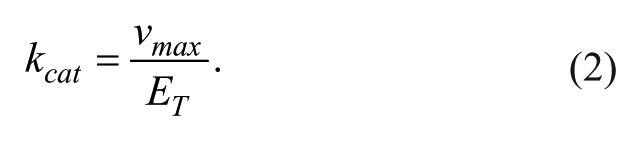
Initial velocities were calculated according to equation (1), and the turnover rate was calculated according to equation (2). For enzyme kinetics, vo is the initial velocity, vmax is the maximum velocity, [S] is the concentration of substrate, km is the concentration of substrate at ½ the maximum velocity, kcat is the rate of turnover, and [ET] is the total enzyme concentration.
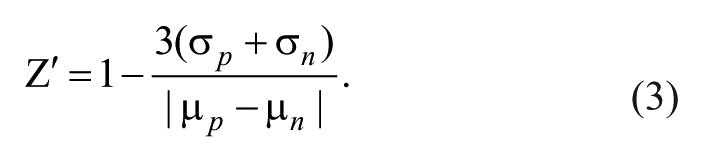
Z′, a common statistical tool used to measure the quality of HTS assays,
11
was calculated according to the equation (3),
Enzyme inhibition was calculated according to equation (4). 12 For enzyme inhibition, Ai is the activity in the presence of inhibitor, Ao is the activity in the absence of the inhibitor, [I] is the concentration of the inhibitor, IC50 is the inhibitor concentration necessary to achieve 50% inhibition, and h is the Hill coefficient.

Results and Discussion
Luminescence-Based Assay Development and Optimization
Previously reported screens with potato apyrase have used a 96-well plate format and are based on the colorimetric detection of free phosphates.4,5 However, these screens have several drawbacks, such as their low throughput, larger assay volumes due to a 96-well plate format, and their susceptibility to identifying false hits. In addition, colorimetric detection of free phosphates is an indirect method of detection and does not account for the generation of phosphates due to the hydrolysis of ADP, which is coupled with the ATP-hydrolyzing step for apyrase. This is an important consideration for monitoring apyrase activity, since it has been reported that different apyrase enzymes have different ATPase/ADPase ratios. Moreover, the colorimetric detection of phosphates during drug screening is vulnerable to precipitate formation and signal instability. Therefore, to improve upon this method, a luminescence-based screening format was used to detect ATP consumption of apyrase. The ATP-hydrolyzing activity of apyrase was monitored using the Kinase-Glo Plus Assay Kit. As shown in Figure 1 , the Kinase-Glo Plus Assay Kit uses a luciferin/luciferase-based detection system to monitor the levels of ATP in the reaction. The corresponding luminescence signal is proportional to the amount of ATP remaining in the reaction and is inversely proportional to the activity of apyrase ( Fig. 1 ). While it is still possible to have false hits due to inhibition of luciferase activity, this risk is minimized by using the Kinase-Glo Plus Assay Kit, which provides an excess of detection substrates to help prevent false hits due to off-target inhibition of luciferase. Here, a modified luminescence-based format was developed that uses a simple mix-and-read format with end-point detection and is based on the measurement of ATP remaining in the reaction. This detection method allows for the direct measurement of ATP consumption, rather than the traditional methods that measure ADP or phosphate formation.
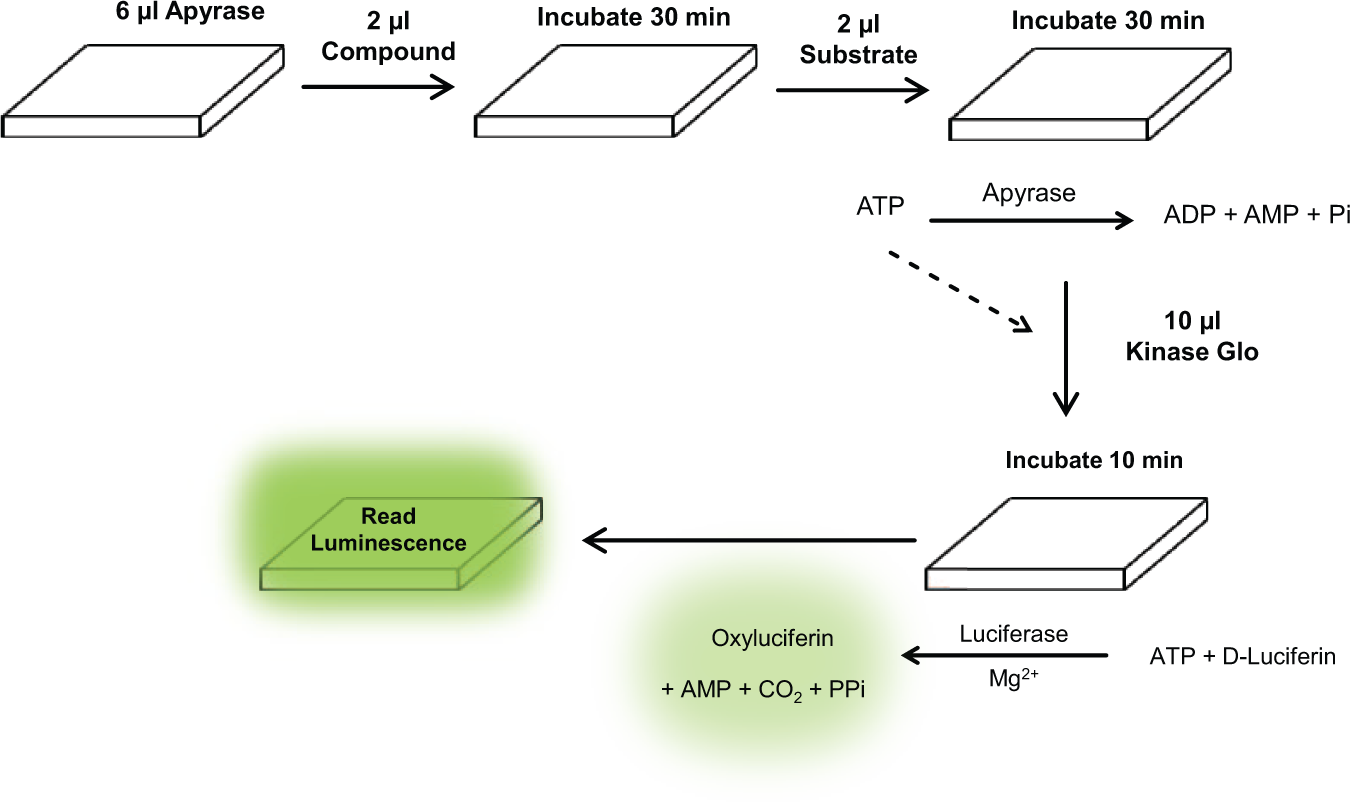
Luminescence-based detection of apyrase activity. This improved screening format detects adenosine triphosphate (ATP) remaining in the reaction to determine activity of apyrase. The luminescence signal is inversely proportional to apyrase activity and provides a simple workflow. The workflow for screening apyrase is a convenient mix-and-read format for use in 384-well plates, using a reaction volume of 10 µL. The assay consists of four dispenses total and is capable of being performed in under 2 h.
The assay was initially developed in polypropylene tubes by varying apyrase and ATP concentrations over different time periods to determine the ideal condition for measuring apyrase activity with a single end-point measurement. Figure 2A shows the substrate dose response from 0 to 250 µM ATP using the ADP Glo Assay Kit. Due to the limitation of the Kinase-Glo Plus Assay Kit to linearly detect ATP concentrations from 0 to 100 µM, the ADP Glo Assay Kit, which can measure ATP linearly in the range of 1 µM to 1 mM, was used instead. We also monitored luminescence signals at 10 min and 20 min after adding Kinase-Glo, respectively, to validate that the enzymatic activity was quenched completely by addition of the Kinase-Glo Assay Kit. We did not observe any changes in luminescence signals between 10 and 20 min (data not shown), which indicated Kinase-Glo Assay Kit is a convenient tool to quench and visualize the assay, simultaneously. The Michaelis-Menten constant, km, for ATP was 9.29 ± 3.17 µM, which is consistent with previously reported km values for potato apyrase. 13 The kcat was determined to be 100 s−1, and the calculated catalytic efficiency (kcat/km) is approximately 107 M−1s−1, which is also consistent with previously reported values. 13 Using ATP at the km (10 µM) caused the reaction to proceed too quickly to be easily monitored under these conditions, and therefore the amount of ATP substrate used was raised to 25 µM. Figure 2B shows the apyrase dose response from 0 to 2000 pM using 25 µM ATP, demonstrating that the activity of apyrase is proportional to its concentration from 0 to 250 pM. Furthermore, Figure 2C shows the reaction progress over time using 200 pM apyrase and 25 µM ATP. Typically, a higher ATP consumption (~80% activity) is generally ideal for measuring luminescence assays to increase the assay sensitivity. A reaction time between 30 min and 60 min produced a 5-fold signal decrease compared with the background, with approximately 80% reaction completion using a 20-µL reaction volume. At 80% completion, apyrase activity will no longer be in its linear phase, and as a result, weak inhibitors may be missed. In addition, fixed concentrations of apyrase and ATP at 200 pM and 25 µM were chosen so that it would give maximum signal-to-background (S/B) ratio after 30 min. Normally, length of reaction time can be increased by decreasing the enzyme concentration in the assay, but we found that reducing apyrase concentration below 200 pM negatively affected the S/B ratio, which may be due to enzyme already being too dilute at this point. Since the chosen substrate is well above the km, this assay is more selective toward strong inhibitors.
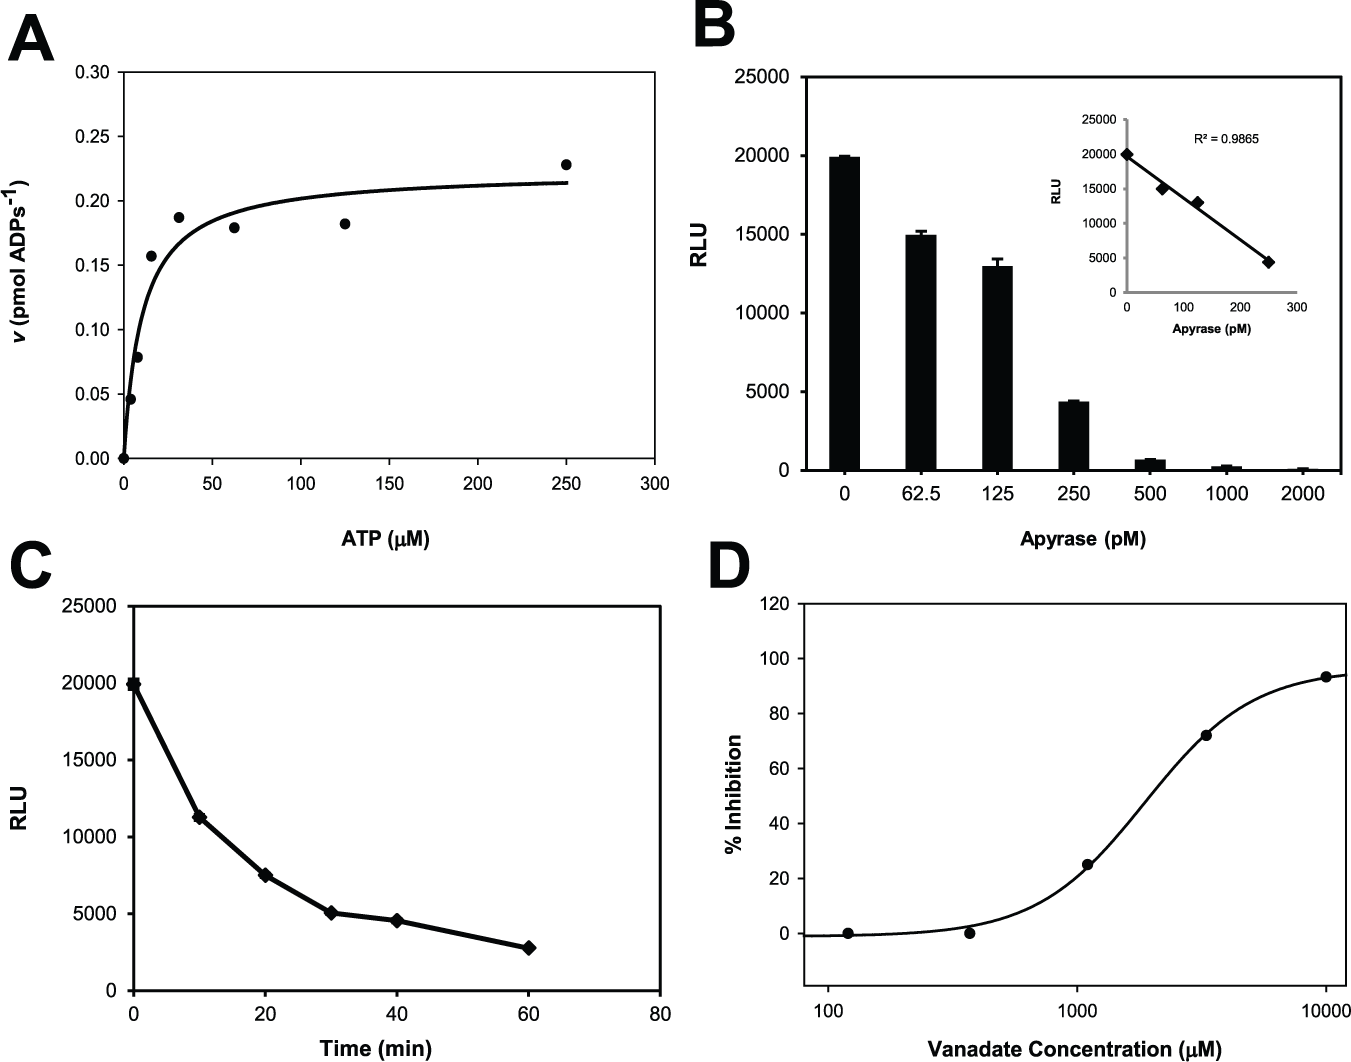
Kinetics of apyrase assay. (
It has been demonstrated in two previous screens with apyrase that potent inhibitors of apyrase can be found4,5; however, both of these screens produced few “hits” despite being screened against large diversity libraries. Apyrase is known to be relatively insensitive to many commonly used ATPase-inhibiting drugs and requires high concentrations of these drugs to effectively inhibit apyrase activity in vitro, which highlights the need for specific and potent inhibitors of apyrase. To validate the capability of this assay for inhibitor screening, sodium orthovanadate was employed. As shown in Figure 2D , percent inhibition was proportional to the concentration of sodium orthovanadate, and fitting the data to equation (4) resulted in an IC50 of approximately 2 mM. This IC50 was higher than the previously reported value (20 µM) using real-time luminescence detection but under different assay conditions. 10 It should be noted that apyrases can vary widely in their sensitivity to vanadate, which may be why the IC50 obtained using this method differed from that of a real-time luminescence-based method. However, this difference may also be dependent on experimental conditions. While the end-point assay strategy could be less beneficial in terms of sensitivity over the kinetic method, kinetic measurement completed in seconds is certainly not feasible for high-throughput application. In this regard, we considered that our Kinase-Glo–based luminescence assay was better suited for inhibitor screening in a high-throughput manner against apyrase, and 2 mM of sodium orthovanadate was subsequently chosen to serve as control for inhibition during validation and screening.
Because HTS is usually performed at room temperature, we examined the stability of apyrase at room temperature by incubating apyrase for varying times before initiating the assay. As shown in Figure 3A , the enzyme activity was stable over 2 h, indicating the activity of apyrase is stable and thus this assay is suitable for HTS.
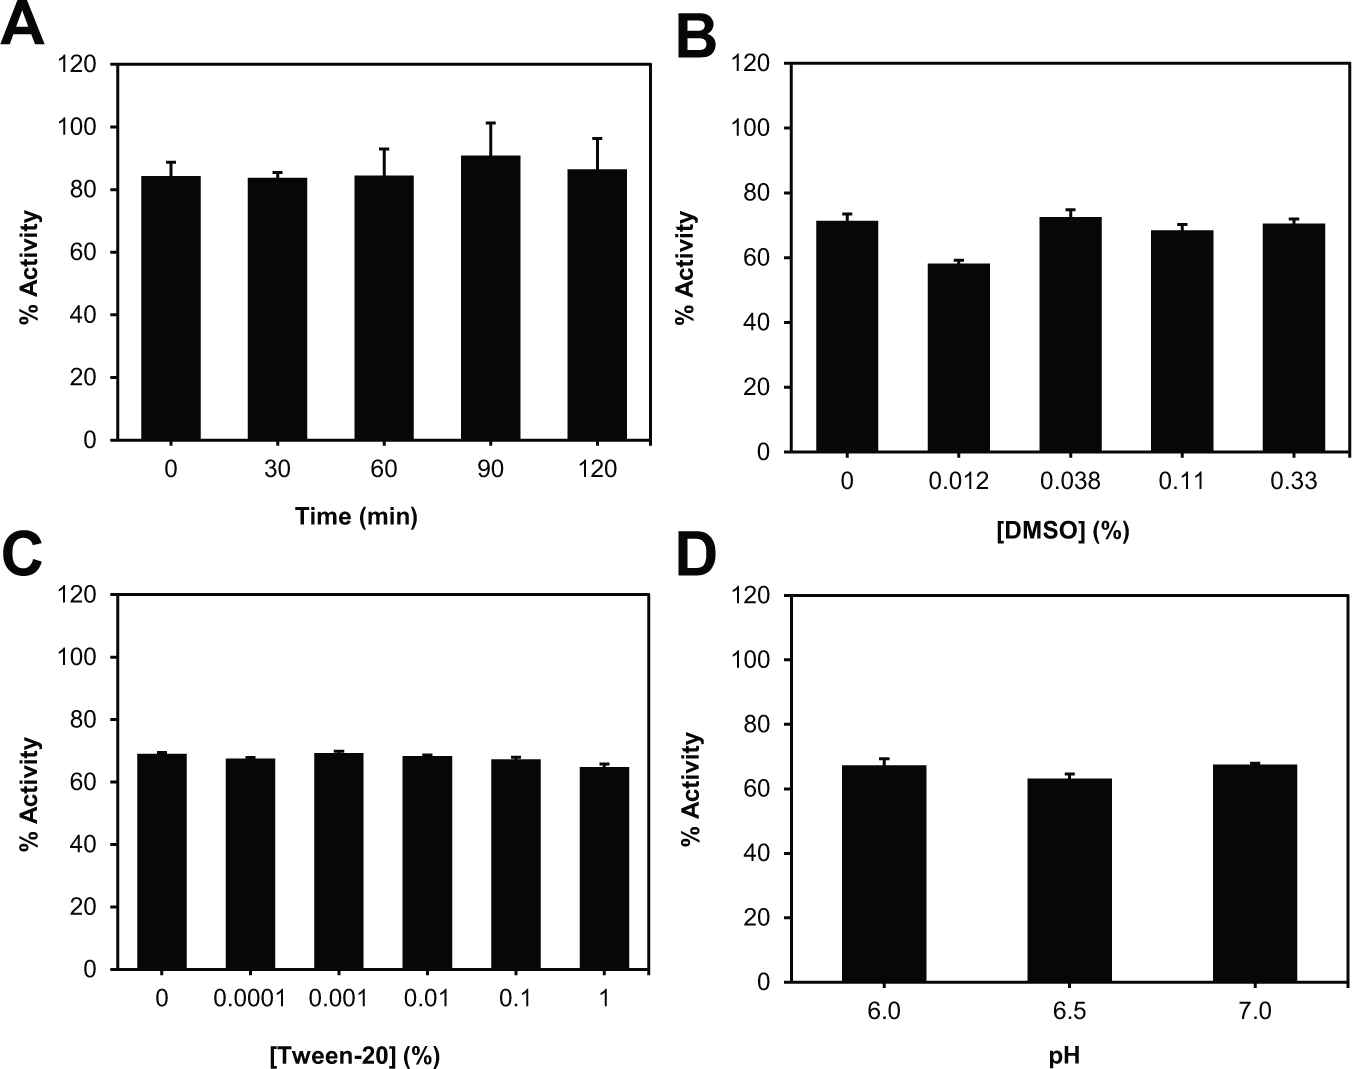
Assay stability and tolerance. (
As HTS assays also use additives, it is necessary to make sure they do not interfere with the assay. We therefore tested the effect of DMSO and Tween-20 by varying their concentrations in the assay. DMSO and Tween-20 concentrations of up to 1% showed little to no effect on enzyme activity during a 30-min reaction ( Fig. 3B , C ). Final concentrations of 0.1% DMSO and 0.01% Tween-20 were chosen for further validation.
A previous screen using apyrase was performed in HEPES buffer at pH 6.5. 4 However, the ideal pH of apyrase has been reported to be 6.0. 13 Therefore, the assay buffer used for this screen used HEPES at pH 6.0. To ensure this change in pH did not have an effect on apyrase, enzyme activity was measured at a pH of 6.0, 6.5, and 7.0. When monitoring apyrase activity at these pH levels, no difference was observed ( Fig. 3D ), and a pH of 6.0 was maintained throughout assay optimization, validation, and screening.
Last, assay performance in a plate format and potential of further assay miniaturization were investigated in a 384-well microplate by reducing assay volume down to 10 µL. The S/B ratio for 10-µL assays performed in a 384-well plate was 3.99 ± 0.66, which was similar to that of 20-µL assays performed in tubes (5.09 ± 0.49). Based on this result, an assay volume of 10 µL was chosen for validation.
Assay Validation
Assay reproducibility and consistency are important for proper statistical analysis for identifying inhibitors. We performed validation in a similar way using a 10-µL assay volume in a 384-well plate, where columns 1 to 22 were assayed with positive controls, enzyme with substrate, and columns 23 to 24 were assayed with negative controls, enzyme alone and substrate alone, respectively. The quality of the assay was measured by a statistical parameter, Z′ factor, 11 which takes into account the mean and standard deviation values for the positive and negative controls. The validation from three separate experiments produced a reproducible Z′ factor of 0.81 ± 0.02, indicating that the negative and positive controls are well separated. The average S/B and signal-to-noise (S/N) ratios were 4.31 ± 1.96 and 14.42 ± 5.36, respectively, supporting that the assay is robust and ready for the compound screening.
Compound Screening
Screening libraries were assembled in a 384-well plate format, where compounds dissolved in 100% DMSO at a 10-mM concentration were plated in columns 3 to 22, while DMSO alone was plated in the remaining four columns to serve as controls. This allows for a maximum of 320 compounds to be screened per plate while also allowing for internal controls to be present in each plate.
The validated assay was used to screen a custom-assembled kinase-focused library containing over 1500 bioactive molecules at a final concentration of 10 µM, and 2 mM vanadate was included in all plates to serve as a comparison of enzyme inhibition. A total of six plates were screened initially, and the assay statistics yielded Z′, S/B, and S/N of 0.70 ± 0.08, 4.16 ± 0.24, and 21.62 ± 4.24, respectively. The vanadate control showed approximately 40% to 50% inhibition, confirming the assay is reproducible. However, none of compounds showed percent inhibition over 10 or a z score over 3. A z score indicates variance from the mean and is calculated as z score = (X – µ)/σ, where X is the value, µ is the population mean, and σ is the standard deviation. The highest potency observed was 8% inhibition or a z score of 1.87 from a compound, fostamatinib. Considering the assay sensitivity, we decided to rescreen a few plates at a higher concentration of drugs. Two plates, in which two compounds showed z scores over 1.5 in the initial screen including fostamatinib, were chosen with anticipation of enhancement in inhibition activity of those hits at a higher dose. Screening two plates at 50 µM resulted in Z′, S/B, and S/N ratios with 0.86 ± 0.01, 3.13 ± 0.06, and 20.67 ± 4.67, respectively, representing that the assay quality is still robust at increased DMSO content of 0.5%. The compound activity of fostamatinib was enhanced by ~2-fold to 17.24% inhibition or 3.2 of the z score. Two more compounds were identified with percent inhibition near 10 or a z score over 1.5.
The relatively low hit rate (0.06%), even at a higher concentration, leads to a couple of considerations: (1) the selection of the library is critical when only a small number of compounds with designated characteristics were being tested, and (2) the level of assay sensitivity is critical and can be controlled according to the purpose of screening through a reoptimization procedure without sacrificing assay quality. Although weak inhibitors can be missed from our current optimized protocol, this assay is designed to detect more potent competitive inhibitors of apyrase in a high-throughput manner.
To confirm the suitability of this assay with other apyrase enzymes, recombinant potato apyrase purchased from New England Biolabs (NEB) was evaluated. Apyrase from NEB, which was not commercially available during optimization and screening, has a higher ATPase/ADPase ratio (14:1), is more pure (95%), and has a higher specific activity (3000 units/mg) compared with apyrase from Sigma (10:1 ratio, 59% purity, and 750 units/mg specific activity). The enzyme activity of apyrase from NEB was measured using 25 µM ATP under the same assay conditions. It was found to consume about approximately 80% of ATP using only 19 pM enzyme for the reaction ( Fig. 4A ), which is about 10× less enzyme needed compared with purified potato apyrase from Sigma. In addition, it was found that assay using apyrase from NEB was tolerant to 0.1% DMSO and 0.01% Tween-20 ( Fig. 4B ). The IC50 for sodium orthovanadate was determined to be approximately 2 mM (data not shown), and the validations generated Z′, S/B, and S/N of 0.79, 6.15, and 14.96, respectively. This confirms that, using the conditions provided here, very little reoptimization was needed when examining apyrase from NEB compared with apyrase from Sigma, and that, despite differences in their ATPase/ADPase ratios, purities, and specific activities, apyrase from different vendors demonstrate very similar properties, and both enzymes are suitable for use in HTS with this new method.
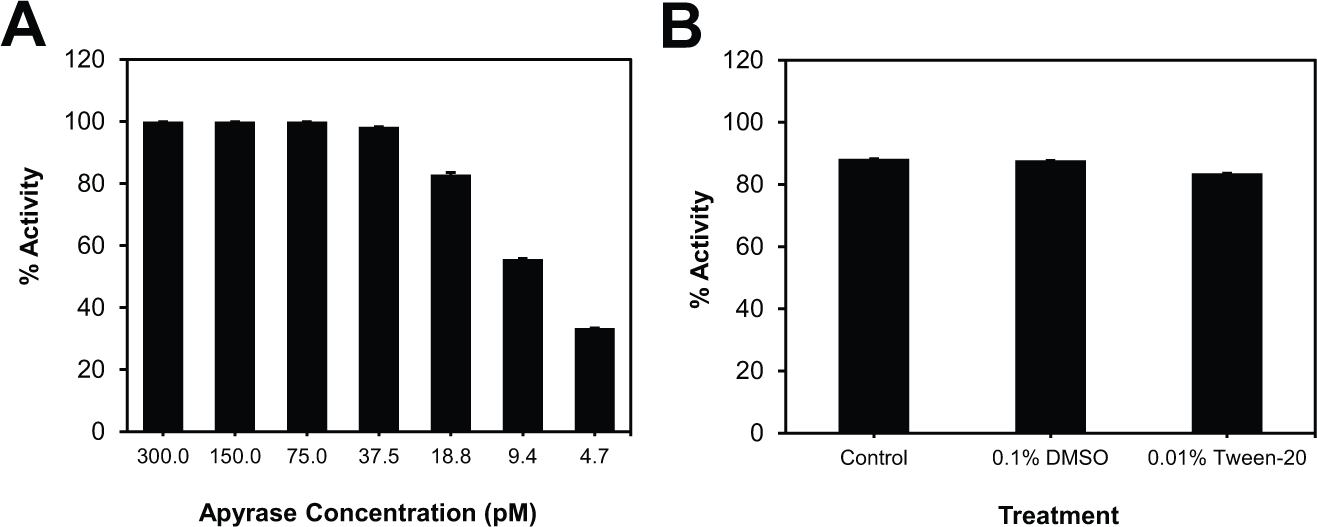
Assay performance using apyrase from New England Biolabs (NEB). (
While members of the apyrase family have been found in all prokaryotes and eukaryotes, they have been classified by their unique catalytic properties (ATPase and/or ADPase), solubilization, subcellular locations, and/or functions.1,14 Among many apyrases, isoforms of potato apyrase isolated from Solanum tuberosum tubers were the first proteins of the apyrase to be purified and have been most extensively studied10,13–15 because they are soluble, easily purified unlike many other apyrases that are membrane bound and thus extremely difficult to isolate, and exhibit high specific activities. Because of the current lack of diverse and potent inhibitors and purification of recombinant apyrases, screening efforts are still ongoing, and the need for a more convenient and cost-effective method using luminescence-based end-point detection will be useful moving forward. Due to the conserved nucleotide binding regions of all known apyrases (apyrase-conserved regions 1 and 4), we believe that competitive inhibitors discovered with this improved method should be effective against human apyrases with potential for cancer therapeutics. As shown in Figure 1 , this new improved screening strategy using potato apyrase as a model system demonstrated that a simple low-volume workflow can be performed in less than 2 h. In addition, we demonstrated that the commercially available apyrase enzymes with differing ATPase/ADPase ratios can be quickly adapted with little to no reoptimization. This adaption provides a novel platform to screen larger and more diverse libraries to identify potent inhibitors of apyrase.
Footnotes
Declaration of Conflicting Interests
The authors declared no potential conflicts of interest with respect to the research, authorship, and/or publication of this article.
Funding
The authors disclosed receipt of the following financial support for the research, authorship, and/or publication of this article: This work was supported by the Cancer Prevention and Research Institute of Texas (CPRIT), grant RP110532-P1.