
Abstract
Nrf2, a master regulator of the phase II gene response to stress, is kept at low concentrations in the cell through binding to Keap1, an adaptor protein for the Cul3 ubiquitin ligase complex. To identify Nrf2 activators, two separate time-resolved fluorescence resonance energy transfer (TR-FRET) assays were developed to monitor the binding of Nrf2-Keap1 and Cul3-Keap1, respectively. The triterpenoid, 1-[2-cyano-3-,12-dioxooleana-1,9(11)-dien-28-oyl] imidazole (CDDO-Im) and its analogs, exhibited approximately 100-fold better potency in the Cul3-Keap1 assay than in the Nrf2-Keap1 assay, and this difference was more profound at 37 °C than at room temperature in the Nrf2-Keap1 assay, but this phenomenon was not observed in the Cul3-Keap1 assay. A full diversity screen of approximately 2,200,000 GSK compounds was run with the Cul3-Keap1 TR-FRET assay and multiple chemical series were identified and characterized.
Introduction
The environment produces toxic stresses that impact the cellular functions in eukaryote biological systems. 1 Stresses such as oxidative stress, hypoxia, xenobiotic toxins, and viral infections can lead to cancer, cardiovascular diseases, and chronic inflammations.2–6 To combat these toxic stresses, cytoprotective genes are expressed, including NADPH:quinine oxidoreductase (NQO1), glutathione-S-transferases, and heme oxygenease-1, that help to protect eukaryote cells against electrophilic and oxidative damage.7,8 The Nrf2 (nuclear factor erythroid 2-related factor 2) signaling pathway is one such pathway that regulates the expression of these cytoprotective genes. Nrf2 is a transcription factor that belongs to the Cap ‘n’ Collar family of transcription factors, which contain a characteristic basic leucine zipper motif.9,10 Under basal conditions, Nrf2 is bound to the cytosolic actin-bound adapter protein, Keap1 (Kelch-like ECH-associated protein 1), which recruits Nrf2 to the Cul3 (Cullin-3)-based E3-ligase ubiquitination complex and undergoes subsequent proteasomal degradation.6,11–15 One hypothesis of Nrf2’s activation of cytoprotective genes is that when toxic stresses are imposed on eukaryote cells, Nrf2 is dissociated from the Keap1 repressor protein16,17 and translocates into the nucleus, where Nrf2 dimerizes and forms a complex with small Maf proteins that regulate the antioxidant response element (ARE) and subsequently activate the expression of various cytoprotective genes. 17
The Keap1 protein consists of an N-terminal region, a BTB domain (Broad-Complex, Tramtrack and Bric-à-Brac), a cysteine-rich intervening region, a double-glycine-repeat Kelch domain, and a C-terminal region. 18 It is proposed that Keap1 interacts with Cul3 via the BTB domain, 15 while it binds to Nrf2 via the Kelch domain; the latter adopts a “two-site” binding model to Nrf2, where the “ETGE” site has high affinity and the “DLG” site has low affinity,19,20 referred to as the “hinge” and “latch” sites,21,22 respectively.
Keap1 is a cysteine-rich protein containing 27 cysteine residues, 7 of which are reactive. Modification of one or more of these seven cysteine residues disrupts Nrf2 binding. For instance, in the intervening region of Keap1, two reactive cysteines, C273 and C288, have been identified to potentially play a role in stabilizing the Keap1-Nrf2 complex for the ubiquitination of Nrf2. 23 Electrophilic attack of the cysteine residues C273 and C288 by chemical inducers (i.e., isothiocyanate and sulforaphane) reduces the ability of Keap1 to target Nrf2 for proteasomal degradation, which in turn increases Nrf2 stabilization.24,25 Further, mutations of either C273 or C288 abrogate the ability of Keap1 to downregulate the Nrf2 activation of ARE gene expression. 24
In the BTB domain of Keap1, the cysteine residue C151 has also been shown to be highly reactive and involved in Nrf2 regulation. 26 Modification of C151 by chemical inducers, tert-butylhydroquinone (t-BHQ) and sulforaphane, causes conformational change in Keap1 that leads to decreased interaction between Keap1 and Cul3 as well as decreased Nrf2 ubiquitination.25,27,28 Replacement of a tryptophan residue at the C151 position of Keap1 downregulates Nrf2 ubiquitination due to decreased binding affinity of Cul3 to Keap1, which in turn upregulates ARE gene expression. 28 However, serine replacement at the C151 position of Keap1 showed no significant decrease in Nrf2 ubiquitination when cells were exposed to sulforaphane or t-BHQ. 15
Reporter gene assays that monitor activation of ARE genes have been used to identify potential Nrf2 activators.29–31 Besides ARE activation, Westerink et al. developed a high-throughput Nrf2 luciferase reporter assay that identified compounds that activate the Nrf2 pathway. 32 Hirostu et al. developed a Nrf2d-LacZ reporter assay that fused the N-terminus of Nrf2 (which includes the Neh2 degron composed of the aforementioned ETGE and DLG domains) to β-galactosidase. 33 This reporter assay directly monitored Nrf2 stabilization, and hits that were identified by this assay were further confirmed using an ARE luciferase reporter assay. Another Nrf2 luciferase gene reporter assay also focused on the Neh2 domain of Nrf2 provided a real-time monitoring of Nrf2 activation. 34 Screening performed with this assay from a 2000-compound Spectrum library identified three Nrf2 activators: nordihydroguaiaretic acid, fisetin, and gedunin.
One other approach of identifying potential Nrf2 activators has been reported through a surface plasmon resonance (SPR) assay and is described below. In addition to identifying potential activators, this assay allowed direct monitoring of the disruption of Nrf2-Keap1 interaction by potential activators. In this assay, as reported by Chen et al., they immobilized a 16-mer peptide derived from the ETGE domain of Nrf2 onto a sensor chip. Then, the Kelch domain of Keap1, which had been incubated with varying concentrations of inhibitory Nrf2 peptides, was allowed to flow over the surface of the sensor chip to measure the Nrf2-Keap1 peptide and inhibitory Nrf2 peptide interaction. 35 However, this assay was not suitable for screening a large compound collection due to limited throughput.
Inoyama et al. developed a fluorescence polarization (FP) assay to identify Nrf2 activators that consisted of a fluorescein isothiocyanate-labeled 9-mer peptide that contained part of the ETGE motif of Nrf2 and the Kelch domain of Keap1. 36 Using this assay, they screened 1810 compounds of the National Cancer Institute Diversity Set II and the National Institutes of Health (NIH) Clinical Collection but failed to confirm any hits. Similarly, Hancock et al. also developed an FP assay based on the Kelch domain of Keap1 and fluorescein isothiocyanate-labeled Nrf2 7-mer peptide. 37 They screened a series of peptides based on the DLG and ETGE domains of Nrf2, which showed that shorter ETGE peptide motifs displayed decreased potencies.
A high-throughput homogeneous Nrf2-Keap1 FP assay was developed by Hu et al. to screen the NIH MLPCN library of 337,116 compounds. 38 The assay consisted of fluorescein-labeled 9-mer Nrf2 peptide and the Kelch domain of the Keap1 protein. In this screen, they identified a compound that directly disrupts Nrf2-Keap1 protein interaction.
Similarly, Marcotte et al. developed a homogeneous confocal fluorescence anisotropy assay to screen the Evotec Lead Discovery compound library of 267,551 compounds and 1911 compounds from an initial virtual screen 39 that identified compounds shown to bind the Kelch domain of Keap1 in a noncovalent manner and disrupt the Nrf2-Keap1 interaction.
Besides Nrf2-Keap1 FP assays, a high-throughput fluorescence resonance energy transfer (FRET) assay was developed by Schaap et al. to identify small-molecule inhibitors of Nrf2-Keap1 interaction. 40 This FRET assay consisted of CFP fluorophore conjugated to 16-mer Nrf2 ETGE motif peptide and a YFP fluorophore conjugated to the Kelch domain of Keap1 and was validated using unlabeled 7-mer and 16-mer Nrf2 peptides, respectively.
To our knowledge, there has not been a literature report using a high-throughput assay such as a time-resolved FRET (TR-FRET) assay to monitor the disruption of the Cul3-Keap1 complex by screening potential Nrf2 activators, although interaction between Cul3 and Keap1 has been studied by immunoprecipitation assays.11,26 Further, Cleasby et al. developed an AlphaScreen assay that explored the disruption of Cul3 from the BTB domain of Keap1 by covalent modifiers of Nrf2 tool compounds. 41 However, this assay was not utilized to screen a large compound collection.
We report here the development and optimization of two TR-FRET assays using full-length proteins, Cul3-Keap1 and Nrf2-Keap1 TR-FRET, which were used to screen and characterize potential Nrf2 activators. Both assays were shown to be sensitive, robust, and amenable for high-throughput screening (HTS). Known Nrf2 activators were found to have higher potency in the Cul3-Keap1 TR-FRET assay than in the Nrf2-Keap1 TR-FRET assay during assay development, and therefore we chose Cul3-Keap1 TR-FRET for HTS and used the Nrf2-Keap1 TR-FRET as hit qualification post-HTS. Using these two TR-FRET assays, we identified several chemical series of Nrf2 activators from a diversity screen set of approximately 2,200,000 compounds.
Materials and Methods
Materials
15d-PGJ2 (15-deoxy-Δ12, 14-prostaglandin J2) was purchased from Santa Cruz Biotechnology Inc. (Santa Cruz, CA). t-BHQ was purchased from Sigma Aldrich Inc. (St. Louis, MO), and all other Nrf2 activators were synthesized in-house at GlaxoSmithKline. Mouse anti-DYKDDDDK IgG:SureLight APC (allophycocyanin) was purchased from Columbia Biosciences (Columbia, MD). Eu-W1024 streptavidin was purchased from PerkinElmer (Waltham, MA). Bovine serum albumin, 3-[(3-cholamidopropyl)dimethylammonio]-1-propanesulfonate (CHAPS) and DL-dithiothreitol were purchased from Sigma Aldrich Inc.
Expression and Purification of Keap1 FLAG-His and FLAG-His Keap1 (Accession NM_203500)
Baculovirus (pFastbac1-FLAG-His-Keap1 and pDEST8-Keap1-FLAG-His) constructs were generated to infect Sf9 cells. After 66–72 h infection at 27 °C, these cells were harvested and lysed in lysis buffer (50 mM Tris, 200 mM NaCl, 1 mM tris(2-carboxyethyl)phosphine [TCEP], 10% glycerol, pH 8.0) by sonication. The supernatant was obtained by centrifugation at 30,000g for 30 min at 4 °C and then mixed with (batch binding) Ni-NTA Superflow beads from Qiagen (Valencia, CA) for 2 h at 4 °C. The Ni-NTA beads were packed into a XK 16 column (Pharmacia Biotech, Piscataway, NJ) and washed with lysis buffer containing 30 mM imidazole. The protein was eluted from the Ni beads by lysis buffer containing 300 mM imidazole. All the fractions from the Ni elution peak were pooled and concentrated to 6 mL using an Amicon Ultra (10 kDa cutoff) (Millipore, Billerica, MA) and then loaded onto an Hiload Superdex200 120 mL column (Pharmacia Biotech). The final product eluted as a dimeric protein. From approximately 2.5 L/50 g cells, we produced more than 40 mg of both N-terminal and C-terminal FLAG-His-tagged full-length Keap1 proteins with purity over 90%.
Expression and Purification of Biotinylated Cul3-Rbx1 and Biotinylated FlagHis Cul3-Rbx1 Protein (Accession NM_BC039598)
Two baculovirus constructs, FLAG-His-Tev-Avi-Cul3 and His-Rbx1, were generated separately and co-expressed in Sf9 cells. The cells were lysed in 5–8 volumes of lysis buffer (50 mM Tris, 300 mM NaCl, 10% glycerol, 0.5 mM TCEP, pH 7.5) by EmulsiFlex-C50 homogenizer (Avestin, Ottawa, Ontario, Canada). The lysate was clarified by centrifugation at 38,000g for 45 min at 4 °C. The supernatant fraction was incubated in batch mode with Qiagen NiNTA SF beads for 2 h at 4 °C with gentle rotation. The beads were packed into a column and loaded onto an AKTA system (GE Healthcare Life Sciences, Piscataway, NJ). The column was washed with 30 mM imidazole in lysis buffer to baseline, and protein was eluted with 200 mM imidazole in lysis buffer. The buffer of the eluted protein was exchanged on a Zeba desalting column (Thermo Scientific, Rockford, IL) to the BirA biotinylation buffer (10 mM Tris, pH 8.5, 10 mM ATP, 10 mM MgOAC, 0.5 mM biotin). For biotinylated Cul3-Rbx1 protein, Tev protease (1:50 w/w Tev to protein) and BirA (2.5 µg BirA/nmol Cul3) were added to the protein solution and incubated at 4 °C overnight. For the biotinylated FLAG-His Cul3-Rbx1 protein, only BirA (2.5 μg BirA/nmol Cul3) was added to the protein solution, and it was incubated at 4 °C overnight. Tag cleavage and protein biotinylation were confirmed by liquid chromatography–mass spectrometry (LC-MS) the next day. Both Cul3 proteins were further purified on a Superdex 200 sizing column. The yield of biotinylated full-length Cul3/Rbx1 (without N-terminal FLAG-His tag) proteins from the baculovirus co-expression was similar to that of Keap1 and was highly reproducible, yielding approximately 1 mg of protein per gram of wet weight of cell pellet.
Expression and Purification of Biotinylated Nrf2 (Accession NM_006164)
His-GST-Avi-Tev-Nrf2 protein was expressed in Sf9 cells by baculovirus infection. Cells from 5 L of culture were lysed in 1 L of lysis buffer (50 mM Tris, 150 mM NaCl, pH 8.0, plus Roche Complete Protease Inhibitor Cocktail tablets [Indianapolis, IN] in an EmulsiFlex-C50 homogenizer [Avestin, Ottawa, Ontario, Canada]). The supernatant fraction was obtained by centrifugation at 38,000g for 30 min at 4 °C. The His-GST-Avi-Nrf2 protein was first purified by Glutathione Sepharose beads (GE Healthcare Life Sciences). The His-GST tag removal and protein biotinylation procedures were the same as described for the Cul3 protein. After the Superdex 200 purification, approximately 50% pure biotinylated-Avi-Nrf2 protein was obtained in storage buffer (50 mM Tris, 200 mM NaCl, 10% glycerol, 0.5 mM TCEP, pH 8.0). The purification of Nrf2 protein encountered issues of solubility and aggregation and gave a low yield of 0.5 mg/L cell culture and low purity at approximately 50%. Due to the aggregation of Nrf2, the biotinylation of full-length Nrf2 was confirmed by streptavidin Western detection rather than the LC-MS method.
Affinity Determination of Cul3-Keap1 and Nrf2-Keap1 by TR-FRET Assay
The affinity of Cul3-Keap1 was determined by mixing 5 µL of serial-diluted Keap1 in assay buffer from a top concentration of 2 µM with 5 µL of 100 nM Cul3. Unless otherwise stated, assay buffer for all experiments consisted of 50 mM Tris-HCl, pH 8.0, 5 mM MgCl2, 100 mM NaCl, 0.005% BSA, 1 mM DTT, and 2 mM CHAPS. The reaction was allowed to incubate for 1 h at room temperature before the addition of 10 μL of detection mix. Detection mix consisted of 1 nM Eu-W1024 streptavidin and 5 µg/mL SureLight APC conjugated to anti-DYKDDDDK antibody unless stated otherwise. All plates were read on a PerkinElmer Envision plate reader at 320 nm excitation and 615 and 665 nm emissions unless stated differently. The apparent Kd value for the interaction between Cul3-Keap1 was determined in duplicated titration curves. The affinity of Nrf2-Keap1 was measured in a similar manner with the exception that the Nrf2 concentration was kept at 25 nM final.
Time Dependency of Compound and Keap1 Interaction
To perform compound time dependence in the Cul3-Keap1 assay, CDDO-Im was serially diluted by twofold in neat DMSO starting from a top concentration of 1 mM. One hundred nanoliters of serially diluted compound was stamped into a black, low-volume, 384-well plate by a Labcyte Echo 555 (Sunnyvale, CA). Five microliters of 50 nM Keap1 was added to the prestamped compound plate. The plate was allowed to incubate at varying lengths of time up to 2.5 h at 37 °C. Five microliters of 100 nM Cul3 was then added and the plate was allowed to incubate for 1 h at room temperature. Ten microliters of a detection mix was added, followed by 1 h incubation at room temperature before measurement of fluorescence on the Envision plate reader.
The compound time dependence of the Nrf2-Keap1 assay was performed in a similar manner except that (1) compound stamping was done by a Hummingbird liquid handler (Holliston, MA) since Labcyte Echo 555 was unavailable at the time of the experiment, and (2) the concentrations of Keap1 and Nrf2 were kept at 25 and 50 nM, respectively.
Temperature Dependency of Compound and Keap1 Interaction
Compound temperature dependence experiments were conducted under assay conditions similar to those described above. However, Keap1 was incubated at either room temperature or 37 °C for 2.5 h in the presence of CDDO-Im in the dose–response curve studies.
DMSO Tolerance Studies
DMSO tolerance was evaluated in both TR-FRET assays. Briefly, DMSO solutions were made up at 5× concentrations in the assay buffer. For the Cul3-Keap1 TR-FRET assay, 4 µL of 62.5 nM Keap1 was allowed to incubate with 2 µL of 5× DMSO solutions for 2.5 h at 37 °C. Incubation was followed by 4 µL of 125 nM Cul3 addition with 1 h of room temperature incubation. After incubation, 10 µL of detection mix was added to the plate. The plate was incubated at room temperature for an additional hour before being read.
Assay Validation
In order to validate the Cul3-Keap1 TR-FRET assay, we used CDDO analogs. First, 11-point dose–response curves were made from 10 mM stocks in neat DMSO by serially diluting threefold into a 384-well plate column-wise by a PerkinElmer Biomek FX (Waltham, MA). Columns 6 and 18 were skipped for negative and positive controls, respectively. These serially diluted compounds were then stamped into a black, low-volume, 384-well plate at 100 nL/well by a Labcyte Echo liquid handler. For controls, both columns 6 and 18 received 100 nL of neat DMSO instead of compound. Five microliters of 50 nM Keap1 was then added to the plate except column 18. As a low control, column 18 received 5 µL of assay buffer. The plate was then allowed to incubate for 2.5 h at 37 °C. After this, 5 µL of 100 nM Cul3 was added to the plate and the plate was allowed to incubate at room temperature for 1 h. Detection mix was then added to the plate at 10 µL/well and the plate was incubated at room temperature for another hour before being read on an Envision plate reader.
Similarly, these tool compounds were tested in the Nrf2-Keap1 TR-FRET assay with the following modifications: The reaction was initiated by adding 5 µL of Keap1 at 25 nM to the prestamped compound plate except for column 18, which received a 5 µL addition of assay buffer. The mixture was allowed to incubate for 2.5 h at 37 °C. Next, 5 µL of 50 nM Nrf2 was added to the plate, followed by incubation at 4 °C for 1.5 h. After this, the plate was allowed to warm to room temperature and 10 µL/well of detection mix was added to the plate. The plate was incubated at room temperature for 1 h and fluorescence was measured on the Envision plate reader.
HTS Conditions of Cul3-Keap1 TR-FRET Assay
To miniaturize the assay into a 1536-well format, 40 nL of each 1 mM compound was stamped into each well of a black 1536-well plate. Control wells in columns 11, 12, 35, and 36 received 40 nL of neat DMSO. To initiate the reaction, 4 µL each of 25 nM Keap1 and 50 nM Cul3 were added to the prestamped compound plate except for columns 35 and 36. Four microliters of assay buffer was added to columns 35 and 36 as negative controls. The plate was incubated for 2.5 h at room temperature, followed by the addition of 4 µL of detection mix. The plate was incubated at room temperature for 1 h before being read on a PerkinElmer Viewlux imaging plate reader at 671 and 618 nm emissions.
Cul3 TR-FRET Interference Assay
To remove false positives from the exemplars of the different potent chemotypes from HTS, the exemplars were made into 11-point dose–response curves starting from 10 mM in threefold dilutions and stamped into a black, low-volume, 384-well plate in the same way as described for assay validation in the Methods section. One hundred nanoliters of neat DMSO was dispensed into columns 6 and 18 as controls. The reaction was initiated by the addition of 10 µL of biotinylated-FLAG-His Cul3 protein at 5 nM except column 18, which received 10 µL of assay buffer. Ten microliters of detection mix was added to the plate, followed by 1 h of incubation. The fluorescence signal was measured on an Envision plate reader as described above.
NQO1 Luciferase Reporter Assay
A NAD(P)H: quinone oxidoreductase 1 (NQO1) cellular luciferase reporter assay was developed to measure potential Nrf2 activators for cellular activity through the activation of the Nrf2 pathway. Compound plates were prepared similarly as in the screen, but dose–response curves were stamped into a white, 384-well plate instead. Human embryonic kidney (HEK)-293 cells from American Type Culture Collection (Manassas, VA) in Dulbecco’s modified Eagle medium/Nutrient Mixture F-12 (DMEM/F12) (in-house medium) containing 2.5% Invitrogen heat-inactivated fetal bovine serum (Carlsbad, CA) were plated at 5000 cells in 10 µL volume/well. The plated cells contained 2.5% NQO1-Luc2 (luciferase reporter with native NQO1 gene promoter) (Gene ID 1728) BacMam virus that had been added to cells prior to plating. The cells were incubated for 24 h at 37 °C/5% CO2. Ten microliters of Promega Steady-Glo Assay System (Madison, WI) were added to wells and plates were incubated at room temperature for 20 min in the dark. The luminescence signal was measured on an Envision plate reader. An increase in luminescence signal indicates an increase in NQO1 expression via the Nrf2 activation pathway.
Data Analysis
Assay Validation
The Keap1 apparent dissociation constant (apparent Kd value) was determined by plotting the ratio of the fluorescent emission (Em665/Em615) against the Keap1 protein concentration and then fitted to the nonlinear regression one-site specific binding equation in GraphPad Prism version 5 (La Jolla, CA):

Potencies (pIC50 values) of the compounds that were screened in the TR-FRET assays were calculated by taking the ratio of the fluorescent emission (Em665/Em615) and normalizing to the ratio of the emission of the controls in column 6 (Keap1 protein plus 1% DMSO, final concentration) and column 18 (assay buffer with no Keap1 protein plus 1% DMSO, final concentration), using the following equation:
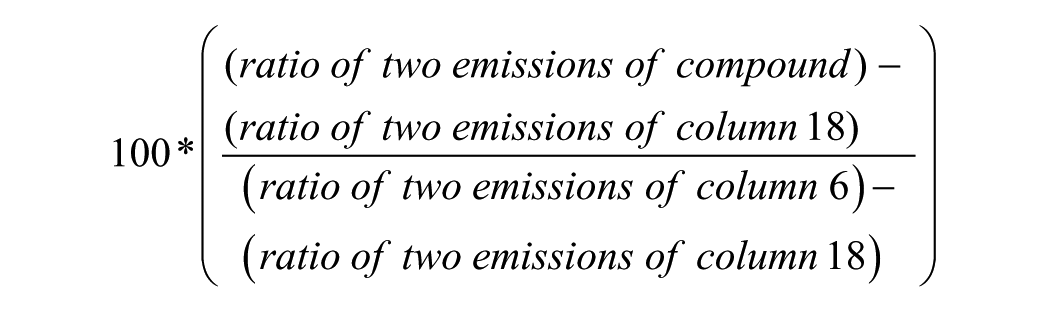
The normalized values were then used to determine the pIC50 values of the compounds by using IDBS XC50 Application Guide version 2 (Guildford, UK). The XC50 analysis used a four-parameter equation to determine the pIC50 values for the compounds. The four-parameter equation was based on the low control (column 18) or minimum (A), high control (column 6) or maximum (B), Log10XC50 (C), and slope factor (D). The four-parameter equation is y = A + [(B - A)/(1 + (10^x/10^c)^D)], where x represents log10 of the compound concentration [M].
For assay development purposes, compound pIC50 values were determined by plotting the fluorescent emission ratios against compound concentrations using GraphPad Prism nonlinear regression log (inhibitor) versus response curve fitting, either three- or four-parameter fitting:


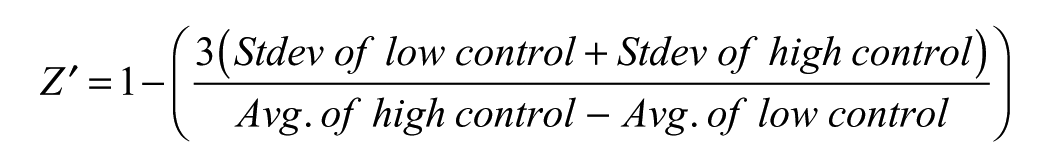
Robustness of the assay or Z′ values were determined using the ratio of the two emissions of the controls in columns 6 and 18 with the following formula:
High-Throughput Screening
For HTS, the raw data were normalized using the ratio of acceptor over donor. The responses of the compounds were normalized against high controls in columns 11 and 12 and low controls in columns 35 and 36 on the plate using the same formula as above. HTS hits were identified if compound responses were equal to or greater than the outcome of the following equation: HTS mean response + 3*(standard deviation of the HTS mean response). Data were analyzed by Abase XE (Surrey, UK).
Results
Determination of Cul3 and Keap1 Binding Affinity
While the concentration of Cul3 was maintained at 50 nM, the Keap1 concentration was varied for the determination of an apparent Kd value. As shown in Figure 1A , the titration showed a typical binding isotherm and an apparent Kd value of 4.7 nM. To maintain a robust assay and potentially reduce promiscuous hits from the HTS collection, a concentration of the Keap1 that was above the apparent Kd value was chosen for the assay.
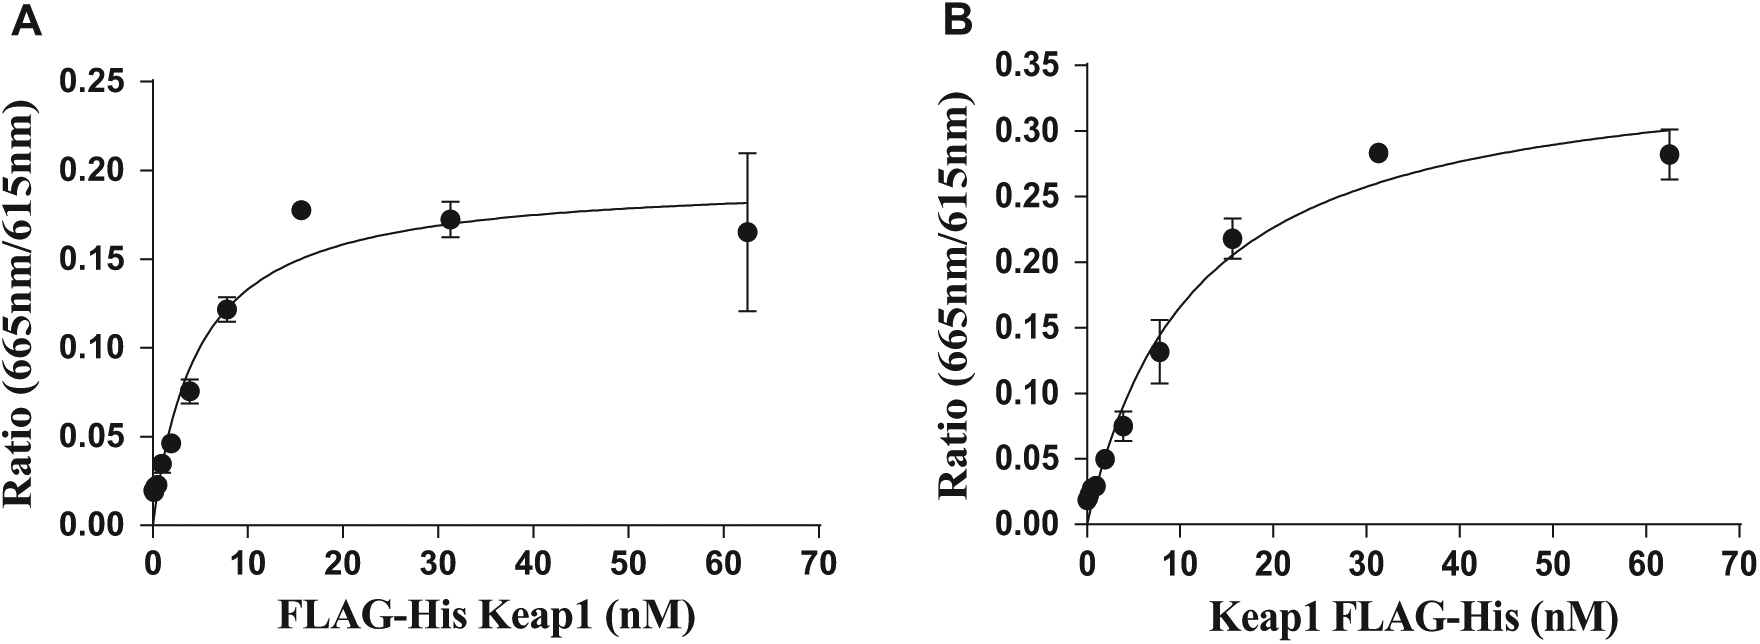
The apparent Kd values for Keap1 proteins in both TR-FRET assays were determined by titrating Keap1 proteins in the presence of either 50 nM Cul3 or 25 nM Nrf2. (
Determination of Nrf2 and Keap1 Affinity
The assay signal began to decrease when the Keap1 concentration was greater than 12.5 nM, which was possibly due to saturation of the assay signal at the set APC-conjugated anti-DYKDDDDK antibody concentration. Also, the assay signal plateaued at Nrf2 protein concentrations greater than 25 nM. Considering the data above, the assay conditions were set at 12.5 nM Keap1 and 25 nM Nrf2 concentrations. The affinity of Nrf2-Keap1 was measured in duplicate by titrating Keap1 in the presence of 25 nM Nrf2. The apparent Kd was determined to be 11.4 nM ( Fig. 1B ), which is in agreement with literature values. 27
Time Dependency
To validate the TR-FRET assays, we used CDDO-Im, a triterpenoid and known Nrf2 activator, as a tool compound.42,43 As shown in Figure 2 , this compound showed dose-dependent inhibition of the binding complex of Cul3-Keap1 ( Fig. 2A ) or Nrf2-Keap1 ( Fig. 2B ). Next, we investigated the time dependence of the inhibition. Figure 2A showed that the percent inhibition of CDDO-Im does not change within 2 h of incubation in the Cul3-Keap1 complex. However, in the Nrf2-Keap1 complex, longer incubation in the presence of CDDO-Im resulted in significant increases of percent inhibition ( Fig. 2B ). The pIC50 of CDDO-Im increased with incubation time up to 2.5 h in both Cul3-Keap1 and Nrf2-Keap1 assays.
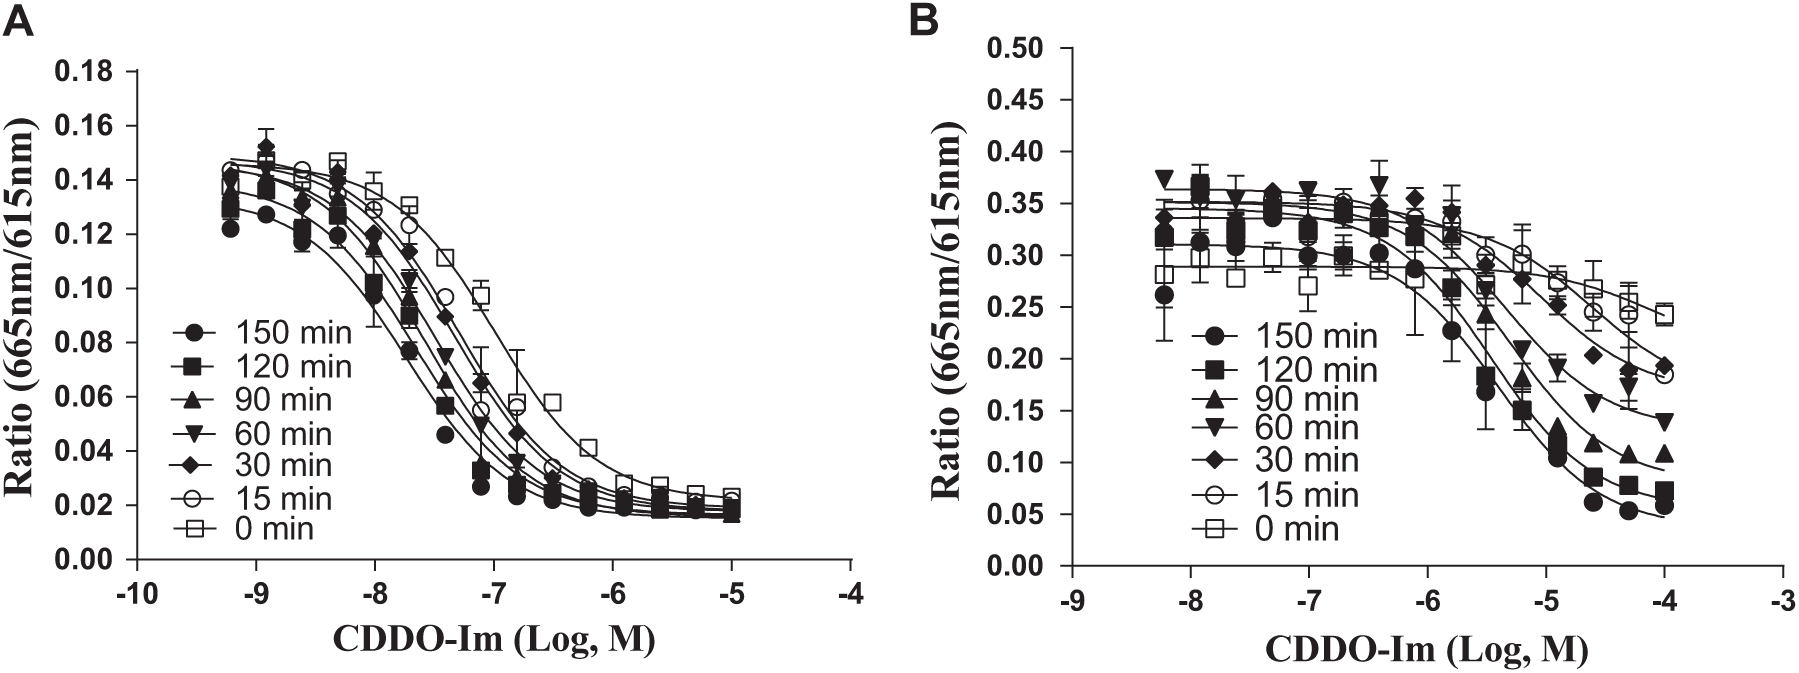
Keap1 protein was preincubated at various time points up to 2.5 h with CDDO-Im compound dose curves at 37 °C prior to Cul3 or Nrf2 protein additions. (
Temperature Dependency
Temperature could play a role in the conformational change of Keap1 and therefore affects binding to either the Cul3 or Nrf2 proteins in the TR-FRET assays, which in turn could affect the potency of compounds. For the Cul3-Keap1 TR-FRET assay, the Keap1 protein preincubated at either room temperature or 37 °C did not affect the potency of CDDO-Im ( Fig. 3A ). In the Nrf2-Keap1 TR-FRET assay, running the assay at room temperature for 2.5 h elicited no response in the CDDO-Im dose–response curve ( Fig. 3B ). In running the assay at 37 °C for 2.5 h, however, CDDO-Im disrupted the Nrf2-Keap1 complex in a dose-dependent manner.
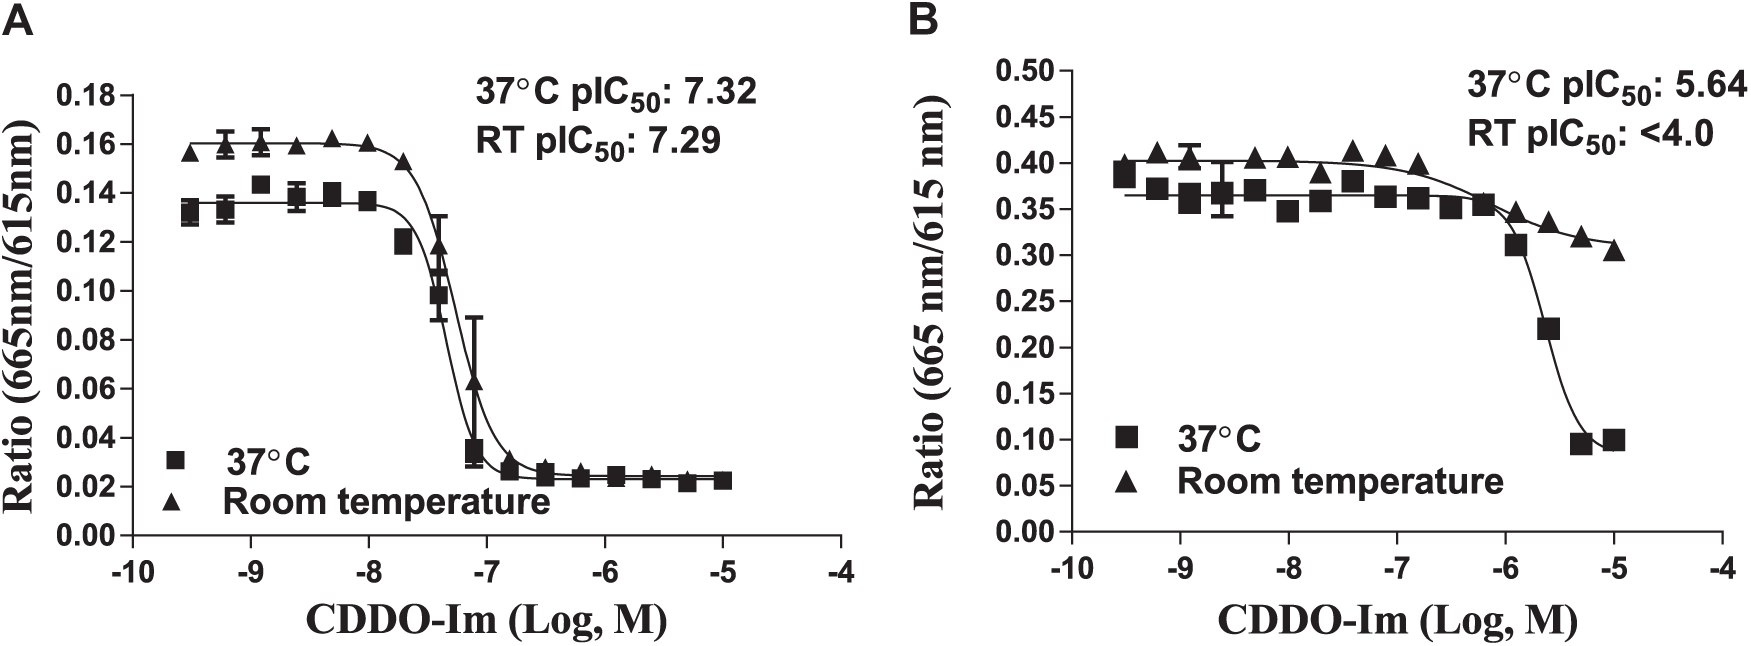
Keap1 proteins were preincubated in the presence of CDDO-Im compound dose curves for 2.5 h at 37 °C or room temperature in both TR-FRET assays. (
DMSO Tolerance
DMSO tolerance was assessed in both the Cul3-Keap1 and Nrf2-Keap1 TR-FRET assays. Both assays showed that the FRET assay signal dropped significantly above 2% DMSO. However, the assay signal was minimally affected at 1% DMSO. Therefore, the DMSO concentration was maintained at or below 1% (final concentration) in the HTS assay and subsequent profiling assays.
Sensitivity and Dynamic Range of the Two TR-FRET Assays
CDDO-Im showed good inhibition in both TR-FRET assays. To evaluate whether the assays can potentially pick up weaker compounds than CDDO-Im, we tested a list of known Nrf2 activators in both assays. As shown in Figure 4 , N-iodoacetyl-N-biotinylhexylenediamine (IAB), a reactive sulfhydryl compound, showed complete inhibition in both TR-FRET assays at concentrations as low as 100 nM. 15-Deoxy-∆12,14-prostaglandin J2 (15d-PGJ2) and bis(2-hydroxybenzylidene)-acetone (2-HBA) compounds were active in both TR-FRET assays, but approximately 1 log unit less potent in the Nrf2-Keap1 TR-FRET than the Cul3-Keap1 TR-FRET. It was also noted that sulforaphane and t-BHQ showed very weak inhibition in the assays. Sulforaphane and its analogs were shown to have weak binding to Keap1 in several biochemical assays (internal data, manuscript in preparation). Although sulforaphane and t-BHQ were reported to be active in cell-based assays,15,33,34 no biochemical data are available. Positive and negative controls (see Materials and Methods) were included on each assay plate and the Z′ values in both assays were above 0.7.
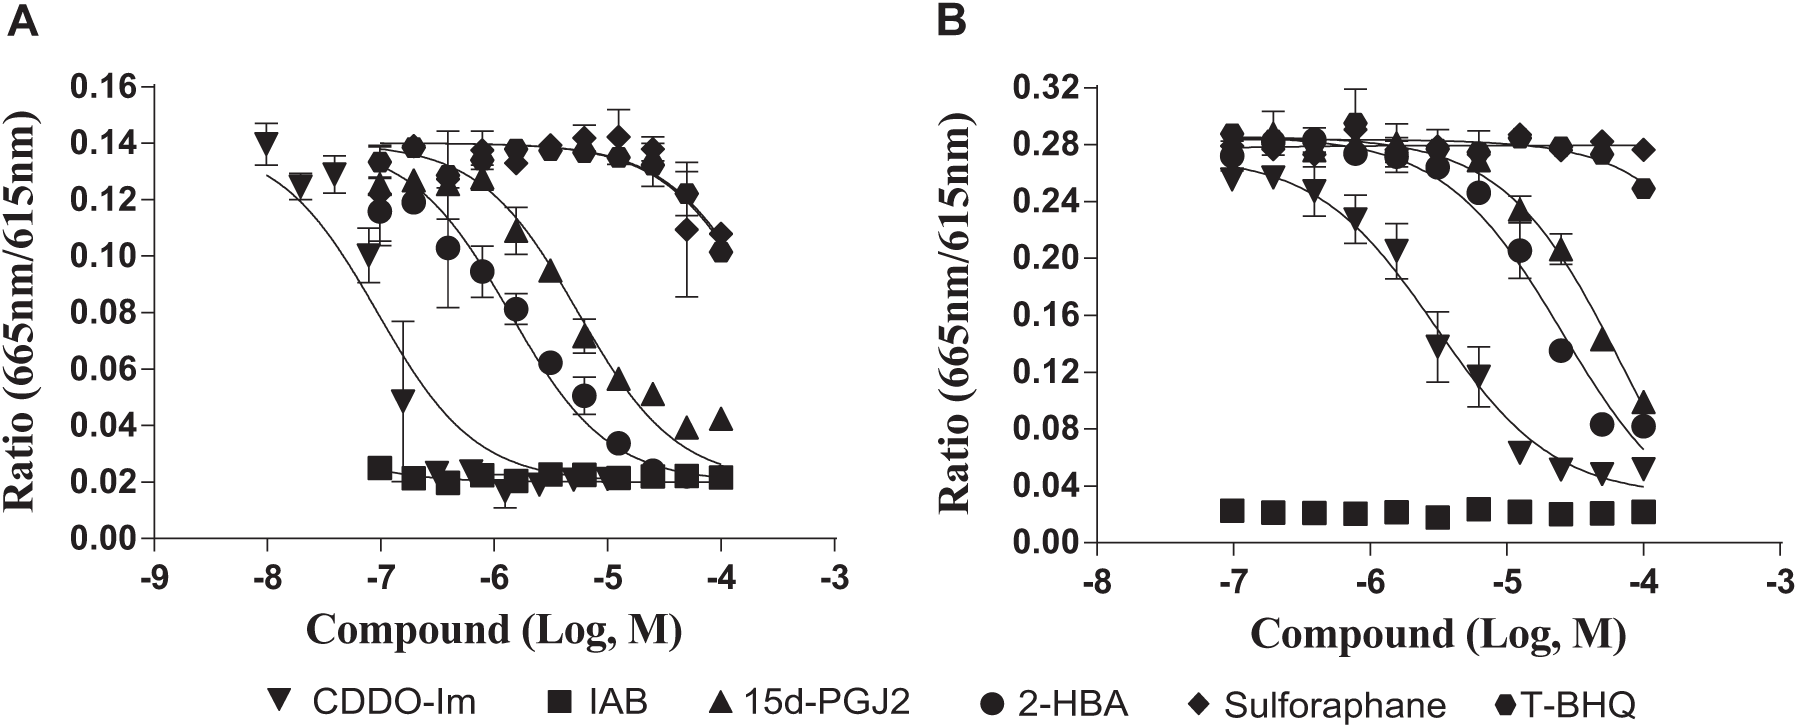
Literature compounds and CDDO-Im dose-response curves in (
High-Throughput Screening
The Cul3-Keap1 TR-FRET assay was initially configured with a preincubation of the Keap1 protein with compound for 2.5 h at 37 °C, followed by the addition of Cul3 protein for 1 h at room temperature. One issue that became apparent upon running the validation set of approximately 10,000 compounds under these conditions was that the hit rate for the assay was unusually high at 4.9% using a statistical cutoff of 32% (mean of the sample population plus three standard deviations). After a full-diversity HTS campaign, a few compounds that typically pass through the first tier of critical path assays can be viewed as the true on-target hit rate and may typically range from 0.01% to 0.1%. HTS campaigns with hit rates above 1% tend to result in a high percentage of compounds with off-target effects. The long 2.5 h preincubation of the Keap1 protein with the test compound dramatically increased the statistical cutoff with little effect on the hit rate. Analysis of the raw data showed that the donor signal in the plate decreased with the preincubation of Keap1 with compound. In addition, plate patterns were more prevalent in plates with 2.5 h preincubations at 37 °C than at room temperature, with an apparent edge effect at 37 °C. This might be caused by evaporation of the liquid from the wells on the edge of the plate due to the long preincubation at 37 °C in a 1536-well plate, or uneven heating and/or cooling across some plates.
Using the validation set, Cul3 and Keap1 proteins were mixed together before being added to the plate of compounds instead of preincubating Keap1 alone. Then the plate was incubated at either room temperature or 37 °C (in a humidified chamber) for 2.5 h with 1 h room temperature incubation with detection reagents. Running the validation set with a 2.5 h room temperature incubation with both proteins and compound produced a hit rate of 2.19% at a statistical cutoff of 12.84%, whereas incubating both proteins and compound together at 37 °C for 2.5 h produced a hit rate of 2.77% at a statistical cutoff of 14.96%. A closer look at the data revealed an edge effect at 37 °C. Also, the robust actives from each incubation condition were different. Room temperature incubation appeared to be a more robust high-throughput screen as no edge effect was observed and the robust hit rate was lower. To investigate if the potency of the compounds changes under different assay conditions in order to identify an optimal HTS condition, compounds from different chemical series were tested under the following assay conditions: (1) the original assay condition, that is, a 2.5 h preincubation of Keap1 alone with compound screen at 37 °C; (2) Cul3 and Keap1 incubated together in the presence of compound for 2.5 h at 37 °C; and (3) Cul3 and Keap1 incubated together with compound for 2.5 h at room temperature.
The results are as follows: several chemical series showed lower potencies when assayed under assay condition 3, but higher potencies under the original condition, which could be attributed to the Keap1 protein being incubated with twice the amount of compound and DMSO for 2.5 h at 37 °C before the addition of the Cul3 protein. Although the potencies were lower for these compounds under assay condition 3, the percent inhibition at 10 µM (final assay screening concentration of each compound) was still above the expected statistical cutoff that was set for HTS under this condition, and thus these compounds would not have been missed.
To further test assay performance under the newly configured HTS condition (assay condition 3), Cul3 and Keap1 proteins were mixed together and allowed to incubate at room temperature for 0, 15, 30, or 60 min before adding to the compound plate for the 2.5 h incubation. No changes in the potencies of the tool compounds or assay quality were observed when the proteins were premixed together for up to 1 h prior to starting the assay. This indicated that HTS could be set up using a mixture of Cul3 and Keap1 that would be stable throughout the entire run and the assay performance would be the same from the first plate to the last.
Approximately 2.2 million compounds were screened under the HTS condition at 10 µM in the Cul3-Keap1 HTS TR-FRET assay. At a statistical cutoff of 12.3%, the hit rate was 1.53% and the average robust mean Z′ was 0.85. By applying filters such as increasing the cutoff to 20% and removing autofluorescent compounds and quenchers that reduce or increase the donor signal, we reduced the number of compounds for confirmation in duplicate to 13,200. Confirmation statistics indicated that 8886 compounds were indeed true actives. Chemical clustering and activity-weighted diversity selection were used to pare down the list to 4359 compounds for pIC50 determination, in duplicate. Of these, 1869 compounds had pIC50 values >5.0 in at least one of the two repeats. Wherever two pIC50 values are discrepant, we took the more potent value, rather than taking an average, so as not to miss potentially active compounds.
One hundred and twenty exemplars from 21 different structural classes that represent the 1869 hits were profiled in several secondary assays, including the Cul3-Keap1 TR-FRET assay, using both the HTS and profiling assay conditions and the Nrf2-Keap1 TR-FRET and Cul3 TR-FRET interference assays. The potency of hits was higher in the Cul3-Keap1 TR-FRET profiling assay than in the HTS assay, possibly due to the preincubation of Keap1 and compounds at 37 °C for 2.5 h.
The Cul3 TR-FRET interference assay consisted of a Cul3 protein that was biotinylated and contained a FLAG-His epitope tag, which would allow for a FRET signal to be determined with detection reagents (Eu-streptavidin and APC-conjugated anti-DYKDDDDK antibody). When binding occurs between biotin-FLAG-His Cul3 protein and detection reagents, there will be an energy transfer from Eu (donor) to APC (acceptor), which emits at 665 nm. If potential Nrf2 activators show inhibition of the FRET signal in this interference assay, then these compounds are considered nonspecific hits and are no longer of interest. In all, the Cul3 TR-FRET interference assay identified 10 compounds as interference compounds from the 120 exemplars and therefore they were removed from the list. Compound
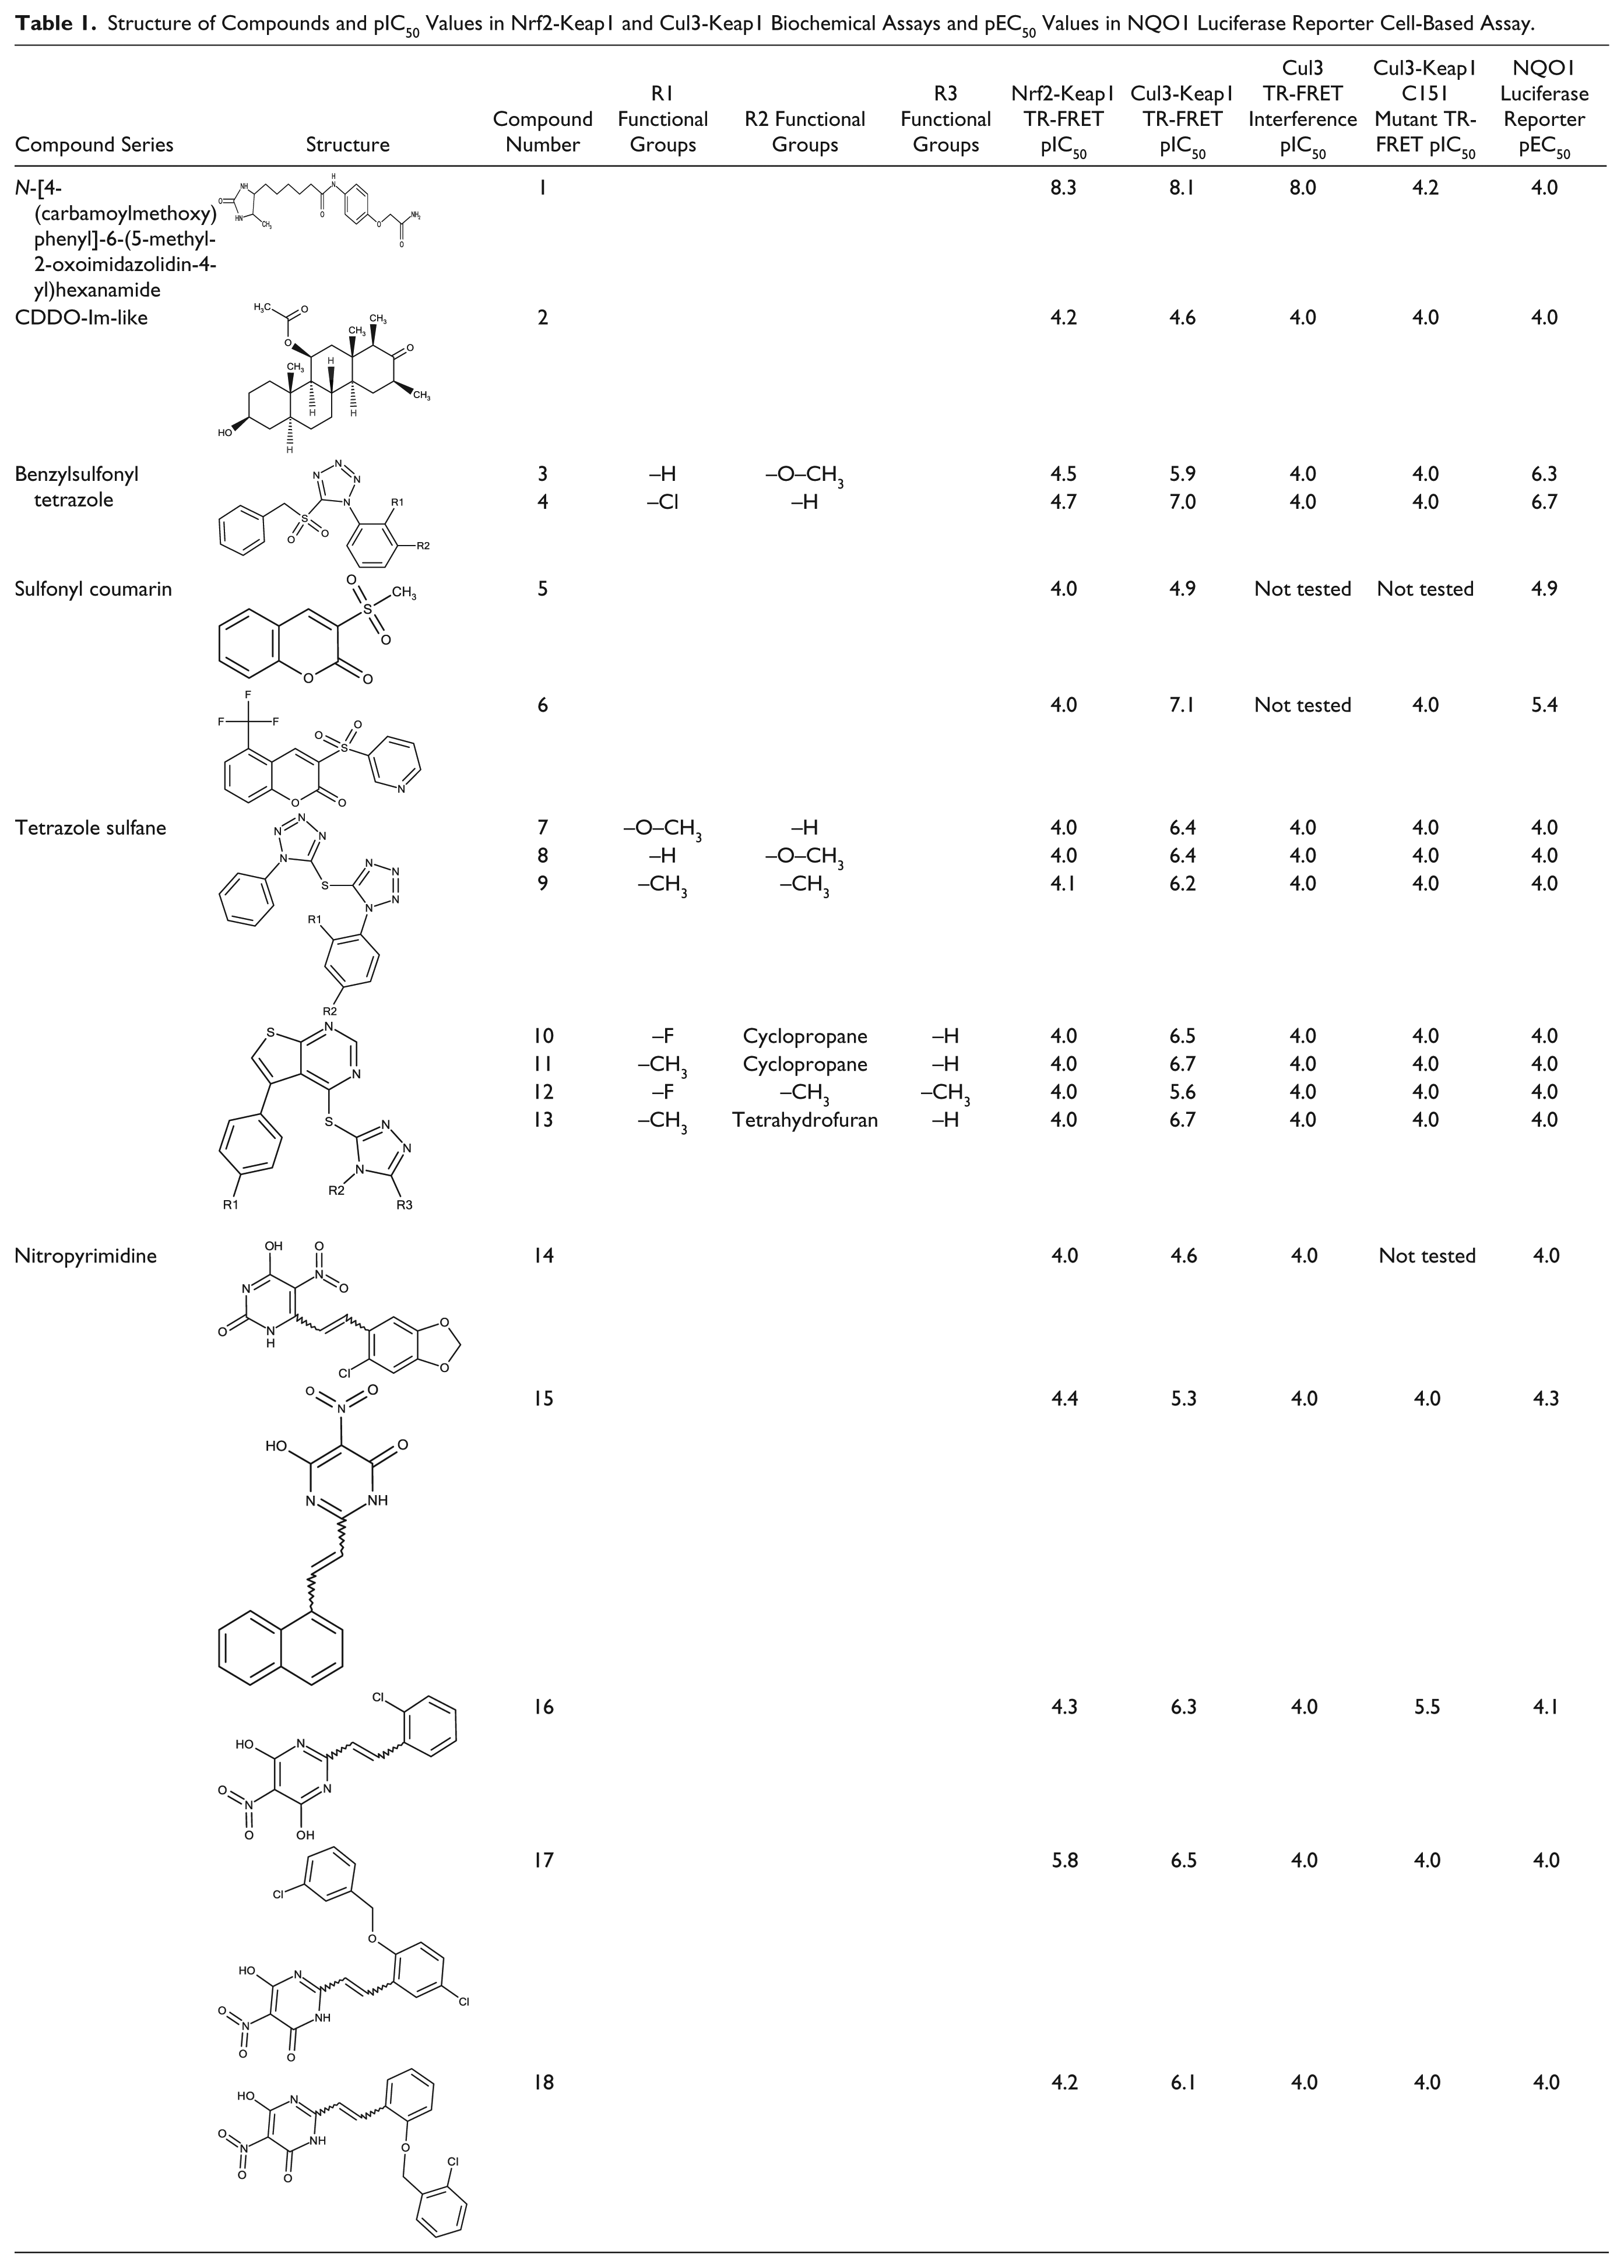
Structure of Compounds and pIC50 Values in Nrf2-Keap1 and Cul3-Keap1 Biochemical Assays and pEC50 Values in NQO1 Luciferase Reporter Cell-Based Assay.
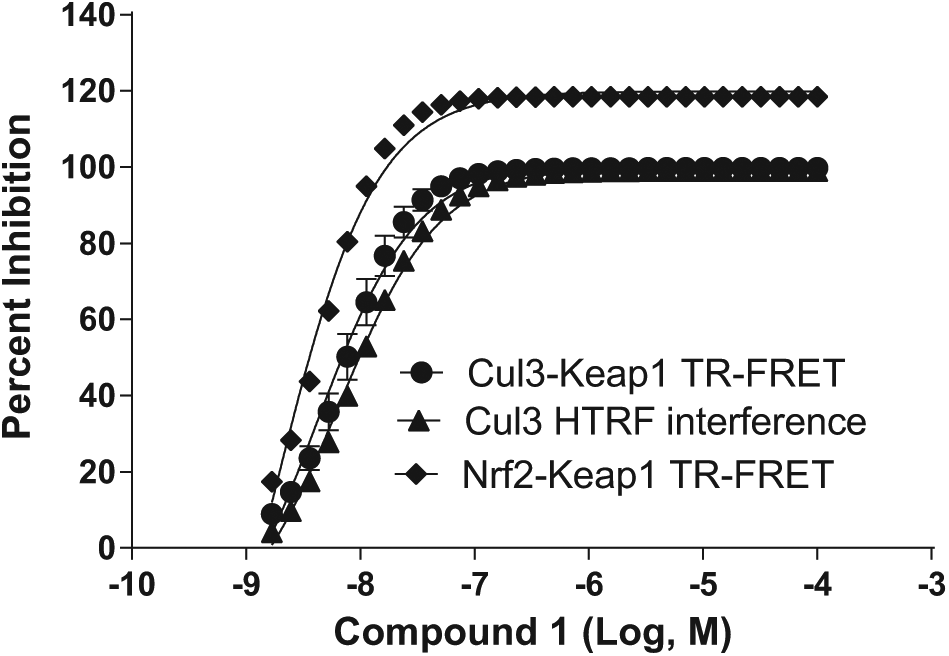
Cul3 TR-FRET interference assay was used to screen and detect those potential Nrf2 activators that could disrupt the FRET signal and produce false positives within the Cul3-Keap1 and Nrf2-Keap1 TR-FRET assays. One example of an interfering compound was compound
Discussion
One potential mechanism of the activation of cytoprotective genes occurs through the regulation of the transcription factor Nrf2. Nrf2 is regulated by the Keap1 protein, which acts as an adaptor for the Cul3-E3 ligase ubiquitination complex and ubiquitinates Nrf2 for degradation.11,14 In the presence of electrophiles, cysteine residues on the Keap1 protein become modified and induce a conformational change that disrupts the Keap1-Nrf2-Cul3 complex and downregulates ubiquitination and proteosomal degradation of Nrf2. 14 Nrf2 then translocates into the nucleus, where it heterodimerizes with small Maf proteins and activates gene transcription through the ARE.16,17
The varying potency of compounds in Nrf2-Keap1 and Cul3-Keap1 assays could potentially be explained through the following hypothesis. For example, CDDO-Im showed significant activity in the Cul3-Keap1 TR-FRET assay, presumably through modification of Cys151. The fact that it also showed activity in the Nrf2-Keap1 assay, albeit weaker than in the Cul3-Keap1 assay, implied that CDDO-Im could have induced Keap1 conformational change upon Cys151 modification and subsequently disrupted the Nrf2-Keap1 interaction via the Neh domain. The time- and temperature-dependent nature of CDDO-Im showed in the Nrf2-Keap1 assay could support this hypothesis (
As mentioned above, the DLG and ETGE domains of Nrf2 interact with the Kelch domain of Keap1. DLG is considered the low-affinity domain and ETGE is the high-affinity domain,21,22 leading to the proposed hinge and latch mechanisms.19,20 Upon conformational change of the Keap1 protein upon binding to an electrophile, the DLG domain is released, whereas the ETGE domain remains attached to the Kelch domain of the Keap1 protein. In the Nrf2-Keap1 TR-FRET assay, CDDO-Im showed minimal inhibition at room temperature, but the inhibition was more pronounced at 37 °C. The length of incubation time could also have played a role in the compound’s potency. The fact that longer incubation time at 37 °C showed increased inhibition of CDDO-Im could be attributed to the conformational change in the Keap1 protein imposed by CDDO-Im, which influences the detachment of the DLG domain. This hypothesis could be supported by the results from time- and temperature-dependent experiments (
The Cul3 protein binds to the BTB domain of the Keap1 protein and the modification of the C151 residue in the BTB domain leads to disassociation of Keap1 from Cul3. 15 In the Cul3-Keap1 TR-FRET assay, the potency of CDDO-Im was not affected by temperature change, but the potency of CDDO-Im did increase with longer incubation time. Presumably, CDDO-Im modifies the C151 residue of the Keap1 protein and causes a conformational change of Keap1. The conformational change of Keap1 is in close proximity to the binding site of Cul3, which might explain these observations. Experimental evidence by Cleasby et al., in which CDDO-Me forms adduction of the C151 within the BTB of the Keap1 protein, 41 and Ichikawa et al., in which dihydro-CDDO-trifluoroethyl amide modifies the C151 of the BTB domain and causes a conformational change that inhibits Keap1-Cul3-Rbx1 E3 ligase binding, 44 supports our findings.
From the point of interrupting the Cul3-Keap1-Nrf2 complex, one can imagine that either the Cul3-Keap1 assay or Nrf2-Keap1 assay can be used for an HTS campaign. However, the assay choice might favor compounds displaying different mechanisms as different domains of Keap1 make contact with Cul3 and Nrf2. Since the Keap1 protein used in the assays is full length, there is a possibility to identify potential allosteric modulators regardless of which assay is chosen. Our intent was to adopt a robust, potent, and validated assay with slight bias for compounds disrupting the BTB domain of Keap1 due to the fact that CDDO-Im is known to modify Cys151. To this end, although we have developed, characterized, and optimized both assays amenable for HTS, we chose the Cul3-Keap1 TR-FRET assay for HTS. In addition, we modified the profiling assay conditions of the Cul3-Keap1 TR-FRET assay to remove a preincubation step of compound-Keap1 at 37 °C to make it more robust and logistically practical.
The HTS campaign using the Cul3-Keap1 TR-FRET assay successfully identified 13,200 hits out of approximately 2.2 million compounds. Through confirmation assays and the hit triage process, the number of hits were pared down to 1869. Exemplars of the different structural series of these 1869 compounds were further tested in our secondary assays. Exemplars showed higher potencies when preincubated with Keap1 at 37 °C prior to Cul3 addition in the Cul3-Keap1 TR-FRET assay compared with HTS assay conditions. In the Nrf2-Keap1 TR-FRET assay, these exemplars showed lower potencies, which might be explained by the proposed hinge and latch mechanism instead of direct disruption of the protein complex.
The Cul3 TR-FRET interference assay was employed to remove false positives from HTS due to interfering with the TR-FRET signal of the assay rather than disrupting the protein complex. This assay identified 10 compounds showing similar pIC50 values in the Cul3-Keap1 TR-FRET HTS assay and Nrf2-Keap1 TR-FRET assay. The dose–response curves in three assays of one such compound (compound
In examining the chemical structure of the 120 exemplars that had pIC50 values >5.0 from HTS, we noticed that some compounds display similar structure to CDDO-Im, a tool compound that exists in GSK compound collection. For example, compound
The sulfonyl series, such as benzylsulfonyl tetrazoles, showed high activity in the Cul3-Keap1 TR-FRET assay but modest activity in the Nrf2-Keap1 TR-FRET assay (
Table 1
, compounds
Another set of sulfonyl-based compounds identified by HTS was the coumarin series. The sulfonyl coumarins showed similar potency trends to the benzylsulfonyl tetrazoles in the above two assays. Compound
The activity of compound
In addition, the Cul3-Keap1 HTS TR-FRET assay identified sulfane-containing compounds (
Table 1
, compounds
Lastly, the nitropyrimidine compound series identified by HTS contained a nitro group that could serve as a contact point with the C151 residue of the Keap1 protein. The nitropyrimidine compound series was similar to the other chemical series where lower compound potencies were observed in the Nrf2-Keap1 TR-FRET assay compared with the Cul3-Keap1 TR-FRET assay. In the nitropyrimidine compound series, substitutions off the butene linker from the pyrimidine affected the compound potencies in the Cul3-Keap1 TR-FRET assay (
Table 1
, compounds 14–18). For example, the addition of 5-chloro-2H-1,3-benzodioxole group off the butene linker on the 2′ position of the nitropyrimidine ring decreased the compound potency to a pIC50 of 4.6 (
Table 1
, compound
To determine if these compound series are indeed interacting with the C151 residue of the Keap1 protein, the majority of each series were tested in a Cul3-Keap1 TR-FRET assay that consisted of a mutated Keap1 protein. In this assay, the highly active C151 residue of Keap1 was mutated to a serine residue. Although the mutated Keap1 protein would still be able to bind to Cul3, these compounds would not have the ability to bind to Keap1 due to the absence of the C151. As predicted, these compound series were inactive in this assay, which indicates that the compounds were targeting the C151 residue of Keap1 (
Table 1
). Only compound
In conclusion, two Keap1 TR-FRET assays were developed and optimized and both were amenable for HTS. Although both assays were set up in a similar fashion, temperature and incubation time as outlined in the experiments affected the compound potency in the Nrf2-Keap1 assay. In the Cul3-Keap1 assay, compounds showed increased potency without the time and temperature dependency under the experimental conditions. For HTS, the Cul3-Keap1 assay was chosen due to the fact that tool compounds showed higher potencies in the assay during assay development. Hits from HTS were characterized in both Nrf2-Keap1 and Cul3-Keap1 assays where greater potencies were observed in the Cul3-Keap1 assay than in the Nrf2-Keap1 assay. In addition, both Keap1 TR-FRET assays were useful in identifying tool compounds that could be used to elucidate the mechanism of binding of the Keap1-Nrf2-Cul3 complex.
Footnotes
Acknowledgements
We would like to thank Yolanda Sanchez, James Callahan, and Jeffrey Kerns from the Stress and Repair Discovery Performance Unit for all their help and support.
Author’s Note
Hu Li is currently affiliated with Preclinical Biology, Shanghai Miracogen Inc., Pudong District, Shanghai, China.
Declaration of Conflicting Interests
The authors disclosed the following potential conflicts of interest with respect to the research, authorship, and/or publication of this article: All authors were employed by GlaxoSmithKline at the time of the work on the article and their research and authorship of this article was completed within the scope of this employment.
Funding
The authors received no financial support for the research, authorship, and/or publication of this article.