
Abstract
The Myc oncogene is overexpressed in many cancers, yet targeting it for cancer therapy has remained elusive. One strategy for inhibition of Myc expression is through stabilization of the G-quadruplex (G4), a G-rich DNA secondary structure found within the Myc promoter; stabilization of G4s has been shown to halt transcription of downstream gene products. Here we used the Automated Ligand Identification System (ALIS), an affinity selection–mass spectrometry method, to identify compounds that bind to the Myc G4 out of a pool of compounds that had previously been shown to inhibit Myc expression in a reporter screen. Using an ALIS-based screen, we identified hits that bound to the Myc G4, a small subset of which bound preferentially relative to G4s from the promoters of five other genes. To determine functionality and specificity of the Myc G4-binding compounds in cell-based assays, we compared inhibition of Myc expression in cells with and without Myc G4 regulation. Several compounds inhibited Myc expression only in the Myc G4-containing line, and one compound was verified to function through Myc G4 binding. Our study demonstrates that ALIS can be used to identify selective nucleic acid-binding compounds from phenotypic screen hits, increasing the pool of drug targets beyond proteins.
Keywords
Introduction
Myc is a transcription factor that is elevated in many cancers and drives oncogenesis through changes in cell proliferation, metabolism, and immune evasion. However, success at targeting Myc activity with small molecules has been limited. 1 A recent strategy has attempted to inhibit expression of Myc rather than its activity by stabilizing the G-quadruplex (G4), a DNA secondary structure found within the Myc promoter.2–4 G4s are G-rich DNA sequences found in promoter regions that are thought to inhibit transcription when stabilized in their folded forms. 5 Likened to “DNA knots,” 6 these structures are dynamically regulated during the cell cycle and stall transcription by blocking the advancement of polymerases and/or preventing DNA-binding complexes necessary for transcription.3,5,7,8 G4s can also function as molecular switches, by regulating the recruitment and balance of transcription factors that determine gene expression. 9 They also likely have other gene regulatory roles, such as an influence on the occurrence of chromosomal breakpoints, which may occur especially in the absence of resolving helicases.6,10 G4s not only are located in promoter regions but also are prevalent throughout the genome, with experimental and computational estimates of ~10,000–700,000 such structures.11–15 Nevertheless, sequence and folding differences among individual G4s suggest that it may be possible to target them with some degree of specificity. 4
The Myc G4 is a 27 bp sequence found in the nuclease hypersensitive element (NHE) III(1) region upstream of the Myc promoter, and is one of the most well-studied promoter G4s, with early reports showing its stabilization using a small molecule leading to inhibition of Myc expression in cells. 16 The Myc G4 is thought to form following torsional stress leading to unwinding of single-stranded, G-rich DNA, and some of the proteins that regulate Myc transcription via G4 binding or unwinding have been described.9,17 Several classes of Myc G4-stabilizing compounds have also since been identified, with some being shown to inhibit Myc expression in cancer cell lines.18–26 These compounds have varying degrees of specificity and a Myc G4-modulating drug has yet to be developed,15,27 pointing to a continued need to identify new chemical scaffolds that exhibit potent and selective Myc G4 stabilization.
In this paper, we describe an approach for the identification of Myc G4-binding small molecules using the Automated Ligand Identification System (ALIS), an affinity selection–mass spectrometry method that has been previously used to identify small-molecule protein targets.28–30 We recently showed that ALIS could also be used to identify nucleic acid targets, in particular the RNA riboswitch. 31 Nucleic acids have emerged as potentially important drug targets, and there is a need for methods that can identify these targets for phenotypic screen hits that function through an unknown mechanism. G4s represent one such target, and because of the many G4s found throughout the genome, it is necessary to be able to robustly distinguish binding among G4s from promoters of different genes. 2 Here we tested whether ALIS could be used to distinguish between folded and unfolded G4 sequences as well as between folded G4s from several cancer-related genes. We then asked whether ALIS could help us to identify potential Myc G4-binding molecules from a set of ~50,000 compounds that had previously shown activity in a phenotypic screen for inhibitors of Myc expression (Myc promoter screen), with the hypothesis that a subset of these molecules might exert their effects on Myc expression through Myc G4 binding. To address this question, we performed a high-throughput ALIS screen for Myc G4 binders using the set of compounds identified in the Myc promoter screen and then characterized the ALIS binding hits in cellular assays to confirm functional inhibition of Myc expression.
Materials and Methods
Preparation of G4s
All DNA constructs for the six G4s were synthesized by Integrated DNA Technologies, Inc. (Coralville, IA) and purified using a standard desalting method. Sequence information for each G4 is listed in Supplemental Table S1 . Prior to ALIS screening, each G4 was prepared at 10 µM in annealing buffer (10 mM Tris buffer, pH 7.5, and 100 mM KCl) and annealed by heating to 95 °C for 5 min and then cooling to 25 °C at 3 °C/min in a Life Eco thermocycler (BIOER; Hangzhou, China) according to previously published methods. 19 For confirmation of G4 folding, circular dichroism (CD) spectra were recorded on a Jasco (Easton, MD) J-815 CD spectrophotometer at 25 °C using a previously described method. 32 All measurements were carried out in a quartz cuvette with a 1.0 mm path length. A total of 50 µM Myc G4 in 10 mM Tris-HCl, pH 7.5, was heated to 95 °C for 5 min in the presence or absence of 100 mM KCl. Samples were cooled to room temperature (RT) prior to CD analysis. Each spectrum represents the average of three measurements.
ALIS Experiments
ALIS Configuration
The ALIS configuration used in these studies has been previously described28,29 (also see Supplemental References). In brief, the ALIS platform consists of a 2D liquid chromatography–mass spectrometry system. First, size-exclusion chromatography (SEC) (column dimensions: 2.1 mm ID × 50 mm length, prepared with proprietary media) was performed at 4 °C using 700 mM ammonium acetate (NH4OAc) running buffer at pH 8.0. An isocratic pump (Agilent, Santa Clara, CA, G1310A) fitted with an online degasser (Agilent, G1322A), was used for eluent delivery at 300 µL/min for a ~20 s chromatography run. Then, a UV detector (Agilent, G1314A, with a G1313 microflow cell) was used to analyze the SEC eluent for RNA–ligand complexes at 230 nm, and a valve system directed the complex to a reverse-phase chromatography (RPC) column (Higgins Analytical, Mountain View, CA, Targa-C18; column dimensions: 0.5 mm ID × 50 mm length, 5 μm packing), allowing for direct coupling of the SEC and RPC separations. Ligands were dissociated from the complex (low pH, 40 °C column temperature) and eluted into the mass spectrometer using a gradient of 0%–90% acetonitrile in water (0.2% formic acid) over 2.5 min using a capillary binary pump (Agilent, G1376A) for eluent delivery at 20 µL/min. A mass spectrometer (Thermo Fisher Scientific, Waltham, MA, Exactive Orbitrap) was utilized for detection, providing high resolution (100,000 resolving power) and high-accuracy m/z detection (mass error <5 ppm without internal calibration) and allowing for exact mass and formula confirmation for the previously bound compounds.
Direct Ligand-Binding Studies of Control Compounds to G4s Using ALIS
Each G4 was diluted to 10 µM in annealing buffer as indicated above. Compound solutions of 400 µM were prepared in DMSO and then diluted to 20 µM in the above annealing buffer. Each G4 DNA (5 µL) was combined with a control compound dilution (5 µL) for a 10 µL experimental sample containing 5 µM G4 DNA and 10 µM ligand. The prepared samples were annealed by heating to 95 °C for 5 min and then cooling to 25 °C at 3 °C/min in a Life Eco thermocycler (BIOER). Samples were run in ALIS in duplicate with an injection volume of 2.0 µL/injection.
High-Throughput Mixture-Based ALIS Screening against Large Small-Molecule Libraries
Each DNA G4 was screened against the Myc Promoter Phenotypic Hit Collection of ~50,000 small molecules that were active in the phenotypic screen (~11,000) and structural analogs (~39,000). Compounds were pooled into mixtures of 500 compounds at a concentration of 20 μM/compound in DMSO and then diluted to 1 μM/compound in the above annealing buffer. The compound mixtures (1 µL) were combined with annealed G4 DNA (1 µL of 10 μM) and incubated at RT for 30 min. Two rounds of mixture-based samples were run in ALIS with an injection volume of 2.0 µL/injection. Invertase was used to measure nonspecific binding. Compounds yielding reproducible binding in both rounds and not producing signal in the invertase counterscreen were considered ALIS hits. Binding of hits was confirmed in ALIS as single, pure compounds.
ALIS Ligand Titration Method for Binding Affinities
Binding affinities were determined using the ALIS ligand titration method as follows: 29 each of the specified Myc G4 DNA species (5 μM; in 10 mM Tris, pH 7.5, 100 mM KCl to induce folding) and increasing concentrations (0.05–50 μM) of the test ligands were mixed, annealed, and then analyzed by ALIS. The uncalibrated MS data for each of the bound ligands were then plotted versus the total ligand concentration to yield a binding curve and a Kd value by nonlinear regression analysis. 28 Additional details on this method can be found in the Supplemental References.
Cell Culture
L363, CA46, and Raji cells were obtained from the American Type Culture Collection (ATCC, Manassas, VA) and cultured in RPMI containing 10% fetal bovine serum (FBS) and 1% penicillin-streptomycin (Invitrogen, Carlsbad, CA) at 37 °C, 5% CO2. Cells were passaged every 3–4 days. HCT116 cells (ATCC) used for high-content imaging were grown in McCoy’s 5A medium containing 5% FBS and used between passages 3 and 12. For proliferation and confirmatory imaging studies, HCT116 cells were grown in RPMI containing 10% FBS.
Cell Treatments
JQ1 was purchased from Selleckchem (Houston, TX) and control A, referred to as compound 1 in Felsenstein et al., 19 was purchased from Otava Chemicals (Vaughan, Canada). GQC-05 was a kind gift from L. Hurley, University of Arizona. Control B is a close analog of control A; controls C and D are close analogs of compound IntE1 from Diveshkumar et al. 32 Controls B–D were synthesized in-house using proprietary methods. The original compound library used in the Myc promoter screen (from which hits and close analogs were screened in ALIS) is a ~2 million pooled compound collection; compounds in this collection are structurally diverse, druglike molecules with molecular weights greater than 250 Da. Following the initial ALIS screen and early phenotypic experiments, compound 3 was resynthesized in-house using proprietary methods and used in follow-up cell-based assays. 1H nuclear magnetic resonance for compound 3 is as follows: (499 MHz, DMSO-d6) d 12.64 (s, 1H), 10.78 (s, 1H), 10.39 (s, 1H), 8.27 (s, 2H), 8.08 (d, J = 10.0 Hz, 2H), 7.40 (s, 1H), 4.37 (s, 2H), 3.44 (dd, J = 29.1, 11.3 Hz, 4H), 3.19 (d, J = 42.6 Hz, 1H), 3.08 – 2.95 (m, 2H), 2.91 (s, 2H), 2.85 – 2.75 (m, 2H), 2.07 (d, J = 11.9 Hz, 3H), 1.95 – 1.85 (m, 3H), 1.78 – 1.55 (m, 5H), 1.43 – 1.29 (m, 1H). The new batch of compound 3 exhibited some increased potency over the original and was used in some experiments at a lower dose. All compounds were solubilized in DMSO, and treatments were performed at equivalent final DMSO concentrations (<0.5%) for each experiment.
qPCR
Cells were seeded at a density of 100,000/well in 96-well plates and treated with compounds for the times indicated for each experiment. RNA lysates were prepared and one-fifth of each RNA lysate reaction was reverse transcribed using the CellsToCT kit (Thermo Fisher Scientific). From each RT reaction, 12.5 µL of cDNA was preamplified for 14 cycles on a Tetrad2 thermal cycler (BioRad; Hercules, CA) using diluted primers and TaqMan PreAmp Master Mix (Thermo Fisher Scientific) and then diluted 1:20 in 1× TE buffer. Quantitative PCR (qPCR) was performed in 20 µL reactions using FAM-labeled TaqMan primers (Thermo Fisher Scientific) for Myc (exon 2; Hs00153408_m1), KRAS (Hs00364284_g1), VEGFA (Hs00900055_m1), BCL2 (Hs00608023_m1), HIF1A (Hs00153153_m1), RB1 (Hs01078066_m1), and GAPDH (Hs99999905_m1). The Ct values obtained were normalized to GAPDH and compared with DMSO-treated controls (using the delta-delta Ct method on a QuantStudio7, Applied Biosystems; Foster City, CA). All kits were used according to the manufacturer’s protocol. Cell treatments were performed in duplicate and qPCR wells were run in triplicate for each biological replicate. Significance was assessed using a Student unpaired t test in GraphPad Prism (GraphPad Software, La Jolla, CA).
Myc Protein Expression by ELISA
Myc protein expression was assessed using the Human c-Myc (Total) ELISA Kit (Novex, by Life Technologies, Thermo Fisher Scientific). For lysate collection, cells were seeded in six-well plates (2.5 × 10⁶ cells/well), treated with compounds for the prescribed times, washed twice with cold phosphate-buffered saline (PBS), and lysed for 30 min on ice in 80 µL of Cell Extraction Buffer (Life Technologies, Thermo Fisher Scientific) containing protease inhibitor cocktail (cOmplete ULTRA Tablet, mini; Roche, Basel, Switzerland). Lysates were sonicated briefly and centrifuged at 13,000g for 10 min at 4 °C, and protein concentrations from the supernatants were measured using a BCA assay (Pierce Biotechnology; Waltham, MA). For enzyme-linked immunosorbent assay (ELISA) measurements, 1 µg of protein was added to each well of the kit plate and Myc expression was detected according to the kit protocol. Absorbance at 450 nM was read on a Spectramax plate reader (Molecular Devices; San Jose, CA), and Myc concentration was calculated from a Myc protein standard curve and normalized to a DMSO-treated control. Each treatment was collected as duplicate lysates (biological replicates), and each lysate was tested in duplicate ELISA wells (technical replicates); results reflect the average of technical and biological replicates for each sample. Significance was assessed using a Student unpaired t test in GraphPad Prism.
High-Content Imaging Assay and Myc Immunofluorescence
HCT116 cells were seeded at 5000 cells/well overnight (24–30 h) in 0.1% FBS in black collagen-coated 384-well plates (Greiner Bio-One; Kremsmunster, Austria). Compounds (30 µM, 0.3% DMSO) were preincubated with cells for 1 h prior to addition of 5% FBS to activate Myc expression. Cells were treated with compounds + 5% FBS for 4 h at 37 °C. Treated cells were fixed in 3.3% paraformaldehyde (Electron Microscopy Sciences; Hatfield, PA) for 20 min at RT, followed by an additional 20 min of permeabilization with 0.5% Triton X-100 in HBSS (+Mg2+, +Ca2+) (Sigma Aldrich; St. Louis, MO). Prior to immunostaining, fixative and permeabilization reagents were removed and plates washed four times with 200 µL/well in immunofluorescence (IF) buffer (150 mM NaCl, 25 mM Tris-HCl, pH 7.2, 0.2% Triton X-100, 2.5 mM EDTA) and six times in PBS (+Mg2+, +Ca2+) (GE Healthcare, Boston, MA) containing 0.25% Triton X using a BioTEK EL406 (BioTEK, Winooski, VT). Cells were blocked with 5% (v/v) normal goat serum (Jackson Research Labs, Bar Harbor, ME) in IF buffer overnight at 4 °C. Cells were stained with anti-Myc antibodies (Abcam, Cambridge, UK, AB32072) in blocking buffer for 1–2 h at RT and washed six times with 200 µL/well PBS (+Mg2+, +Ca2+) containing 0.25% Tween-20 using BioTEK EL406, followed by incubation with secondary goat anti-rabbit antibodies (Fab, AF488, Cell Signaling Technologies, Danvers, MA), Far Red CellMask (C10046, Life Technologies, Carlsbad, CA), and Hoechst 33342 (Life Technologies). Liquid handling was performed using a BRAVO Liquid Handler (Agilent). Images were collected on an In Cell Analyzer 2200 high-content imager (GE Healthcare), and cell segmentation and analysis was performed using Columbus software as previously described. 30 Median nuclear Myc intensity (fluorescein isothiocyanate [FITC]) was calculated after filtering for individual live cells in the DAPI channel, and percent inhibition was determined as the difference between vehicle (DMSO)-treated cells and cells treated with 500 nM dinaciclib (representing 100% inhibition of Myc expression). Compounds were considered to be positive inhibitors of Myc expression if they inhibited Myc by at least 40%, with less than 30% inhibition of viability, which was calculated based on the number of cells remaining in the well at the end of the treatment period.
For follow-up Myc IF studies, HCT116 cells growing in RPMI containing 10% FBS were seeded in black poly-
Myc Expression and Cell Death by Flow Cytometry
Cells were seeded in 24-well plates at 300,000 cells/well and treated with compound for the indicated times. Cells were washed with PBS, fixed for 10 min in 4% paraformaldehyde (Alpha Aesar, Haverill, MA), and permeabilized overnight in 95% methanol at –20 °C. Fixed cells were washed in 0.5% BSA, labeled with anti-Myc primary antibody (Cell Signaling Technologies) overnight at 4 °C, followed by secondary 488-goat-anti-rabbit antibody (Thermo Fisher Scientific) for 1 h at RT, and washed in PBS containing the DNA label FxCycle Red (Thermo Fisher Scientific) supplemented with RNase A (PureLink; Invitrogen). Staining was compared with that of a matched immunoglobulin (Ig) isotype control. A total of 5000–10,000 labeled cells/sample were detected in the FITC and APC channels on a FACSCanto II Flow Cytometer (BD Biosciences, Franklin Lakes, NJ). Data were analyzed using FCS Express (De Novo Software, Glendale, CA). The mean Myc expression in live cells (gated to exclude sub-G1 in the APC channel) was plotted and normalized to a DMSO-treated control. Cell death was calculated as the percentage of cells in the sub-G1 population in the cell cycle plot (in the absence of FSC-SSC gating).
Cell Proliferation/Viability
Cells were seeded into 96-well plates, treated with compounds over a 5–6 log concentration range, and assessed for cell growth at 72 h using the CellTitre-Glo Luminescent Cell Viability Assay (Promega, Madison, WI). Seeding density was determined such that cells were maintained within a linear growth range throughout the time course of the assay. Cell proliferation was normalized to a DMSO-treated control. Growth curves were plotted and IC50 values were calculated in GraphPad Prism using a nonlinear regression curve fit model. Cell treatments were performed in triplicate for each experiment.
Myc Exon-Specific qPCR
Cells were treated with compounds and assessed for expression of Myc exon 1 versus Myc exon 2 by qPCR as described above, using the CellsToCT kit protocol and cDNA preamplification (Thermo Fisher Scientific). FAM-labeled TaqMan primers (Thermo Fisher Scientific) were used for Myc exon 1 (Hs01562521_m1) and Myc exon 2 (Hs00153408_m1) as previously described.18,33 The Ct values obtained were normalized to GAPDH (Hs99999905_m1) and compared with DMSO-treated controls. Cell treatments were performed in duplicate and qPCR wells were run in triplicate for each biological replicate. Significance was assessed using a Student unpaired t test in GraphPad Prism.
Results
ALIS Screen Identifies Compounds That Bind to a Myc G4
ALIS has successfully been used to detect binding to RNA, 31 but binding to small, structured DNA such as the Myc G4 has not been reported. To confirm that ALIS could be used to detect binding of small molecules to the Myc G4, we tested four control compounds (or close analogs) that had been previously shown to bind to the Myc G4 by other methods.19,32 The Myc G4 sequence (extended from 27 to 50 bp in order to meet minimum size requirements for the SEC step in ALIS) was folded into the G4 structure by annealing in buffer containing high potassium ions, which are known to promote Myc G4 folding, 19 and the folded structure of the G4 sequence was confirmed using CD ( Fig. 1A ). All four control compounds bound to the Myc G4 in ALIS, with no detectable binding to a nonfolding mutant sequence subjected to the same folding conditions ( Fig. 1B , controls A–D, and Suppl. Fig. S1A ). Because specific binding to individual G4s is difficult to achieve, cross-binding to similarly structured G4s from other genes (KRAS, VEGFA, BCL2, HIF1A, and RB1) is commonly tested. 19 Using ALIS, we detected binding of all four control compounds to at least three out of these five G4s (when subjected to the same folding conditions as the Myc G4; Suppl. Table S2 ), although control A has been previously shown to bind only weakly to two out of these five G4s using other binding assays. 19 Taken together, our results show that ALIS can be used to detect binding to folded G4 structures (with binding to the Myc G4 detected for control Myc G4-binding compounds); however, binary yes/no binding reported by ALIS, without further characterization of affinity, may pick up on low-affinity binding events not detected by other methods.
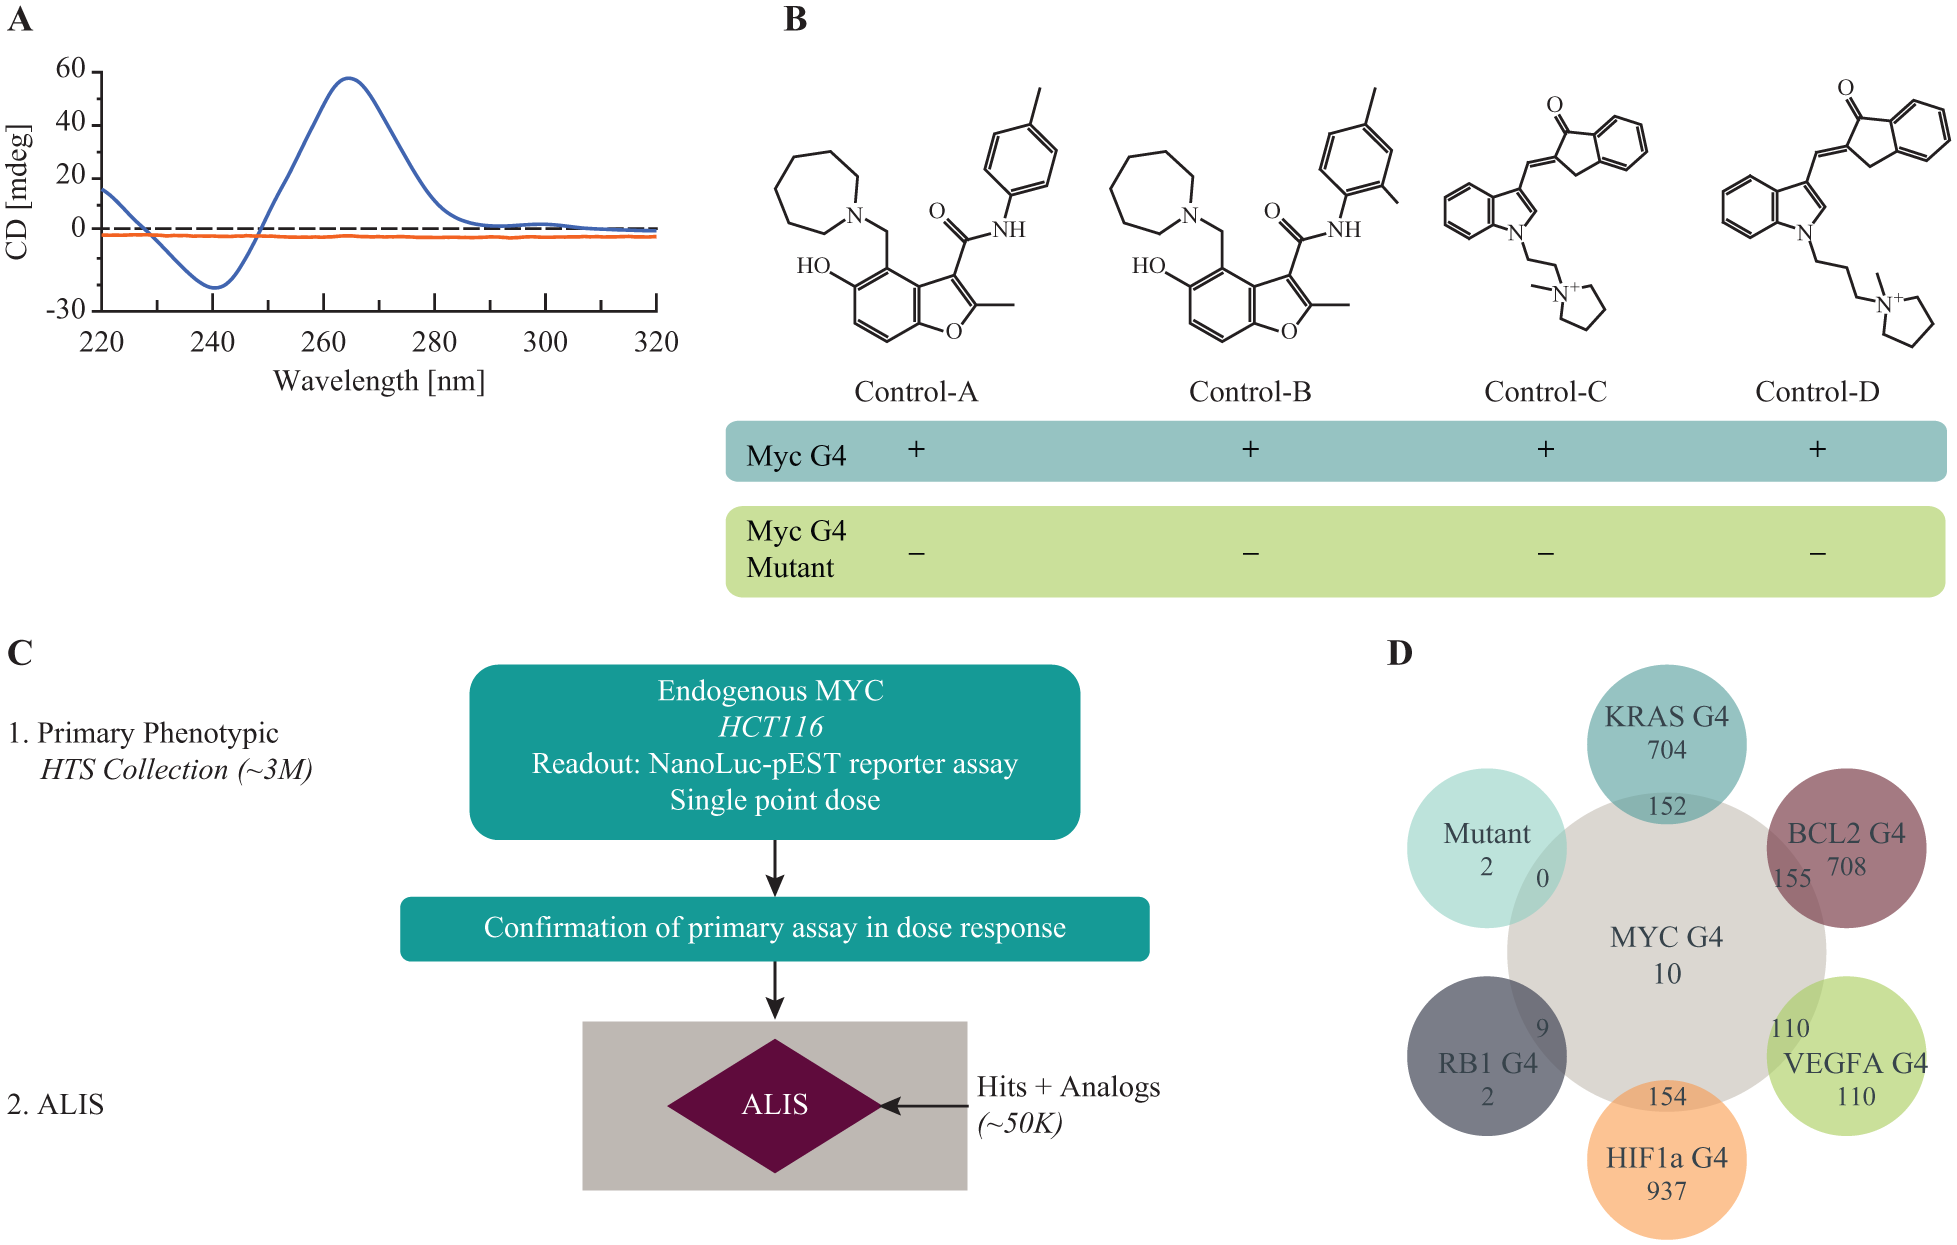
ALIS screen identifies Myc G4 binders among Myc promoter screen hits. (
The advantage of ALIS lies in its ability to rapidly screen a large number of compounds for binding to a target of interest in a relatively short period of time using only small amounts of target.28,29 Coupled to a phenotypic screen, ALIS has the potential to identify targets for previously characterized phenotypic screen hits. 30 We therefore performed a high-throughput screen in ALIS to identify novel binders to the Myc G4, using a set of active compounds from a previously performed reporter screen in which ~3 million compounds were tested for inhibition of Myc expression (X-MAN NanoLuc-PEST Myc promoter reporter HCT116 cell line containing a luciferase-tagged Myc promoter at the endogenous locus; Horizon Discovery, Cambridge, UK) (Myc promoter screen; Fig. 1C ). Active compounds (~11,000) and their structural analogs (for a total of ~50,000 compounds) were then screened in ALIS against the folded Myc G4, a Myc G4 nonfolding mutant, and the folded G4s of KRAS, BCL2, VEGFA, HIF1A, and RB1, with the goal of determining whether the Myc G4 could be the target of any of the phenotypic screen hits that led to inhibition of Myc expression. Out of the 50,000-compound library of phenotypic screen hits and analogs, 183 compounds bound to the Myc G4, and a range of 2–1091 compounds from the same compound library bound to each of the other G4s tested ( Suppl. Fig. S1B ). When comparing the compounds that bound to the Myc G4, each of the five other G4s, and the nonfolding mutant, we found that only 10 of the 183 compounds bound to the Myc G4 with no binding to either the Myc mutant or to the other G4s subjected to similar folding conditions. These 10 compounds were termed “Myc-selective” compounds. The remaining 173 “promiscuous” compounds bound one or more additional G4s ( Fig. 1D ). Therefore, ALIS was able to successfully identify, through comparative screening, compounds that bound selectively to the Myc G4 compared with the G4s from other genes.
Functional Analysis in Cell Lines with and without the Myc G4 Narrows Compounds of Interest to 4 out of 10 Myc-Selective ALIS Screen Hits
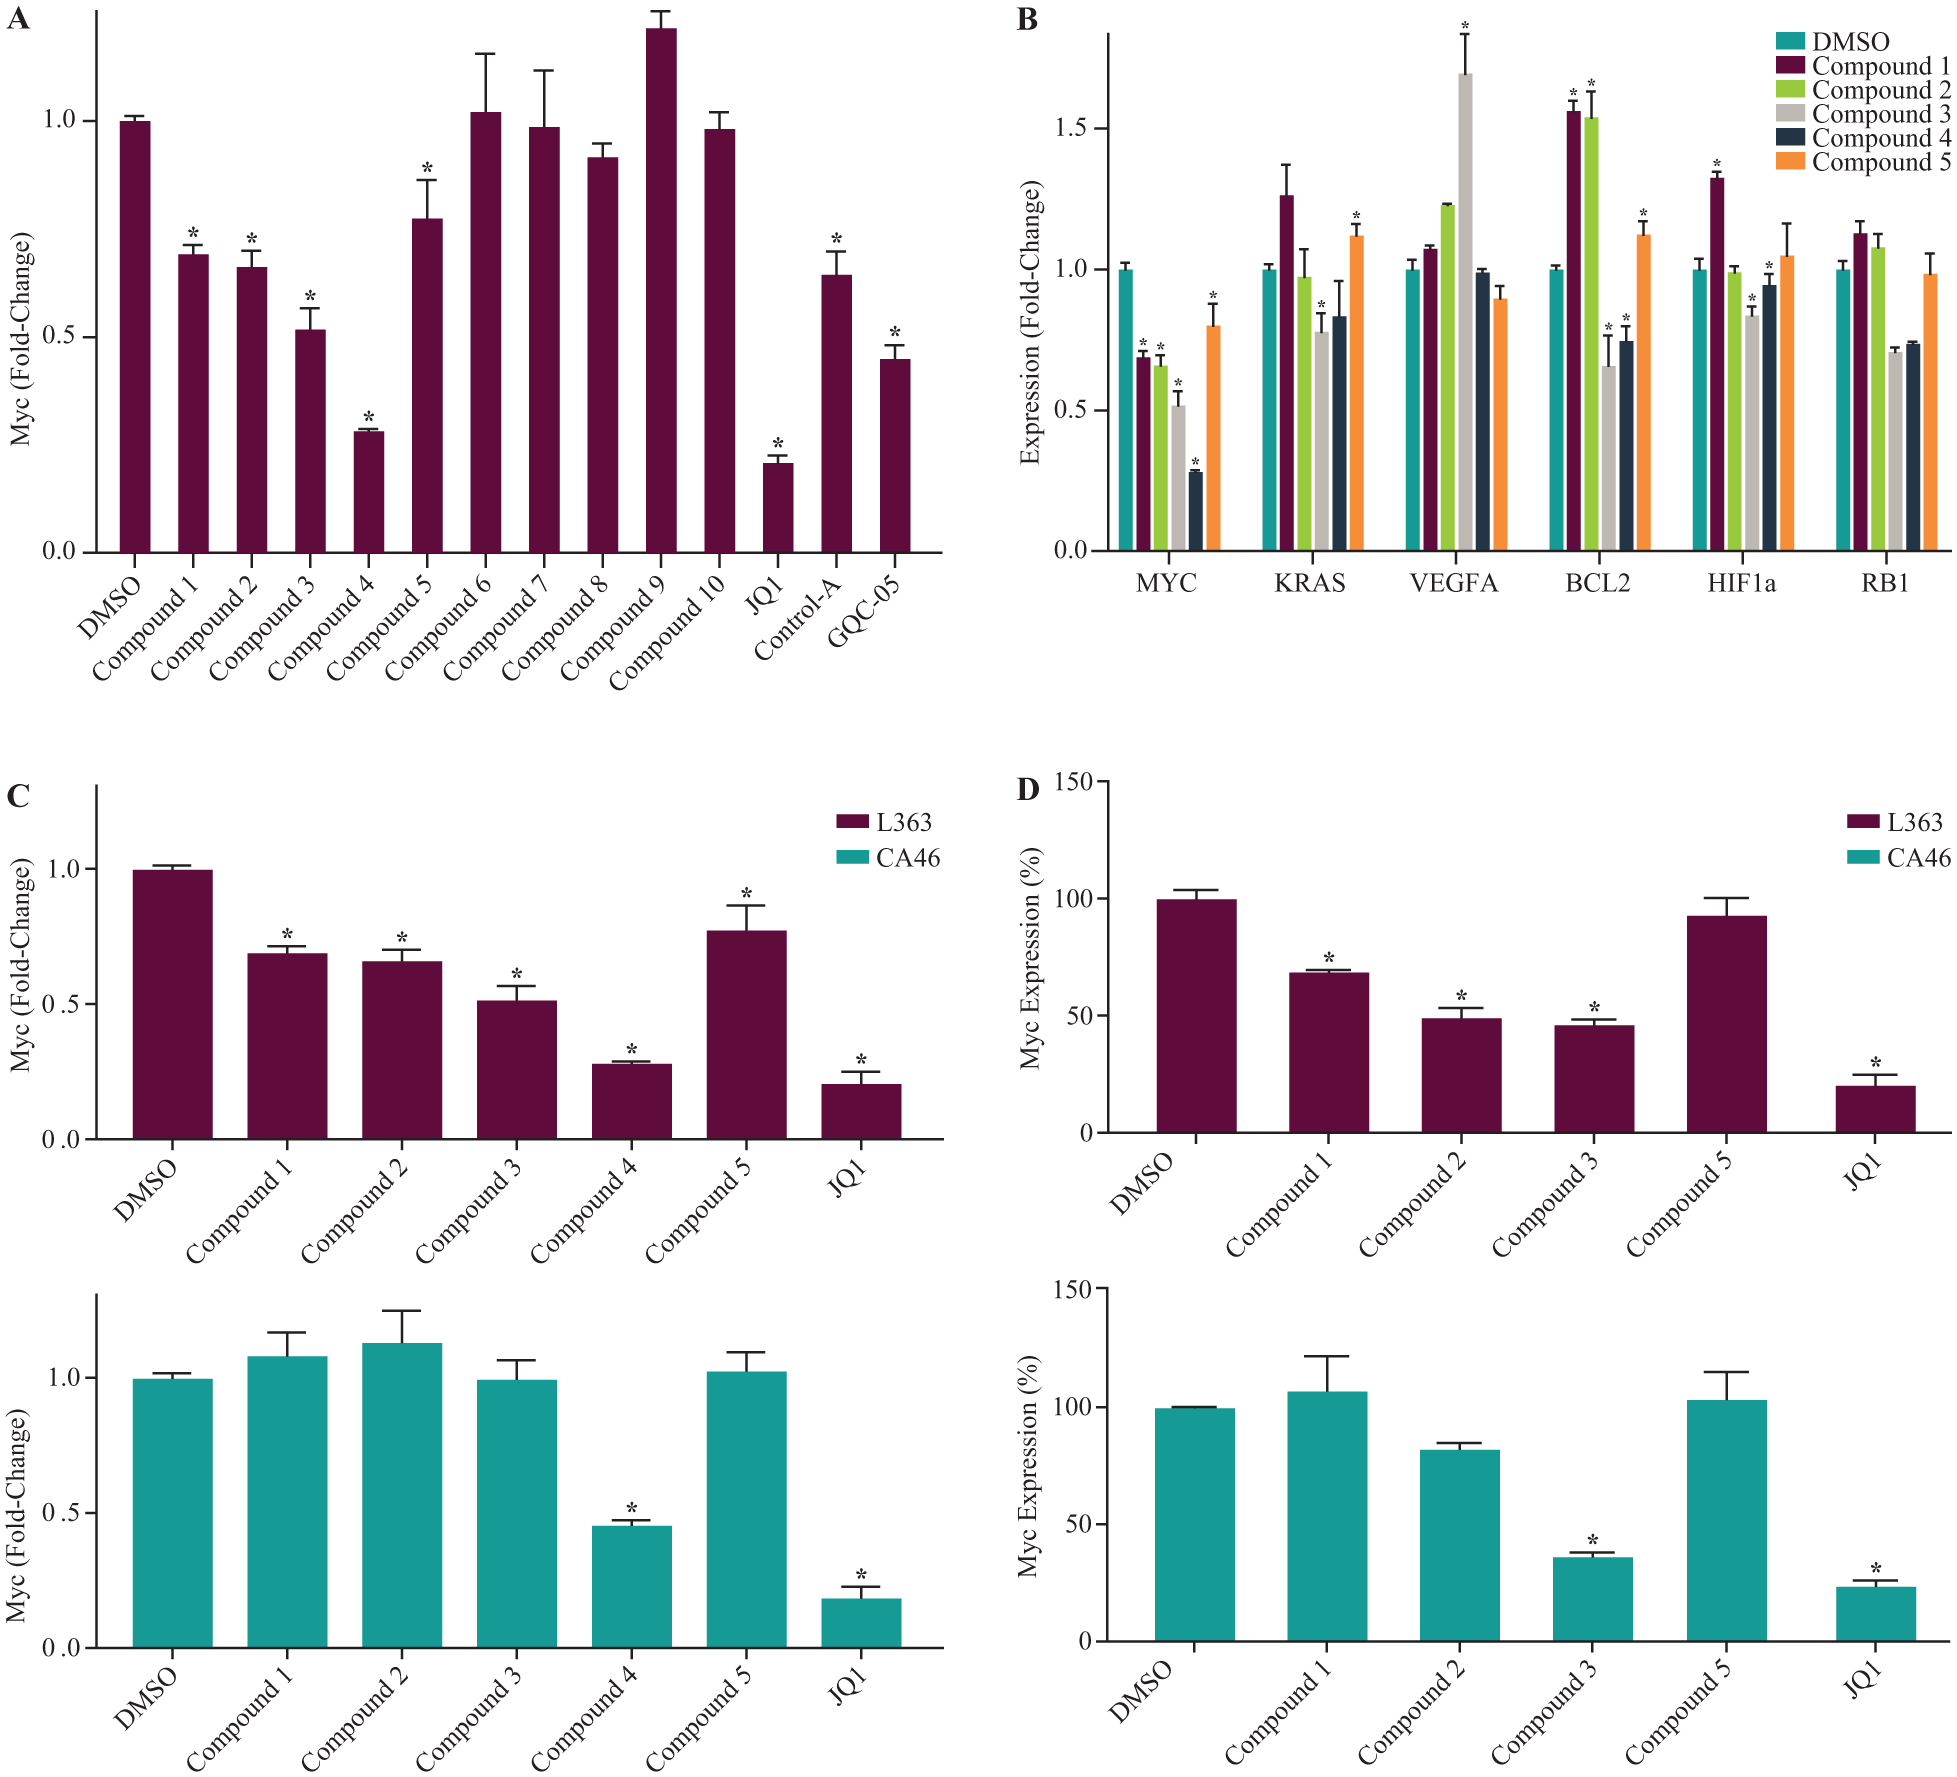
Because of the potential for nonfunctional binding events using a screen, we sought to verify our ALIS hits using cell-based assays. First, to determine whether ALIS hits inhibit Myc expression in cell lines, we tested the effects of the Myc-selective small molecules on Myc expression in L363, a myeloma cell line that harbors a Myc translocation that places the Myc promoter proximal to the Ig heavy chain locus (IgH), leading to high Myc expression. 34 L363 cells have been shown to retain a functional G4 element in the Myc promoter in spite of the chromosomal translocation and to exhibit G4-dependent regulation of Myc expression using small molecules that bind to and stabilize the G4 element. 19 When we examined Myc levels in L363 cells by qPCR, 5 out of the 10 Myc-selective compounds significantly inhibited Myc expression following 24 h of treatment at a concentration of 10 µM ( Fig. 2A , compounds 1–5). The extent of inhibition was within the same range (30%–50% inhibition) as that observed for two control compounds previously shown to inhibit Myc expression via G4 binding, control A 19 and GQC-05, an ellipticine derivative. 18 We also observed inhibition of Myc expression in L363 cells with control B (a close analog of control A), but not with control C or control D, 32 suggesting that the latter two control compounds may not be functional in cells, although they bound to the Myc G4 ( Suppl. Fig. S2A ). One compound from our set (compound 4) inhibited 70%–80% of Myc expression, which is in the range of JQ1, a BRD4 inhibitor that downregulates Myc expression by a G4-independent mechanism ( Fig. 2A ). 35 Thus, 5 of the 10 Myc-selective compounds from our ALIS screen led to a decrease in Myc expression in L363 cells, suggesting a correlation between G4 binding and cellular activity for some, but not all, of these compounds.
Four out of 10 Myc-selective compounds inhibit Myc expression in L363 cells but not in CA46 cells that lack G4 regulation of Myc expression. (
Next, we tested the effects of compounds 1–5 on the expression of KRAS, VEGFA, BCL2, HIF1A, and RB1 in L363 cells by qPCR. In agreement with the ALIS data that showed a lack of binding to the G4s of these genes, compounds 1, 2, and 5 did not significantly inhibit their gene expression, although in some cases the genes were upregulated by up to 1.5-fold by an unknown mechanism ( Fig. 2B ). Control compounds A and B also did not inhibit expression of these genes ( Suppl. Fig. S2B ), in agreement with previous reports. 19 In contrast, compounds 3 and 4 affected the expression of several of these genes: compound 3 led to 30%–40% inhibition of KRAS, BCL2, HIF1A, and RB1, and to a >1.5-fold increase in the expression of VEGFA, while compound 4 led to a 25%–30% decrease in the expression of BCL2 and RB1 ( Fig. 2B ). Thus, three Myc-selective compounds (compounds 1, 2, and 5) exhibited a good correlation between G4 binding in ALIS and specific effects on gene expression, while others either failed to inhibit expression of Myc (compounds 6–10) or inhibited the expression of additional genes (compounds 3 and 4), suggesting the likelihood of off-target or indirect effects.
To further explore whether these compounds inhibit Myc expression through G4 binding, we compared the ability of compounds 1–5 to inhibit Myc expression in L363 cells versus CA46 cells, a Burkitt’s lymphoma line that harbors a Myc translocation leading to loss of the Myc G4 on the translocated chromosome and subsequent loss of G4-mediated Myc expression. 18 Compounds 1–5 and JQ1 at a concentration of 10 µM inhibited Myc mRNA expression 30%–70% in L363 cells at 24 h ( Fig. 2C , top). In CA46 cells, four of the five compounds (compounds 1–3 and 5; Fig. 2C , bottom), as well as controls A and B ( Suppl. Fig. S2C ), failed to inhibit expression of Myc mRNA, supporting a case for functional selectivity of these compounds. In contrast, compound 4 inhibited Myc expression in CA46 cells by >50%, demonstrating that inhibition of Myc expression by this compound was occurring independently of Myc G4 binding. In both L363 and CA46 cells, the extent of Myc inhibition with compound 4 was similar to that observed for JQ1, which also inhibits Myc expression in a G4-independent manner ( Fig. 2C ). Compounds 1 and 2 also inhibited Myc protein expression in L363 ( Fig. 2D , top) but not CA46 ( Fig. 2D , bottom) cells, as measured by ELISA at 24 h, whereas compound 5 did not inhibit Myc protein expression in either cell line (at multiple time points tested; data not shown). In contrast, compound 3 inhibited Myc expression in both cell lines in the ELISA ( Fig. 2D ). However, gating out dead cells by flow cytometry revealed a significantly smaller reduction of Myc protein with compound 3 treatment in CA46 (30%) versus L363 (80%) cells when compared with the DMSO control ( Suppl. Fig. S3 ). Thus, our ALIS screen yielded 10 compounds that bound with some selectivity to the Myc G4 compared with G4s found in five other cancer-related genes; three of these compounds inhibited Myc expression at both the mRNA and protein levels in at least one cell line that retains G4 regulation of Myc (L363), with little or no inhibition in a cell line that lost G4 regulation (CA46).
Promiscuous ALIS Screen Hits That Bound to Multiple G4s Are Capable of Reducing Myc mRNA and Protein Expression
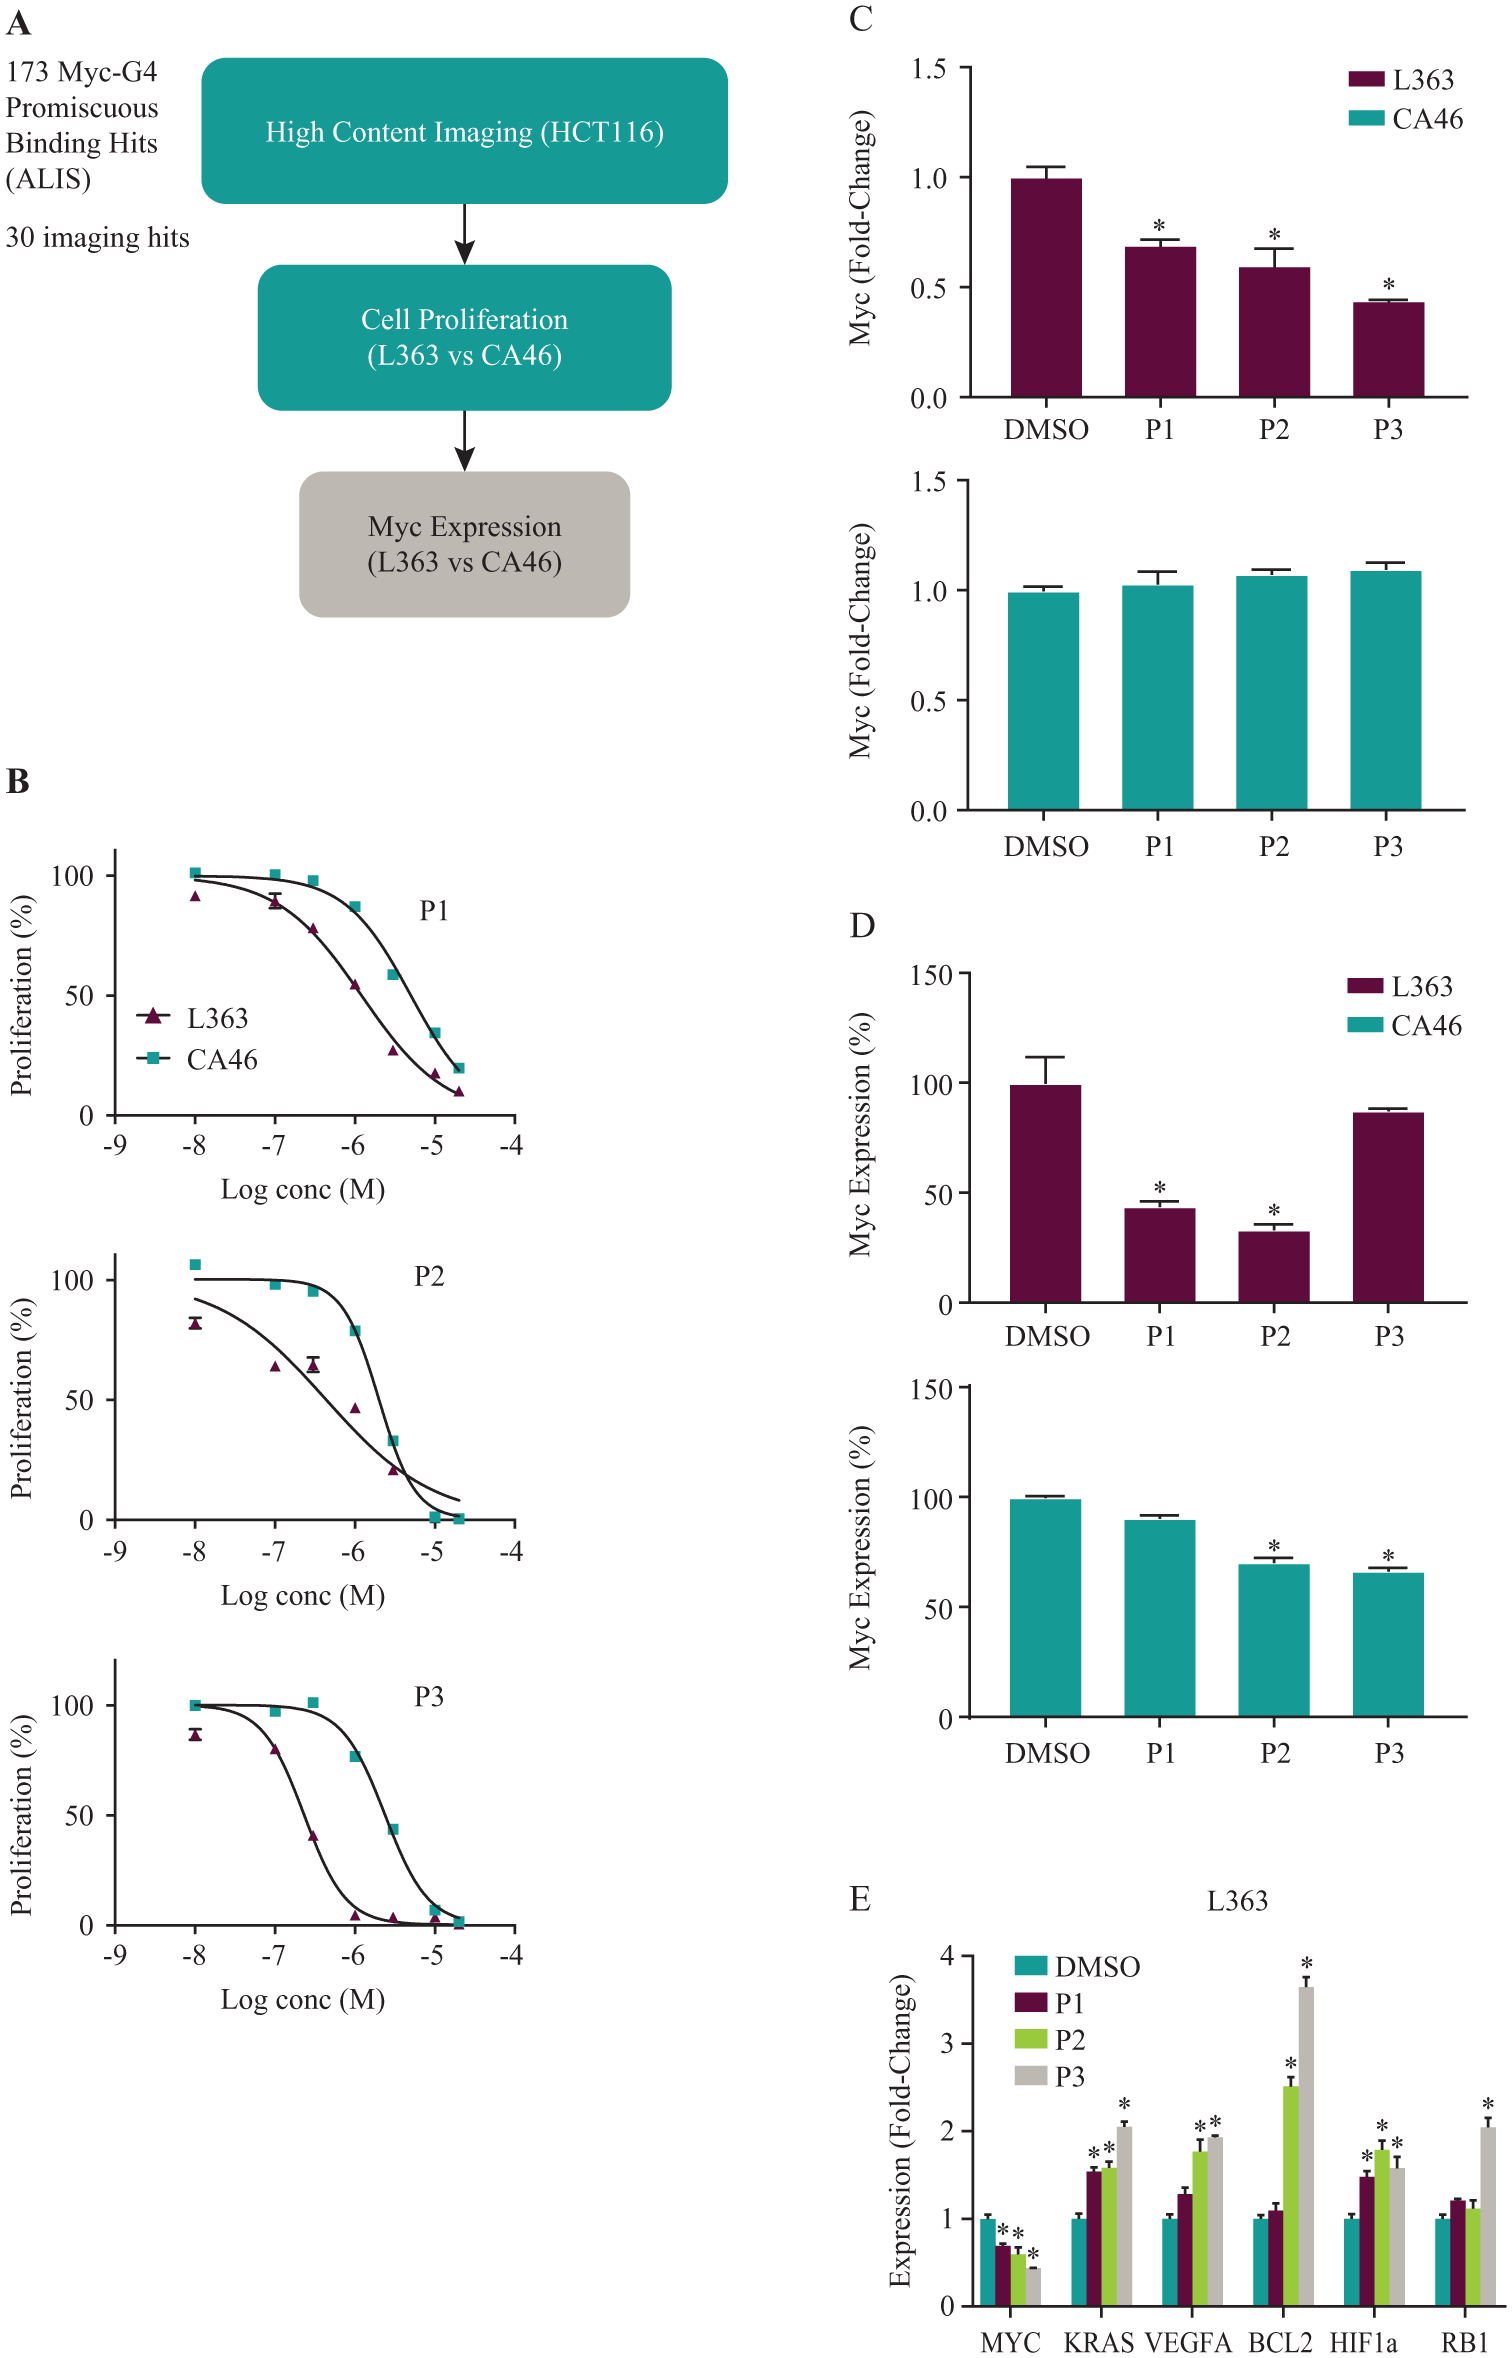
Since a high-throughput ALIS screen is not quantitative, compounds that bind to multiple G4s might bind with higher affinity to the Myc G4 than to other G4s and thus may be selective in cells or could be starting points for more selective molecules. We therefore expanded our functional studies to include the 173 ALIS Myc G4-binding promiscuous compounds that also bound to the G4s of five other cancer-related genes. To narrow down these compounds, we first tested them in a high-content imaging assay for inhibition of Myc expression in HCT116 cells, which express elevated Myc levels due to an upstream mutation in beta-catenin. 36 Compounds were determined to be positive if they inhibited serum-induced activation of Myc expression by at least 40% following a 4 h treatment, with less than a 30% decrease in cell viability. Using these criteria, 30 out of the 173 promiscuous Myc G4-binding compounds demonstrated inhibition of Myc expression without nonspecific cytotoxicity ( Fig. 3A ). Although the set of compounds screened in ALIS had been initially selected based on activity in the HCT116 Myc promoter screen, there were significant differences between that initial phenotypic screen and the HCT116 high-content imaging assay, such as the use of high serum in the promoter screen. Moreover, a transcriptional reporter assay is prone to false positives from compounds either inhibiting luciferase or nonspecifically inhibiting transcription/translation. In addition, compound analogs with similar structures to the active compounds from the promoter screen were also tested in the ALIS screen without prior activity confirmation. Therefore, it was not surprising that only a subset of the ALIS binding hits inhibited Myc expression in the HCT116 high-content imaging assay.
Several promiscuous G4-binding compounds from the ALIS screen inhibit Myc expression and cell proliferation in Myc G4-containing cell lines. (
We next compared the effects of these 30 compounds on the inhibition of cell proliferation in L363 and CA46 cells. Since CA46 cells lack G4-mediated regulation of Myc, we expected that compounds that function through Myc G4 binding would exhibit stronger inhibition of L363 compared with CA46 cell proliferation. When cells were treated with seven doses of compound (10 nM–20 µM) for 72 h, 3 out of the 30 promiscuous compounds (P1–P3) showed a significant difference in inhibition of cell proliferation between the two cell lines, with IC50 values approximately 3- to 10-fold lower in L363 versus CA46 cells (
Inhibition of cell proliferation in L363 and CA46 cells with compounds P1-P3.
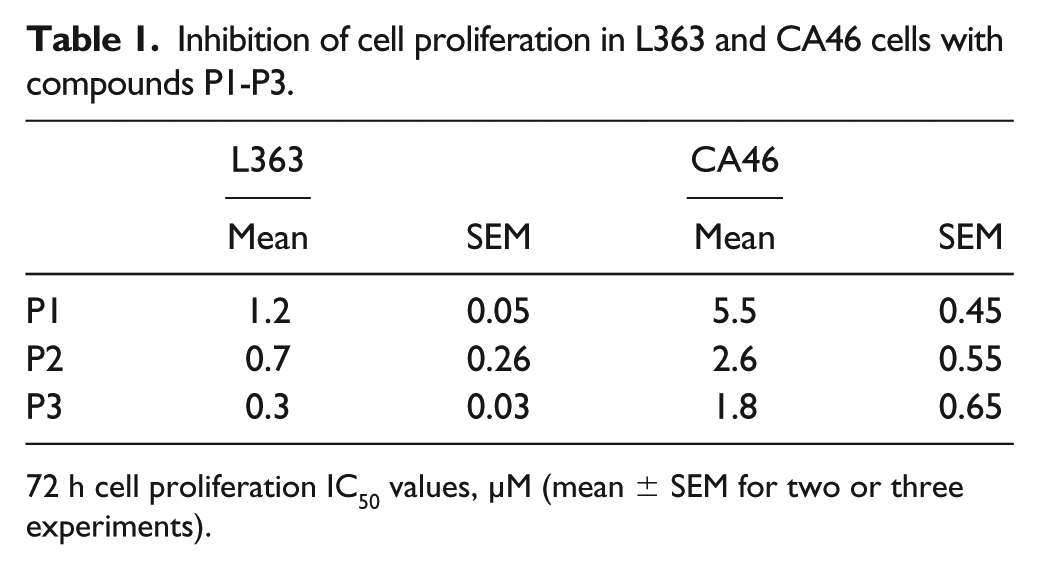
72 h cell proliferation IC50 values, µM (mean ± SEM for two or three experiments).
When we tested compounds P1–P3 for inhibition of Myc expression by qPCR, all three inhibited Myc expression in L363 cells by at least 30% at a 10 µM concentration at 24 h and failed to inhibit Myc expression in CA46 cells at an equivalent dose and time ( Fig. 3C ). In addition, compounds P1 and P2, but not P3, exhibited inhibition of Myc expression in L363 cells at the protein level, as measured by ELISA, although there was also some inhibition of Myc protein in CA46 cells for compound P2 ( Fig. 3D ). Compounds P1–P3 also had an effect on mRNA expression of at least one other cancer-related gene ( Fig. 3E ), in agreement with the ALIS data showing that these compounds bound to at least four out of five G4s of these genes (with affinities that could not be distinguished; data not shown). Interestingly, these compounds mostly led to increases in expression rather than decreases, although the effects varied slightly across time points. At 24 h, compound P1 increased expression of KRAS and HIF1A; compound P2 increased expression of KRAS, VEGFA, BCL2, and HIF1A; and compound P3 increased expression of all five genes ( Fig. 3E ). Thus, our screen identified three promiscuous G4 binders that inhibit Myc expression in Myc G4-containing cell lines, but that also exhibit off-target effects on at least two of five other genes, possibly, but not necessarily exclusively, due to off-target binding to the G4s of those genes.
Exon-Specific Assay Reveals One Compound That Is Likely to Functionally Inhibit Myc Expression through Targeting of the Myc G4
CA46 cells lack G4 regulation of Myc on their translocated chromosome; however, they retain a copy of the Myc G4 on their untranslocated chromosome, from which Myc is thought to be expressed at approximately 1000× lower levels than on the translocated chromosome.
18
The untranslocated chromosome also contains the only copy of Myc exon 1 in these cells, since exon 1 is lost on the translocated chromosome. Exon 1 does not encode a protein of its own but is thought to add extra amino acids to Myc protein expressed from exon 2 mRNA.
37
Thus, measuring inhibition of Myc exon 1 versus Myc exon 2 mRNA expression in CA46 cells is considered to be a robust way of assessing whether a compound is inhibiting Myc expression through Myc G4 binding; such compounds should inhibit expression of Myc exon 1 but not exon 2 in CA46 cells.18,33 In contrast, both exons are regulated by the Myc G4 in L363 cells; all experiments looking at Myc mRNA expression thus far (
Figs. 2
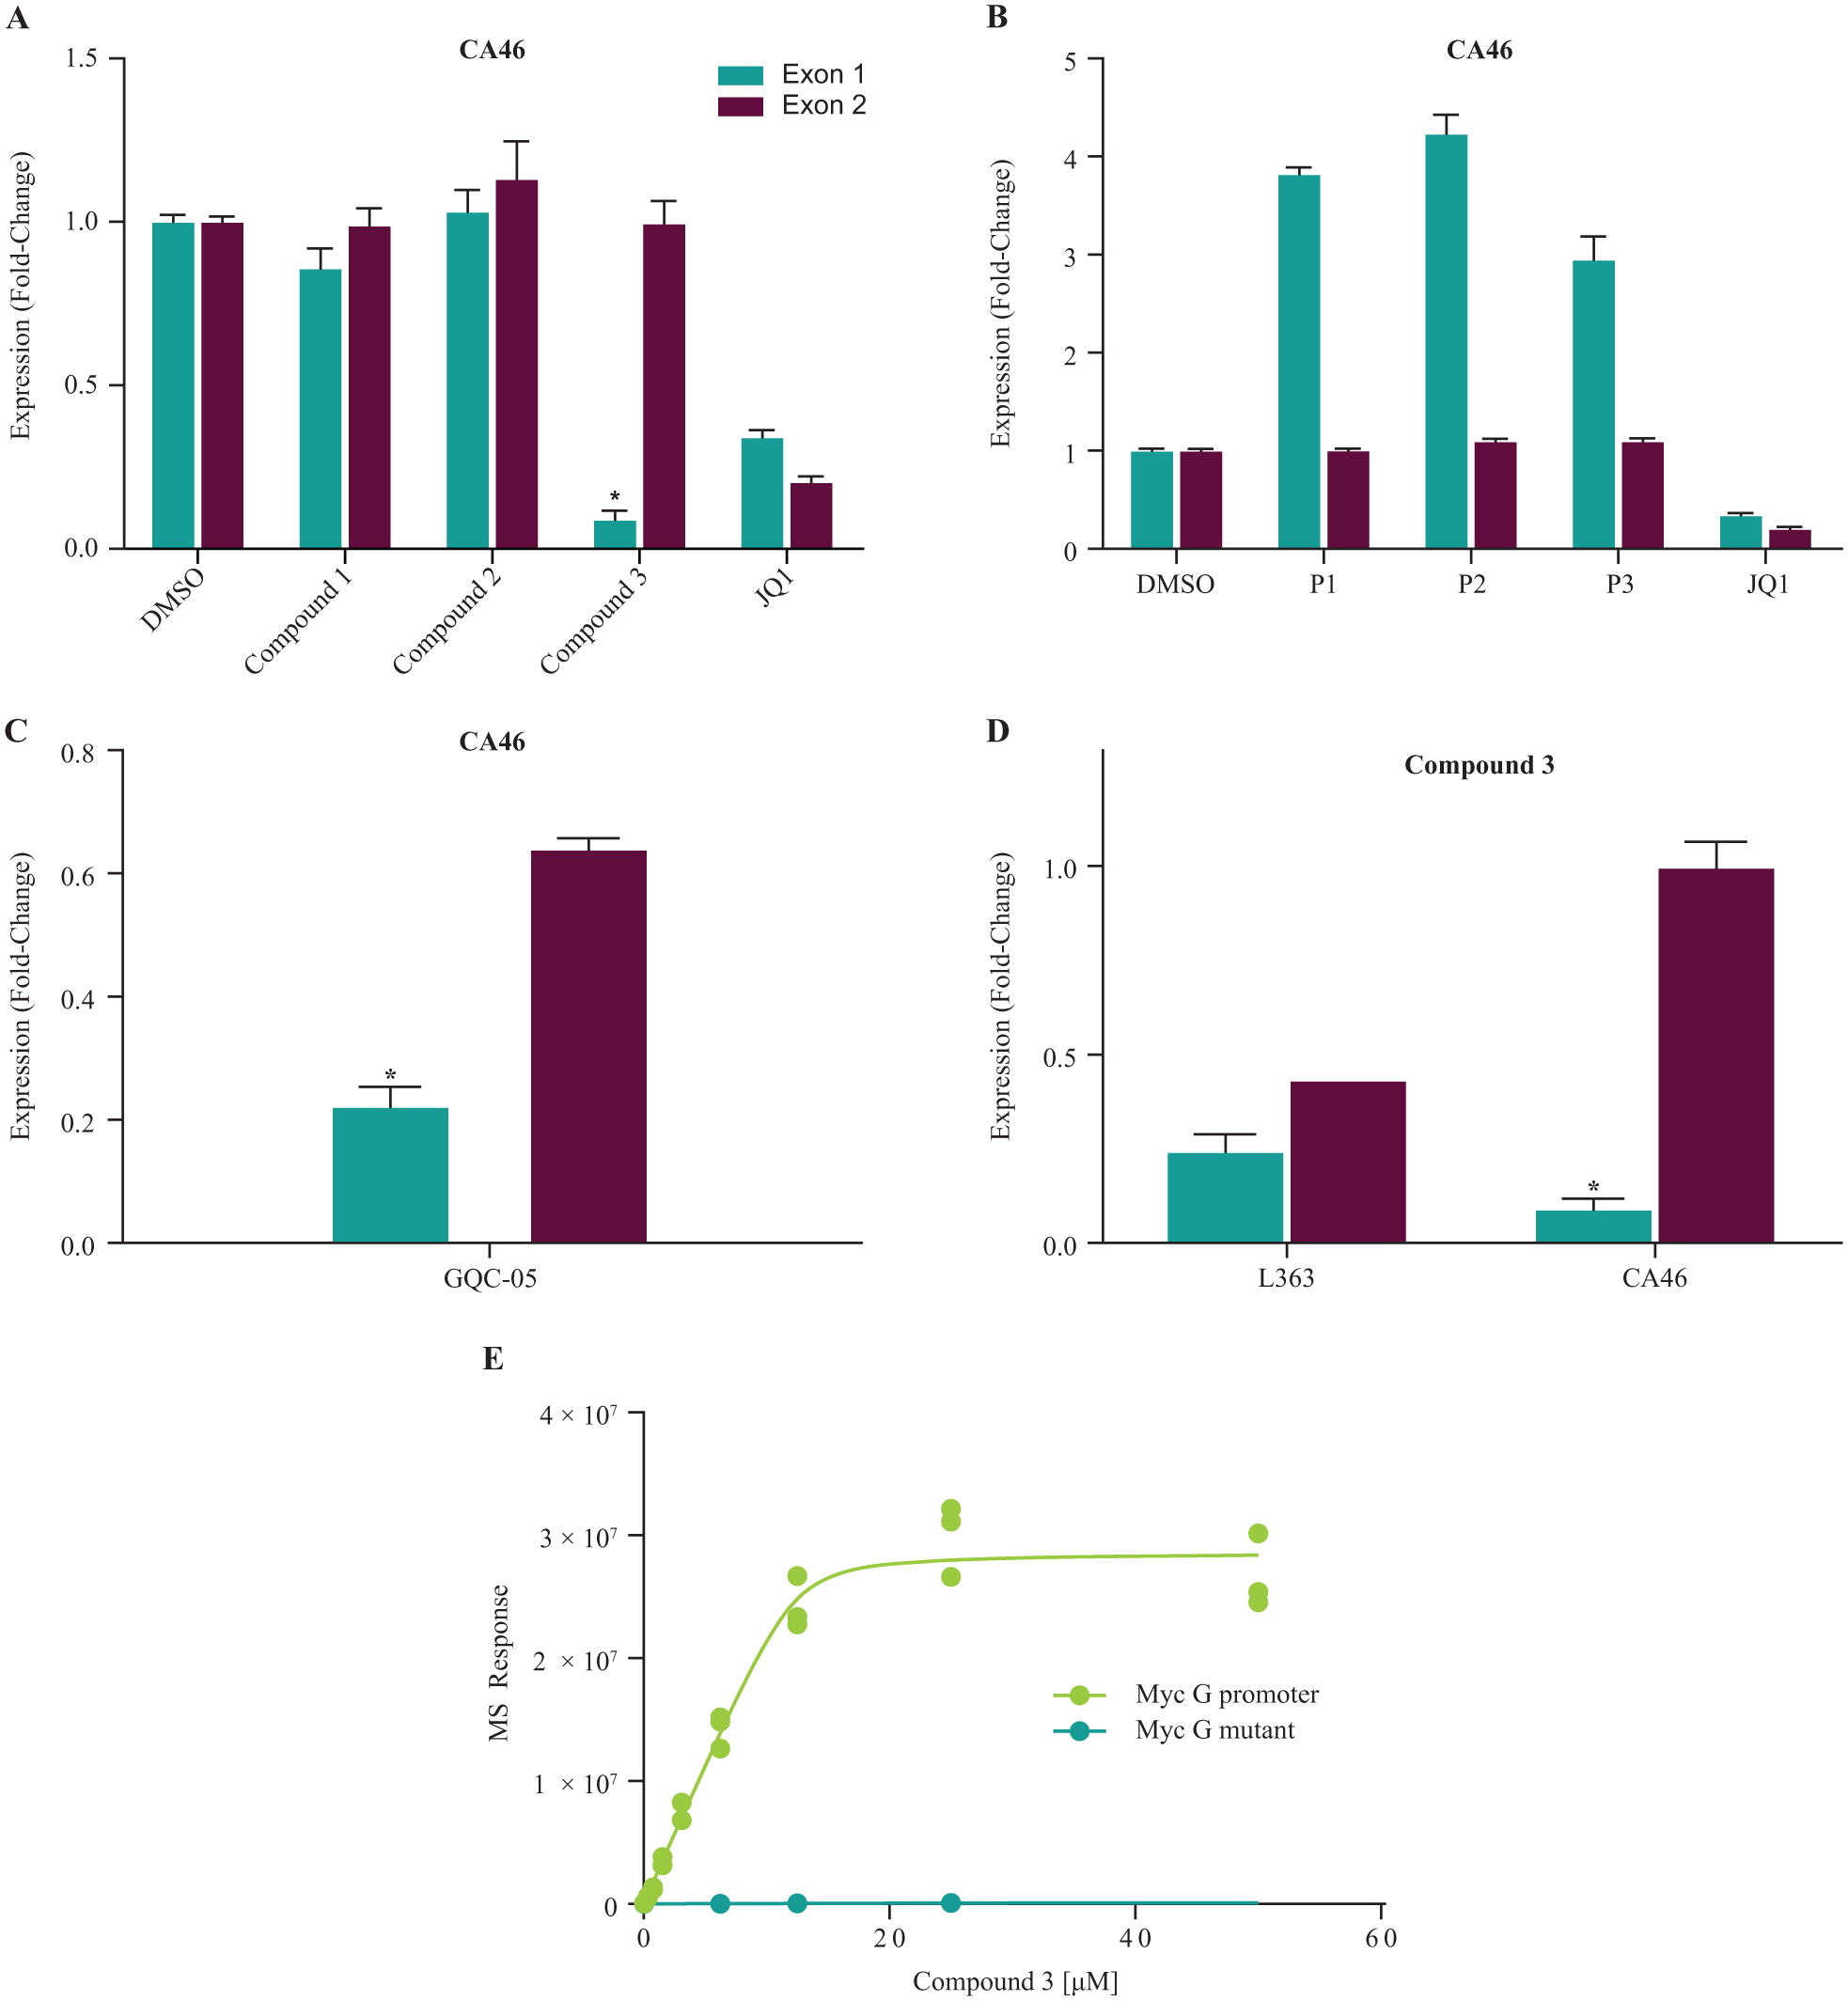
Exon-specific assay yields one Myc-selective compound that exhibits on-target inhibition of Myc expression through Myc G4 in CA46 cells. (
Compound 3 Inhibits Myc Expression in Several Myc G4-Containing Cell Lines but Also Exhibits Off-Target Effects
In order to further characterize the effects of compound 3 in cell lines, we tested inhibition of Myc expression in Raji lymphoma cells, which also have a Myc translocation that retains G4 regulation of Myc, 18 and in HCT116 colon carcinoma cells, which overexpress Myc due to an increase in upstream signaling. Compound 3 exhibited an 85% decrease in Myc mRNA expression in Raji cells at 24 h by qPCR ( Fig. 5A ) and an 85% decrease in Myc protein levels in HCT116 cells, as measured by imaging ( Fig. 5B and Suppl. Fig. S5A ).
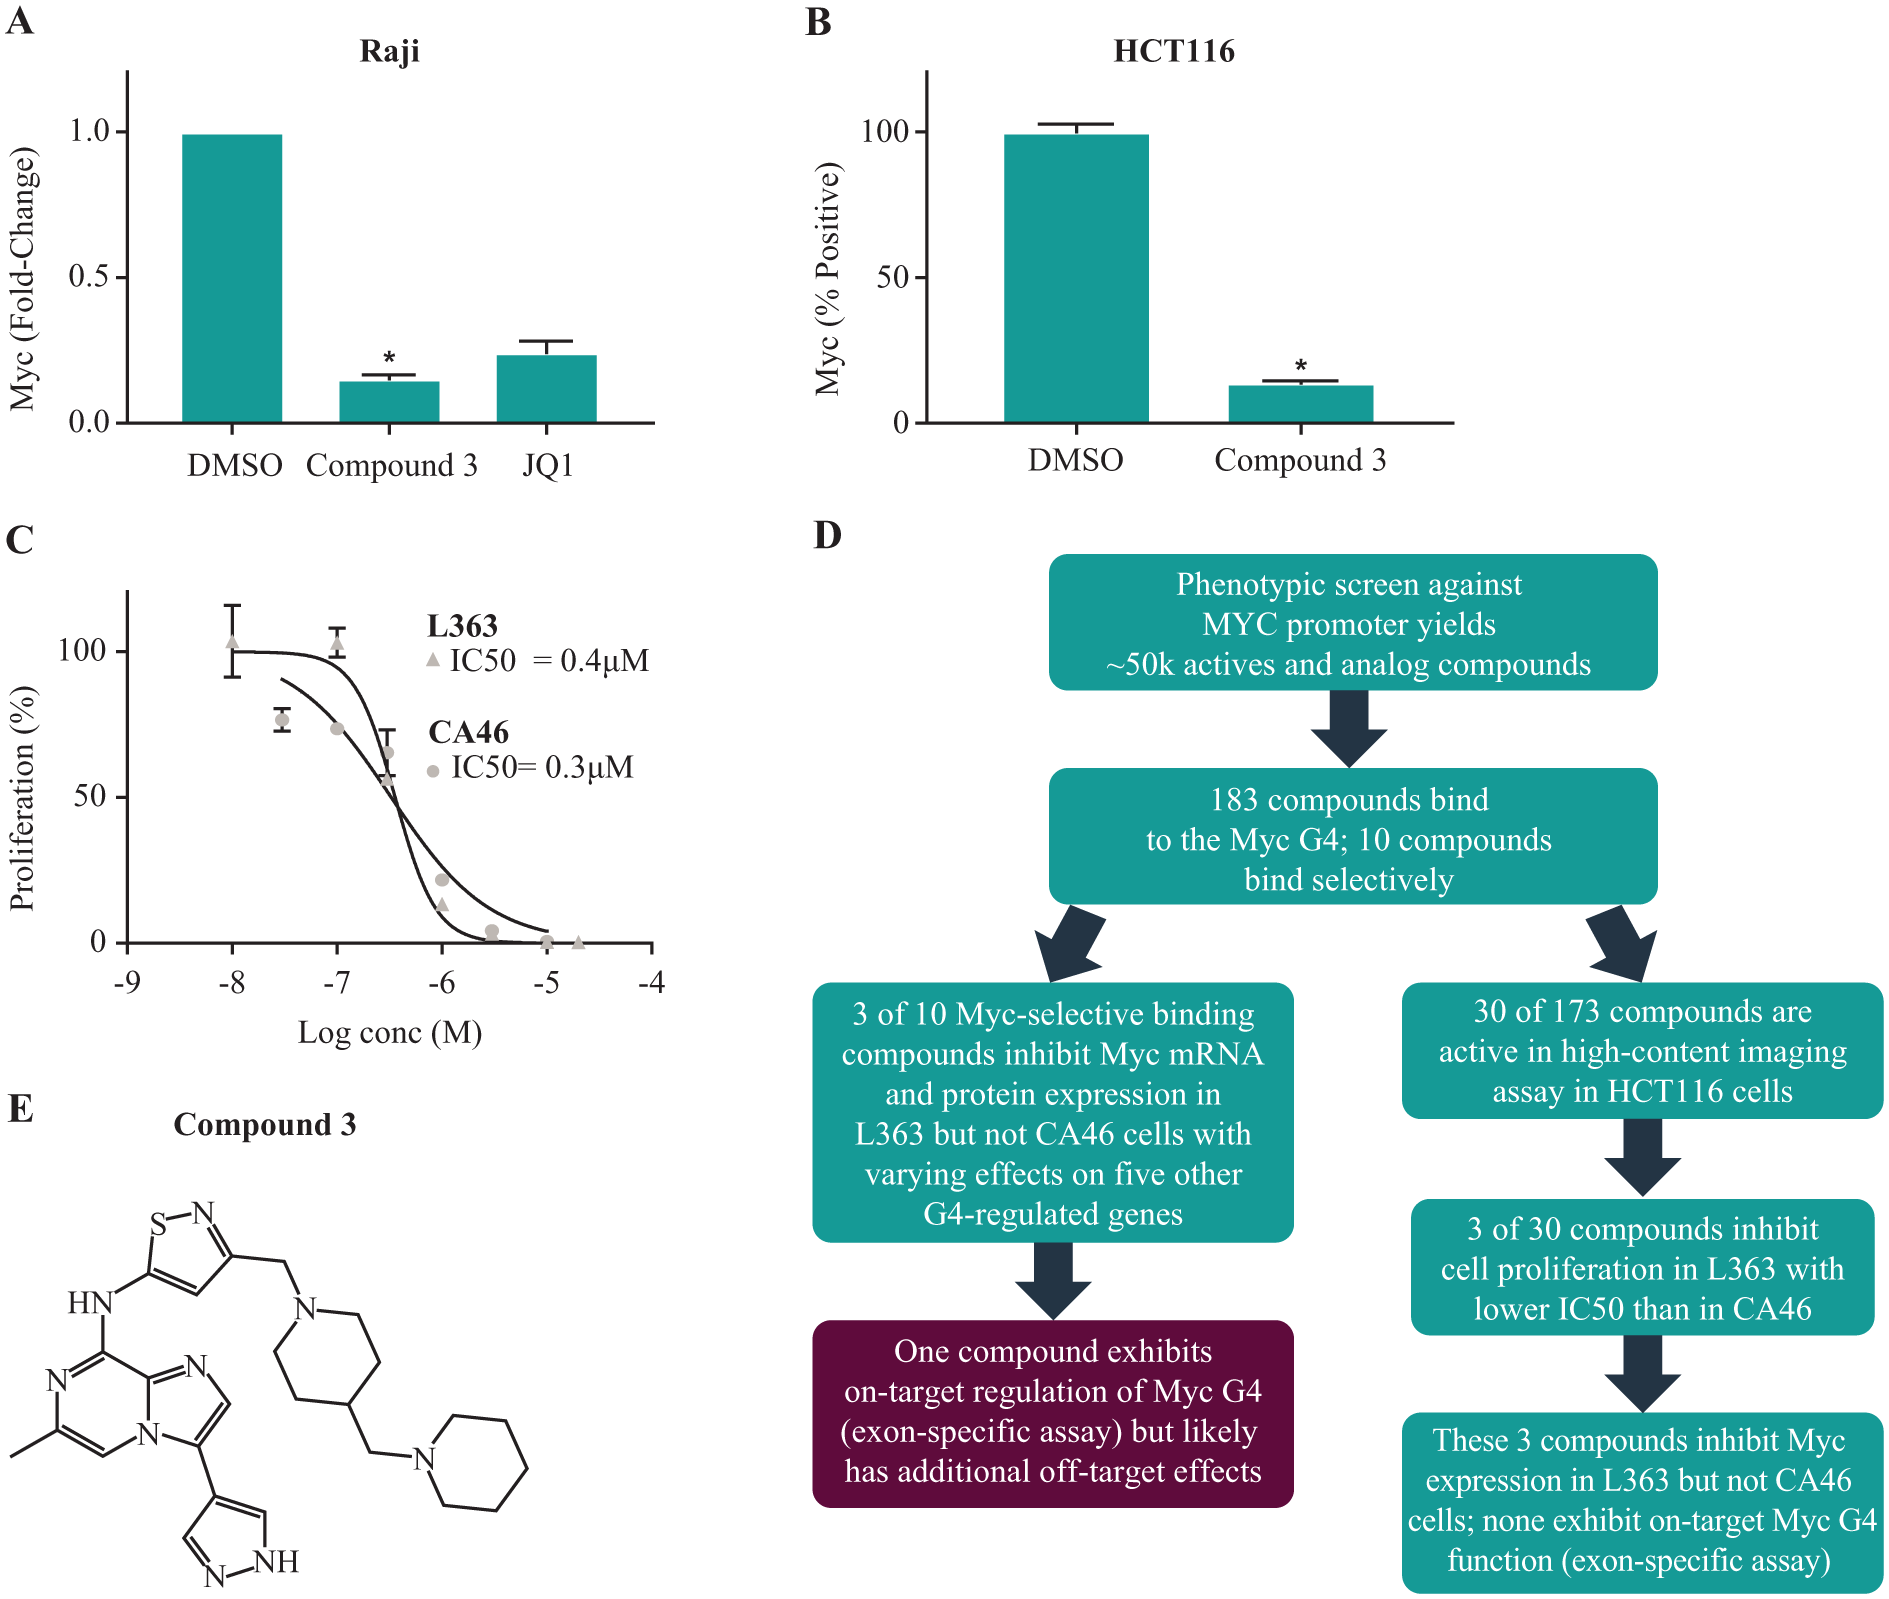
Compound 3 inhibits Myc expression and cell proliferation in several high-Myc-expressing cell lines. (
When we compared cell proliferation curves in L363 and CA46 cells treated with compound 3, we observed similar potency in both cell lines, with 72 h IC50 values of 400 nM in L363 and 300 nM in CA46 cells ( Fig. 5C ). However, at 24 h compound 3 led to more cell death in L363 cells compared with CA46 cells (20.5% vs 6% cell death) as measured by flow cytometry, calculated as the percentage of cells in the sub-G1 population ( Suppl. Fig. S5B ). Flow cytometry also confirmed that Myc protein expression levels were more significantly downregulated in L363 cells (80% decrease in mean Myc expression) compared with CA46 cells (30% decrease) following 24 h of treatment with compound 3 when dead sub-G1 cells were excluded from the measurement ( Suppl. Fig. S3 ). Therefore, although compound 3 more strongly affects Myc expression in L363 cells with possible consequences on cell viability, at later time points a similar effect on cell proliferation is seen in CA46 cells that lack Myc G4 regulation, most likely due to additional off-target effects.
Discussion
In this study, we performed an affinity selection ALIS screen to identify compounds that bind to the Myc G4, a regulatory element within the Myc promoter. ALIS has historically been used in similar screens for identification of protein targets, and has also been recently used to demonstrate compounds binding to RNA.30,31 Here we showed that the ALIS platform can also be used to identify compounds that bind to folded DNA structures, thereby expanding the area of potential drug target space when searching for targets of phenotypic screen hits that function by an unknown mechanism. First, we verified that ALIS could detect the binding of several known Myc G4-binding compounds to a folded Myc G4 structure, with no detectable binding to a nonfolding mutant Myc G4 sequence. Next, we performed a high-throughput ALIS screen to identify binders of the Myc G4 using a large (~50,000) compound library composed of compounds (and compound analogs) that had previously been shown to inhibit Myc expression in an endogenous promoter screen assay but had no known target. Since compounds may bind to G4s of similar structure from different genes, we also screened our compounds for binding to the G4s of five other cancer-related genes. 19 Out of 50,000 compounds screened, we found 183 compounds that bound to the folded Myc G4 in ALIS and 10 compounds that bound selectively to the Myc G4 with no detectable binding to G4s of the five other genes tested (although this is by no means a comprehensive test for complete specificity to the Myc G4). Furthermore, 5 of these 10 Myc-selective compounds as well as >10% of the remaining 173 promiscuous compounds inhibited expression of Myc in high-Myc-expressing cancer cell lines.
Using a variety of phenotypic assays ( Fig. 5D ), we identified three Myc-selective and three promiscuous compounds that inhibited Myc expression in L363 cells, which retain the Myc G4, but not in CA46 cells, which lost G4-mediated regulation of the majority of their Myc expression. These compounds (compounds 1–3 and P1–P3) were initially deemed likely to be targeting Myc expression through binding to the Myc G4, since only the cell line that retains G4 regulation of Myc exhibited a decrease in expression following treatment. However, when we further tested these compounds in the exon-specific assay in CA46 cells,18,33 we found that only one of the Myc-selective compounds (compound 3) preferentially inhibited expression of G4-regulated Myc exon 1 versus exon 2 in this cell line. Compounds 1 and 2 showed no inhibition of exon 1, and compounds P1–P3 led to increased expression of exon 1 at both time points tested (most significantly at 24 h). The exon-specific assay is considered to be more reliable at determining G4 on-target function than simply comparing Myc exon 2 expression in L363 and CA46 cells, which likely have many differences besides the presence or absence of the Myc G4.18,19,33 In vitro, compound 3 bound to the Myc G4 with high affinity (submicromolar Kd), further supporting its on-target function. Thus, compound 3 appears to inhibit Myc expression through Myc G4 binding, while compounds 1 and 2 and P1–P3 may instead be doing so through off-target or indirect effects.
Further exploration of compound 3 activity in cells showed that it inhibited Myc (exon 2) expression in L363, Raji, and HCT116 cells, all of which retain G4-mediated regulation of Myc exon 2, but not in CA46 cells that lack this regulation. Nevertheless, compound 3 likely has additional off-target effects besides the Myc G4: it inhibited expression of several other G4-containing genes in L363 cells; it exhibited equal inhibition of cell proliferation in L363 and CA46 cells, even though the majority of Myc expression is not inhibited by this compound in CA46 cells; and it exhibited some toxicity at early time points in HCT116 cells, suggesting acute effects not mediated solely by Myc inhibition. Previous work has shown that this compound is an Aurora kinase inhibitor (unpublished data; structure shown in Fig. 5E ); inhibition of Aurora kinase can also affect Myc expression, especially at the protein level. 38 Moreover, Aurora kinase inhibition could account for the G2 arrest that we observed in compound 3-treated CA46 cells by flow cytometry ( Suppl. Fig. S5B ), and may also have widespread effects on other genes and proteins that affect cell proliferation. Two Aurora kinase inhibitors from different structural classes failed to achieve Myc exon specificity in CA46 cells, suggesting that this effect is not mediated through Aurora kinase inhibition ( Suppl. Fig. S6 ). Thus, the data support on-target inhibition of Myc expression by compound 3 through Myc G4 binding, but also suggest additional off-target effects in cells that influence gene expression and phenotypic outcome. This highlights the difficulty of finding both on-target and selective G4 inhibitors and confirms the importance of using multiple functional assays to assess activity and selectivity following a binding screen.
A limitation of biochemical screens is that binding does not always determine function, and our study demonstrates that at least in the case of binding to folded G4 structures measured in an ALIS screen, phenotypic assays are required to confirm the functionality and selectivity of these hits in cells. Indeed, half of our 10 Myc-selective ALIS hits did not inhibit Myc expression in Myc G4-containing cell lines, and of the 5 that did, only 1 exhibited the expected result for a Myc G4 on-target effect using the exon-specific assay. Reasons for the differences between binding and function include the possibility that in vitro folded G4s differ structurally from those found in cells and lack accessory proteins that play a physiological role in G4 folding.17,39,40 Moreover, our ALIS screen tested for binding to a prefolded G4 DNA sequence, and compounds that rely on the dynamic nature of these structures, or bind to other versions of the diversity of these structures were possibly missed. Different binding assays also may report different results, even for the same compound and folded G4, due to different assay conditions, such as solution-based versus immobilization-based screening; 41 this may be the case regarding the different G4-binding profiles that we observed for control A compared with published results using surface plasmon resonance (SPR). 19 Thus, our study highlights the importance of follow-up assays in cells as well as the challenge of identifying on-target and selective G4-regulating compounds through binding studies only.
Although an ALIS screen reports binary yes/no binding rather than quantitative binding affinities and thus may under- or overreport relevant binding events, the value of ALIS lies in its ability to rapidly screen many compounds against binding to a target of interest, using small amounts of target in a solution-based format. Multiple targets may also be screened in parallel, which is important in the attempt to determine specificity. Estimates have suggested upwards of 10,000 G4s throughout the genome, with some estimates as high as 700,000.11,13 Many of these G4s, especially those found within the promoters of cancer genes, may have similar structures. In addition, C-rich structures that form on the opposite strand to G4s, known as i-motifs, appear to facilitate rather than inhibit transcription when stabilized,9,42 and some compounds may fail to distinguish between a gene’s G4 and its i-motif. Since it is not possible to test every such structure within the genome, G4 specificity is difficult to prove; our study only tested binding to five off-target genes. Still, some have suggested that unique folding structures of different promoter G4s may make it possible to target individual genes with some selectivity, 4 while others have pointed out that it might not be necessary to target G4s individually, as long as the desired effect (stopping the growth of cancer cells) is achieved. 5 Regardless of these considerations, it is still desirable to attempt to target particular G4s with fewer off-target effects. We believe that ALIS is a useful tool for this goal: with ALIS, one can rapidly test the binding of thousands of compounds simultaneously against a single target, and then easily retest hits against additional targets. 28 Expanding an ALIS screen to include G4s from additional genes, as well as from other areas of the genome (e.g., telomeres), related i-motifs, oligos subjected to a variety of folding conditions, G4-binding proteins, or other targets in a pathway could provide even more information on the selective binding of a compound to a particular target or structure, in parallel with associated cellular assays. Thus, ALIS has the flexibility to test the binding of molecules to multiple targets that might affect a particular pathway. 30 A better understanding of G4 regulation will be necessary in order to design the most biologically relevant screening conditions; as we show here, coupling ALIS with phenotypic screens may also help to elucidate the relevance of in vitro conditions to biological output.
Recent studies have demonstrated, both in cell lines and in mouse xenograft models, the utility of targeting individual G4 and i-motif structures, either alone or simultaneously, in order to achieve inhibition of tumor growth. 43 This approach represents an attractive strategy for the inhibition of difficult-to-target oncogenes. We have demonstrated the use of ALIS as a novel screening approach for the identification of molecules that bind to these DNA targets, providing a starting point for confirmatory phenotypic studies as well as for structure–activity analysis to improve the binding affinity and function of these molecules. This approach also allows one to expand the search for targets of phenotypic screen hits to include nucleic acids that would be missed by other methods. Using ALIS, we have identified a novel Myc G4-binding compound that inhibits Myc expression in several relevant cancer cell lines. Recent genome-wide studies have demonstrated the prevalence of G4 sequences and structures in the promoters of highly expressed cancer genes and near chromosomal breakpoints for these genes, suggesting their physiological importance in the regulation of cancer gene expression,10,13,44 as well as their utility as targets in DNA repair-deficient tumors. 45 Myc G4-binding molecules have shown promise in the regulation of Myc expression, which remains an elusive target in cancer therapy.1,5 The identification of new G4-targeting Myc inhibitor scaffolds could contribute to the development of small molecules for a difficult-to-drug cancer-driving target.
Supplemental Material
Supplemental_Material_For_Identification_of_G-quadruplex_Inhibitors_of_MYC_Expression_Through_Affinity_Selection_Mass_Spectrometry_by_Flusberg_et_al – Supplemental material for Identification of G-Quadruplex-Binding Inhibitors of Myc Expression through Affinity Selection–Mass Spectrometry
Supplemental material, Supplemental_Material_For_Identification_of_G-quadruplex_Inhibitors_of_MYC_Expression_Through_Affinity_Selection_Mass_Spectrometry_by_Flusberg_et_al for Identification of G-Quadruplex-Binding Inhibitors of Myc Expression through Affinity Selection–Mass Spectrometry by Deborah A. Flusberg, Noreen F. Rizvi, Victoria Kutilek, Christine Andrews, Peter Saradjian, Chad Chamberlin, Patrick Curran, Brooke Swalm, Sam Kattar, Graham F. Smith, Peter Dandliker, Elliott B. Nickbarg and Jennifer O’Neil in SLAS Discovery
Footnotes
Acknowledgements
We thank L. Hurley (University of Arizona) and J. Schneekloth (NIH, Bethesda, MD) for reagents, experimental advice, and helpful discussions. We thank I. Cornella-Taracido, A. Wassermann, R. O’Hagan, A. DeCastro (Guertin), M. Demma, R. Afshar, N. Follmer, K. Dunsmore, Y. Liu, and members of the Oncology Discovery Group for discussions. This research received no specific grant from any funding agency in the public, commercial, or not-for-profit sectors.
Supplemental material is available online with this article.
Declaration of Conflicting Interests
The authors declared no potential conflicts of interest with respect to the research, authorship, and/or publication of this article.
Funding
The authors received no financial support for the research, authorship, and/or publication of this article.
References
Supplementary Material
Please find the following supplemental material available below.
For Open Access articles published under a Creative Commons License, all supplemental material carries the same license as the article it is associated with.
For non-Open Access articles published, all supplemental material carries a non-exclusive license, and permission requests for re-use of supplemental material or any part of supplemental material shall be sent directly to the copyright owner as specified in the copyright notice associated with the article.