
Abstract
Infection by Plasmodium falciparum is the leading cause of malaria in humans. The parasite contains a unique and essential plastid-like organelle called the apicoplast that, similar to the mitochondria and chloroplast, houses its own genome that must undergo replication and repair. The putative apicoplast replicative DNA polymerase, POM1, has no direct orthologs in mammals, making the P. falciparum POM1 an attractive antimalarial drug target. Here, we report on a fluorescent high-throughput DNA polymerase assay that relies on the ability of POM1 to perform strand-displacement synthesis through the stem of a DNA hairpin substrate, thereby separating a Cy3 dye from a quencher. Assay-validation experiments were performed using 384-well plates and resulted in a signal window of 7.90 and a Z’ factor of 0.71. A pilot screen of a 2880-compound library identified 62 possible inhibitors that cause more than 50% inhibition of polymerase activity. The simplicity and statistical robustness of the assay suggest it is well suited for the screening of novel apicoplast polymerase inhibitors that may serve as lead compounds in antimalarial drug-discovery efforts.
Keywords
More than 3 billion people live in areas at risk of malaria, and the disease causes an estimated 650,000 deaths per year worldwide. 1 The majority of these deaths occur in African children younger than age 5. Malaria is caused by parasites of the genus Plasmodium, mainly P. falciparum and P. vivax, with the former being the most common and most deadly. 2 Plasmodium is in the phylum Apicocomplexa, the members of which are exclusively animal parasites and are responsible for several human and agricultural diseases, such as toxoplasmosis (Toxoplasma gondii), babesiosis (Babesia bovis), cyclosporiasis (Cyclospora cayetanensis), and coccidiosis (Eimeria falciformis). All of these organisms contain an unusual organelle called the apicoplast. 3 The apicoplast is evolutionarily related to a chloroplast and was obtained through a secondary endosymbiotic event with red algae. 4 The apicoplast has lost its photosynthetic ability, but it has retained the biochemical pathways for the synthesis of isoprenoids, fatty acids, and heme, along with iron–sulfur cluster assembly. 5 The parasite has come to completely rely on the apicoplast for production of isoprenoids. 6 This dependent relationship has brought a great deal of attention to the apicoplast and its potential as a drug target. 7
Because the apicoplast is derived from a chloroplast, it contains its own genome and harbors the proteins necessary for DNA replication, transcription, and translation. 8 At 35 kb, the genome is greatly reduced compared to the chloroplast. Although many of the proteins required for transcription and translation are encoded by the apicoplast genome, all of the DNA replication proteins are encoded in the nuclear genome and are imported into the apicoplast following translation. Inhibition of apicoplast replication, transcription, and translation with antibiotics such as tetracycline and ciprofloxin causes a phenomenon referred to as the “delayed-death” phenotype. 8 When treated with these antibiotics, parasites continue to grow, divide, and produce daughter cells that die instead of establishing productive infections. Although the biological basis of this delayed-death phenotype is poorly understood, it clearly establishes the apicoplast as a target of drug action.
The apicoplast DNA polymerase (POM1; hereafter referred to as apPOL, or apPOLexo− for the exonuclease-deficient mutant) represents an especially attractive target for antimalarial drug development. apPOL is clearly of prokaryotic origin, with its nearest homolog outside of Apicomplexa being the replicative polymerase from the cyanobacteria Cyanothece sp. PCC 8802 (35% identity). 9 The most similar human DNA polymerases are the lesion bypass polymerases theta and nu (23 and 22%, respectively), with the other human DNA polymerases displaying <20% identity. In contrast, there is 84% identity between the apPOLs from the two primary causative agents of human malaria, P. falciparum and P. vivax, suggesting that drugs targeted against the P. falciparum apPOL would be effective in treating P. vivax infections as well. In addition, polymerases appear to be well suited to therapeutic inhibition because there are commercial drugs targeting the polymerases of HIV, herpes simplex virus, hepatitis B virus, and cytomegalovirus. 9
Many assays for DNA polymerase activity have been reported, and several have been used in a high-throughput fashion. To facilitate the high-throughput screening for apPOL inhibitors, we have modified an established assay based on a molecular-beacon DNA substrate for use in high-throughput screening. 10 We have used this assay in a continuous mode to determine kinetic parameters for apPOL and in a quenched-time mode for high-throughput screening of a small library of 2880 compounds. The assay proved to be statistically robust with a Z’ factor of 0.71, a signal window of 7.9, and a signal-to-background ratio of 41. Many potential small-molecule inhibitors were identified in the pilot screen.
Methods
Materials
The 33-mer DNA hairpin substrate (5′-CCTCTCCGTGTC-TTGTACTTCCCGTCAGAGAGG) containing either Cy3 or hexachlorofluorescein (HEX) dyes at the 5′ end, and either Iowa Black® FQ (IBQ) or Black Hole Quencher®-1 (BQ1) quenchers at the 3′ end were purchased from Integrated DNA Technologies. The hairpin contains a 6-nucleotide-long double-stranded stem and 21-nucleotide-long single-stranded loop. A 9-nucleotide primer (5′-GACGGGAAG) that is complementary to a portion of the loop region was obtained from the Iowa State University DNA Facility. Nickel–agarose was bought from the Sigma-Aldrich Chemical Company, deoxyribonucleotides were acquired from Invitrogen or Sigma-Aldrich, chloroquine from Santa Cruz Biotechnology, and aurintricarboxylic acid (ATA) from Acros Organics.
Purification of apPOLexo−
The exonuclease-deficient apPOL (D1470N and E1472Q ) was expressed and purified as previously described with a few exceptions. 11 Cells were lysed in 20 mM Tris–HCl pH 8.0, 500 mM NaCl, and 5 mM imidazole. Clarified lysate was loaded on ~5 mL of Ni–agarose resin and washed with 100 mL of 20 mM Tris–HCl pH 8.0, 500 mM NaCl, and 5 mM imidazole followed by a high-salt wash of 100 mL of 20 mM Tris–HCl pH 8.0, 1 M NaCl, and 25 mM imidazole. Protein was then eluted in a minimal volume of elution buffer containing 20 mM Tris–HCl pH 8.0, 500 mM NaCl, and 150 mM imidazole. The resulting protein was then further purified through size exclusion chromatography using a 320 mL HiLoad 26/60 Superdex 200 equilibrated in 20 mM Tris–HCl pH 8.0 and 400 mM NaCl.
Kinetic Assays
The enzymatic activity of apPOLexo− was determined using the DNA hairpin substrate containing the Cy3 and BQ1 dye–quencher pair ( Fig. 1A ). The reactions were carried out at 25 °C in 20 mM Tris–HCl pH 8.0, 10 mM MgAc, 50 mM KAc, 1 mM DTT, 0.1 mg/ml BSA, and 2% DMSO, and all data were collected on a Cary Eclipse Fluorescence Spectrophotometer using the Cary Kinetics software at an excitation wavelength of 545 nm and an emission wavelength of 570 nm.
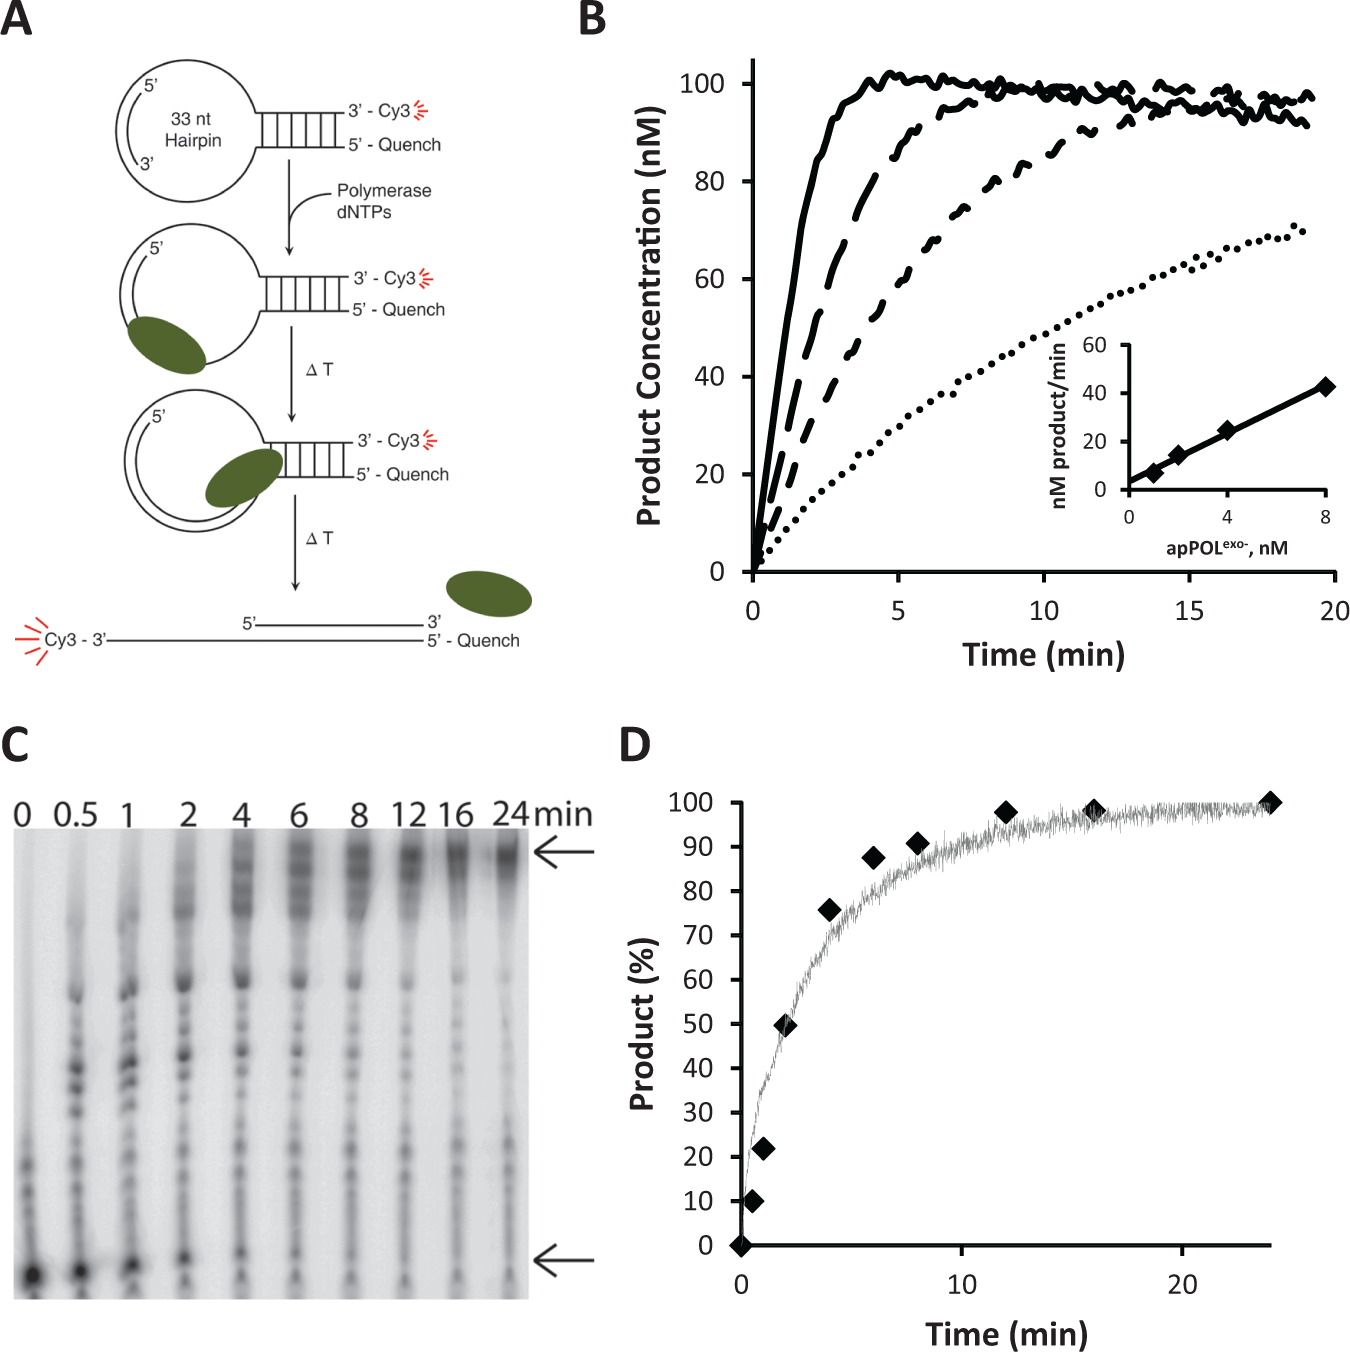
Polymerase activity with the high-throughput DNA substrate. (
To validate that the Cy3 dye was not affecting the rate of apPOLexo− polymerization, two separate reactions were carried out with 3 nM apPOLexo−, 16 µM deoxynucleoside triphosphates (dNTPs) (~5× the KM), and 50 nM DNA substrate (which provided a strong fluorescent signal). In the first reaction, polymerase activity was determined on a Cary Eclipse, as stated above. For the second reaction, the primer that is annealed to the hairpin DNA was radioactively labeled with 32P using T4-polynucleotide kinase (New England Biolabs). The reaction was initiated by mixing equal volumes of apPOLexo− and a mixture containing dNTPs and DNA. Time points were then removed and quenched with 0.1 M ethylenediaminetetraacetic acid (EDTA) and 80% (v/v) formamide. Each time point was analyzed using a 16% denaturing polyacrylamide gel containing 7.5 M urea in a Tris–borate–EDTA buffer. The gel was visualized using a FujiFilm FLA-5100 Fluorescent Image Analyzer and analyzed using ImageJ (National Institutes of Health, Bethesda, MD).
To determine the optimum enzyme concentration and time point for the stopped-time high-throughput assay, the concentration of apPOLexo− was varied from 0 to 8 nM. It was found that for a reaction containing a final concentration of 16 µM dNTPs and 50 nM DNA substrate, 3 nM apPOLexo− led to 50–90% of substrate use over a time course of 7.5 minutes (a convenient time for the HT robotic platform). The steady-state kinetics values (KM for nucleotide and the DNA substrate) were established using 20 nM apPOLexo−. To determine the KM–DNA, the nucleotide concentration was held at 16 µM while the DNA concentration was varied from 0 to 800 nM. To determine the KM–dNTPs, the DNA concentration was held at 50 nM and the nucleotide concentration was varied from 0 to 16 µM. Initial rates were analyzed using the Matlab R2011b software (Mathworks) using the standard Michaelis–Menten equation.
ATA was identified through high-throughput screening as an inhibitor of apPOLexo−. Although ATA has previously been classified as an inhibitor by mimicking DNA, recent studies have shown that this may not always be the case. 16 For this reason, ATA was selected for further kinetic studies. The IC50 of ATA was determined using 16 µM dNTPs, 50 nM DNA substrate, 3 nM apPOLexo−, and varying concentrations of ATA from 0 to 12 µM. ATA was incubated with apPOLexo− in the absence of DNA and nucleotide for several minutes prior to the start of the reaction. The reaction was initiated by simultaneous addition of DNA and dNTPs, and time courses lasted approximately 15 minutes. The slope of the linear portion of the time course was used to determine the initial velocities. The resulting initial velocities were fit with the Matlab R2011b software (Mathworks) using the following equation:
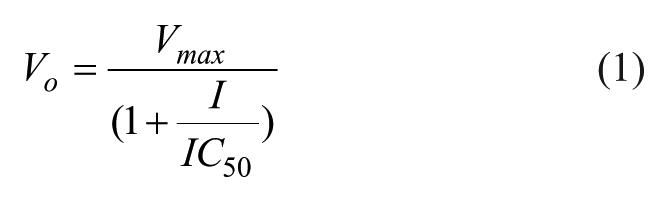
where Vo represents initial velocity, Vmax represents maximum velocity, I is the ATA concentration, and IC50 is the concentration of ATA that produces 50% inhibition.
Determination of the ATA inhibition mechanism was carried out by incubating 20 nM apPOLexo− with varying concentrations of ATA for several minutes. To establish the inhibition mechanism versus nucleotides, the DNA substrate was held constant at 50 nM, and the dNTPs were varied from 0 to 16 µM. To establish the inhibition mechanism versus DNA, the nucleotide was held constant at 16 µM nucleotides, and the DNA substrate was varied from 0 to 800 nM. The resulting data were fit against inhibition models describing competitive, noncompetitive, mixed, and uncompetitive inhibition using the Dynafit 12 software. The best-fitting model was determined using the model discrimination analysis function in the Dynafit software.
Validation Assay and Pilot Screen
The validation assay was performed at the University of Iowa High Throughput Screening Facility. The reaction was carried out with a final concentration of 16 µM dNTPs, 50 nM DNA substrate, and 3 nM of apPOLexo− in 20 mM Tris–HCl pH 8.0, 10 mM MgAc, 50 mM KAc, 1 mM DTT, 0.1 mg/mL BSA, and 2% DMSO in the presence and absence of 8 mM chloroquine. Solutions were loaded into a Nunc 384-well plate (Thermo Scientific) using a MicroLab Pipettor (Hamilton). A 2× protein solution was incubated with 16 mM chloroquine (8 mM final) when applicable, and then mixed with an equal volume of 2× DNA solution to initiate the reaction. After 7.5 minutes at room temperature, the reaction was quenched with 100 mM EDTA. Fluorescence was detected at 545 nm using an Envision High Throughput Plate Reader (Perkin Elmer). Resulting data were analyzed and evaluated for robustness through determination of the signal window and Z’.13,14 Maximum signal values are those resulting from reactions containing no inhibitors, and minimum signal values are background readings with no fluorescent substrate controls.
A 2880-small-molecule pilot screen composed of the Spectrum Collection (composed of 2320 compounds) and University of Iowa Legacy Collection (composed of 560 compounds) was carried out at the University of Iowa High Throughput Screening Facility. The screen took place under the same conditions as the validation assay with a 2× protein solution being incubated with 20 µM (10 µM final) small molecules. Small molecules were added using a Star Robotic Liquid Handler System (Hamilton). Controls containing no protein, 8 mM chloroquine, and no small molecules were performed on each 384-well plate. Fluorescence was detected at 545 nm using an Envision High Throughput Plate Reader. Resulting data were analyzed using Microsoft Excel.
Results and Discussion
Purification of apPOLexo−
The expression of apPOLexo− is extremely robust with yields approaching 50 mg of pure protein per liter of Luria broth. The purified protein is stable at room temperature for up to 8 hours and for at least 1 year frozen at −80 oC. The enzyme is also highly active, 11 enabling a very small amount of protein to be used in each assay (3 nM). In the 384-well format, a single preparation of protein from 1 L of media is adequate to screen more than 13,000 plates.
Fluorescence Assays
The hairpin DNA substrate used here was previously developed by others but contained a carboxytetramethylrhodamine (TAMRA) fluorophore and a Dabcyl quencher. 10 The substrate was used in a continuous DNA polymerase assay in a low-throughput fashion ( Fig. 1A ). 10 Although the assay, as previously reported, is suitable for continuous assays, because of incomplete quenching of the TAMRA dye fluorescence by the Dabcyl quencher, the signal-to-background ratio is relatively low (~fivefold) and is borderline for high-throughput screening. For this reason, we attempted to find a better fluorophore–quencher pair. We initially replaced the pair with hexachlorofluorescein and the Iowa Black® RQ quencher, but saw only modest improvements in the statistical parameters. Using 96-well plates, this dye–quencher pair resulted in a signal window of ~6.6, a Z’ factor of 0.60, and a signal-to-background ratio of 7.1. We then tried the Cy3 fluorophore and BQ1 quencher pair, which resulted in better statistical parameters. Using 96-well plates, the Cy3–BQ1 dye–quencher pair resulted in a signal window of ~8.9, a Z’ factor of 0.73, and a signal-to-background ratio of 9.7. Because some proteins have a strong affinity for dye molecules, we confirmed that the observed rate was linearly dependent on the concentration of apPOLexo− concentration. As seen in Figure 1B , the increase in fluorescent signal is proportional to the amount of apPOLexo− in the reaction, with an apparent-kcat of 4.95 min−1. To directly compare the increase in fluorescence signal to extension of the primer, we 32P labeled the primer strand of the substrate and analyzed the polymerase time course using denaturing urea–polyacrylamide gel electrophoresis ( Fig. 1C ). Comparison of the fluorescence signal with the quantification of the gel indicates that the increase in fluorescence is directly proportional to the amount of primer extended ( Fig. 1D ). The gel analysis also indicates that there is some degree of pausing when apPOLexo− reaches the stem portion of the substrate, where it must perform strand-displacement synthesis to separate the fluorophore from the quencher. We then used the assay in continuous mode to determine the steady-state kinetic parameters of apPOLexo−, which resulted in apparent-KM values of 3.4 ± 1.0 µM and 305 ± 99 nM for dNTPs and DNA, respectively ( Fig. 2 ). These values are in close agreement with those determined using the standard 32P-labeled primer-extension assay. 11
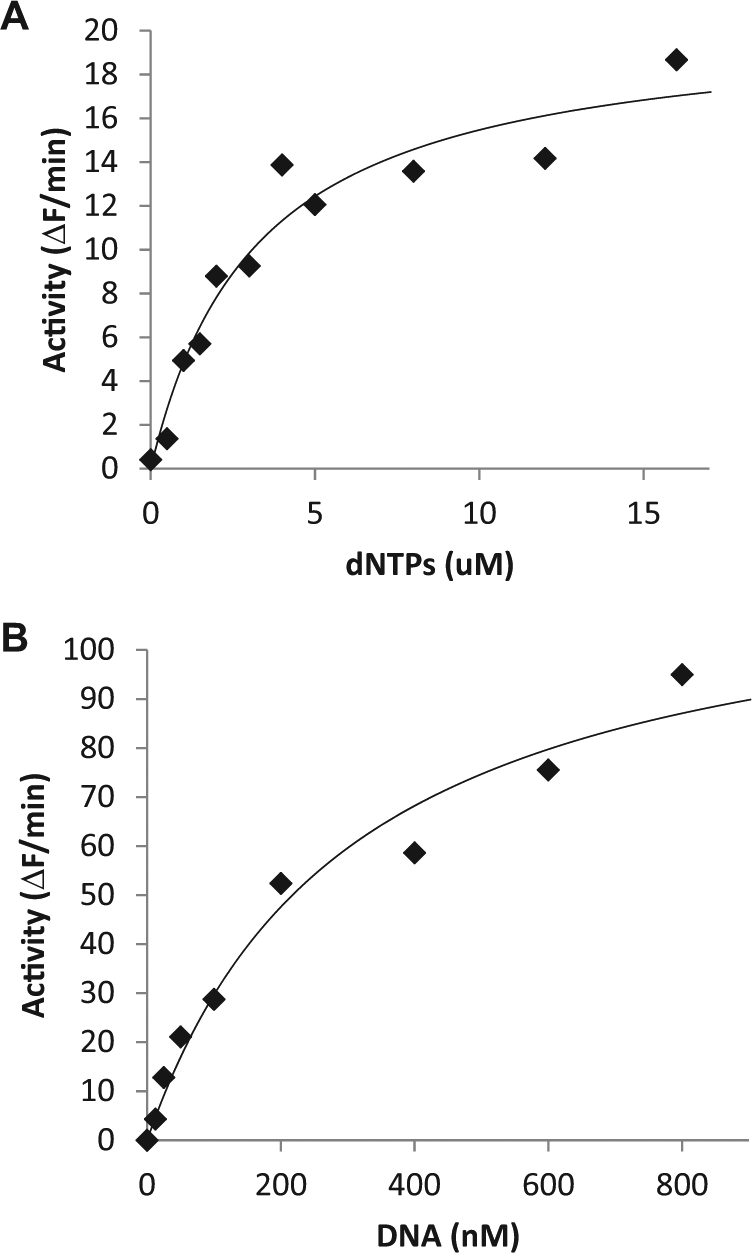
Steady-state kinetics of apPOLexo−. The fluorescent hairpin substrate was used, and initial rates were determined from continuous time courses. The initial rates (points) were fit to a steady-state mechanism, and the best fit is represented by the line. (
High-Throughput Assay and Pilot Screen
Following the tests using 96-well plates, the assay was validated for high-throughput screening using 384-well plates. Half of the plate was used as a minimum signal reference (8 mM chloroquine and 3 nM polymerase), and the other half was used as the maximum signal control (3 nM polymerase added). The reactions were initiated by the addition of DNA and nucleotide, and all wells were quenched with EDTA after 7.5 minutes. The plates were analyzed, and resulting values for the signal window, Z’ factor, and signal-to-background ratio were determined to be 9.27, 0.71, and 17.96, respectively.
We next performed a pilot screen using the Spectrum Collection and the University of Iowa Legacy Collection ( Fig. 3 ). The screen consisted of nine 384-well plates with the first two columns of each plate reserved for reference wells (no polymerase addition), the upper half of the last two columns for the fully inhibited reaction (8 mM chloroquine), and the lower half of the last two columns for the uninhibited reaction (polymerase addition only). The average fluorescent signals from the fully active and inhibited reactions were 1638 ± 143 (signal-to-noise of 11) and 39 ± 14 (signal-to-noise of 2.8), respectively. These data were used to calculate values for the signal window, Z’ factor, and signal-to-background ratio of 7.9, 0.71, and 42, respectively. The increase in the signal-to-background ratio compared to the initial characterization is due to an optimization of the plate-reader photomultiplier voltage prior to fluorescence acquisition.
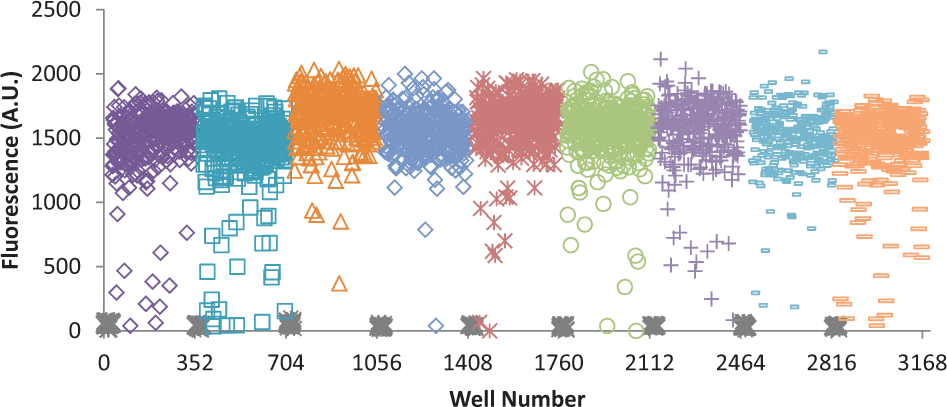
High-throughput pilot screen. The small-molecule pilot screen of the Spectrum Collection (2320 compounds) and the University of Iowa Legacy Collection (560 compounds) resulted in 62 hits that inhibit polymerase activity by at least 50%. No polymerase controls (gray X’s that occur periodically near the bottom of the graph) were performed on each of the nine 384-well plates. Each symbol type represents the results from an individual 384-well plate.
The pilot screen identified 62 compounds that resulted in a fluorescence signal of less than 700 (i.e., causing more than 50% inhibition), giving a hit rate of approximately 2.1%. Among these 62 compounds were several nonspecific inhibitors of nucleic acid enzymes, such as DNA intercalators (e.g., ethidium bromide, epirubicin, and acriflavine) and known or suspected DNA mimics (e.g., suramin and ATA). It is expected that nonspecific inhibitors can be removed by using this assay to perform counterscreens against a panel of selected DNA polymerases (e.g., Escherichia coli Pol I and human pol γ). In addition to removing compounds that act as DNA intercalators and mimics, the counterscreens would also identify compounds that may be interfering with the fluorescent signal of the DNA substrate and/or product. Alternatively, an orthogonal assay similar to the one shown in Figure 1C could be used to rule out dye interference.
ATA was selected for determination of its inhibition mechanism because it appears to be capable of multiple inhibition mechanisms depending on the enzyme it is acting on. Although it is generally assumed that the ATA polymerizes and acts as a nonspecific DNA mimic 15 (i.e., competitive with DNA), recent studies using HCV helicase found that ATA was competitive with adenosine triphosphate and noncompetitive with DNA. 16 To determine the inhibition of ATA for apPOLexo−, we first measured the dose–response of ATA under our standard assay conditions and determined the IC50 to be 0.9 ± 0.2 µM ( Fig. 4A ). We then determined the inhibition mechanism of ATA against dNTPs. The concentrations of ATA and dNTPs were varied above and below their IC50 and KM, respectively, and the resulting data were fit to a variety of inhibition mechanisms using the Dynafit software. 12 The best-fitting mechanism for ATA versus dNTPs was true noncompetitive with Ki–ATA and KM–dNTPs values of 0.99 ± 0.08 µM and 3.6 ± 0.5 µM, respectively.
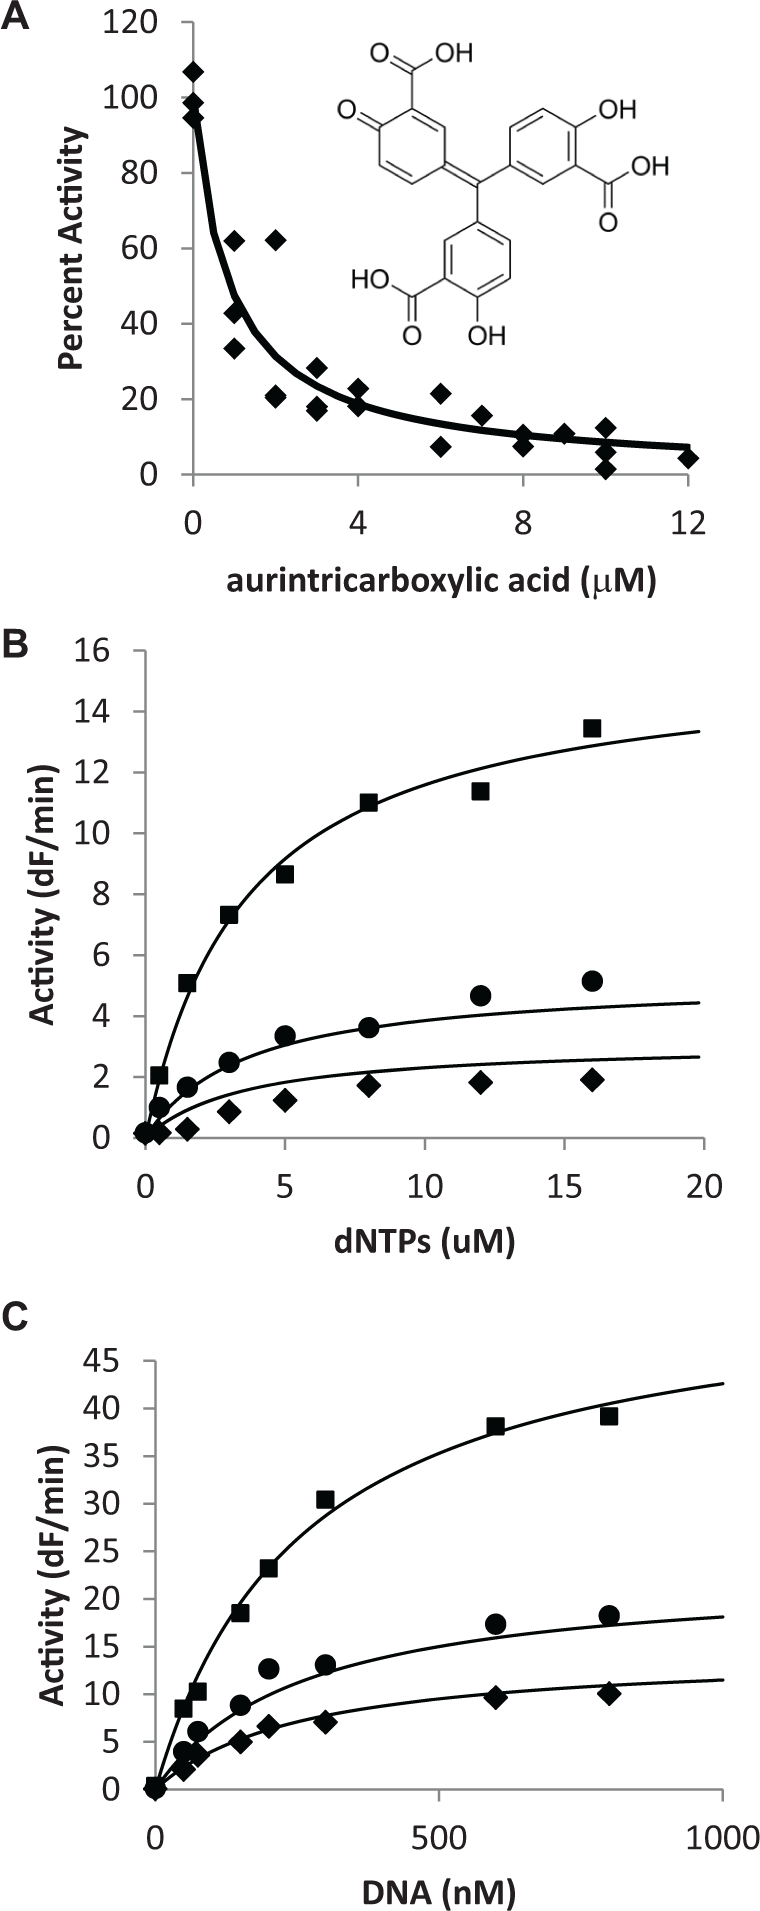
Mechanism of aurintricarboxylic acid (ATA) inhibition. (
We also determined the inhibition mechanism of ATA against the DNA substrate. Again, the concentrations of ATA and DNA were varied, and the data were fit to several possible inhibition mechanisms. The best-fitting mechanism was true noncompetitive with a Ki–ATA and KM–DNA of 1.47 ± 0.09 µM and 261± 15 µM, respectively. Because the inhibition mechanism of ATA is true noncompetitive against both dNTPs and DNA (i.e., the binding of ATA does not affect the apparent-KM’s for the substrates), the two determined Ki’s and the IC50 values should be the same. We have determined values of 0.90, 0.99, and 1.47 µM for the IC50, Ki (against dNTPs), and Ki (against DNA), respectively, which are all in reasonable agreement with each other. In addition, the apparent-KM values determined using the data shown in Figure 2 correspond very well to the KM values determined using the data in Figure 4B and Figure 4C (3.4 and 3.6 µM for KM–dNTPs and 305 and 261 nM for KM–DNA, respectively). Based on this analysis, it appears that in the case of apPOLexo−, ATA is not acting simply as a DNA mimic, but binds to the enzyme at a unique site that does not directly overlap with either the nucleotide- or DNA-binding site.
In conclusion, we have improved on a previously developed DNA polymerase assay by altering the fluorophore and quencher pair, thereby increasing its dynamic range. We found that the assay provides steady-state kinetic parameters that are comparable to the traditional 32P-based assay and is both highly sensitive and reproducible using 96- and 384-well plates. A pilot screen resulted in excellent statistical parameters (Z’ factor and signal window) and identified a number of potential inhibitors of the apPOLexo− DNA polymerase. We used the assay to determine the kinetic inhibition mechanism of ATA and somewhat unexpectedly found that it was not behaving as a DNA mimic but was noncompetitive against both dNTPs and DNA. The robustness of the modified assay strongly suggests that it is well suited to the screening of much larger small-molecule libraries in an effort to identify inhibitors of the P. falciparum apicoplast DNA polymerase that can serve as lead compounds in antimalarial drug-discovery efforts.
Footnotes
Acknowledgements
The authors would like to thank Meng Wu and the High Throughput Screening Facility at the University of Iowa for assistance with the high-throughput screening.
Declaration of Conflicting Interests
The authors declared no potential conflicts of interest with respect to the research, authorship, and/or publication of this article.
Funding
The authors disclosed receipt of the following financial support for the research, authorship, and/or publication of this article: this work was supported by The Roy J. Carver Charitable Trust (grant number 10-3603) and Iowa State University.