
Abstract
In vitro analysis of covalent inhibitors requires special consideration, due to the time-dependent and typically irreversible nature of their target interaction. While many analyses are reported for the characterization of a final candidate, it is less clear which are most useful in the lead optimization phase of drug discovery. In the context of identifying covalent inhibitors of Bruton’s tyrosine kinase (BTK), we evaluated multiple techniques for characterizing covalent inhibitors. Several methods qualitatively support the covalent mechanism of action or support a particular aspect of interaction but were not otherwise informative to differentiate inhibitors. These include the time dependence of IC50, substrate competition, mass spectrometry, and recovery of function after inhibitor removal at the biochemical and cellular level. A change in IC50 upon mutation of the targeted BTK C481 nucleophile or upon removal of the electrophilic moiety of the inhibitor was not always a reliable indicator of covalent inhibition. Determination of kinact and KI provides a quantitative description of covalent interactions but was challenging at scale and frequently failed to provide more than the ratio of the two values, kinact/KI. Overall, a combination of approaches is required to assess time-dependent, covalent, and irreversible inhibitors in a manner suitable to reliably advance drug candidates.
Introduction
Bruton’s tyrosine kinase (BTK) is a Tec family, nonreceptor tyrosine kinase involved in immunoreceptor activation. Its action is critical for downstream signaling in B cells, mast cells, osteoclasts, eosinophils, macrophages, and other hematopoietic cells. 1 In B cells, BTK is needed for efficient activation of the B-cell receptor, leading to antibody production.2,3 In mast cells, the action of BTK is required for FcεRI-induced signaling, leading to the coordinated release of inflammatory cytokines and histamine. 4 In other myeloid cells, like neutrophils, macrophages, and monocytes, BTK is essential for cytokine production upon cross-linking of FcγRI. 5 In most of these instances, BTK is known to act downstream of spleen tyrosine kinase (SYK), where it activates phospholipase C gamma 2, leading to Ca2+ flux and ultimately to cellular activation. 6
BTK is well-known from studies in humans where mutations in the btk gene on the X chromosome have been shown to cause X-linked agammaglobulinemia (XLA), a condition that leaves affected individuals with few B cells and little to no antibody production. 2 Therefore, it is believed that suppression of BTK function could ameliorate disorders involving autoreactive B cells and autoantibodies, such as rheumatoid arthritis and systemic lupus erythematosus, or in allergic/hypersensitivity responses, including systemic anaphylaxis, allergic asthma, allergic rhinitis, and atopic dermatitis. Moreover, BTK is critical for hematopoietic cancers such as leukemias and lymphomas. The covalent BTK inhibitor ibrutinib has been granted breakthrough therapy designation by the Food and Drug Administration for relapsed or refractory mantle cell lymphoma, Waldenström’s macroglobulinemia, chronic lymphocytic leukemia, and chronic graft-versus-host disease. As developing additional therapies that target BTK may lead to improved therapies for both immunological and oncological diseases, many pharmaceutical companies are pursuing differentiated BTK inhibitors.
There has been considerable recent activity using the strategy of covalent inhibition, with BTK and ibrutinib as a notable example. BTK is one of 11 protein kinases that contain a cysteine located a few residues C-terminal to the hinge region in the kinase active site at a position that frequently contains serine. 7 This 11-member “cysteine kinome” contains several targets for drug discovery.8–12 In addition, several examples of covalent inhibitors have recently been reported to target other moieties on protein kinases as well as target classes beyond kinases.13,14 With this interest comes the requirement to adapt drug discovery processes to accommodate the unique properties of covalent inhibitors. In the course of investigating covalent BTK inhibitors for autoimmune diseases, we discovered some of the common methods for characterizing target interactions of covalent inhibitors to be more useful than others and some to not add value. This study discusses the utility of these methods specifically in the context of informing iterative medicinal chemistry efforts in real time, as opposed to confirmatory studies on a small number of late-stage drug candidates. Recommendations and cautions are provided for applying the various approaches to characterize covalent inhibitors.
Materials and Methods
Materials
Tamatinib (R406), CC-292, and RN486 were made by WuXi AppTec, Shanghai, China.
Measurement of BTK Activity and Inhibition
Recombinant human catalytic domain BTK(393–659) was expressed in SF9 cells with an N-terminal His6 tag and purified by immobilized metal affinity chromatography. BTK catalytic activity was measured using a time-resolved fluorescence resonance energy transfer (TR-FRET)-based method to detect phosphorylated peptide. BTK (9 nM, final) was mixed with peptide substrate (biotin-TYR1, sequence: biotin-(Ahx)-GAEEEIYAAFFA-COOH, 0.2 µM final) at various inhibitor concentrations in reaction buffer: 50 mM MOPSO, pH 6.5, 10 mM MgCl2, 2 mM MnCl2, 2.5 mM DTT, 0.01% bovine serum albumin (BSA), 0.1 mM Na3VO4, and 5% DMSO. ATP concentration was 0.01 mM, and reaction volume was 40 µL. After incubation at room temperature for 60 min, the reaction was quenched by addition of EDTA (final concentration 100 mM) and developed by addition of detection reagents at final concentrations of 30 mM HEPES, pH 7.0, 0.06% BSA, 0.006% Tween-20, 0.24 M KF, 80 ng/mL PT66K (europium-labeled anti-phosphotyrosine antibody, Cisbio, Bedford, MA), and 0.6 µg/mL SAXL (phycolink streptavidin-allophycocyanin acceptor, Prozyme, San Leandro, CA). The mixture was incubated in the dark for 60 min at room temperature. TR-FRET counts were measured on a Rubystar BMG plate reader using a 337 nm laser for excitation and monitoring emission at 665 nm. TR-FRET counts at each inhibitor concentration were converted to percent response relative to control wells without inhibitor (100%) or without BTK (0%). IC50 values were calculated by least-means-squares fitting to percent response = 100/(1 + ([inhibitor]/IC50)).
Preparation and Use of C481S BTK
Recombinant human catalytic domain C481S BTK(387–659) was expressed in SF9 cells with an N-terminal His6 tag with a cleavable tobacco etch virus protease tag and purified by immobilized metal affinity chromatography followed by size-exclusion chromatography. Kinase inhibition assays with C481S BTK were done as described above for wild-type BTK catalytic domain, except 2 nM C481S BTK was used, due to slightly higher specific activity.
Recovery of BTK Activity after Inhibitor Dilution
A 400 nM sample of BTK was preincubated for 30 min at room temperature with 1.8 µM tamatinib or inhibitor 1. Afterwards, samples were diluted 400-fold into enzymatic reaction buffer. A time course for enzymatic activity was generated out to 24 h by quenching wells at various time points, and product was resolved as described above for the activity assay.
Recovery of BTK Cellular Occupancy after Inhibitor Dilution
Ramos cells (ATCC cat. CRL-1596, Manassas, VA) were maintained at 37 °C and 5% CO2. Culture medium was RPMI (Invitrogen cat. 21870-075, Waltham, MA) supplemented with 10% heat-inactivated fetal bovine serum (Invitrogen cat. 10438-026) and 1% penicillin and streptomycin (Invitrogen cat. 15140-122). Cells were seeded at 5 × 10⁵ cells/mL in culture medium for 16–18 h before testing. Cells were centrifuged at 1000 rpm for 5 min, resuspended in culture medium, and plated at 1.4 × 10⁵ cells/well in 100 µL. DMSO compound stocks were diluted 1:300 in culture medium, and 50 µL was added to each well to achieve 1 µM final. Compounds were incubated with cells at 37 °C and 5% CO2 for 30 min, and then inhibitor was removed by two cycles of centrifugation, supernatant removal, and cell resuspension with 100 µL of medium. Cells were held at 37 °C and 5% CO2 for 0, 4, or 24 h prior to addition of 200 µL of lysis buffer (R&D Systems 890713 [Minneapolis, MN], plus protease inhibitor cocktail, Calbiochem 20-201). After centrifuging lysed cells for 5 min at 1000 rpm, supernatants were collected and stored at −20 °C. The amount of unmodified BTK was determined by a variation of the method of Evans et al. 15 This used a biotinylated acrylamide-containing BTK probe and an ELISA that utilizes streptavidin-coated plates (R&D Systems, cat. CP004), an anti-BTK antibody (Cell Signaling, cat. 8547S), and a horseradish peroxidase-coupled secondary antibody (Invitrogen, cat. G21234).
Intact Mass Spectrometry
Samples were prepared by incubating 2.9 µM wild-type BTK catalytic domain or 3.0 µM C481S BTK (preparation of each described above) with or without 10 µM inhibitor, in a final volume of 25 µL. The buffer contained 5% DMSO, 50 mM MOPSO, pH 6.5, 10 mM MgCl2, 2 mM MnCl2, 2.5 mM DTT, 0.01% BSA, and 0.1 mM Na3VO4. Samples were incubated for 2 h at room temperature and stored at −80 °C before analysis. The liquid chromatography–tandem mass spectrometry (LC-MS/MS) system consisted of a capillary pump high-performance liquid chromatography (HPLC) with a temperature-controlled autosampler and an internal column oven coupled to an a6538 QTOF system (Agilent Technologies, Santa Clara, CA) with a dual-spray electrospray ionization source, using Mass Hunter software version B.03.01 (Agilent Technologies) for operation and data acquisition. For intact molecular weight measurements, 8 µL of sample in phosphate-buffered saline at 0.1 mg/mL was injected using an 8 µL sample loop onto a Vydac C4 300 Å column (1 × 15 cm, 5 µm; Nest Group, Southborough, MA). The column temperature was maintained at 30 °C, and separation was performed using a linear gradient from 30% B to 75% B over 20 min using mobile phase A (99:1 water/acetonitrile containing 0.09% formic acid and 0.01% trifluoroacetic acid [v/v]) and mobile phase B (99:1 acetonitrile/water containing 0.09% formic acid and 0.01% trifluoroacetic acid [v/v]). The mass spectrometer was operated in a positive ion mode in the extended dynamic range of 2 GHz using the dual spray with a reference mass of 922.00979 Da. Data were acquired from 400 to 3200 m/z at 7.18 spectra/s using the following acquisition parameters on the electrospray ionization source: gas temperature 350 °C, drying gas 12 L/min, nebulizer 60 psig, VCap 4500 V, fragmentor 275 V, skimmer 85 V, and Oct RF Vpp 750 V. Spectra were processed using maximum entropy deconvolution (mass range 32,000–35,000 Da, mass step 1.0 Da, S/N 200, m/z range 950–1175 Da).
Determination of kinact, KI, and kinact/KI from Total Progress Curve Analysis
Covalent inhibition is generally described by eq 1:
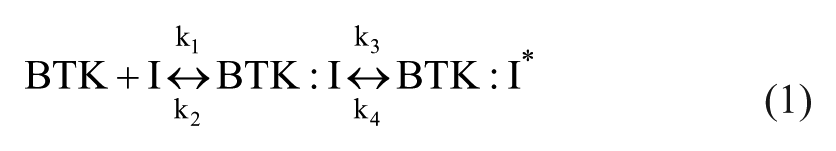
where BTK:I is a noncovalent complex that subsequently converts to a covalent complex BTK:I*. The model in eq 1 also applies to noncovalent inhibitors that undergo a noncovalent isomerization of the enzyme–inhibitor complex. When applying eq 1 to covalent inhibitors, adduct formation is described by kinact, which is equal to k3 when covalent inhibition is irreversible and k4 = 0. KI, the inhibitor concentration that provides half of the rate described by kinact, is equivalent to (k2 + k3)/k1. Note that this is distinct from the inhibitor equilibrium binding constant Ki = k2/k1. To measure kinact and KI, complete enzymatic activity progress curves were generated using 9 nM recombinant BTK enzyme in the same reaction buffer as above and variable reaction times (0–45 min) with inhibitor. These data were fit to the equation P = (Vi/kobs)*(1-e−kobs*t) to extract kobs values. 16 The resulting kobs values were plotted as a function of inhibitor concentration and fit to
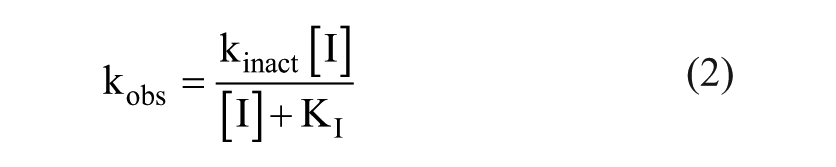
to determine the rate constant of covalent adduct formation (kinact) and the inhibitor concentration at one-half of kinact (KI). Where curvature on the secondary plot was insufficient to interpret saturation, data were fit to a linear function from which the slope provides the ratio kinact/KI. Values were not corrected for the effect of ATP substrate competition on inhibitor binding because the 10 µM ATP used is below KM ( Suppl. Fig. S1 ) and the correction would be minimal.
Cheng and colleagues describe a method that uses the initial rates of such total progress curves to determine inhibitor affinity Ki. 17 Changes in initial rates with inhibitor will follow a sigmoidal relationship in which the inhibitor concentration at the midpoint is KI = (k2 + k3)/k1. If one assumes a rapid binding equilibrium, according to Cheng, 17 then the measured midpoint KI = (k2 + k3)/k1 reduces to the equilibrium Ki = k2/k1. The validity of that assumption is likely to vary, and so we interpret this value as KI and refer to it as such. Initial rates were determined from the slopes of progress curves during the first 4–6 min, and IC50 values were determined as described above.
Statistics
IC50 values are represented as geometric mean with standard error of the mean. All other results are expressed as arithmetic mean with standard error of the mean. Figures are plotted with errors bars representing standard error of the mean of two technical replicates. Figure legends provide values derived from the data shown, while Results and Table 1 provide averages from multiple experiments.
Comparison of Kinetic Constants from Different Methods.
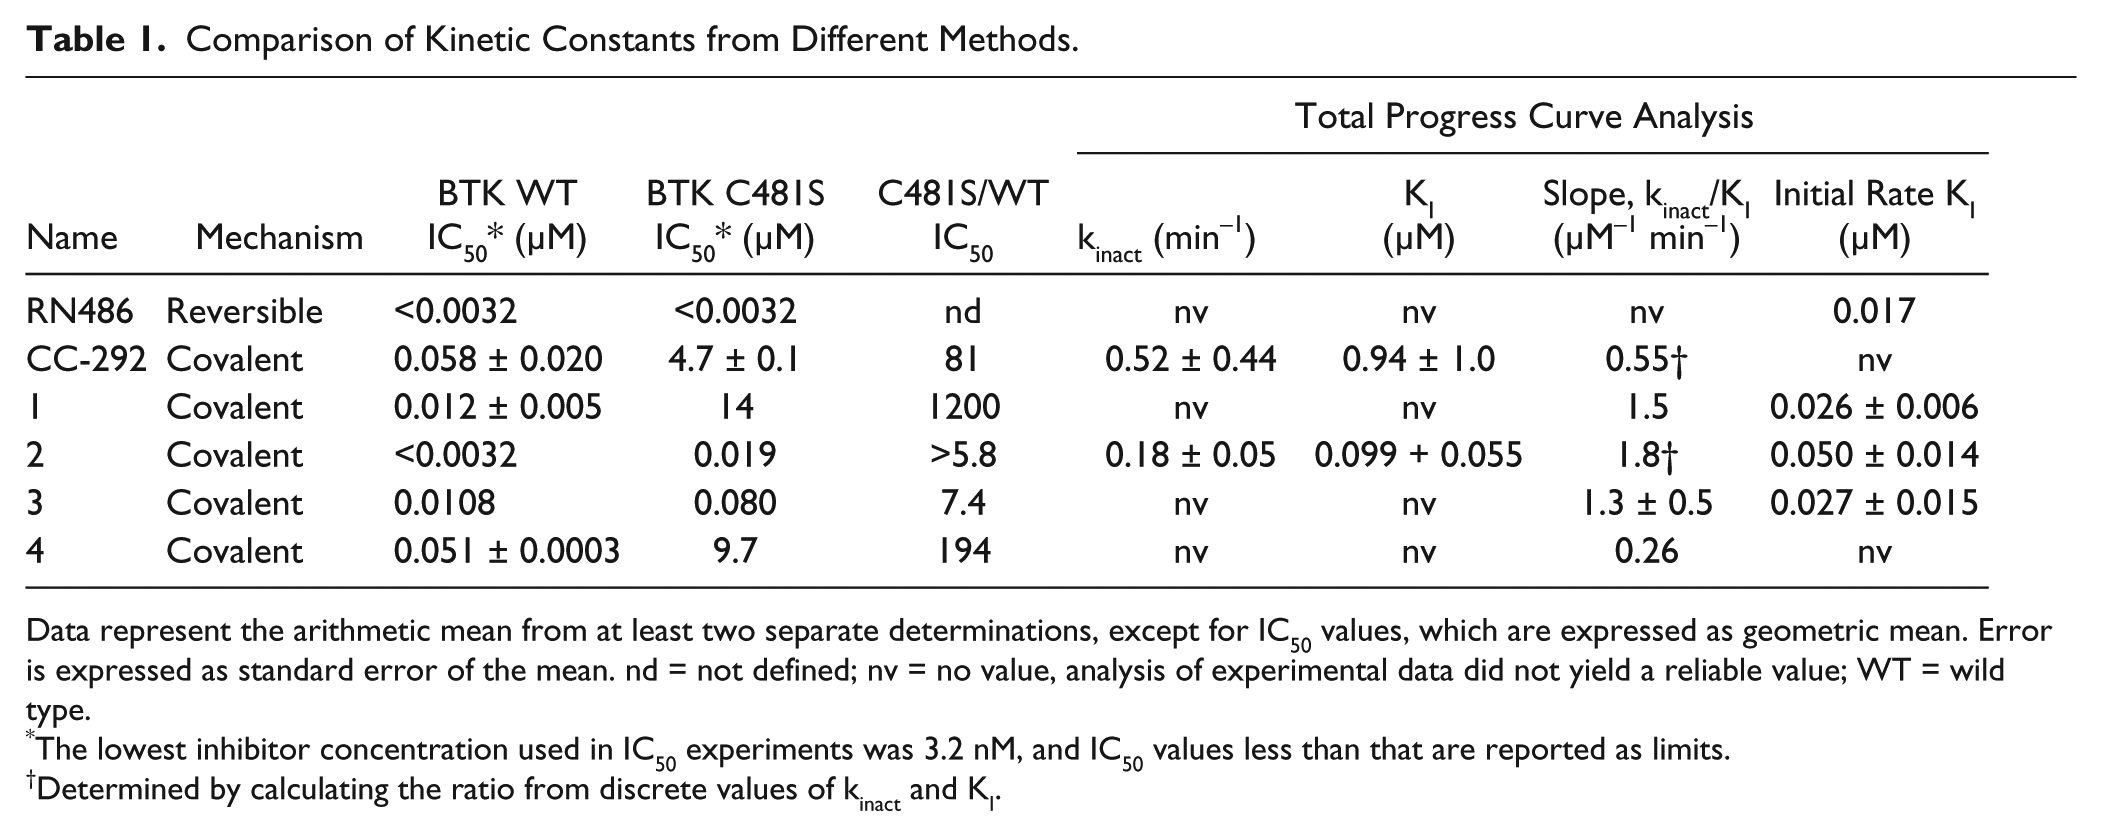
Data represent the arithmetic mean from at least two separate determinations, except for IC50 values, which are expressed as geometric mean. Error is expressed as standard error of the mean. nd = not defined; nv = no value, analysis of experimental data did not yield a reliable value; WT = wild type.
The lowest inhibitor concentration used in IC50 experiments was 3.2 nM, and IC50 values less than that are reported as limits.
Determined by calculating the ratio from discrete values of kinact and KI.
Results
Inhibition of Enzymatic Activity in IC50 Format
Figure 1A shows inhibition of BTK enzymatic activity in a high-throughput IC50 assay with tamatinib (R406, the active drug species of the pro-drug fostamatinib, R-788). Tamatinib is a reversible inhibitor of SYK, BTK, and additional protein kinases. 18 Tamatinib has an IC50 for BTK of 0.24 ± 0.1 µM (N = 384) when there is no preincubation between the enzyme and target. The IC50 for tamatinib does not change after a 2 h preincubation (0.23 ± 0.1 µM [N = 6]). The IC50 for the acrylamide-containing BTK inhibitor CC-292 15 is time dependent, decreasing from 0.058 ± 0.02 µM (N = 11) without preincubation to 0.004 ± 0.001 µM (N = 3) after a 2 h preincubation.

Dependence of IC50 on time and substrate concentration. () and 0.17 µM at 120 min ( ). IC50 values for CC-292 are 1.2 µM at 0 min (
 ) and 0.0094 µM at 120 min (
 ). (
). ( ), 100 (), and 1,000 (
 ) µM ATP are 0.17, 0.35, and 2.8 µM, respectively. (), 100 (), and 1,000 () µM ATP are 0.014, 0.089, and 0.76 µM, respectively. (), y = 7.5e-4x + 0.10, and CC-292 (), y = 2.7e-4 + 0.11. Values given are from this experiment, and average values from multiple experiments are given in the text and in Table 1.
Active Site Protection in Enzymatic Activity IC50 Assays
Increasing concentrations of the substrate ATP upwardly deflect the BTK IC50 values for both the reversible inhibitor tamatinib and the covalent inhibitor CC-292 in a linear manner ( Fig. 1B–D ). This substrate competition/protection method indicates that ATP and the inhibitor are mutually exclusive in their interactions with BTK.
Recovery of BTK Activity after Inhibitor Dilution
The recovery of enzymatic activity was measured by preincubating 400 nM BTK with 1.8 µM inhibitor, diluting the sample into the reaction mixture 400-fold to perturb the equilibrium, and then measuring the time course of product formation. Two examples are shown in Figure 2A that differ in their mechanism. After such treatment with the reversible inhibitor tamatinib, enzymatic activity is indistinguishable from that of enzyme treated without inhibitor. In contrast, pretreatment with the acrylamide-containing inhibitor 1 results in a lack of significant enzymatic activity after dilution, demonstrating functionally irreversible inhibition.
Durability of BTK inhibition after inhibitor dilution or removal. (), inhibitor 1 ( ), or DMSO control (). (
Recovery of BTK Cellular Occupancy after Inhibitor Dilution
A biotin-labeled, active site-directed acrylamide probe was used to measure BTK occupancy after preincubation and removal of 1 µM inhibitor from Ramos B cells ( Fig. 2B ). Relative to DMSO-treated cells, only modest amounts of unmodified BTK were found at 4 or 24 h after removal of acrylamide-containing inhibitor CC-292 or inhibitor 1. Similar results were found for 11 additional acrylamide-based inhibitors (not shown). This experiment demonstrates a durable depletion of unmodified BTK in a cellular setting.
Covalent Adduct Formation by Mass Spectrometry
Mass spectrometry of BTK incubated in the presence of CC-292 showed an increase of 423 Da compared with enzyme incubated with a DMSO control ( Suppl. Fig. S2 ). This precisely matches the expected molecular weight of CC-292 and indicates that a covalent BTK adduct was formed with a single equivalent of drug. RN486 was reported to be a reversible inhibitor of BTK. 19 Incubation of BTK with RN486 resulted in no change in detected BTK mass ( Suppl. Fig. S2 ).
Removal of the Nucleophilic Moiety from BTK in Enzymatic Activity IC50 Assay
C481 occurs at a position in the active site of BTK that is occupied by serine in most protein kinases where BTK and 10 other kinases contain cysteine. 7 Since the cysteine sulfhydryl is far more reactive than the serine hydroxyl, the C481S mutant was generated to assess the extent to which interaction of electrophilic BTK inhibitors depends on the targeted active site nucleophile, an approach used previously with BTK and other enzymes.20–22 C481S BTK was generated and found to have retained its catalytic properties, possessing a specific activity and ATP KM comparable to that of the wild type ( Suppl. Fig. S1 ). With the assay normally executed at 10 µM ATP, slightly below KM in both cases, this allowed a direct comparison without changing or correcting for ATP concentration. Figure 3A exemplifies the acrylamide-containing inhibitor 1, for which the IC50 changes from 0.012 ± 0.005 µM (N = 6) for wild-type BTK to 14 µM (N = 1) for the C481S mutant, greater than a 1000-fold change. However, the extent to which IC50 changes with the C481S mutant is quite different across a series of molecules known to have a covalent mechanism, and the ΔIC50 does not correlate with potency toward the wild-type enzyme ( Fig. 3B ). Note that potency is a problematic term when the IC50 is known to be time dependent. An IC50 method was employed herein in order to evaluate this approach as employed in the literature. Several inhibitors that lack an electrophile were also profiled in wild-type and C481S BTK activity assays ( Fig. 3B , open circles), and these correlated well, suggesting a lack of any profound structural changes between the protein constructs. Preincubation of C481S BTK with three different acrylamide-containing inhibitors failed to provide an increase in mass when analyzed by mass spectrometry ( Suppl. Fig. S3 ), confirming the site of modification.
Inhibition of enzymatic activity upon removal of the targeted nucleophile or electrophile. Inhibitor IC50 values were determined in a 1 h enzymatic activity assay, without preincubation with inhibitor. (), or with C481S BTK, IC50 = 12 µM (). Values given are from this experiment, and average values are in Table 1. () or do not possess () an electrophilic moiety. ().
Removal of the Electrophilic Moiety from the Inhibitor in Enzymatic Activity IC50 Assays
A series of analogs were generated in which the acrylamide was changed to the corresponding propionamide, which is not electrophilic. IC50 values for these inhibitors were generated according to the standard method and are compared to their parent molecules in Figure 3C . The IC50 for CC-292 is 0.058 ± 0.02 µM (N = 11), and the IC50 for the propionamide analog of CC-292 is 7.6 ± 3.1 µM (N = 2), as indicated by the open circle in Figure 3C . In some cases, IC50 values were up to 1000-fold greater in the absence of the Michael acceptor ( Fig. 3C ). However, in 8 of the 16 examples, propionamide IC50 values were within fivefold of the corresponding acrylamide. This approach suffers from the same concerns noted above in comparing wild-type and C481S BTK constructs in IC50 assays.
Measurement of kinact, KI, and kinact/KI , from Total Enzymatic Progress Curve Analysis
Measuring discrete kinact and KI terms is potentially useful for individually optimizing the chemical reactivity and apparent binding, respectively, of covalent inhibitors. The method of analyzing total enzymatic reaction progress curves 16 was utilized because alternative methods, such as that of Kitz and Wilson, 23 are unlikely to provide sufficient throughput to inform lead optimization activities. Enzymatic progress curves for several concentrations of acrylamide-containing inhibitor 2 ( Fig. 4A ) and inhibitor 1 ( Fig. 4C ) demonstrate a time-dependent loss in reaction velocity. Data in Figure 4A , C were fit as described in Materials and Methods to extract kobs values that describe the exponential transition from a finite initial velocity to a terminal velocity of zero. Figure 4B depicts the replot of kobs values as a function of inhibitor concentration for inhibitor 2. Fitting these data to eq 2 provides kinact = 0.21 min−1 and KI = 0.14 µM for the experiment shown. Values in Table 1 reflect averages of two separate experiments. The analogous replot for inhibitor 1 in Figure 4D demonstrates a lack of saturation of kobs up to 100 nM inhibitor. At higher inhibitor concentrations, the small amplitude and rapid rate preclude generation of reliable data. Inspection of eq 2 demonstrates that the slope approaches kinact/KI when KI >> [I]. From this, the slope in Figure 4D provides kinact/KI = 1.5 µM−1 min−1. For comparison, when the reversible inhibitor RN486 was analyzed by the total progress curve method, negligible amplitude and concentration dependence were associated with any exponential phase ( Suppl. Fig. S4 ). Analysis of five acrylamide-containing inhibitors by this method revealed saturation kinetics for only two, suggesting that the method would not consistently provide discrete kinact and KI values in our program. It was possible in all cases to determine the ratio kinact/KI from the slope of the secondary plots ( Table 1 ).
Determination of kinact and KI from complete activity progress curves. (), 0.13 (), 0.063 (), 0.031 (), 0.016 ( ), 0.0078 (◊), and 0 (
 ) µM. Curves were fit to Product = (Vi/kobs)*(1-e−kobs*t) to obtain values for kobs, which were normalized by subtracting kobs without inhibitor. (), 0.05 (), 0.025 (), 0.013 (∆), 0.0063 (), 0.0031 (◊), and 0 () µM. Curves in panel
Determination of KI from Initial Rates of Enzymatic Progress Curves
Initial rates extracted from progress curves in Figure 4 were also used to determine KI according to Cheng and colleagues 17 ( Suppl. Fig. S5 ). It was possible to extract interpretable sigmoidal curves for four of the six molecules in Table 1 , with variability from the small amount of overall signal as the limiting factor.
Discussion
Through the course of screening and refining BTK covalent inhibitors in a medicinal chemistry program, we used multiple approaches to analyze their properties. Below, we compare the utility of the methods with an emphasis on the throughput and robustness necessary during lead optimization, which in the current example involved evaluating more than 2000 molecules.
The IC50 assay format provides unambiguous evidence that candidate molecules inhibit the enzyme activity of their target. However, the IC50 value obtained with a covalent inhibitor is time dependent ( Fig. 1A ). Reliance on a single-reaction time point will fail to identify time-dependent inhibition, and so testing at a second time point can indicate this for all but the most reactive molecules. It is critical that incubation times be carefully controlled to enable a direct comparison between molecules. In addition, the ability to discriminate between the most active molecules may be lost if the assay time is too long. A particular benefit of the IC50 approach is its ease in working with automation and data analysis tools, and IC50 assays can provide a rank order of inhibitors over 5–6 orders of magnitude, superior to other methods. Analytical solutions to the time dependence of a set of five to seven IC50 curves have been used elsewhere to extract values for KI and kinact.24,25 Published examples are exclusive to the study of cytochrome P450 monooxygenases and possess sufficient precision to distinguish differences within a set of IC50 values wherein the total spread was only two- to fivefold. We note, however, that this precision is rarely achieved for in vitro pharmacology applications.
Even when focusing on kinact, KI, or kinact/KI to optimize molecules, it will be necessary to generate IC50 values for comparison to data sets that require concentration-based units (liability panels, cellular IC50 values, in vivo drug concentrations, etc.). However, selectivity ratios will change with incubation time and must be used with care. To enable a meaningful kinome comparison, we calibrated to an external panel by profiling at a covalent inhibitor concentration that provided 80% BTK inhibition in the vendor’s assay, corresponding to the percent of BTK occupancy targeted in animal models. 26 The concept is to align on the same percent response that must originate from a similar drug–time area under the curve (AUC), regardless of obvious differences in those systems. Such a calibration enables broad selectivity estimates at a relevant AUC, rather than just a concentration. Differences in selectivity between molecules tested under the same conditions could be interpreted as relative improvements. Selectivity hits may also be covalent in nature and require appropriate follow-up studies.
A covalent inhibitor can distinguish itself from a reversible inhibitor by exhibiting time-dependent changes in IC50, as exemplified in Figure 1 . While time dependence is common for irreversible inhibitors, it is not strictly diagnostic. Slow-binding reversible inhibitors are well precedented, and irreversible inhibition can occur on a timescale too rapid for many IC50 protocols to resolve. Additional studies are therefore required to establish irreversibility and covalent bond formation, as discussed below.
A natural ligand should protect a target from reacting with an electrophilic molecule at a site for which it and the ligand are mutually exclusive, as shown in Figure 1 . Active site protection with increasing ATP concentration does not discriminate reversible from covalent inhibitors. Modification of undesired sites is anticipated to be noncompetitive with substrate, 27 and so this method may help identity nuisance inhibitors, many of which can also be time dependent. We note that this method may require excellent inhibitor solubility, because high concentrations may be necessary to fully inhibit at higher substrate concentrations.
Recovery of BTK function (in a biochemical or cellular context) can be measured after dilution or removal of inhibitor. Such methods uniquely demonstrate durable inhibition of the drug target’s function. In this study, durable inhibition was observed up to 24 h after inhibitor dilutions ( Fig. 2A ). This 24 h time point was chosen to be relevant to potential once-daily dosing, but many enzymes will not have sufficient thermal stability for a 24 h reaction. In most cases, separation methods are limited in throughput, and some may result in variable enzyme recovery. It is also important to consider that a stoichiometric amount of inhibitor remains after the dilution. Thus, when the Ki for a reversible inhibitor is comparable to the final enzyme concentration (typically low nanomolar), stoichiometric inhibitor concentrations can be sufficient to cause significant inhibition after the dilution step. This can make a reversible inhibitor appear to have durable inhibition, although the effect can be mitigated in some cases by the addition of a large excess of substrate. Also, reversible but slowly dissociating inhibitors may appear to be irreversible, particularly in cases where low thermal stability of the enzyme precludes long incubation after the separation step.
In order to be useful, any cellular drug washout method must be at least as rapid as the kinetics under investigation and must provide a robust readout after the necessary manipulations. In our case, we observed that recovery of unoccupied BTK occurred with similar kinetics for all molecules studied ( Fig. 2B ). The half-life for reappearance of unoccupied BTK was greater than 24 h, somewhat slower than the reported half-life of BTK of 8–17 h. 28 Interleukin-2 kinase (ITK) also contains a cysteine in the analogous position to C481 in BTK. Treatment with an acrylamide-containing inhibitor was reported to decrease the rate of ITK protein turnover. 29 Transient inhibition with a covalent inhibitor has been reported to be sufficient for extended blockade of Janus kinase 3 (JAK3) function in primary mouse T cells, despite rapid JAK3 resynthesis in human T cells.21,30 These complications indicate that the cellular washout can be challenging to interpret without additional studies, and we recommend using it to address biological questions of target protein turnover and pharmacodynamics (or target vulnerability, according to Tonge 31 ) more than to inform inhibitor optimization.
Demonstrating loss of drug interaction upon mutating the residue targeted by a covalent inhibitor has been used to confirm that mechanism of action.20–22 The BTK C481S mutant retains sufficiently similar catalytic properties to the wild type to use the same activity assay as a means of comparison between constructs ( Suppl. Fig. S1 ). But quantifying the change in IC50 upon C481 mutagenesis involves an inappropriate comparison. In Figure 3B , IC50 for wild-type BTK is a surrogate for inhibitor binding kinetics, while IC50 for C481S BTK is a surrogate for inhibitor binding equilibrium (Ki). One could argue for a more rigorous analysis than relying on IC50 values in this mutagenesis approach, but kinact/KI, kinact, and even KI (which is not equal to Ki) are not equilibrium values. In this study, electrophile-containing inhibitors incurred up to 10,000-fold losses in IC50 with C481S BTK compared with the wild type, but many display no difference ( Fig. 3B ). We also note that the ΔIC50 toward C481S BTK is not predicted simply by the wild-type IC50 or by any of the parameters in Table 1 . The ΔIC50 for a series of analogous acrylamides and propionamides was also found to not provide a predictable response ( Fig. 3C ). While BTK C481S enzyme could result in an altered inhibitor binding pose for some molecules, propionamides will certainly have a different geometry than their unsaturated acrylamide analogs. A quantitative interpretation of removing either the nucleophilic or electrophilic moieties to determine a covalent interaction is problematic for the conceptual reasons above. Additionally, there is no means to empirically define a ΔIC50 threshold above which a covalent mechanism could be concluded, and so we do not recommend quantitative approaches here. Instead, mass spectrometry analysis of wild-type and C481S BTK ( Suppl. Figs. S2 and S3 ) after treatment with acrylamide inhibitors indicated that this approach is useful in qualitatively confirming irreversible adduct formation.
Analysis by mass spectrometry provides clear evidence of irreversible, covalent modification of the protein. Modification of a single equivalent of CC-292 demonstrates specificity to the covalent addition. We analyzed six additional acrylamide-containing inhibitors and found in all cases the addition of one equivalent of the appropriate molecular mass (not shown). When combined with proteolytic digestion, mass spectrometry can also define the modified residue. As performed in this work, mass spectrometry is confirmative of the irreversible and covalent modalities of inhibition but remains largely qualitative in that it does not provide any rank order. It also does not address reversible, covalent inhibition. With sufficient throughput, mass spectrometry could in principle be used to measure kinact and KI and provide a single approach to address all aspects of covalent inhibition.
Measuring kinact and KI is potentially useful in optimizing each component through iterative cycles of medicinal chemistry, and these values enable modeling of pharmacodynamics with the appropriate time dependence. At a throughput of one molecule per experiment, we found employing the total progress curve analysis to be challenging at scale. For three of our five covalent inhibitors, a lack of saturation of kobs with inhibitor concentration resulted in failure to provide more than the ratio kinact/KI. The low frequency at which we observed saturation of kobs may reflect a facile kinact, such that association (k1) is rate limiting and little saturation of binding can be observed under experimental conditions. The current study with BTK might be a special case, driven by the relatively low pKa of BTK C481. 28 It may also be a general feature of covalent inhibitors that have been highly optimized.
Cheng and colleagues analyzed the initial rate portion of similar activity progress curves for covalent epidermal growth factor receptor (EGFR) inhibitors to extract inhibitor–response curves. 17 Such analysis of our BTK experiments provided inhibitor response data of sufficient quality to interpret a KI value in four of six cases ( Table 1 , Suppl. Fig. S5 ), with insufficient signal in two cases. This initial rate KI method is in essence an activity-based IC50 in which one assumes minimal covalent bond formation within the first few reaction minutes and will be valid only for molecules for which kinact is slow with respect to binding. In that respect, we recommend using either the more robust IC50 or the more accurate activity progress curve methods.
Table 2 provides considerations in applying these methods to particular scenarios in drug discovery, and a recommended workflow follows here. The IC50 (or percent inhibition) approach is most suitable for high-throughput screening in lead identification. Importantly, IC50 values fail to describe how target inhibition changes over time. During lead optimization, the IC50 approach can be applied to rank-order molecules, with the same caveats and concerns. Moreover, IC50 values are unavoidable as a comparator in selectivity estimates, with the concerns and limitations discussed above.
Recommendations in Applying Methods to Characterize Covalent Inhibitors.
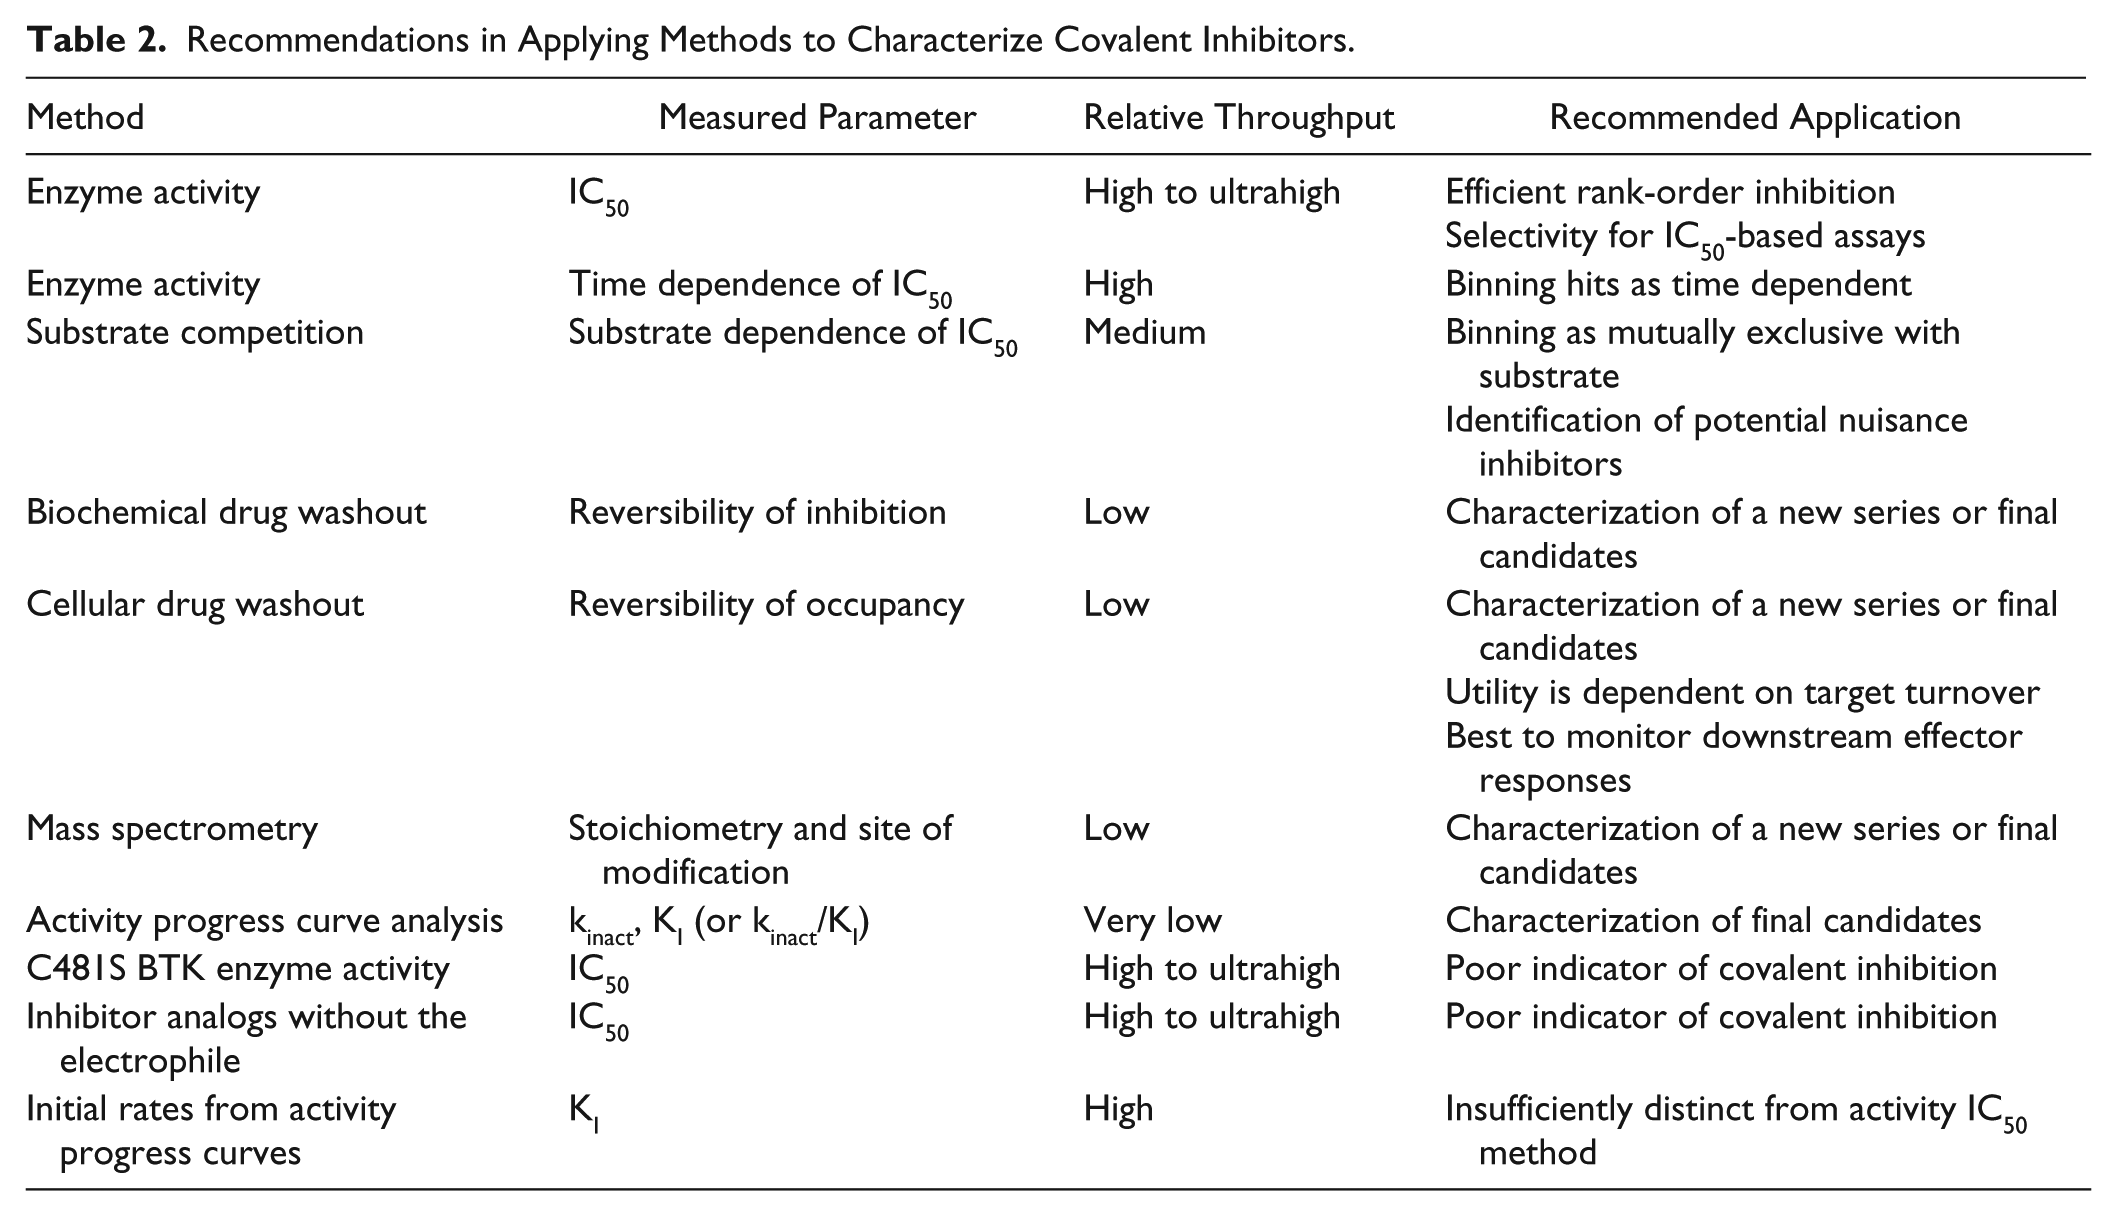
Substrate competition provides qualitative information that is unlikely to change within a chemotype, and we recommend it only to bin hit series and identify nuisance compounds. The measured change in IC50 upon mutation of the targeted active site nucleophile or upon replacing the acrylamide moiety with propionamide was found to provide unpredictable changes within a series of covalent inhibitors. We do not recommend that such changes in IC50 be used to assess a covalent interaction. Instead, mass spectrometry will qualitatively define irreversible adduct formation, and it can provide the number and site(s) of modification. It also has the potential to discriminate molecules if employed in kinetic mode, but throughput would typically restrict that to a late-stage analysis.
We recommend employing biochemical or cellular washout studies in establishing irreversible function early for a chemical series and as a critical characterization of final candidate molecules. The value of interim testing will vary with the likelihood of reversibility, for example, depending on the electrophile–nucleophile pairing. Factors such as the rate of target cellular turnover and the sensitivity of the signaling pathway to target inhibition must also be investigated in parallel. Determination of kinact and KI is potentially powerful in its ability to more fully describe inhibitor–target interactions. This method is most likely to be useful in the differentiation of a limited number of final candidate molecules for whom accurate prediction of pharmacodynamics properties from kinact, KI, or kinact/KI is critical. 27 Overall, a combination of approaches is required to assess the properties of time-dependent, covalent, and irreversible inhibition.
Supplemental Material
Supplemental_Material_Covalent_BTK_by_Harris,_et_al – Supplemental material for Merits and Pitfalls in the Characterization of Covalent Inhibitors of Bruton’s Tyrosine Kinase
Supplemental material, Supplemental_Material_Covalent_BTK_by_Harris,_et_al for Merits and Pitfalls in the Characterization of Covalent Inhibitors of Bruton’s Tyrosine Kinase by Christopher M. Harris, Sage E. Foley, Eric R. Goedken, Mark Michalak, Sara Murdock and Noel S. Wilson in SLAS Discovery
Footnotes
Acknowledgements
The authors would like to thank Gary Overmeyer and David Banach of AbbVie for protein production; Jillian Johnson, former AbbVie intern, for assay development; and Tao Li for helpful discussions.
Supplemental material is available online with this article.
Declaration of Conflicting Interests
The authors declared the following potential conflicts of interest with respect to the research, authorship, and/or publication of this article: Authors C.M.H., E.R.G., M.M., S.M., and N.S.W. are employees of AbbVie. S.E.F. contributed to this work while an AbbVie employee. The design, study conduct, and financial support for this research were provided by AbbVie. AbbVie participated in the interpretation of data, review, and approval of the publication.
Funding
The authors disclosed receipt of the following financial support for the research, authorship, and/or publication of this article: All authors are/were employees of AbbVie. The authors received no additional financial support for the research, authorship, and/or publication of this article.
References
Supplementary Material
Please find the following supplemental material available below.
For Open Access articles published under a Creative Commons License, all supplemental material carries the same license as the article it is associated with.
For non-Open Access articles published, all supplemental material carries a non-exclusive license, and permission requests for re-use of supplemental material or any part of supplemental material shall be sent directly to the copyright owner as specified in the copyright notice associated with the article.