
Abstract
Over the past years, improvements in high-throughput screening (HTS) technology and compound libraries have resulted in a dramatic increase in the amounts of good-quality screening hits, and there is a growing need for follow-on hit profiling assays with medium throughput to further triage hits. Here the authors present such assays for the colony-stimulating factor 1 receptor (CSF1R, Fms), including tests for cellular activity and a homogeneous assay to measure affinity for inactive CSF1R. They also present a high-throughput assay to measure target residence time, which is based on competitive binding kinetics. To better fit koff rates, they present a modified mathematical model for competitive kinetics. In all assays, they profiled eight reference inhibitors (imatinib, sorafenib, sunitinib, tandutinib, dasatinib, GW2580, Ki20227, and J&J’s pyrido[2,3-d]pyrimidin-5-one). Using the known biochemical selectivities of these inhibitors, which can be quantified using metrics such as the selectivity entropy, the authors have determined which assay readout best predicts hit selectivity. Their profiling shows surprisingly that imatinib has a preference for the active form of CSF1R and that Ki20227 has an unusually slow target dissociation rate. This confirms that follow-on hit profiling is essential to ensure that the best hits are selected for lead optimization.
Keywords
Introduction
C
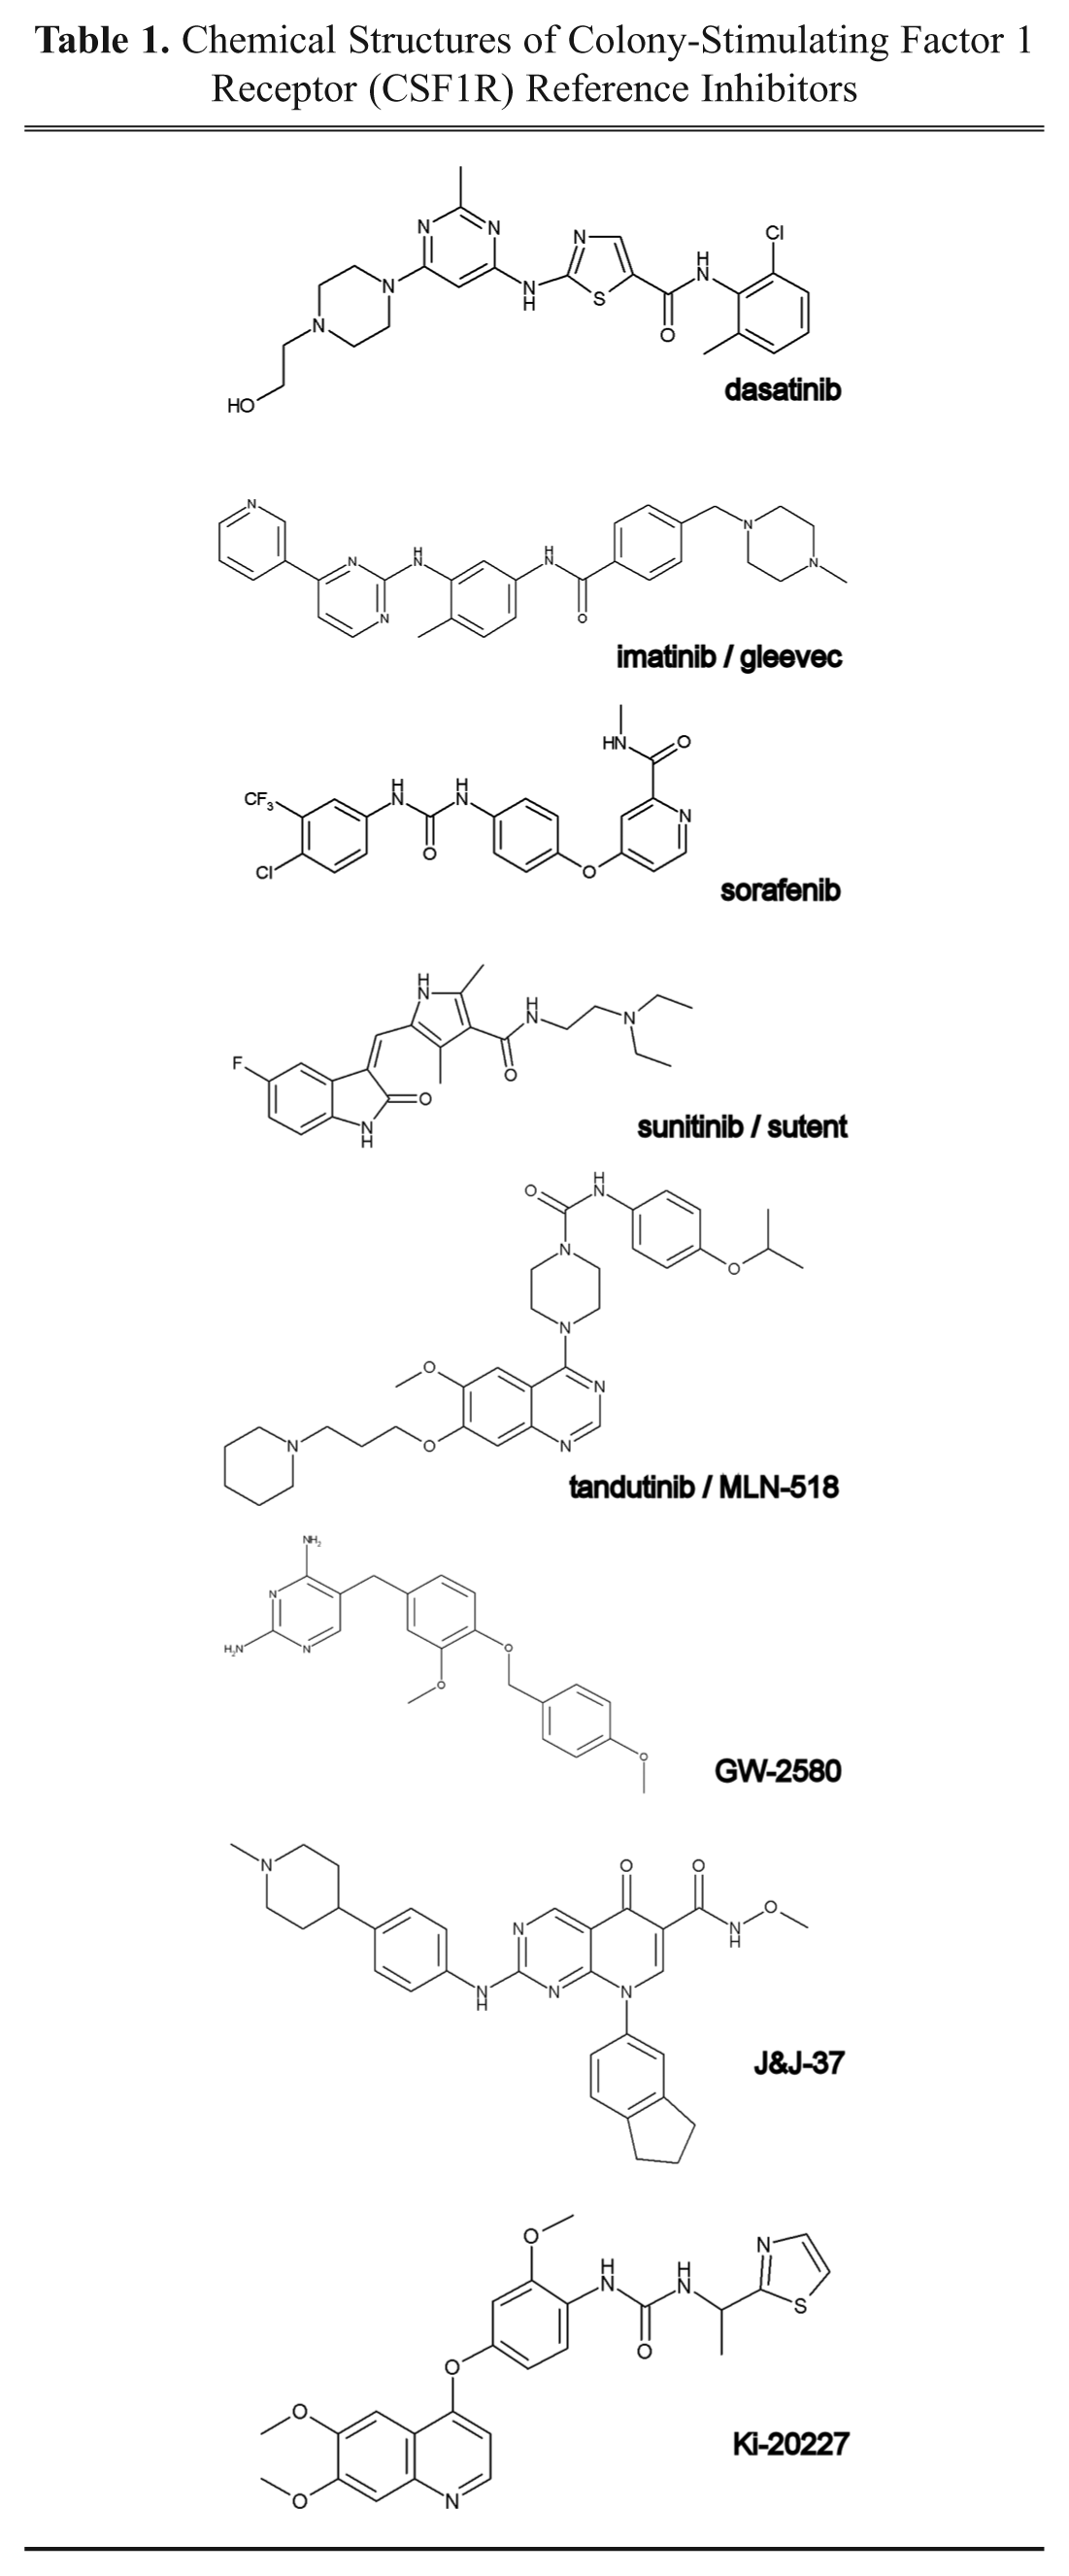
CSF1R is a transmembrane tyrosine kinase with cKit, PDGFR, and Flt3 as its closest homologs. CSF1R is activated by CSF1 binding, which leads to receptor autophosphorylation and downstream signaling, including extracellular signal-regulated kinase (ERK) activation. 7 Quite a few inhibitors have been developed that target the cytoplasmic kinase domain of CSF1R, such as the clinically approved, spectrum-selective compounds imatinib, dasatinib, nilotinib, pazopanib, sorafenib, and sunitinib.3,4,8 More selective inhibitors are tandutinib 9 (MLN-518, phase II); PLX-5622, PLX-3397, and JNJ-28312141 (all in phase I); and the tool compounds GW-2580, 5 Ki-20227, 6 and a pyrido[2,3-d]pyrimidin-5-one from Johnson & Johnson (Spring House, PA), labeled here as J&J37 10 ( Table 1 ). Nevertheless, selective drug-like CSF1R inhibitors that do not, for instance, also inhibit cKit remain rare ( Table 2 ). 8 For this reason, we initiated a screening campaign on CSF1R.
Chemical Structures of Colony-Stimulating Factor 1 Receptor (CSF1R) Reference Inhibitors
Activities of Colony-Stimulating Factor 1 Receptor (CSF1R) Reference Inhibitors in the Described Assays
The 290 kinases comprise the panel in Karaman et al., 8 excluding mutants.
Over the past years, the field of high-throughput screening (HTS) has substantially progressed through increased quality of compound libraries, more robust assay formats, and advances in the science of screening. 11 This has resulted in a dramatic increase in the number of high-potency hits that can be found in regular screening campaigns, such as on CSF1R. Although more hits give more choice of which chemistry to progress, hit properties need to be discriminated by further data from orthogonal assays—for instance, on cellular activity, selectivity, and binding kinetics. In this way, hits can be triaged on an empirical basis. Ideally, a completed screening campaign therefore delivers not only an EC50 of target inhibition but also a data package, after which progressible chemical series are selected ( Fig. 1 ).
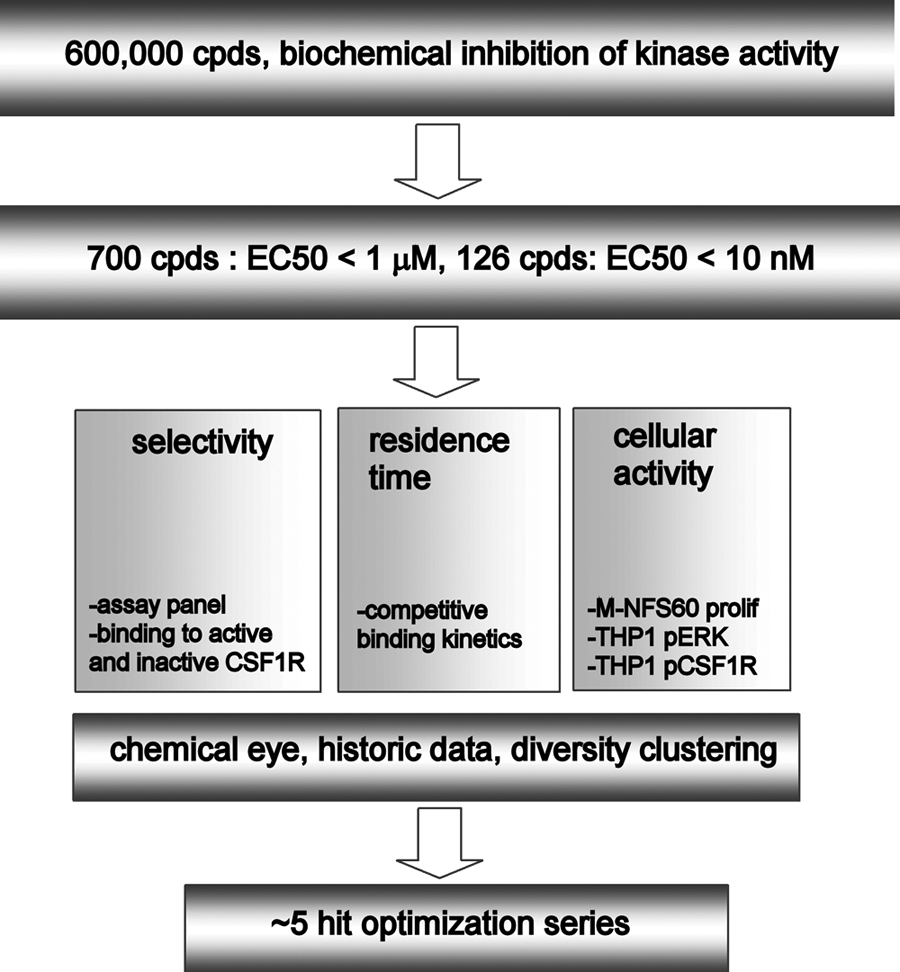
Flowchart for the colony-stimulating factor 1 receptor (CSF1R) screening and hit profiling campaign.
Because large numbers of hits are sometimes found (~1000), secondary assays need to be medium throughput and labor extensive. However, for many important hit parameters, such assays are not available. For instance, it is important to identify highly selective scaffolds early, but the “normal” way to assess selectivity is by profiling in a panel of more than 100 separate biochemical assays, which is cost-prohibitive for more than a few hits. 12 Because selective compounds often preferentially bind to unique kinase conformations, it has been proposed that a high binding affinity to the inactive kinase form can predict selectivity.13–15 Although this is easier to test in high throughput, the predictive value of such a readout is only supported by anecdotal successes.
Another parameter that is difficult to assess in higher throughput fashion is compound residence time, which is related to the dissociation rate of the compound from its target (koff). A slow dissociation rate may lead to improved in vivo efficacy and can compensate for unfavorable pharmacodynamics.16,17 It can also be the basis for compound selectivity. 16 Therefore, an unusually long residence time is considered a beneficial hit property. 18 However, binding kinetics are usually measured by surface plasmon resonance, nonequilibrium reaction kinetics, or changes in intrinsic fluorescence, which are low throughput, require access to specialist technologies, or are not generally applicable.16–18 There remains a need for a more high-throughput and universal way of measuring compound disassociation rates.
Here we present a CSF1R screening campaign and the orthogonal assay panel that followed the primary assay, which incorporates medium-throughput assays for cellular activity, binding to inactive CSF1R, and compound residence time. Validation of this assay panel with reference inhibitors indicates which readout best predicts selectivity. This CSF1R assay portfolio is a general case study on how to increase hit value by follow-up screening.
Materials and Methods
Compound synthesis
All compounds used in this study were obtained from commercial sources, except J&J’s pyrido[2,3-d]pyrimidin-5-one (J&J37). This compound was prepared according to procedures described. 10
CSF1R kinase activity assay
For HTS, we used a biochemical kinase activity assay (IMAP format; Molecular Devices, Sunnyvale, CA). In each well of a black 384-well Costar plate (Corning, Corning, NY), 5 µL compound dilution was mixed with 5 µL recombinant CSF1R (cytoplasmic domain; PV3249; Life Technologies, Carlsbad, CA) and preincubated for 30 min, after which 5 µL adenosine triphosphate (ATP) and 5 µL substrate peptide (TAMRA-KKKSPGEYVNIEFG; Molecular Devices) solutions were added. The reaction was allowed to proceed for 120 min at room temperature (reaction progress curve linearity during the incubation time was ensured during assay setup). Component concentrations during the reaction were as follows: 5 nM CSF1R, 50 nM TAMRA-peptide, 112.5 µM ATP (equal to KM-ATP), 10 mM Tris (pH 7.2), 10 mM MgCl2, 0.01% Tween-20, 0.05% NaN3, 1 mM dithiothreitol (DTT), 2 mM MnCl2, 0.1% bovine serum albumin (BSA), and 0.5% DMSO. The signal from the mixture was developed by adding 40 µL IMAP solution (75% buffer A, 25% buffer B; Molecular Devices), incubating for 60 min, and reading the fluorescence polarization signal (excitation 531 nm, emission 595 nm). Dose–response curves were measured as 10 points in duplicate on two plates (n = 2, N = 2). Sigmoidal curves were fitted using Prism 4.0 (GraphPad Software, La Jolla, CA).
Selectivity profiling
Compound inhibitory activity was measured in a small panel of kinases that frequently cross-react with CSF1R or are important antitargets. The assay setup was similar to the CSF1R biochemical assay with the following differences. The cKit assay uses, in final concentrations, the following: 2 nM cKit (14-559; Millipore, Temecula, CA), 50 nM substrate peptide FAM-GEEPLYWSFPAKKK, and 90 µM ATP. The PDGFRβ assay uses 30 nM PDGFRβ (PV3591; Life Technologies), 50 nM FAM-QEEEYVFIE, and 2.5 µM ATP (note that in this assay, substrate and enzyme concentration are very similar). The Abl assay uses 0.5 nM Abl (P3094; Life Technologies), 50 nM 5FAM-KKGEAIYAAPFA, and 0.4 µM ATP. The Aurora A assay uses 1 nM Aurora A (PV3612; Life Technologies), 50 nM 5FAM-GRTGRRNS, and 15 µM ATP. The Flt3 assay uses 8 mU (~0.2 nM) Flt3 (14-500; Millipore), 50 nM 5FAM-KKKKEEI YFFFG, and 24 µM ATP. In all these assays, the compound preincubation step was 60 min. All ATP concentrations are equal to KM-ATP.
M-NFS-60 and NS0 proliferation assays
Batches of frozen mouse myeloid MNFS-60 (ATCC no. CRL-1838) cells were prepared to limit the amount of (laborious) cell culture. For each experiment, a batch was thawed and cultured overnight in the absence of mouse–CSF1. The culture medium was RPMI60, supplemented with 10% fetal bovine serum (FBS), 2 mM L-glutamine, penicillin, and streptomycin. The following day, cells were stimulated by adding 11.1 ng/mL mouse–CSF1. In each well of a sterile black 96-well plate, 90 µL (25 000 cells) was dispensed, followed by 10 µL of compound dilution in medium (final DMSO concentration 1%). After 48-h incubation at 37 °C and 5% to 7% CO2, 10 µL of 50v/v% Alamar blue (Serotec, Raleigh, NC) was added, and the cells were further incubated. After 24 h, the fluorescence signal was read (emission: 545 nm, excitation: 590 nm). Dose–response curves were measured as 10 points in duplicate on two plates (n = 2, N = 2) and fitted using Prism (GraphPad Software).
As a control, the proliferation of mouse myeloid NS0 cells (ATCC no. CRL-1827), which grow independently of CSF1, was measured in an assay similar to the M-NFS-60 proliferation. The only difference was that 15 000 cells/well were seeded, and no CSF1 ligand was added.
CSF1R and ERK target engagement assays
Human monocytic THP1 cells (ATCC no. TIB-202) were stimulated with CSF1, after which CSF1R autophosphorylation and ERK1/2 kinase activation were measured. THP1 cells were cultured in Dulbecco’s modified Eagle’s medium (DMEM)/F-12 medium (without phenol red) and supplemented with L-glutamine, penicillin, streptomycin, and 10% heat-inactivated FBS. In each well of a 96-well culture plate, 250 000 cells were dispensed (at 2·106 cells/mL) and rested overnight at 7 °C and 6% CO2. The next day, compound was added to a final DMSO concentration of 0.1%, followed by 30 min preincubation and stimulation with 500 ng/mL of human CSF1 for 5 min, after which the cells were put on ice. Lysis buffer was added (from the PerkinElmer [Waltham, MA] AlphaScreen p-ERK Surefire kit), and cells were lysed for 10 min on a shaker. The lysates were frozen at −80 °C for further use.
For detection of CSF1R phosphorylation, a human phospho-CSF1R duoset kit was used (DYC3268; R&D Systems, Minneapolis, MN). MaxiSorb 96-well plates (Nunc, Roskilde, Denmark) were coated with mouse antihuman CSF1R, blocked, and incubated with 100 µL of THP1 cell lysate for 2 h at room temperature. After washing, the plates were incubated with horseradish peroxidase (HRP)–labeled anti-pTyr. Signal was detected by incubating with chromogen for 20 min and then reading absorbance at 450 nM on an EnVision plate reader (PerkinElmer).
For detection of phosphorylated ERK1/2 levels, 12.5 µL lysate was thawed out and mixed in a 384-well OptiPlate (PerkinElmer) with 12.5 µL of SureFire pERK1/2 (cat. no. TGRES10K; PerkinElmer) bead mix that was prepared according to the manufacturer’s instructions. The mixture was shaken and placed in the dark for 2 h at room temperature. The fluorescent signal, which results from the proximity of two labeled antibodies against ERK1/2 and phoshorylated ERK1/2(pThr202/Tyr204) and diffusion of activated oxygen between them, was quantified in an EnVision plate reader.
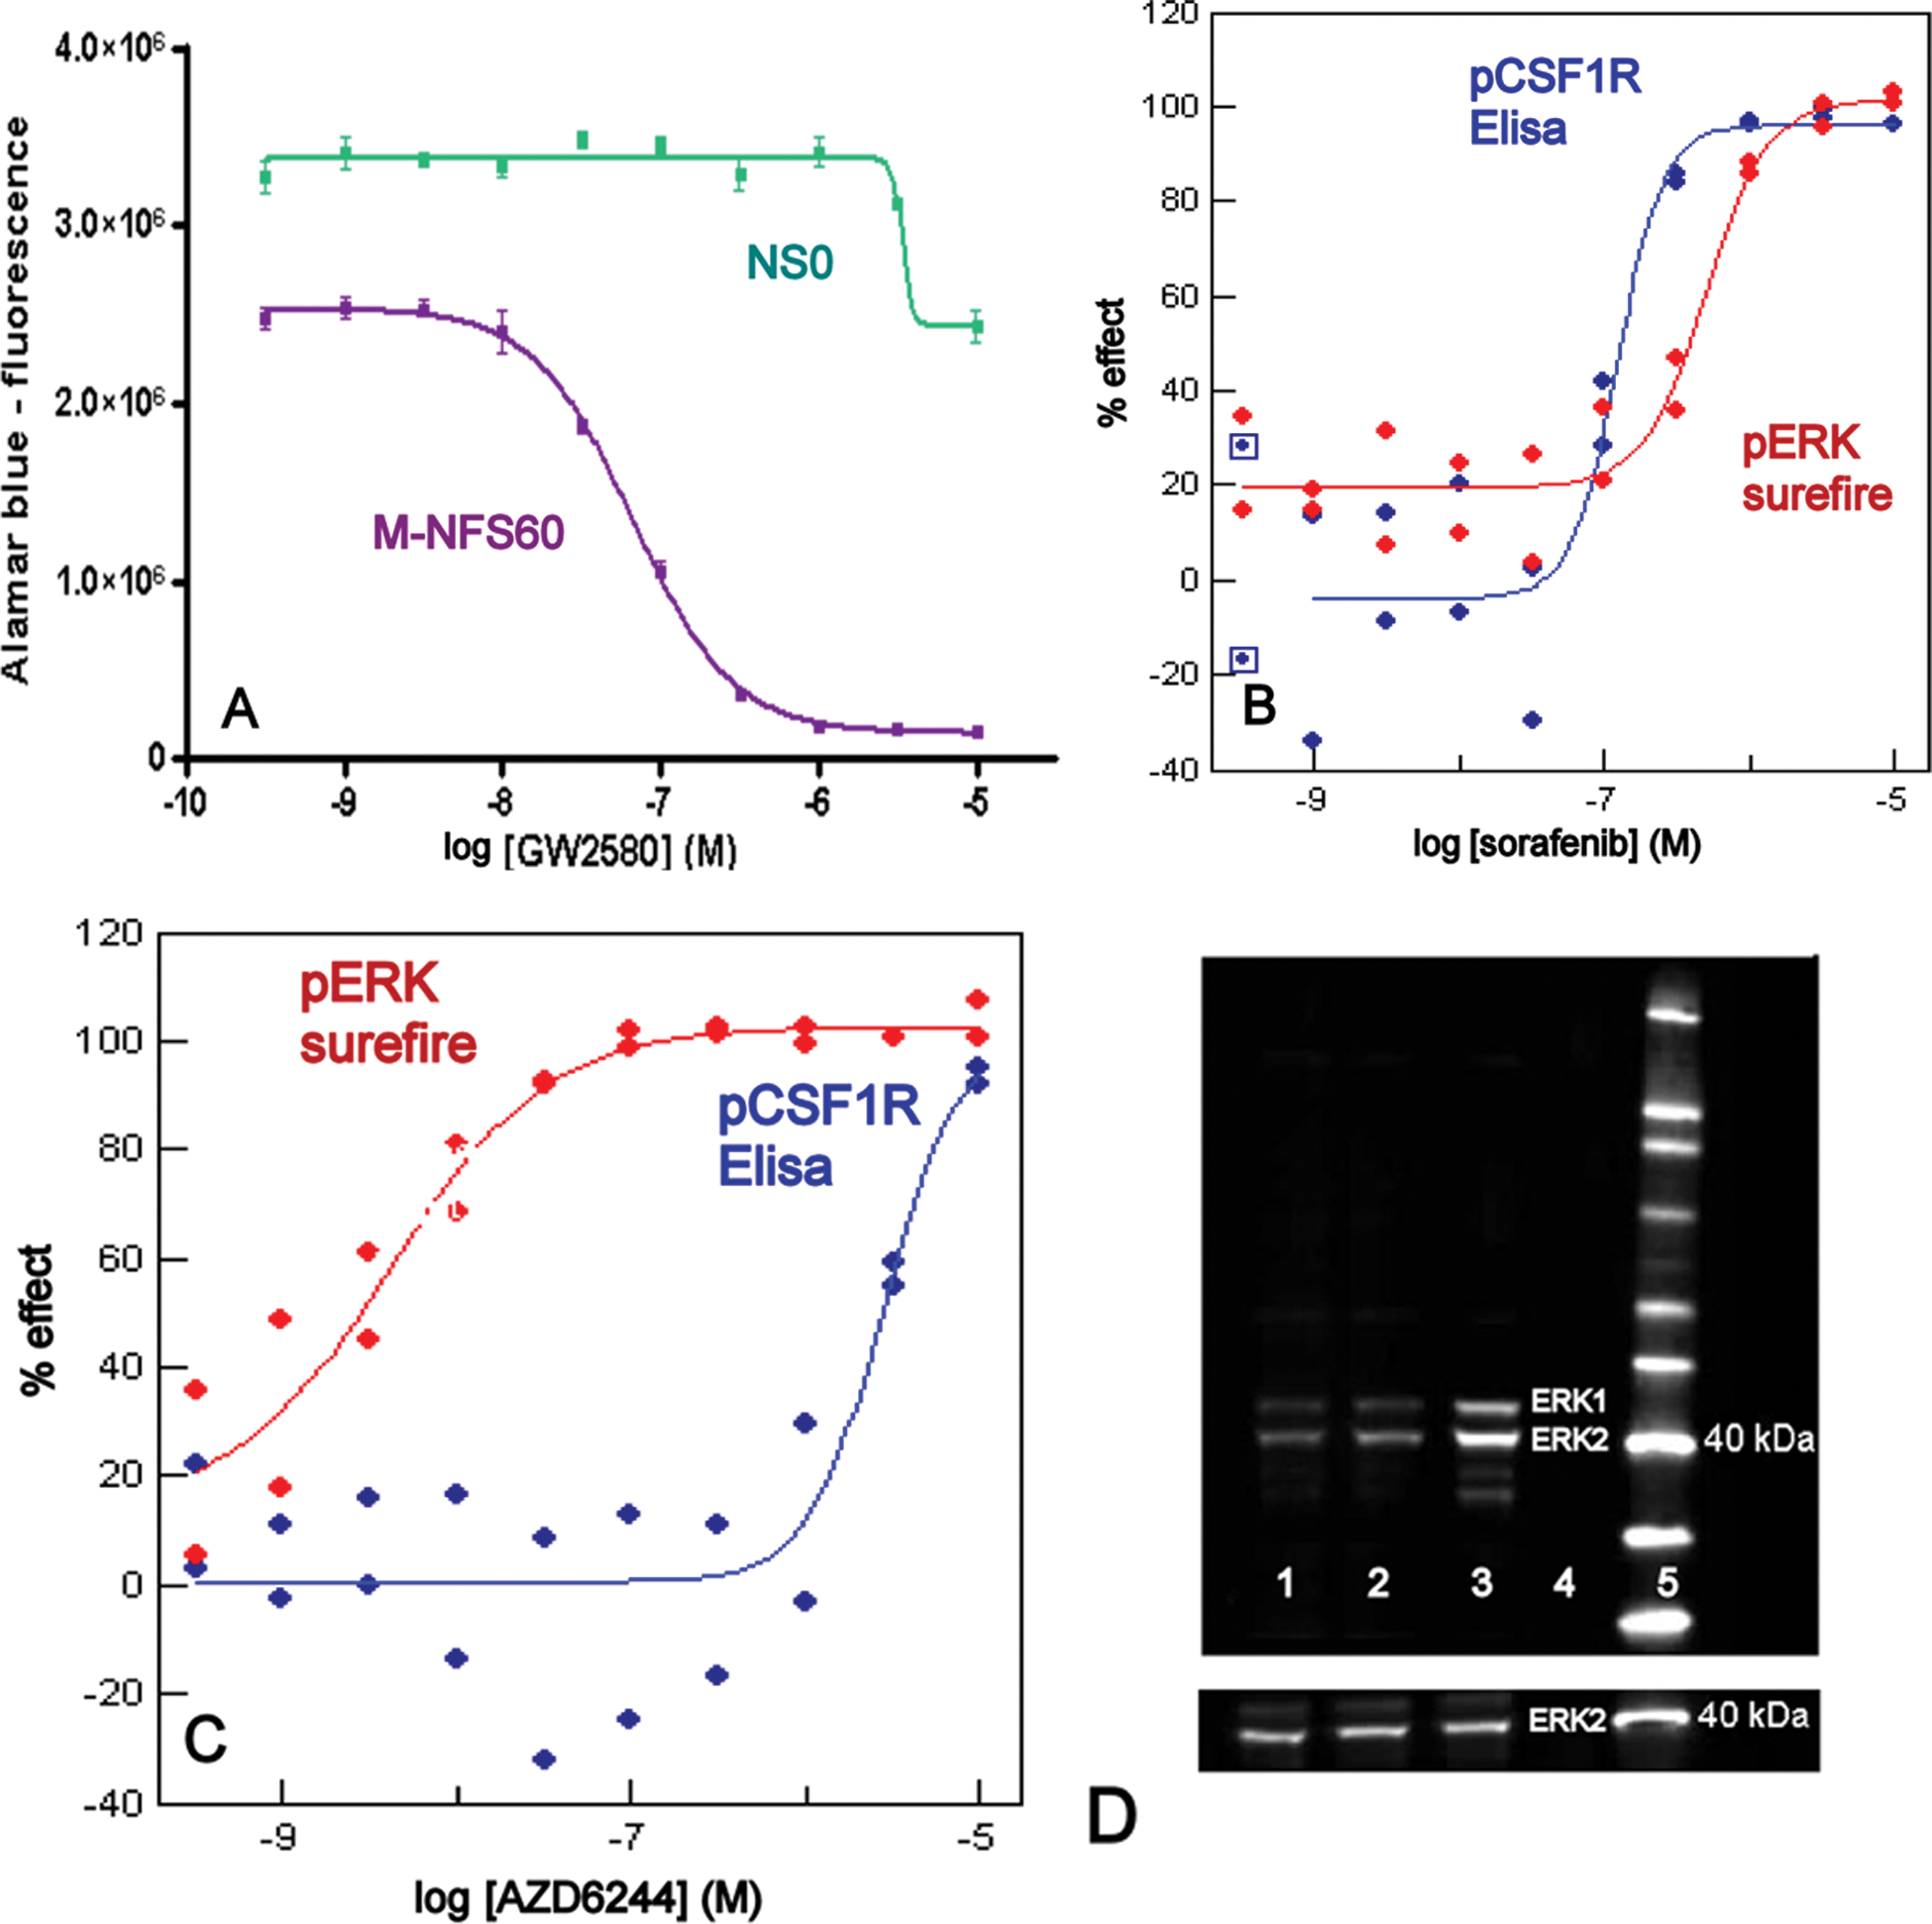
For checking specificity of the signal, we ran Western blots in a standard fashion. For primary antibodies, we used anti-phosphorylated ERK1/2 (cat. no. 4377; Cell Signaling, Danvers, MA) or anti-ERK1/2 (cat. no. 700012; Life Technologies); for secondary antibody, we used goat-anti-rabbit HRP (cat. no. W4011; Promega, Madison, WI). Signal was generated using ECL mix (Pierce, Rockford, IL) and captured on a gel imaging system ( Fig. 2 ).
Cellular assays for colony-stimulating factor 1 receptor (CSF1R). (
Sources of active and inactive CSF1R
Active CSF1R was purchased from Life Technologies (cat. no. PV3249) and Millipore (cat. no. 14-551M). Inactive CSF1R was obtained in a small quantity as a gift from Life Technologies; a larger batch was purchased from Millipore. Both inactive batches had equal specific activity after a test activation. Inactive and active CSF1R contain the cytoplasmic part (amino acids 538–910) and are produced in the baculovirus expression system. The inactive material is directly harvested, whereas active material is obtained after incubating the inactive material for 1 h with 5 mM ATP on ice. The phosphorylation status of CSF1R was checked on Western blot using anti-phoshorylated tyrosine antibody (

Compounds have preference for active and inactive colony-stimulating factor 1 receptor (CSF1R). (
Competitive binding assay
Compound binding to CSF1R was assessed by a competitive binding assay (LanthaScreen; Life Technologies) based on fluorescence resonance energy transfer (FRET) between a labeled antibody bound to the His-expression tag on CSF1R and a small-molecule tracer, which consists of a kinase inhibitor conjugated to a label (no. 236, cat. no. PV5592). The FRET signal is proportional to the amount of kinase–tracer complex in the well and decreases when an inhibitor displaces the tracer.
CSF1R (active or inactive) was mixed with antibody in reaction buffer (10 mM HEPES [pH 7.5], 2 mM MgCl2, 0.2 mM EGTA, 0.002% Brij-35), and 5 µL was dispensed in a black 384 shallow-well plate (cat. no. 3676; Corning). Next, 10 µL of inhibitor and tracer was added. Final concentrations of CSF1R and tracer were 5 nM and 30 nM, respectively. The FRET signal was followed in an EnVision plate reader (excitation: 320 nm, emission: 615 nm), and the value at equilibrium was taken for calculating EC50s.
The Kd of tracer binding was established by testing a concentration range of tracer in the absence of inhibitor and fitting a sigmoidal dose–response curve in Prism. The tracer Kd is 32 nM for the active and 346 nM for the inactive CSF1R material. Inhibitor Kds were derived from EC50s and the tracer Kd by use of the Cheng-Prusoff equation (
Affinity selection–mass spectrometry (ALIS) assay
Ligand binding to inactive CSF1R was independently evaluated with the affinity selection–mass spectrometry (ALIS) system
19
(see
Off-rate profiling through competitive binding kinetics
For measuring binding kinetics, we used the LanthaScreen competitive binding assay as described above, with a tracer concentration of 15 nM. The compound/tracer mixture was dispensed first, and the reaction was started by adding preequilibrated CSF1R/antibody mixture. Only active CSF1R was used. After rapid mixing, the emerging FRET signal was followed. The time between mixing and the first read (always smaller than 30 s) was tracked on a stopwatch and used to correct the time intervals registered by the reader (
High-throughput target residence time profiling. (
First, we established the binding kinetics of the tracer to active CSF1R. A concentration range of tracer was mixed with 5 nM CSF1R in the absence of inhibitor. The resulting curves were globally fitted as an exponential binding curve in Prism, 20 kon,tracer = 1.0 s−1M−1, koff,tracer = 0.015 s−1.
For inhibitor kinetics, we fixed the tracer concentration and added inhibitors in a dose range around their Kd. The time-dependent competitive binding curves were fitted using equations proposed by Motulsky and Mahan.
20
However, the algorithms in Prism frequently failed to find a solution. To facilitate the numerical optimization, we rearranged the competitive binding equations (see

Here, k4 is the inhibitor off-rate (s–1), KF and KS are complex parameters (see
Results
Primary CSF1R activity assay
To find CSF1R hits that would be suitable starting points for a compound optimization program, we screened a collection of 600 000 compounds in the biochemical CSF1R kinase activity assay. This assay uses the activated cytoplasmic domain of CSF1R (
Computational clustering
To prioritize the 826 hits, we arranged them computationally in 40 clusters on the basis of structural similarity. Further analysis showed them to be highly diverse. For instance, molecular weight varied between 180 and 728 Da, ligand-binding efficiency varied between 0.009 and 0.035, and cLogP varied between −2.7 and 8.6. The hits were analyzed interactively using Spotfire (TIBCO, Somerville, MA) for further compound selection, and 121 compounds were selected on the basis of their availability in solid form, cLogP <5.9, and potency in the kinase activity assay of better than 500 nM. A further selection step on the basis of chemical diversity and scope for chemical optimization yielded a final selection of 21 compounds.
Despite the good results, we felt that the rigorous selection process ran too much of a chance of missing interesting chemical matter. For instance, no representatives were selected from 16 of 40 clusters because not a single compound from these clusters was present as a solid. In addition, selections based on chemical diversity treat all scaffolds equally, whereas some might have intrinsically favorable (but unknown) properties. For this reason, we decided to set up additional orthogonal assays that would allow us to stick to a larger set of hits and validate these with our reference inhibitor set.
Cellular activity in M-NFS-60 cells
A very important characteristic that we wanted to know of the screening hits was their cellular activity. Therefore, we set up a cell proliferation assay with M-NFS-60 cells, which is a mouse myeloid line that is dependent for its growth on CSF1. It is used frequently to measure CSF1R inhibitor activity. 5 To make the assay more convenient, we adapted it to work with frozen cells. 21 Inhibitors EC50s and assay window are similar between cultured and frozen cells (not shown). The final assay is highly reproducible and robust (Z′ factor >0.7, signal-to-background [S/B] ratio >15; Fig. 2A ). As a control for CSF1R-independent compound effects, we used a NS0 mouse myeloid line that grows independently of CSF1. 12 Compounds that act through CSF1R inhibition should be active in the M-NFS-60 assay but not in the NS0 ( Fig. 2A ).
Although these assays are easy and robust, they have two inherent drawbacks. The first is sensitivity. For instance, imatinib and tandutinib are not active in this assay ( Table 2 ), despite being potent biochemical inhibitors of CSF1R and able to target Abl and Flt3 in an in vivo setting.9,14 The second (possibly related drawback) is that the cell lines contain murine and not human CSF1R.
CSF1R target engagement in THP1 cells
To work with human CSF1R and directly measure the receptor’s intracellular inhibition (target engagement), we set up a CSF1R auto-phosphorylation assay in THP1 cells. THP1 is a human monocytic leukemia cell line that expresses functional CSF1R. CSF1R phosphorylation status after a short CSF1 stimulus was measured in a sandwich enzyme-linked immunosorbent assay (ELISA) format ( Fig. 2B , C ). Although this assay has relatively low throughput, it directly measures CSF1R target engagement. This assay is much more sensitive than the M-NFS-60 assay ( Table 2 ). For example, inhibitors such as Ki-20227 and J&J37 are equally potent in this assay as they are biochemically. The results show furthermore that all reference compounds are active on CSF1R in a cellular context ( Table 2 ).
ERK pathway engagement in THP1 cells
It is known that CSF1 stimulation of CSF1R leads to phosphorylation of ERK1/2. 7 Conveniently, phosphorylated ERK can be read out in a homogeneous format (Surefire; Fig. 2B , C ), allowing a higher throughput assay. The reference inhibitor results show that the assay delivers potent EC50s ( Table 2 ). To get a reasonable window (S/B ~7), it is important that cells are handled gently and the CSF1 stimulus is short. The signal and its inhibition by reference compound GW-2580 were confirmed on Western blot ( Fig. 2D ). These results confirm that CSF1 stimulation of THP1 leads to activation of ERK and that inhibition of CSF1R after CSF1 stimulation reduces ERK activation.
Conveniently, the CSF1R and ERK activation assays can be performed on the same cell lysates. Therefore, in one experiment, the effects of inhibitors can be probed both at the start (CSF1R activation) and further down (ERK activation) of the CSF1R pathway. For an inhibitor that is active on CSF1R, such as sorafenib, the inhibitory potency is similar in both assays ( Fig. 2B ). In contrast, a selective inhibitor of MEK that acts just upstream of ERK (AZD6244) predictably does well in the ERK assay and poorly in the CSF1R assay ( Fig. 2C ). Because ERK inhibition can be influenced by off-target inhibitory activities, combining the CSF1R and ERK readouts might be a measure of compound selectivity (see below).
Profiles in a small selectivity panel
A second important parameter we wanted know early on in hit triaging is selectivity ( Fig. 1 ). Because hit profiling in large kinase panels is prohibitive in cost and effort for large numbers of hits, we assembled a small panel incorporating PDGFRβ, Flt3, and cKit assays as close sequence homologs of CSF1R. On the basis of full-profiling results, we added Abl as an antitarget because it is associated with cardiotoxic effects, as well as Aurora A because it regulates the cell cycle.
Testing the reference inhibitors in the panel confirms the broad activity of dasatinib and the exquisite selectivity of GW-2580 (
Conformational probing
In an attempt to predict hit selectivity more generally, we tested binding to inactive CSF1R. We were encouraged in this experiment after it appeared that GW-2580 binds to the inactive DFG-out conformation of CSF1R,23,24 suggesting this is the basis of the exquisite selectivity of this inhibitor. Conveniently, X-ray structures have shown that a DFG-out conformation is naturally present in inactive, unphosphorylated CSF1R because in this state, the N-terminal juxtamembrane domain pushes against the kinase domain, enforcing it to adopt a DFG-out conformation. 25 Therefore, by testing compound affinity for inactive CSF1R, we can test a compound’s affinity for the DFG-out conformation.
We set up a homogeneous competitive binding assay ( Fig. 3 ) to measure in high-throughput compound binding to active and inactive CSF1R. The affinity of the ATP-competitive tracer for inactive CSF1R (346 nM) is 10 times less than for active CSF1R (32 nM), consistent with inactive CSF1R presenting a DFG-out conformation (for which ATP has less affinity). The differences in tracer affinities were used to correct inhibitor EC50s into inhibitor Kds. The ratios of compound affinities for active and inactive CSF1R are shown in Figure 3C . GW-2580 and sunitinib, which are known to bind to inactive conformations,24,26 have the highest relative affinity for inactive CSF1R ( Fig. 3C ). Surprisingly, however, imatinib, which preferentially binds to inactive cKit 26 and Abl, 14 in our experiments preferentially binds to active CSF1R even more potently than the known ATP competitor staurosporine.
To verify this, an independent binding experiment was performed on inactive CSF1R, using the ALIS (mass spectrometry–based) method, which in itself is also an HTS platform.
19
This showed that GW-2580 has an 80-nM Kd for inactive CSF1R, whereas imatinib has much less affinity (Kd = 4.7 µM;
Fig. 3D
and
Off-rate profiling
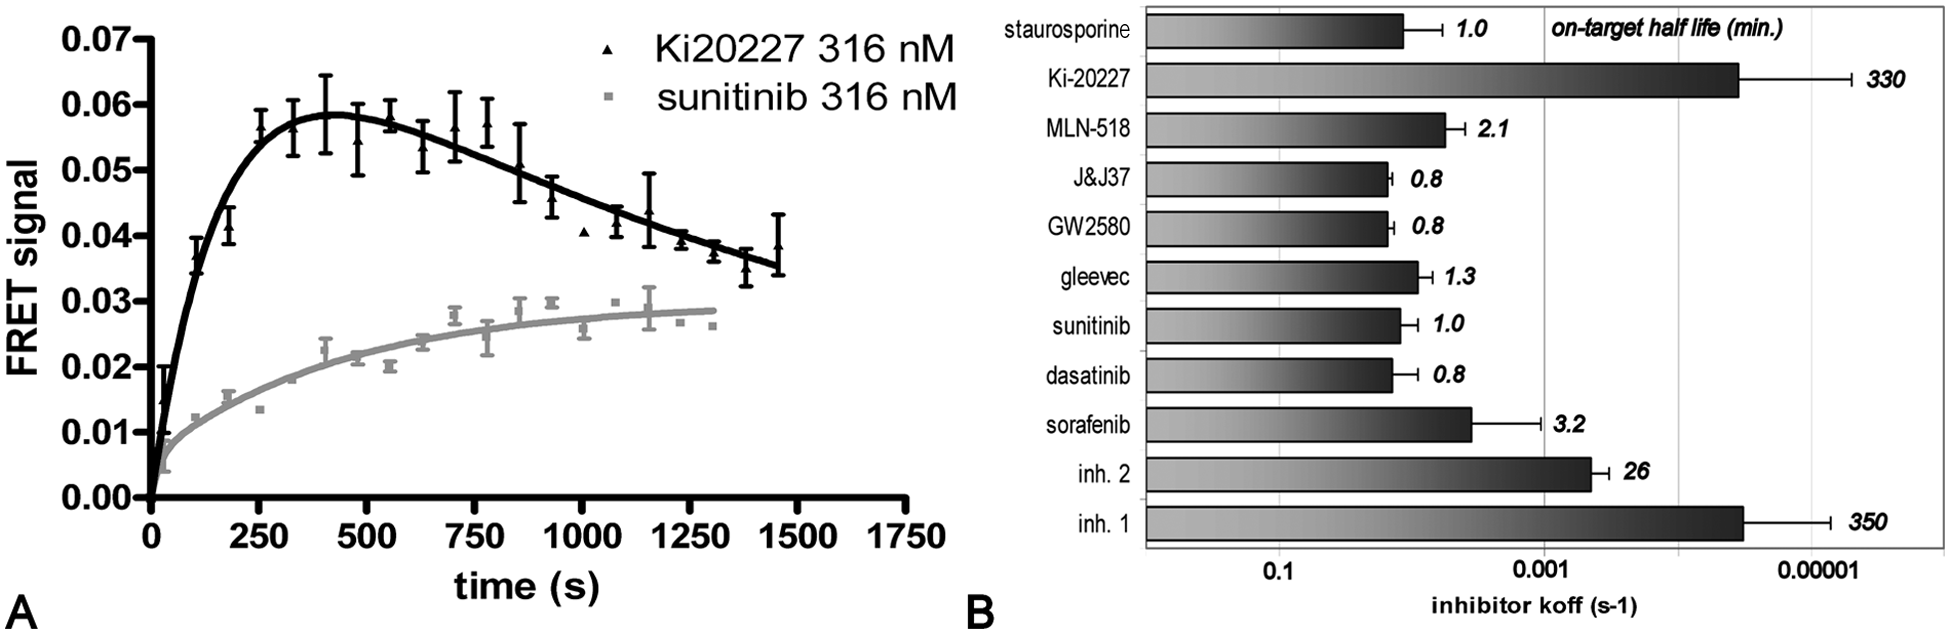
A third and final important parameter for selecting hits is their target residence time or target dissociation rates. To measure this in high throughput, we used the LanthaScreen competitive binding assay to measure competitive binding kinetics ( Fig. 4 ). 20 After quick simultaneous mixing of tracer and compound, the emerging FRET signal is followed in time ( Fig. 4A ). If the tracer binds slower than the compound, this results in a slow increase in FRET, of which the rate depends on the compound off-rate (e.g., the sunitinib profile in Fig. 4A ). 27 If the tracer binds faster than the compound, an optimum in FRET signal emerges, after which the compound starts to compete the tracer out of the active site (e.g., the Ki-20227 signal in Fig. 4A ). 27 Both curves in Figure 4A reach the same equilibrium with the tracer, indicating that the inhibitors differ only in binding kinetics. This shape of the competitive binding curve contains information on the compound off-rate.20,27
Although the mathematics for fitting the competitive binding kinetic curve has been developed,
20
it was impractical in our hands. We succeeded in correctly fitting empirical data only in about 10% of cases. To make the method more amenable for automatic fitting, we rearranged the existing equations (see above and
The data for the reference inhibitors ( Fig. 4B ) show that the method can identify inhibitors with both slow and fast off-rates. Most reference compounds, including the known DFG-out binders such as sunitinib and GW-2580, show a fast off-rate on the order of minutes. Hits with slow off-rates were identified from the screening set ( Fig. 4 ). Moreover, Ki-20227 shows a very slow off-rate, on the order of hours ( Fig. 4B ), revealing it as a very interesting CSF1R inhibitor.
Discussion
In this work, we show how a screening campaign with a single assay can be followed up by a panel of orthogonal profiling assays. In the case of CSF1R, a library screen of 600 000 compounds led to the discovery of >800 validated hits, which we ultimately wanted to reduce to about five series for hit optimization chemistry ( Fig. 1 ). Usually this is done by applying an EC50 cutoff, computational criteria based on diversity, the Lipinski rules, and internal experience with certain series. This works well for a few dozens of hits but leads to arbitariness with larger hit numbers. For instance, compounds with relatively poor EC50 but good cellular penetration will be missed in the selection, whereas these are more suitable starting points for drug discovery than potent, noncellularly active compounds. This can be avoided by continued testing in a follow-on assay portfolio that has sufficient throughput to be run before manual hit triaging.
Because of the importance of cellular activity, a high-throughput cellular assay was developed as the first follow-on assay. Many chemical scaffolds have inherent problems in crossing the cell membrane, and these should be discarded as quickly as possible. We found the frozen cell–based M-NFS-60 proliferation assay, despite its drawbacks, most practical for this use, as the other formats are less robust and more labor intensive.
As a second important property, we focused on selectivity. In kinase drug discovery, many scaffolds will bind more than one kinase, and it is important to deprioritize the most promiscuous scaffolds early on.
28
To avoid testing hits on a full panel of biochemical kinase assays but still get an idea of general selectivity, we measured binding to inactive CSF1R. However, this readout appears to poorly predict selectivity—for instance, the reasonably selective (
By itself, the finding that imatinib preferentially binds the active form of CSF1R (
Aside from imatinib, we wanted to more quantitatively assess the predictive value of the binding assay for selectivity. We downloaded the full published kinase profiles of all reference inhibitors.
8
From those, single values can be calculated that are a measure for selectivity (
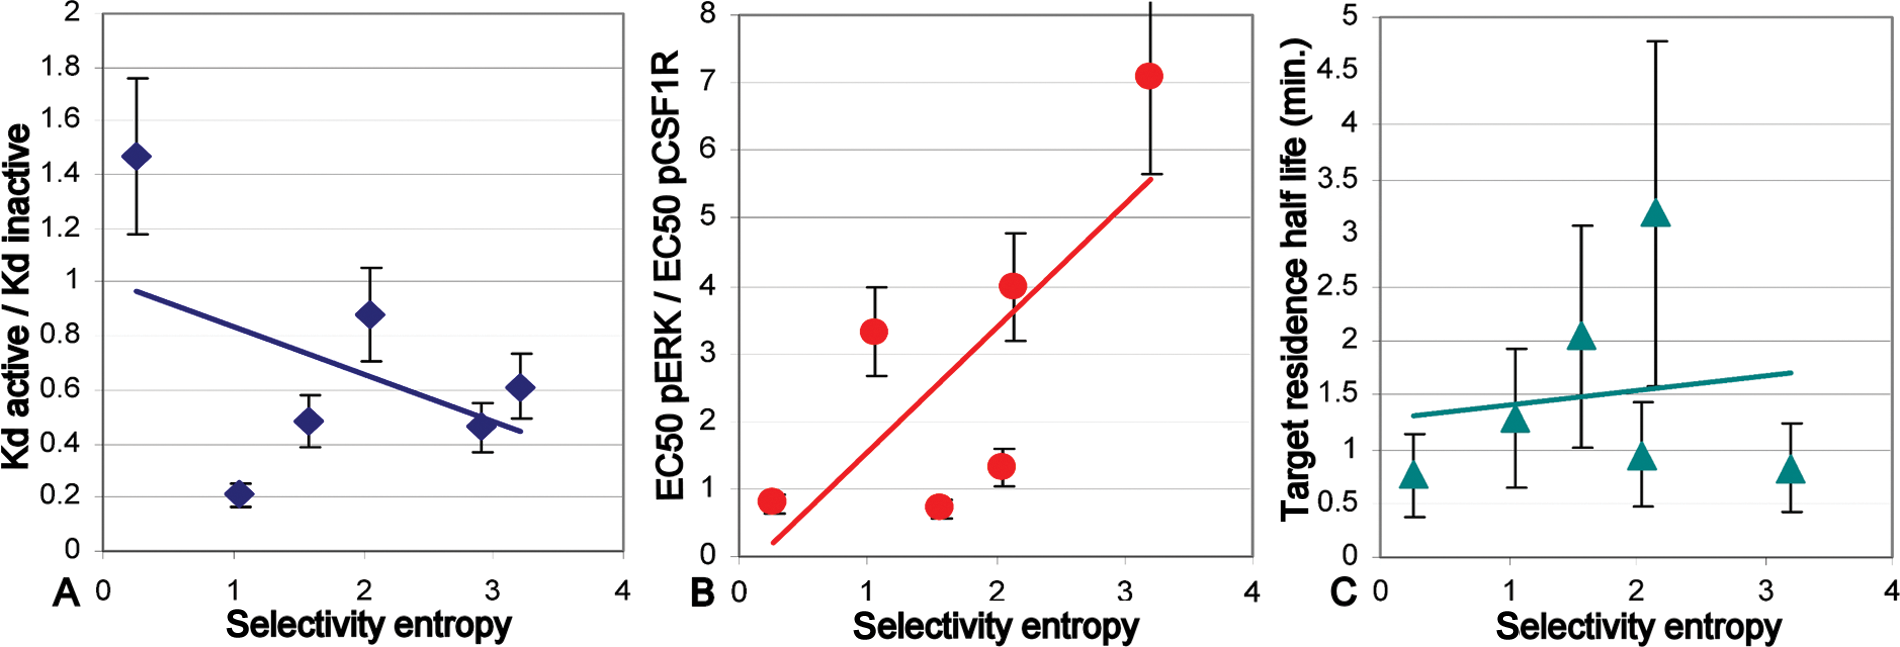
Correlation of assay parameters with compound selectivity, as expressed by the selectivity entropy (values in
To further look for predictive assay readouts, we next plotted the selectivity entropy to two other readouts: the ratio between pERK and pCSF1R inhibition in THP1 cells (
Finally, because of the pharmacological advantages of compounds with slow dissociation rates, we wanted to prioritize such hits. To do this, the competitive binding kinetics assay in a 384-well format offers great advantages in throughput and generality over other methods, although it remains an indirect setup. 16 Within the competitive format, other experiments are possible, such as diluting a preequilibrated enzyme–inhibitor complex in tracer solution (Life Technologies), but in our hands, the simultaneous adding of inhibitor and tracer works better and has the additional activity of being able to build on existing kinetic models. 20
Our experiments show that Ki-20227 has a surprisingly slow off-target dissociation rate (
In short, following up the results of a high-throughput screen by other high- and medium-throughput assays allows for a highly rigorous hit selection process. As illustrated by the new assay formats for selectivity and residence time, such an approach can reveal unexpected properties for compounds and chemical series and thereby help drug discovery to be more successful.
Footnotes
Acknowledgements
The authors thank Guido Zaman and Paul Vink for comments on the manuscript, as well as Steve Riddle and Roland Leathers of Life Technologies for assistance with the Lantha Screen assay format.
References
Supplementary Material
Please find the following supplemental material available below.
For Open Access articles published under a Creative Commons License, all supplemental material carries the same license as the article it is associated with.
For non-Open Access articles published, all supplemental material carries a non-exclusive license, and permission requests for re-use of supplemental material or any part of supplemental material shall be sent directly to the copyright owner as specified in the copyright notice associated with the article.