
Abstract
Development of inhibitor compounds selective against undesirable targets is critical in drug discovery. Selectivity ratios for candidate compounds are evaluated by dividing potencies from two assays assessing the off-target and target. Because all potency measurements have underlying uncertainty, understanding error propagation is essential to interpreting selectivity data. Assay noise introduces ambiguity in the statistical significance of selectivity ratios, particularly at low replicate numbers when compounds are often prioritized for subsequent testing. The ability to differentiate potency results for any pair of compounds in one assay is evaluated using a metric called minimum significant ratio (MSR). Potency results of one compound tested in a pair of assays can be differentiated by the minimum significant selectivity ratio (MSSR). To differentiate selectivity ratios for any pair of compounds, we extend this concept by proposing two new parameters called the minimum significant ratio of selectivity ratios (MSRSR) and confidence in ratio of selectivity ratios (CRSR). Importantly, these tools can be used after a single selectivity measurement. We describe these methods and illustrate their usefulness using structure-activity relationship data from a Janus kinase inhibitor project, in which these tools informed a cogent retesting strategy and enabled rapid and objective decision making.
Keywords
Introduction
The concept of selectivity is an intrinsic part of the intellectual framework that drug discovery scientists use to evaluate and describe the results and implications of pharmacology studies. Understanding the selectivity of potential drug molecules is essential to making informed decisions about their potential risks and benefits. Selectivity is also commonly used to describe differentiation from existing therapies and agents. However, a quantitative understanding of when improvements in selectivity have been achieved is often unavailable, imprecise, or poorly defined. This is particularly true at the early stages of testing candidate molecules, where selectivity measures influence decision making on which compound or series should be prioritized into subsequent studies over other molecules. Ideally, one would like to know from a single data point in two assays if a new compound represents an improvement with regard to selectivity from previous compounds.
In vitro selectivity of inhibitor molecules (in enzyme or cell-based assays) is often used as an early surrogate for toxicology and other safety studies. A numerical description of selectivity between two enzymes or cellular responses is typically evaluated as a selectivity ratio (SR) of the potencies in two assays, as below:

This framework is convenient because it provides a measurement of relative differences in selectivity and effectively normalizes for changes in overall potency for the on-target assay between compounds. Using this ratio, compounds having greater selectivity can be prioritized for further study, related analogs can be synthesized, and multiple compounds can be used to generate structure-activity relationships (SARs). However, as all potency determinations will carry noise and uncertainty, an understanding of error propagation in selectivity ratios is critical for the proper interpretation of selectivity data.
When multiple repeats are performed in assays with test compounds, estimates of their uncertainties (for example, by the standard error of the mean [SE]) can be applied to the selectivity ratio equation above, and traditional error propagation rules for division can be applied. 1 However, this is often not expedient or practical during the drug discovery process, because the multiple repeats (for example, N ≥ 3) in these on- and off-target assays needed to power studies to clarify moderate selectivity differences (such as 5- to 10-fold improvements) might lengthen timelines and slow decision making. When dealing with apparent large changes in selectivity ratio (such as >10-fold), improvements are often assumed to be outside the typical uncertainties of the individual assays. Such assumptions ignore the manner that error in these two independent measurements can expand, and particularly when subtle changes in compound selectivity SAR emerge, it can be difficult to decide if an apparent improvement is likely to be a real and reproducible result.
In an example that we will rely on for the remainder of this article, let us consider Janus kinase (JAK) inhibitors. Compounds targeting JAKs have recently shown great promise in the treatment of autoimmune disease.2–4 For example, tofacitinib (CP-690,550), which inhibits the Jak1, Jak2, and Jak3 isoforms, is concluding phase 3 trials for rheumatoid arthritis.5–9 Obtaining selective JAK inhibitors has been a challenge. Because Jak2 mediates erythropoietin (EPO) signaling,10,11 its inhibition may lead to anemia.12,13 Therefore, JAK inhibitor compounds with increased selectivity over Jak2 may offer an advantage in terms of safety and tolerability for patients. We will describe new tools that enable quantitative analyses of statistical significance of such differences, which can be applied to projects such as the identification of selective JAK inhibitors.
Our method extends the framework of the minimum significant ratio (MSR), a parameter that was developed for the differentiation of test compounds within one assay, 14 to the differentiation of selectivity ratios ( Fig. 1 ). As originally defined by Eastwood et al., 14 the MSR is the smallest potency ratio between any two compounds that can be considered significant at 95% confidence. We refer to this as an MSR95. For example, if the MSR95 for a screening assay is 5, then a compound with an IC50 of 10 nM is not significantly different from other compounds with IC50s between 2 and 50 nM, shown by the shaded area in Figure 1a . That is, only compounds with measured potencies outside these bounds can be considered as different from the compound with an IC50 of 10 nM within the resolution of the data with a confidence of at least 95%. Critically, the MSR provides an estimate of the uncertainty in potency for compounds whose IC50s have been measured only once. The minimum significant selectivity ratio (MSSR) can be used to understand if one test compound exhibits selectivity within expected errors in two independent assays, 15 that is, if there is a high probability of measurable difference in its potency on two targets ( Table 1 ). Similarly, for selectivity ratios, we have developed new metrics—the minimum significant ratio of selectivity ratios (MSRSR) and confidence in ratio of selectivity ratios (CRSR)—to understand when the selectivity ratio for one compound is significantly different from selectivity ratios of other test compounds ( Table 1 ; Fig. 1b ). For example, if the MSRSR95 for two assays is 5 and suppose the selectivity ratio of a comparator compound is 30, test compounds should be measured as at least 150-fold selective (30 × 5) to be considered as significantly more selective than the comparator compound with 95% confidence. If another compound in this example has a measured selectivity ratio of 100 from a single measurement, the CRSR method indicates that the probability is 86% that this compound has increased selectivity relative to this comparator compound.
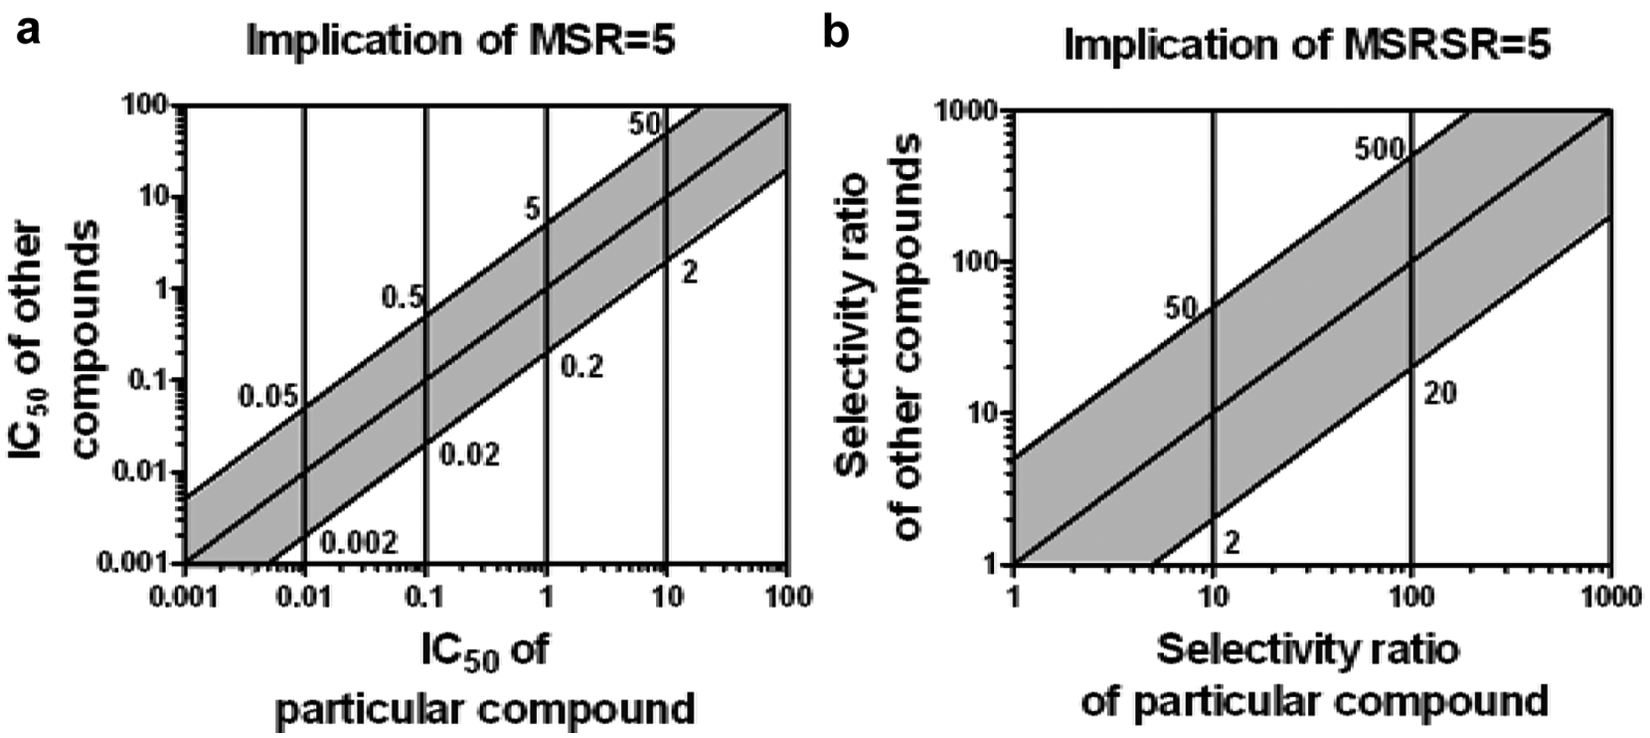
Implications of minimum significant ratios using examples in which (
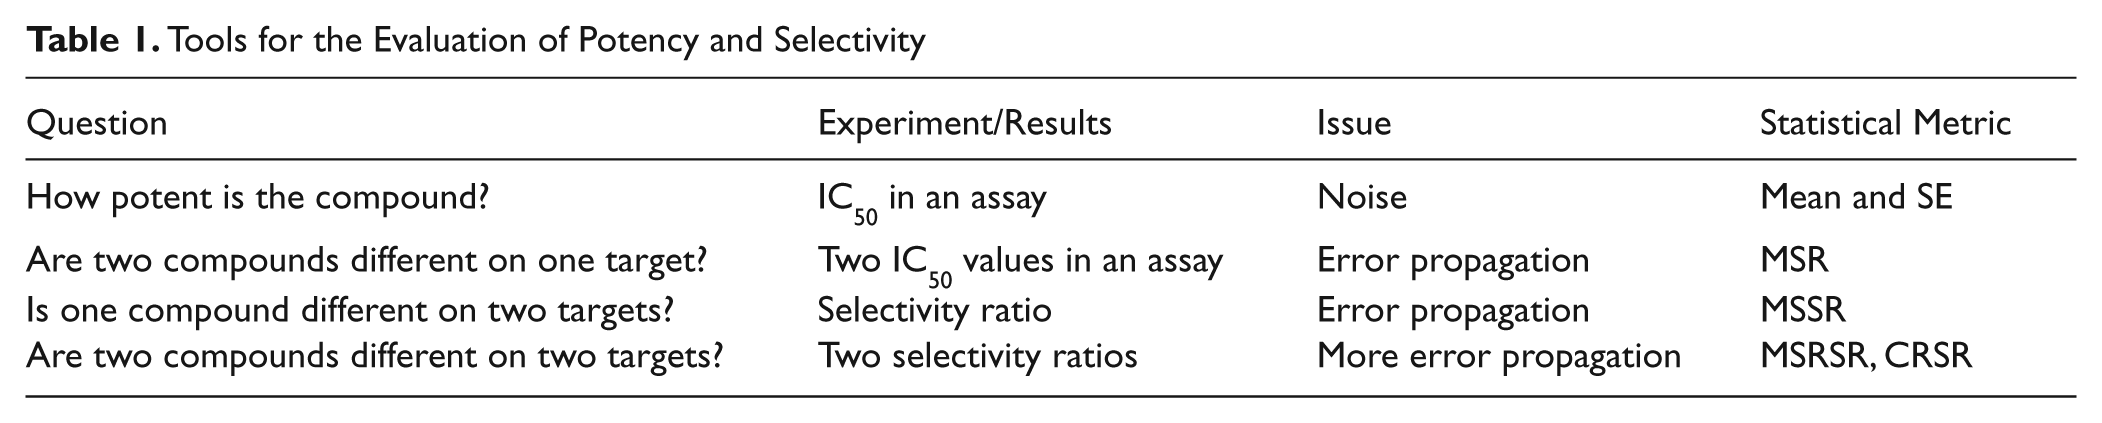
Tools for the Evaluation of Potency and Selectivity
In this report, we use data from our discovery project on JAK inhibitors to illustrate how the interplay of the MSR, MSSR, MSRSR, and CRSR can provide a practical framework for objectively quantifying the significance of selectivity data. Such analysis enables a thorough understanding of improved differentiation from previous or competitor/reference compounds, allowing rapid prioritization to follow-up assays, compound scale up, in vivo studies, synthesis of related analogs, and other subsequent steps toward improved drug molecules.
Materials and Methods
Calculation of MSR
The MSR95 (minimum significant ratio at 95% confidence) is derived from the analysis of logarithm-transformed (log) potency results as described by Eastwood et al. 14

where S is the standard deviation of the logarithm-transformed potencies, Sd is standard deviation of the difference between two log potencies, and N is the number of independent repeats used for deriving the potency results for each compound.14,15
Three general types of MSR evaluations can be used at various stages of a screening assay:
Prior to the initiation of compound screening, an estimate of assay precision can be obtained from testing 15 to 20 compounds over two assay runs via a test-retest MSR. 14
During routine compound screening, potency results of positive control(s) over several assay runs can be used. This is accomplished by using formula 2, in which the MSR is calculated based on potency results from sequential six-run increments. This is called moving MSR. 16
To obtain an estimate of MSR that takes into consideration the variability of multiple compounds rather than just the control compound, data from the positive control and all compounds that have been tested in at least two independent assay runs can be used retrospectively (every few months) to evaluate both the intrarun and interrun variability. 15 This is called retrospective MSR. Evaluation of this MSR should be done carefully using the appropriate statistical model 15 and outlier diagnostics.
Scaling of MSR95 to other confidence levels
Using the MSR95 value obtained from the methods described above, MSR x for other confidence levels (x) can be obtained from

where NormInv(x) is the upper limit of a two-sided standard normal distribution corresponding to a desired level of confidence (x), and it can be obtained easily from spreadsheet programs (NORMINV function in Microsoft Excel). For example, if MSR95 = 3, NormInv(x) = 1.65 and MSRx = 2.47 for x = 90% confidence.
Considering confidence levels other than 95% can be useful. For example, the MSR as a function of confidence levels for one of our assays is plotted in Figure 2 . In circumstances in which more or less certainty is required, MSR values at other confidence levels can be used. In our opinion, the cost in expense and time required to generate assay data enabling similar MSR cutoffs at stringency >90% may not be worthwhile in an early discovery project. Instead, we routinely used MSRs based on 90% confidence, with the expectation that we would advance slightly more false-positives that would be further confirmed by retesting in parallel with downstream evaluations. Although we use MSRs at 90% confidence for the remainder of this article, the same principles and analyses could apply to any desired stringency, including 95% or greater.
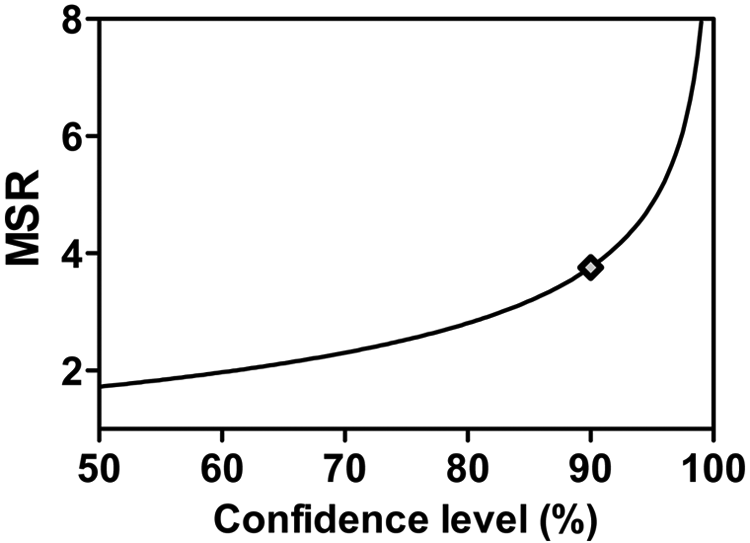
Confidence levels produce a variety of minimum significant ratios (MSRs). Shown is the MSR cutoff for the Jak2 (EPO-stimulated pSTAT5) cellular assay (based on interrun N = 1 values). Ninety percent confidence (shown on the curve with a gray diamond) may be judged to be a reasonable cutoff for driving structure-activity relationship decision making.
MSSR and MSRSR calculation
The MSSR is calculated as described previously 15 using the following formula:
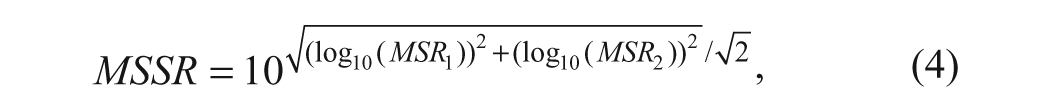
where MSR1 and MSR2 are the MSR values for the assays corresponding to the primary and selectivity targets, respectively (at a specific confidence level).
For example, suppose the MSR of the primary target assay is 3 and the MSR for the selectivity assay is 6, then from formula 4, the MSSR is 4.42. There are different ways to interpret and use such information.
If the desired biological selectivity between two targets is 100-fold, compounds must have selectivity ratios of 442 or greater (100 × 4.42) to have confidence that they are at least 100-fold selective.
In the above scenario, compounds with measured selectivity ratios between 23 (100/4.42) and 442 can be considered as “potentially 100-fold selective.” Depending on other characteristics such as potency, physical/chemical properties, ADME, and so forth, such compounds could also be considered for downstream testing. Alternatively, such compounds can be retested, and their observed selectivity from the average of two repeats can be viewed with the updated value of MSSR (using N = 2 for MSR in formulae 2 and 4).
If a compound tests as 100-fold selective, one can conclude with confidence that it is at least 23-fold selective (100/4.42).
Notably, the MSSR as defined above assumes independence of the measurements in the two different assays (as when compounds are run on different days using different reagent preparations in each assay). This was the case for the JAK data we use to illustrate the methods in this article. This method provides a stringent, general approach to assess selectivity for a given compound and is relevant to most cases in our experience. If measurements from the two assays are expected to be correlated due to analytical factors such as when the assays are run together in a panel or when same compound dilutions are used in both assays, and if a reliable estimate of this correlation is available, the above formula can be modified to incorporate this correlation (ρ12) as follows:

The MSRSR is defined as the smallest fold change of selectivity ratios between two compounds that can be considered statistically significant at a specific degree of confidence. Similar to MSSR, it is calculated using the MSR estimates of the primary and selectivity assays via the formula

For example, suppose the 90% confidence MSR of the primary assay is 2 and the off-target assay MSR is 3, then the MSRSR from formula 6 is 3.67. This means that if the selectivity ratio of a reference compound is 30, test compounds should have a selectivity ratio of 110 (30 × 3.67) to be considered as significantly more selective with >90% confidence. Alternatively, it also implies that if the measured selectivity ratio of our test compound is 20, it cannot be considered as significantly less selective than the reference compound as the ratio of selectivity ratios is well within the MSRSR value of 3.67. Similarly, as described above for the MSSR in formula 4, the MSRSR described in formula 6 assumes independence of the measurements in the two different assays as was reasonable in the case of the JAK data used in our illustration. When this assumption is not reasonable, the MSRSR equation in formula 6 can be modified to include an estimate of this correlation (ρ12) as follows:

The above formulae for evaluating MSSR and MSRSR are useful when retrospective MSR values from each of the two assays are used. Similar to the concept of moving MSR described earlier, one can also determine moving MSSR and moving MSRSR using the selectivity ratio of a single control compound and the ratio of selectivity ratios of two control compounds, respectively. This would help account for correlation between measurements from the two assays due to analytical factors and is especially useful when assays are run as a panel.
Confidence level of ratio of selectivity ratios (CRSR)
The CRSR can be evaluated as follows. Suppose Z = log(SR1) – log(SR2), where SR1 and SR2 are the selectivity ratios that we wish to compare between any two compounds of interest, and the observed value of this difference is z, then the confidence level of the difference of two selectivity ratios is given by

To evaluate this probability, the distribution of Z is assumed to be normal with mean = 0 and variance given by
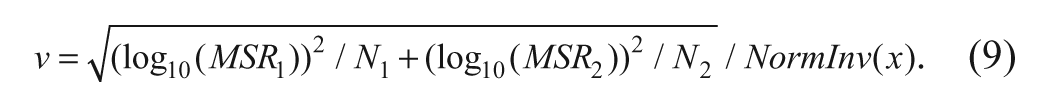
where MSR1 and MSR2 are the MSR estimates of the two assays, respectively; N1 and N2 are the number of times the compounds are tested in the two assays, respectively, and NormInv(x) is the upper limit of the two-sided standard normal distribution corresponding to the level of confidence (x) considered in the evaluation of MSR1 and MSR2. Thus, the probability, P(Z > z), for the evaluation of CRSR can be evaluated easily using spreadsheet programs. For example, in Microsoft Excel, this can be evaluated as P(Z > z) = NORMDIST(log(z), mean = 0, var = v), where NORMDIST refers to the probability from the normal distribution with mean = 0 and variance = v as indicated above. When assays are expected to be correlated, the above equation can be extended similarly to formulae 5 and 7.
Results
Precision of Jak Cellular Assays
Because of the potential undesirable effects of Jak2 inhibition described above, we believe that JAK inhibitors with increased selectivity against this isoform would have more favorable biological properties. We therefore built a screening paradigm to evaluate the selectivity of Jak1 relative to Jak2. Our cellular assays use AlphaScreen technology to measure the extent of JAK-dependent tyrosine phosphorylation on STAT molecules (methods described in supplementary materials). These assays provide a useful, target-proximal readout to understand the cellular effects of JAK inhibitors (
Retrospective MSR values were calculated for our JAK cellular assays based on an extensive period of use and are shown in Table 2 . The overall (i.e., interrun) MSR values for a compound tested once (N = 1) is 3.60 for the IL-6/Jak1 assay and 3.83 for the EPO/Jak2 assay. This indicates that compound potencies measured in a single experiment can be distinguished only as different from compounds ~fourfold higher or lower that were also tested once previously in another experiment. Because assays typically have higher variability between experiments than within a single experiment, it is useful to look at the intrarun (within run) MSR to compare compounds tested at the same time. In the case of our cellular assays, it is interesting to note that intrarun MSR for the EPO pSTAT5 assay is somewhat lower than that for the IL-6 pSTAT3 assay, even though the overall (interrun) MSRs are higher for the EPO assay. This suggests that the EPO/Jak2 assay is more precise within a run but that its assay drift over time is somewhat greater. In either case, the overall precision of these assays is high in comparison to typical cellular assays. Moreover, the precision in these assays was generally better than we experienced with JAK enzymatic assays (using isolated kinase domains to phosphorylate small model peptides) where MSRs were somewhat higher (data not shown). Therefore, we relied on the JAK cellular assays as the principal means by which we evaluated Jak2/Jak1 selectivity.
Retrospective MSR90 and Corresponding Minimum Significant Selectivity Ratio (MSSR) and Minimum Significant Ratio of Selectivity Ratio (MSRSR) for JAK Cellular Assays a
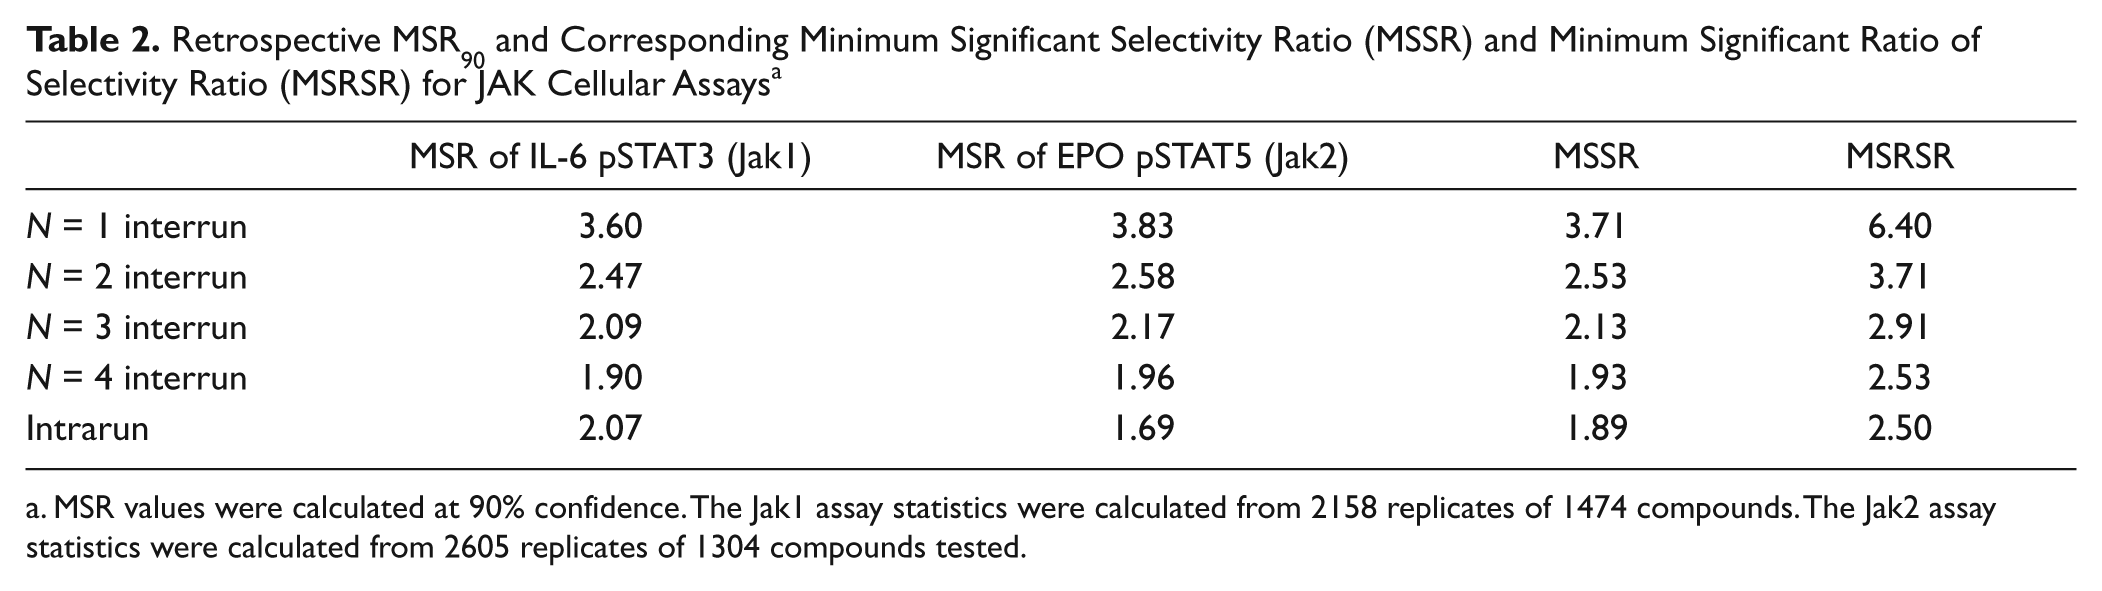
MSR values were calculated at 90% confidence. The Jak1 assay statistics were calculated from 2158 replicates of 1474 compounds. The Jak2 assay statistics were calculated from 2605 replicates of 1304 compounds tested.
Moving MSR and Cumulative MSR for Reference Compounds
A plot of the Jak potency values and the moving MSR versus run date is shown in
Figure 3a
. The Moving MSR acts as a tracking window to estimate precision over several recent experiments (from weeks 1–6, 2–7, 3–8, etc.). Routinely monitoring trends in assay variability over time with such plots is often helpful to identify unusual outliers and scrutinize for assay drift. Although graphing potency results of a reference compound over time can reveal some of these patterns, the moving MSR values provide an objective and practical criteria for determining whether changes are meaningful. For example, acceptance criteria for an assay run can be based on obtaining a moving MSR below an acceptable limit together with control compound potencies. By its nature, the moving MSR rises as variability in recent runs increases. Importantly, when overall noise in an assay increases, the magnitude of the moving MSR increases even when the overall mean of the last six experiments is similar to the mean from prior results. This concept can be extended below to track variability of selectivity ratios over time (moving MSRSR; see plot at bottom of
Fig. 3b
). Similarly, one can use all potency data for control compounds to calculate a cumulative control MSR for a particular inhibitor (
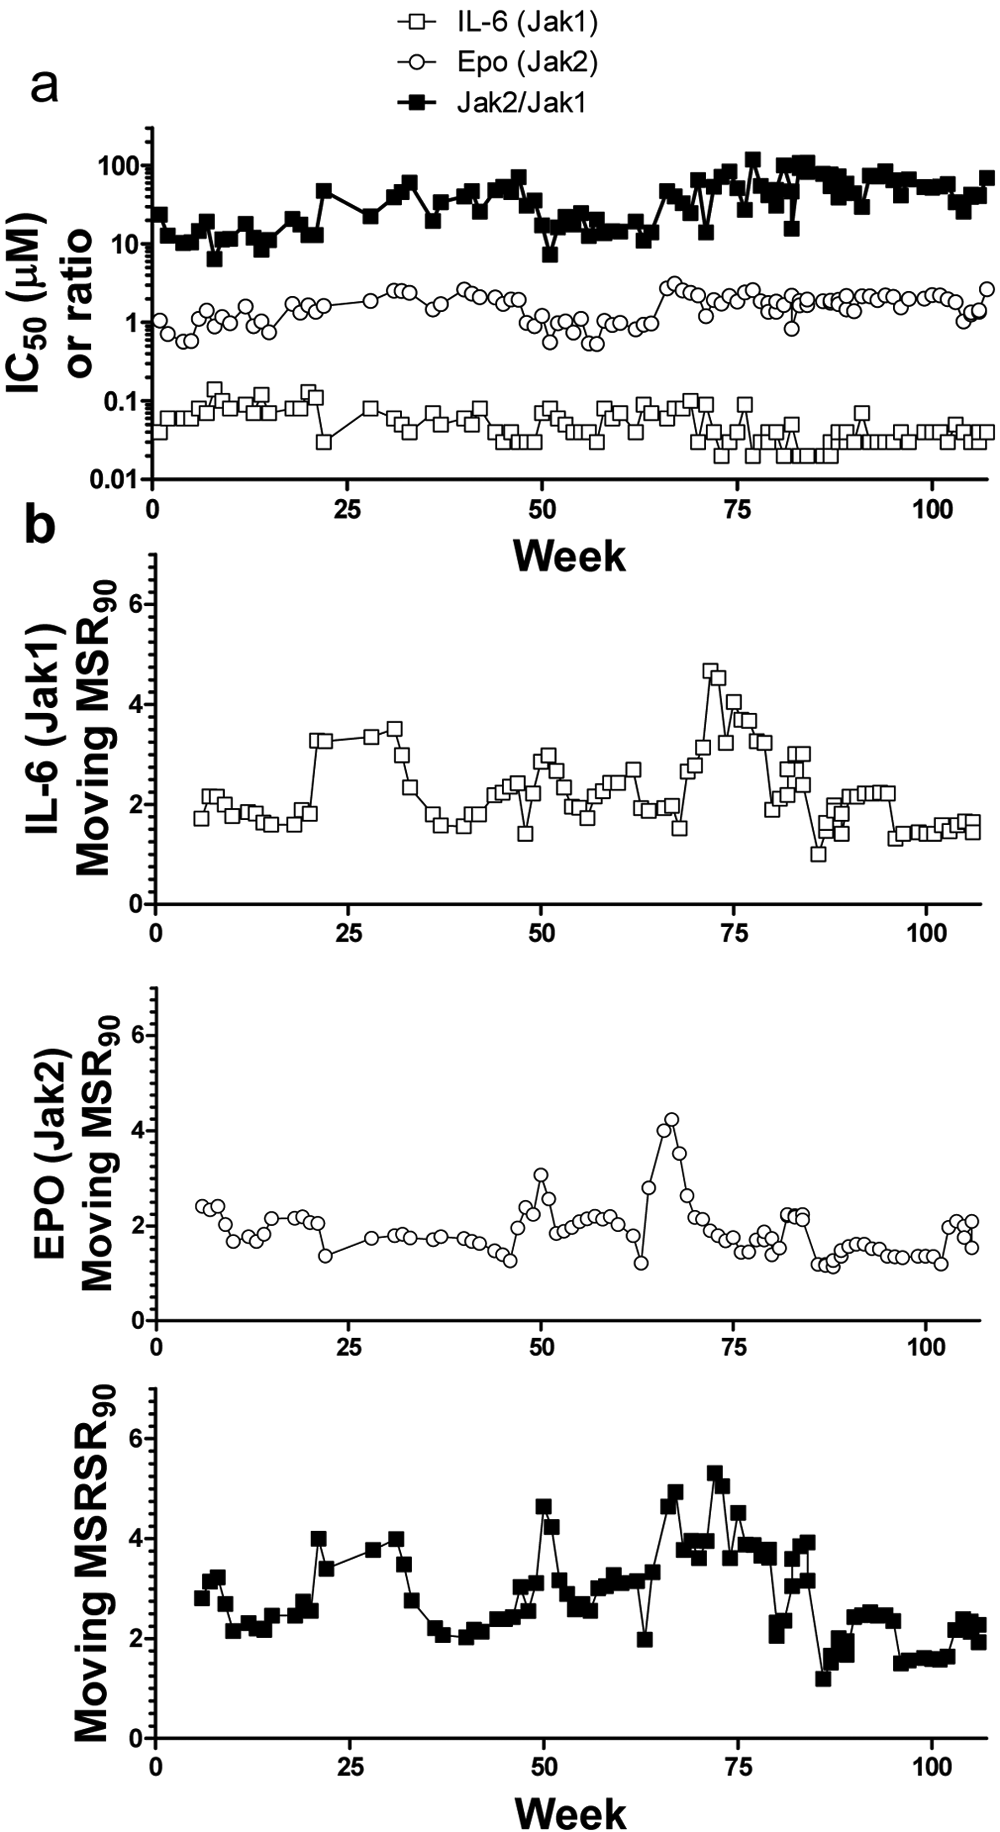
Potency of compound 1 and moving minimum significant ratios (MSRs) after approximately 2 y of JAK cellular assays. (
MSSR for Selectivity between Two Assays
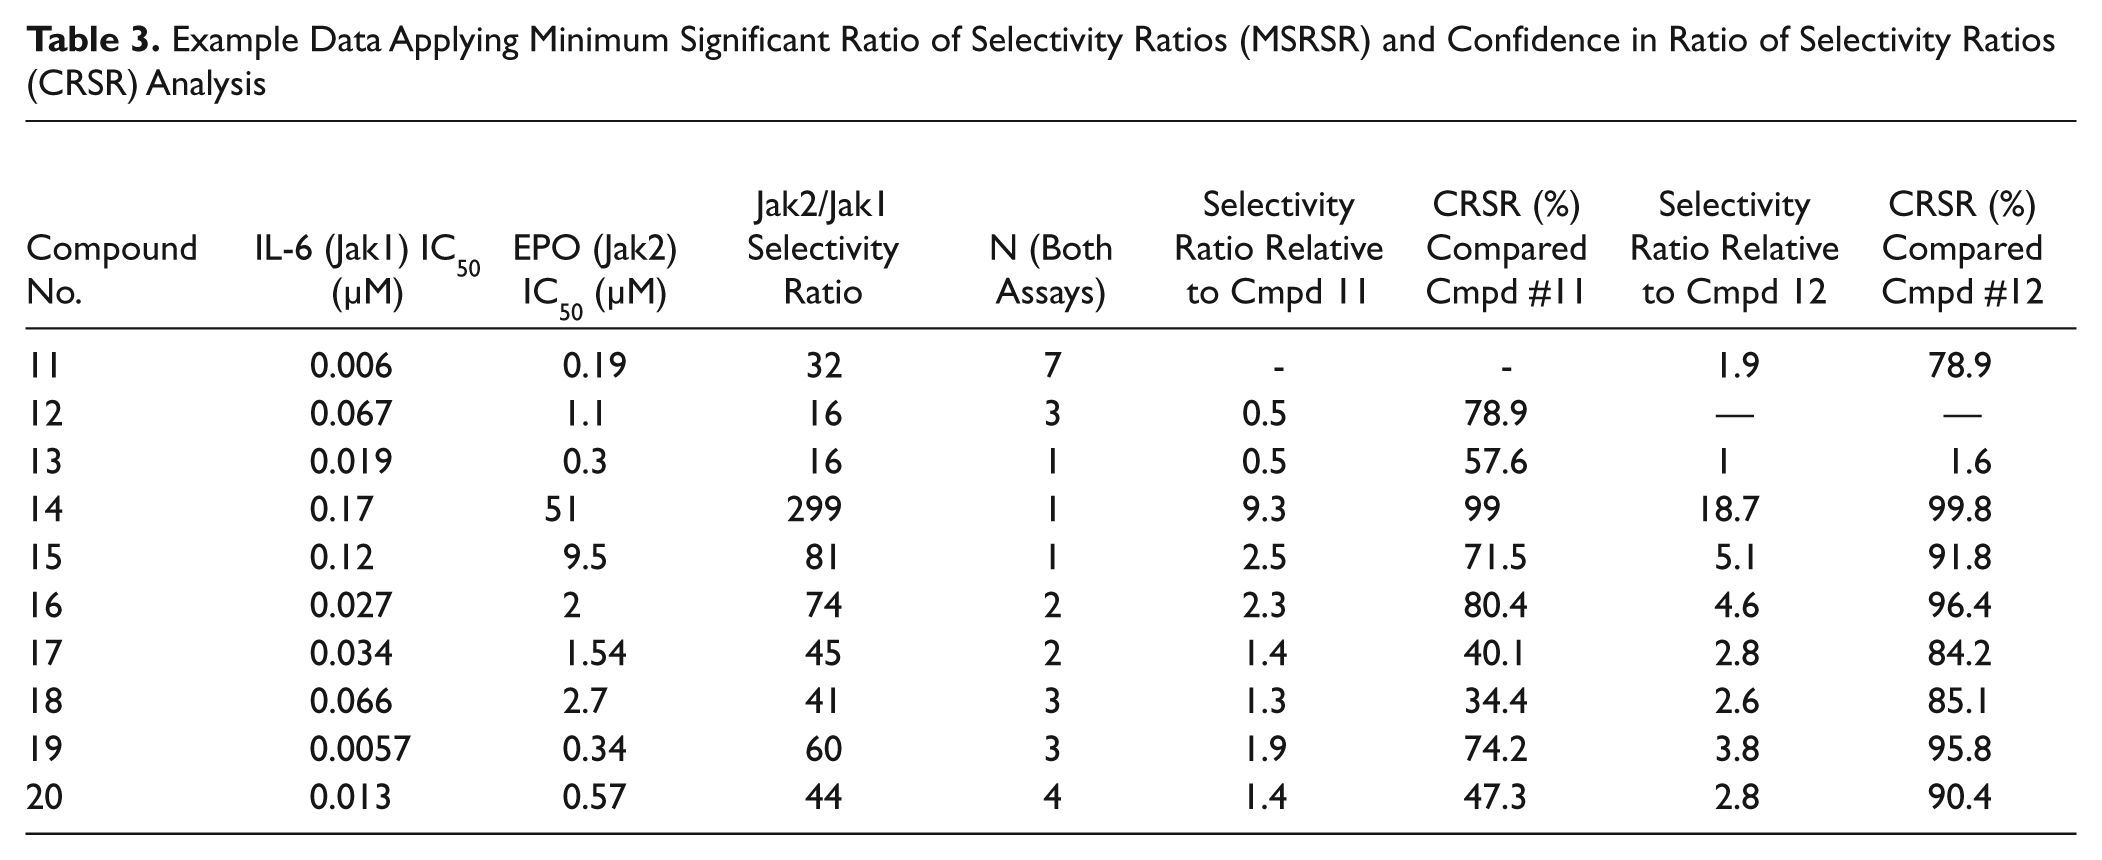
As described in the Materials and Methods section and by Devanarayan and Sittampalam, 15 the MSSR defines the smallest potency ratio in two assays for which a test compound can be considered as having significant selectivity at a certain confidence level. Using 90% confidence retrospective MSRs, the MSSR values for our JAK cellular assays are shown in Table 2 . A number of example compounds are given in Table 3 , and all greatly exceed the MSSR criteria (3.7 for N = 1) and therefore show discernible selectivity between the IL-6/Jak1 (target) and EPO/Jak2 (off-target) assays. Importantly, the MSSR does not answer the equally critical question of whether the selectivity ratios of two compounds are meaningfully different. To elucidate this problem, we devised the MSRSR and CRSR metrics (see next section).
Example Data Applying Minimum Significant Ratio of Selectivity Ratios (MSRSR) and Confidence in Ratio of Selectivity Ratios (CRSR) Analysis
MSRSR and CRSR for Selectivity Ratios between Two Compounds
The MSRSR values (calculated from the retrospective MSRs as described in the Materials and Methods section) for our JAK cellular assays are shown in Table 2 . These provide key information toward understanding when compounds are different in Jak2/Jak1 selectivity. Example of JAK inhibitors compounds of a variety of potency, selectivity, and replicate number are presented in Table 3 . For example, consider the question of whether Cmpd 15 is more selective than Cmpd 12. A comparison of the selectivity ratios shows that RatioCmpd 15 divided by the RatioCmpd 12 equals 5.1. Because Cmpd 15 has been tested only once in both JAK cellular assays, a comparison with the N = 1 MSRSR cutoff of 6.4 (from Table 1 ) indicates that we cannot be confident that Cmpd 15 is more selective than Cmpd 12. However, the same mean values of the ratios with N = 2 for Cmpd 15 (where the MSRSR is 3.7) would indicate >90% chance that these compounds have different selectivity ratios. Similarly, compound 16 has a Jak2/Jak1 selectivity ratio (74) that is 4.6 times greater than that for compound 12, which exceeds the MSRSR (N = 2) threshold for significance of 3.7.
Large selectivity ratios obtained after a single test in the two JAK cellular assays will exceed the N = 1 MSRSR and can immediately indicate significant improvements. For example, Cmpd 14 has a Jak2/Jak1 selectivity ratio of 299 ( Table 3 ), and relative to inhibitors like Cmpds 11, 12, and 13 (with selectivity ratios from 16–30), Cmpd 14 can be immediately recognized as a significant improvement over the previous compounds and could be prioritized. After one measurement, Cmpd 14 (having a selectivity ratio of 299) does not show a significant (90% confidence) difference from the selectivities of Cmpds 15, 16, and 19 (having selectivity ratios from 60–81). Of course, subsequent testing (N > 1) of Cmpd 14 might permit a smaller selectivity ratio to be considered significant, but with the existing data, an improvement in selectivity cannot be affirmed by MSRSR analysis. One can therefore adopt a strategy of retesting compounds that are just above or just below the MSRSR cutoff relative to other compounds of interest to confirm or refute that they represent selectivity improvements. Moreover, compounds tested once that are well below the MSRSR cutoffs can be deprioritized with reasonable confidence that they do not offer improved selectivity.
The MSRSR provides a convenient threshold that can be used as a cutoff value, but it does not give a precise quantification of the confidence level for specific compounds. This is especially relevant for compounds that show potential increase in selectivity but do not achieve the MSRSR threshold. We also found that we were often comparing selectivity ratios between two compounds that had been tested a different number of times. We therefore desired a more precise numerical confidence value that we could apply to any given pair of selectivity ratios. To this end, we devised the CRSR (see formulae 8 and 9 in the Materials and Methods section). This uses MSR values together with the number of times a given compound has been tested in both assays and its average selectivity ratio to arrive at a confidence score (in percentage) that two compounds have measurably different selectivities. Examples of confidence levels for comparison of several compounds are given in Table 3 .
Furthermore, because the CRSR gives fixed values relative to any well-determined standard (such as current lead or comparator compounds we wish to improve upon), the CRSR can be used to calculate a confidence curve based on selectivity ratios for any other compound. For example, in Figure 4 , we show the curve that relates confidence in improved selectivity ratio as a function of measured selectivity ratio (tested once) relative to a comparator compound tested 10 times with a selectivity ratio of 40.
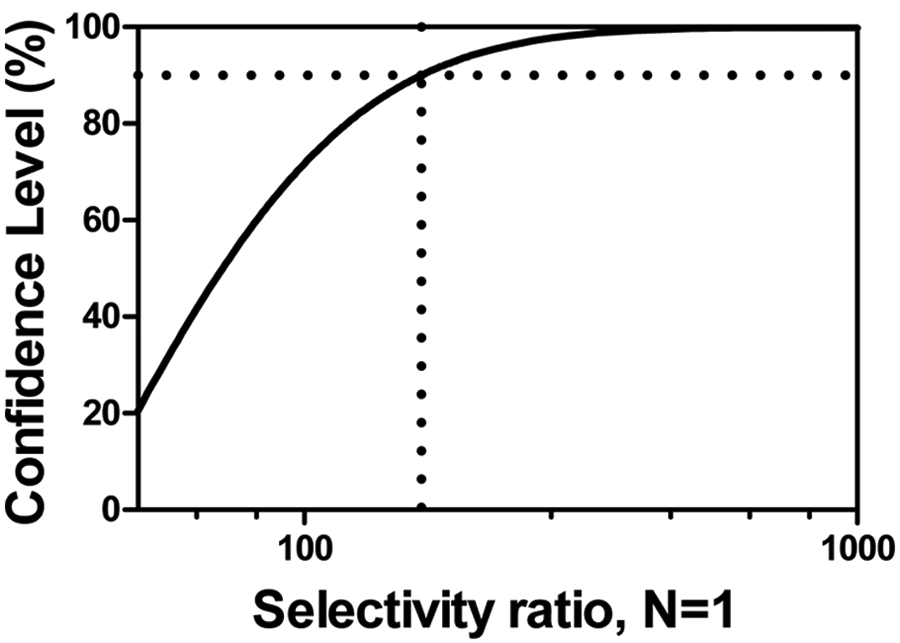
Confidence in ratio of selectivity ratio score relative to reference compound with N = 10 and average selectivity ratio of 40. Ninety percent confidence (dotted lines) is obtained when selectivity is 163.
Intrarun Cutoffs
As the retrospective MSR reveals that there is less variability within experiments conducted at the same time as opposed to across multiple run dates, we found it informative to further consider the implications of the intrarun MSRSR. For the JAK cellular assays, the intrarun MSRSR is 2.5, which is considerably smaller than the N = 1 overall (interrun) MSRSR equal to 6.4.
With this increased resolution, by comparing compound selectivities relative to an early comparator compound (compound 1) run each week as a control in our assay, we were able to more easily discern compounds that have improved properties relative to its selectivity. Because there is some variability across control values in separate runs ( Fig. 5 ), this means that the extent of Jak2/Jak1 selectivity needed to exceed the intrarun MSR fluctuates slightly. In Figure 5 , test compounds are shown in black circles and are compared with the selectivity for compound 1 within a given week. Limits for selectivity as predicted by the intrarun MSRSR (as discernible from compound 1) are depicted by the lines in Figure 5a . Compounds that are more selective for Jak1 relative to Jak2 are those above the upper line. In Figure 5b , the line at the intrarun MSRSR of 2.5 separates compounds in a given set of assays that are significantly more selective than the control. This example of data from a 2-y period shows examples of assay drift. The average selectivity of the control compound was 13 during weeks 1 to 10. By weeks 40 to 50, it had increased to 42. We speculate this was due to small, unintentional changes in the cell culture conditions, the reagents used to stimulate or detect STAT phosphorylation or some combination thereof. This 3.2-fold change in selectivity of the control compound is small relative to the precision of the two assays measured by MSR and could stem from subtle changes to the average potency in the two assays (that is, a 0.6-fold increase in Jak1/IL-6 potency and a 1.9-fold decrease in Jak2/EPO potency). Importantly, the intrarun MSRSR can be used to correct for these small changes, and, as seen in the lower plot, selectivity data normalized to drift within the control can be a useful way to consider these data. By dividing the obtained selectivity ratios in one run with the selectivity ratios of the control from that same run, we may better account for small changes in assay performance. In general, the intrarun MSRSR together with a standard compound cutoff provides immediate information that can be used to understand emerging SAR and prioritize compounds for additional studies. Therefore, the use of intrarun MSRSR in conjunction with the overall MSRSR (that takes into consideration both the intrarun and interrun variability) was valuable to help discriminate and prioritize compounds for this project.
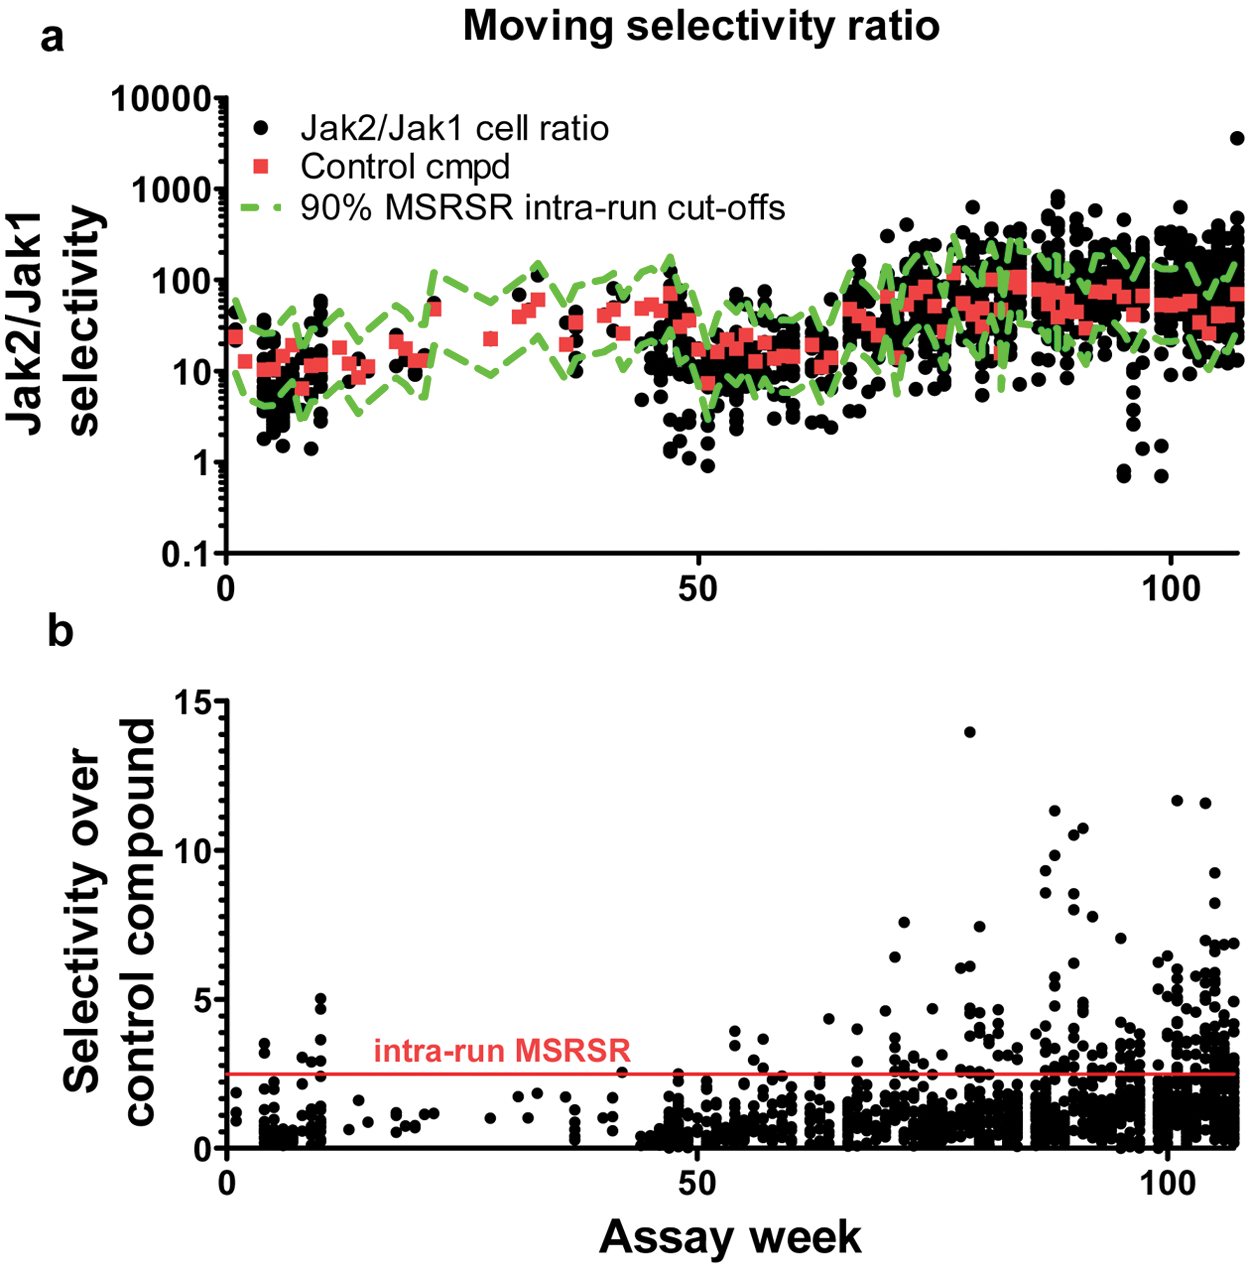
Moving selectivity ratio with 90% significance limits as determined by intrarun minimum significant ratio of selectivity ratios (MSRSR) collected over 2 y of JAK cellular assays. Black circles represent test compounds. Squares indicate the compound 1 control used in each run. (
Discussion
The question of compound selectivity is a topic of continual importance and concern in drug discovery. Candidate drug molecules that act on desirable protein targets also often have effects against undesirable and/or unnecessary off-target proteins. These can lead to side effects or toxicities that narrow therapeutic indices and otherwise limit the ability to dose drug molecules to full effect. Understanding the results of animal models and, indeed, the mechanistic interpretation of clinical trial results requires an understanding of the selectivity of the molecules being used.
However, in our experience, a framework for understanding when improved selectivity has been achieved by means of in vitro screening assays reporting on the activity of two targets is not well understood. Regrettably, in many cases, a rigorous, quantitative analysis of selectivity that fully considers errors in measurement is not used in drug discovery. Because of inherent noise in screening assays, it can be difficult, therefore, to discern when significant changes to selectivity (i.e., those likely to be meaningful and reproducible) in a series of candidate molecules are obtained. Obviously, this is particularly relevant when the margin of difference between selective molecules approaches the precision and reliability of a given assay. Ideally, one would like to robustly interpret selectivity results from early testing and enable decision making to rapidly prioritize analogs for additional studies. Further complicating selectivity analysis, it is precisely when early data at small replicate number (N ≤ 2) are obtained that traditional statistical methods of considering error propagation are inadequately defined.
To address this important issue, we devised extensions of the MSR that allow quantification of the significance of selectivity ratios. The MSSR 15 describes when results across two assays for one compound can be considered as significantly different (i.e., there is measureable selectivity). To compare selectivity ratios between two compounds, we developed another parameter, the MSRSR. This new metric takes advantage of measured noise in two different assays from multiple compound IC50s across multiple experiments (through the MSR). Such information then informs a statistical interpretation of when selectivity results are meaningful through the MSRSR and the related confidence measure called the CRSR. In this report, cellular inhibition data are given as a practical example of how we applied these metrics to understand assay precision and its subsequent implications for interpreting Jak2/Jak1 selectivity.
MSR Determination
We typically calculate the retrospective MSR early in the initial use of an assay and then periodically (after 4–6 mo) to ensure that no large changes have occurred. To maintain an updated view on assay performance, we routinely rely on weekly tracking of reference compound potency and the associated moving MSR to qualify and troubleshoot screening data (
Fig. 3
). As is typical in our experience, the cumulative control MSRs taken from several reference compounds used in our JAK cellular assays are similar to the retrospective MSRs obtained (
Selectivity Metrics: MSSR, MSRSR, and CRSR
Determination of the MSR allows for the use of the associated selectivity metrics presented here. The MSSR sets a threshold that a given compound must exceed to exhibit discernible selectivity (i.e., a statistically significant difference) between two assays ( Table 1 ). In contrast, the MSRSR allows an understanding of improved selectivity ratios between compounds ( Fig. 1 ; Table 1 ). This metric was critical in our JAK inhibitor project in which a number of early compounds showed modest selectivity differences.
The MSRSR and CRSR metrics provide insight into which compounds can be deprioritized and which show compelling selectivity at low replicate number. Importantly, when comparing the same selectivity ratios, MSRSR cutoffs become smaller and CRSR confidence values become larger as the replicate number (N) increases. Compounds that are near the MSRSR cutoff (or show CRSR scores of ~80%−90%) relative to a benchmark compound require additional selectivity testing to confirm or refute the notion that they show measurable improvements to selectivity. Curves from the CRSR (as in Fig. 4 ) allow discovery scientists to quickly ascertain the likelihood (in % confidence) that new compounds exceed a previous standard and provide an immediate quantitative estimate that subsequent testing will confirm the observation.
Compound Retesting and “Within-Run” Analysis
The MSRSR metric affected our retesting strategy in our JAK project. As there is a large reduction in the MSRSR going from N = 1 to N = 2 (from 6.4 to 3.7; see Table 2 ), we typically triggered automatic retesting the next week in both cellular assays for compounds having IL-6/Jak1 potency less than 100 nM. Based on the smaller decreases in MSRSR going from N = 2 to N = 3 data (from 3.7 to 2.9), testing compounds a third time was not generally employed unless compounds gave results that were of higher than typical variability within the initial two measurements. Furthermore, as the change in interrun MSRSR going from N = 3 to N = 4 was quite small (<0.4; see Table 2 ), we saw little reason to employ testing beyond N = 3, except for compounds of very high interest.
Because variability is lower by comparing compounds tested at the same time (see intrarun MSRs from Table 2 ), we also looked closely at the selectivity of test compounds relative to control compounds within a weekly run ( Fig. 5 ). This estimate, based on a single run of test compounds in comparison to a benchmark compound of well-defined potency, provides a quick read on selectivity. This enables rapid SAR analysis and nimble decision making regarding which compounds should be prioritized for further studies. In both plots in Figure 5 , it is apparent that test compounds with improved selectivity relative to an early comparator became more frequent over time. As one aim of our medicinal chemistry program was improved Jak1 selectivity relative to Jak2, having the statistical framework of the MSRSR provided us an objective measure of progress toward this goal.
In summary, a quantitative understanding of selectivity is an important consideration for development of most drug candidates. We have created new metrics (MSRSR and CRSR) based on the MSR to quickly discern whether apparent improvements in selectivity are statistically significant. These tools enable objective decision making around compound selectivity, an area in which qualitative decisions have long been the rule. As such, we believe that these tools can improve the efficiency of drug discovery and help increase confidence in moving candidate molecules into further development.
Footnotes
Acknowledgements
The authors thank members of the Abbott Laboratories’ JAK chemistry team for providing inhibitor compounds; Jonathan George, Denise Perron, and Andres Salmeron for early assay development; and Salam Shaaban, Steven King, Frank Shen, and Lisa Olson for helpful discussions.
Declaration of Conflicting Interests
The authors declared no potential conflicts of interest with respect to the research, authorship, and/or publication of this article.
Funding
All authors are/were employees of Abbott Laboratories. The authors received no additional financial support for the research, authorship, and/or publication of this article.
Abbreviations: CRSR, confidence in ratio of selectivity ratios; JAK, Janus kinase; MSR, minimum significant ratio; MSR95, minimum significant ratio at 95% confidence; MSSR, minimum significant selectivity ratio; MSRSR, minimum significant ratio of selectivity ratios; MSRSR95: minimum significant ratio of selectivity ratios at 95% confidence; pSTAT3, phosphorylation of STAT3, pSTAT5, phosphorylation of STAT5; RA, rheumatoid arthritis; SAR, structure-activity relationship; SE, standard error of the mean; SR, selectivity ratio.
References
Supplementary Material
Please find the following supplemental material available below.
For Open Access articles published under a Creative Commons License, all supplemental material carries the same license as the article it is associated with.
For non-Open Access articles published, all supplemental material carries a non-exclusive license, and permission requests for re-use of supplemental material or any part of supplemental material shall be sent directly to the copyright owner as specified in the copyright notice associated with the article.