
Abstract
A major hallmark of Alzheimer’s disease (AD) is the formation of neurotoxic aggregates composed of the amyloid-β peptide (Aβ). Aβ has been recognized to interact with numerous proteins, resulting in pathological changes to the metabolism of patients with AD. One such mitochondrial metabolic enzyme is amyloid-binding alcohol dehydrogenase (ABAD), where altered enzyme function caused by the Aβ-ABAD interaction is known to cause mitochondrial distress and cytotoxic effects, providing a feasible therapeutic target for AD drug development. Here we have established a high-throughput screening platform for the identification of modulators to the ABAD enzyme. A pilot screen with a total of 6759 compounds from the NIH Clinical Collections (NCC) and SelleckChem libraries and a selection of compounds from the BioAscent diversity collection have allowed validation and robustness to be optimized. The pilot screen revealed 16 potential inhibitors in the low µM range against ABAD with favorable physicochemical properties for blood-brain barrier penetration.
Keywords
Introduction
Alzheimer’s disease (AD) is the most common form of dementia, and with current therapies at best palliative, the development of a drug that can halt or even reverse the progression of AD is an essential goal to manage this debilitating disease. Despite being identified over 100 years ago, the underlying cause of AD is a contentious issue with proponents for a number of theories. However, the amyloid cascade hypothesis, which implicates amyloid-β peptide (Aβ) as the main causative agent, has been generally accepted. 1 Amyloid-binding alcohol dehydrogenase (ABAD, or 17β-hydroxysteroid dehydrogenase type 10) was first identified as an Aβ-binding protein in 1997 using a yeast two-hybrid system, 2 a finding that was subsequently confirmed using a number of techniques.2–4 ABAD is known to interact with the two major plaque-forming isoforms of Aβ—namely, Aβ(1–40) and Aβ(1–42)—leading to distortion of the enzyme structure and inhibition of its normal function as an energy provider for cells.5,6 In vitro experiments have shown that the interaction between ABAD and Aβ is cytotoxic, and ABAD’s function is altered with a buildup of reactive oxygen species (ROS) and toxins leading to mitochondrial dysfunction. 7 Using site-directed mutagenesis and surface plasmon resonance (SPR), Lustbader et al. 3 identified the LD loop of the ABAD protein as the binding site for Aβ and subsequently synthesized a 28–amino acid peptide encompassing this region (amino acids 92–120) that was termed the ABAD-decoy peptide (ABAD-DP). Again using SPR, it was shown that this ABAD-DP could inhibit the binding of ABAD to Aβ(1–40) and Aβ(1–42). Significantly, the inhibition of the interaction between ABAD and Aβ by ABAD-DP was shown to translate into a cytoprotective effect in cell culture experiments. 8 Cultured wild-type cortical neurons exposed to Aβ(1–42) showed a significant increase in cell death, as measured by cytochrome-c release, while those preincubated with the ABAD-DP did not. 8 This work demonstrated that inhibition of the ABAD-Aβ interaction may offer a novel therapeutic avenue for the treatment of AD.
Other than the disruption of the ABAD-Aβ interaction, a second approach may hold merit in treating AD: the direct modulation of ABAD activity. In vitro experiments with SHSY-5Y cells administered with the ABAD inhibitor, AG18051, show a reduction in mitochondrial dysfunction and oxidative stress associated with the interaction between ABAD and Aβ, and they are protected from Aβ-mediated cytotoxicity, 9 suggesting that inhibition of ABAD may also be a viable therapeutic approach in the treatment of complexities that exist within AD. To screen and identify new efficacious drug-like inhibitors, we have already developed an ABAD activity assay, 10 using the loss of absorbance of the enzyme’s cofactor, nicotinamide adenine dinucleotide (NADH) (at 340 nM), as ABAD converts it to NAD+ as its readout. However, since few modulators of ABAD activity have been reported and with limited compound diversity as starting points for those that have, we optimized this assay further to achieve an improved, robust assay amenable to high-throughput screening (HTS) on a 384-well plate scale.
Materials and Methods
All aqueous solutions were prepared with deionized water (Millipore, Watford, Hertfordshire, UK) and all chemicals purchased from Sigma Aldrich (Gillingham, Dorset, UK) unless stated. ABAD protein was expressed and purified as described in Aitken et al. 2016. 11 The initial 96-well plate screening assay conditions are described in Hroch et al. 10 Assay buffer used contains 10 mM Tris-HCl (pH 7.4), 150 mM NaCl, 1 mM dithiothreitol (DTT), 0.005% Tween, and 0.01% bovine serum albumin (BSA). As indicated for some experiments, the assay buffer was supplemented with 100 U/mL bovine liver catalase. All experiments were conducted in clear-bottom 384-well low-volume microplates (Corning, Corning, NY) with a final assay volume of 20 µL, and the reaction progress was monitored by oxidation of NADH as determined by reduction in absorbance at 340 nm read on the EnVision plate reader (PerkinElmer, Waltham, MA).
Acetoacetyl-CoA Enzyme Kinetics
To determine the kinetics for acetoacetyl-CoA and the effect of ABAD concentration upon reaction rate, a matrix titration experiment was set up. Previously determined conditions 10 were used with a fixed concentration of 700 µM NADH and a starting concentration of up to 200 µM acetoacetyl-CoA. Doubling dilutions of acetoacetyl-CoA were then coupled with doubling dilutions of ABAD, which started with a maximum concentration of 40 nM. Data collected from the experiment were analyzed using a standard template from which reaction progress curves were analyzed to calculate initial velocities and obtain Km values using the Michaelis-Menten equation (XLFit; ID Business Solutions, Guildford, Surrey, UK).
NADH Enzyme Kinetics
To determine the kinetics for NADH and the effect of ABAD concentration upon reaction rate, a matrix titration experiment was set up. Previously determined conditions 10 were used: 120 µM acetoacetate and a starting concentration of up to 1000 µM NADH. Doubling dilutions of NADH were then coupled with doubling dilutions of ABAD, which started with a maximum concentration of 40 nM. Data were analyzed as described previously.
Assay Development
An optimal ABAD concentration was established using a range of concentrations (0.625, 1.25, 2.5, and 5 nM), with measurements taken up to 60 min after the reactions were started to capture the full extent of the reaction linearity. Assay DMSO tolerance was tested from 20% using a 10-point serial dilution with reads being taken up to 60 min as before. Reagent stability experiments were carried out whereby reactions were started 0, 1, 2, 4, and 8 h after reagent preparation. All reagents were maintained at room temperature throughout the course of the experiment.
Compound Screening
For primary screening, an end-point assay format was adopted in which an Echo acoustic liquid dispenser (Labcyte, Sunnyvale, CA, USA) was used to transfer 20 nL of reference standard, DMSO control (0.5% final assay concentration [FAC]), or test compounds (10 µM FAC) to the assay plate. Then, 10 µL ABAD enzyme in assay buffer (2.5 nM FAC) was added to the plates using the Preddator liquid handling robot (Redd and Whyte Edmonds, Suffolk, UK), and plates were incubated at room temperature for 15 min. Next, 10 µL substrate mixture (100 µM acetoacetyl-CoA and 100 µM NADH FAC) was added with the Preddator. To start the reaction, the plates were left to incubate for 35 min at room temperature before the absorbance at 340 nm was read on the EnVision plate reader (PerkinElmer). For kinetic assay format follow-up experiments, the same protocol was adopted, but the absorbance at 340 nm was monitored constantly for 45 min immediately after the reaction was started.
Physiochemical Predictions
Published values were obtained for the NCC/SelleckChem hits (where available) from DrugBank (http://www.drugbank.com), and where there were no published values, predictions were made using the ChemAxon Marvin suite (ChemAxon, Budapest, Hungary).
Results and Discussion
To miniaturize our 96-well plate enzyme activity assay into one suitable for HTS (i.e., 384-well plate), we have taken a number of considerations into account. First, our assay needed to be sensitive to inhibitors with a relevant and developmentally tractable mechanism of action. This required characterization of the ABAD enzyme kinetics using the buffering conditions and 384-well microplates that were intended for use in the screen. Substrate concentrations for screening were then selected based on which substrate binding site was deemed most tractable for discovering selective and potent inhibitors. Typically, the substrate would be screened at or close to its Km, as this provides a balanced chance of finding competitive, noncompetitive, or uncompetitive inhibitors, and with regard to ABAD, acetoacetyl-CoA was considered the best substrate to target because NADH is a ubiquitous cofactor for numerous proteins. As such, a concentration of NADH in excess of its experimentally determined Km was deemed the best approach to desensitize the assay to NADH-competitive molecules. In addition to the concentration of substrates, the concentration of enzyme is also vital in a screening assay. It must be high enough so that the enzyme is stable in solution over the course of the assay and can produce enough substrate turnover to reliably monitor reaction progress. However, it should not be too high that the reaction runs too quickly, thus allowing effective monitoring of the linear steady state of the reaction. A low protein concentration should also avoid additional issues such as excessive protein requirement for large-scale screening purposes or encountering limitations in the determination of IC50 for high-affinity inhibitors too early in a development program. 11 Finally, the screening assay needed to provide a robust reliable signal that allowed a significant compound effect to be identified from noneffect. This was determined by the Z′ value, a screening statistic that takes into consideration the signal window and the standard deviation with an ideal value of between 0.5 and 1 for a robust assay. 12
It was hypothesized that a larger signal-to-background ratio would be seen if the assay could be adapted to be measured as a fluorometric assay. In addition, moving to a measurement at longer wavelengths would help reduce the potential for compound interference of the assay signal. Several methods were explored to use a fluorescence-based screening method, including direct measurement of NADH fluorescence; however, this resulted in very poor Z′ values and signal. An alternative approach was to try all three commercially available Amplite fluorimetric kits (AAT Bioquest, Sunnyvale, CA, USA), but these resulted in signal saturation at all concentrations of NADH/NAD+ tested (despite kit guidelines) or proved to be cumbersome for HTS purposes with many addition steps while still resulting in poor Z′ values. As our absorbance assay produced very high Z′ values indicating the assay was very robust, it was decided to reject this hypothesis and accept the lower signal-to-background ratio and continue with an absorbance HTS assay.
Enzyme Kinetics
To determine the kinetics for acetoacetyl-CoA and NADH and to investigate the reaction rate dependence of ABAD concentration, a matrix titration of acetoacetyl-CoA versus ABAD and NADH versus ABAD was conducted using our previously determined buffering conditions. 10 Fixed concentrations of either NADH (700 µM) or acetoacetyl-CoA (200 µM) were used, while the second substrate was titrated respectively. Doubling dilutions of substrate were then coupled with doubling dilutions of ABAD, starting with a maximum concentration of 40 nM. Activity time courses and initial velocities were obtained, and after optimization, it was decided to use a lower concentration of NADH (100 µM), which is still in excess of Km, and a higher starting concentration of acetoacetyl-CoA (800 µM) to obtain a full response. Figure 1A,B demonstrates the final kinetic data, where the Km for acetoacetyl-CoA was 117 ± 28 µM and a Km of 32.96 ± 4.47 µM for NADH was achieved.
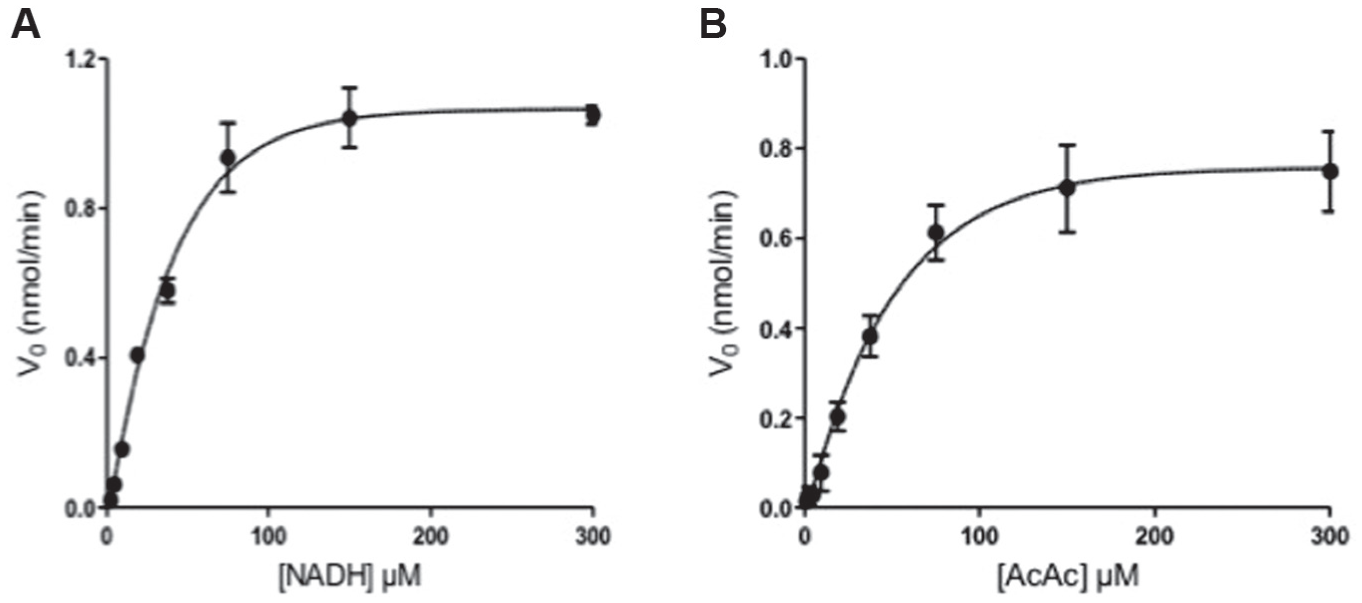
Initial velocity curves for amyloid-binding alcohol dehydrogenase (ABAD) (2.5 nM) under increasing concentrations of nicotinamide adenine dinucleotide (NADH) (
Previous findings 10 suggested that NADH is required in excess of its Km to minimize the sensitivity of the assay to NADH-competitive inhibitors. However, a concentration of NADH that was too high resulted in a very high level of NADH background signal, and this decreased the signal change relative to background that was observed by the activity of ABAD. The concentration of ABAD was also assessed; an optimal concentration produced a suitable change in absorbance while still remaining in the initial velocity phase for an appropriate amount of time. This resulted in an increased signal to background and improved Z′. Four concentrations of ABAD were investigated (0.625, 1.25, 2.5, and 5 nM), where 0.625 nM and 1.25 nM ABAD produced very little signal window, and the reaction at 5 nM was extremely fast. A total of 2.5 nM ABAD produced a functional signal while it remained in the initial velocity phase for approximately 30 to 45 min. The NADH concentration had little effect on this experiment, especially at the higher concentrations, indicating that the reaction was more dependent on acetoacetyl-CoA. It was determined that 62.5 µM and 125 µM NADH produced consistent results; therefore, the excess concentration of NADH used in the final assay was 100 µM.
DMSO Tolerance
As most screening compounds are solubilized in DMSO, the tolerance of the enzyme assay to this solvent was assessed. Industry standard assays require a tolerance of at least 0.5% DMSO. 13 Using the established kinetic conditions, DMSO tolerance was evaluated up to 20% of DMSO. Our ABAD activity assay was found to be tolerant up to approximately 2.5% DMSO, although less than 1% DMSO is more favorable ( Fig. 2A ).
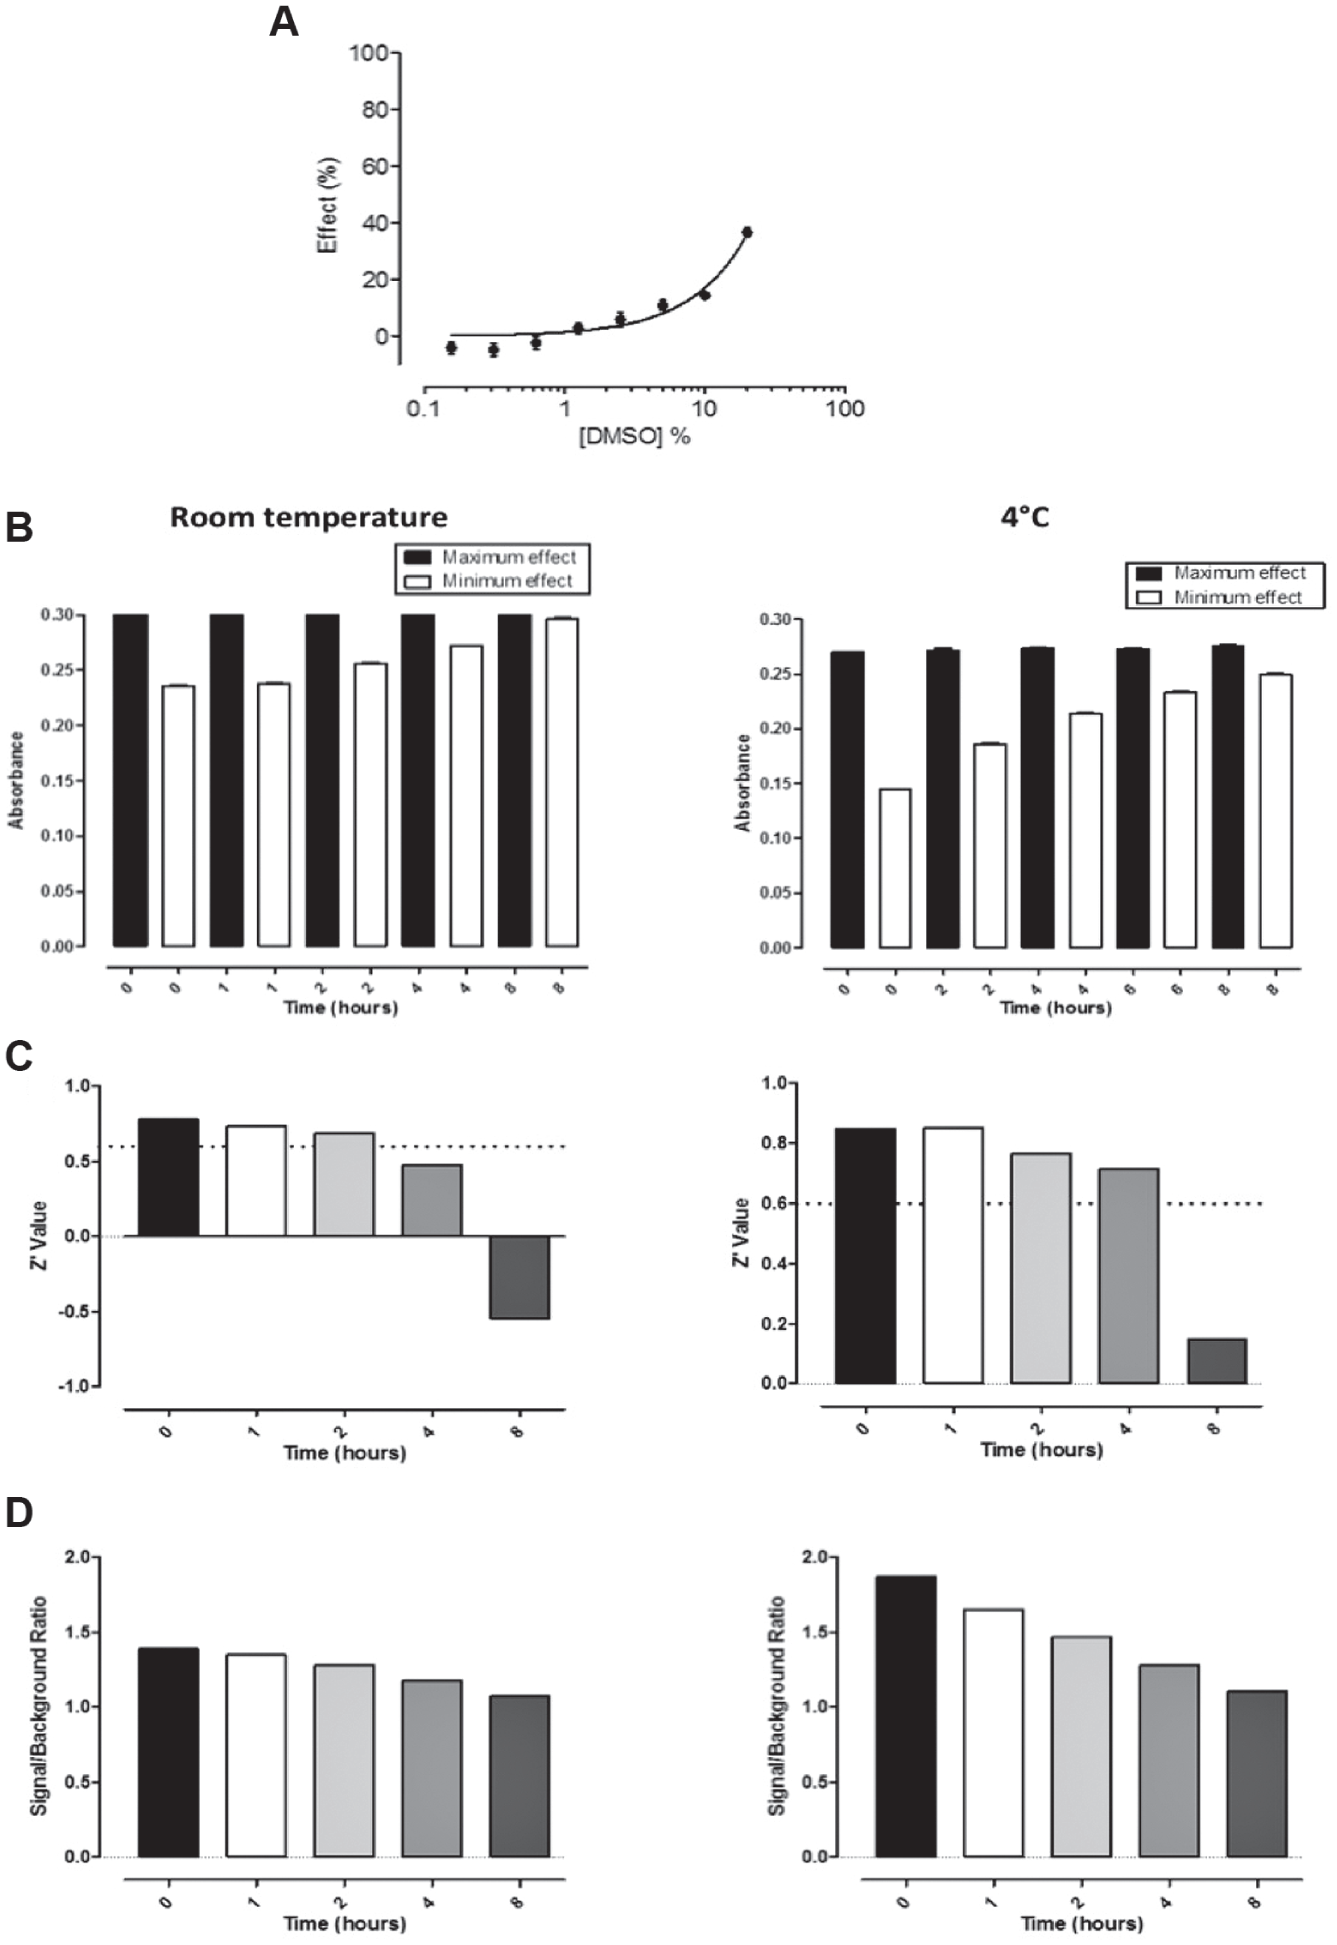
DMSO tolerance and reagent stability testing. (
Reagent Stability
For logistical HTS purposes, it is important to understand for how long and under what conditions the various assay reagents are stable. First, enzyme and substrate solutions were prepared in assay buffer and maintained at room temperature. Reactions were then started at 0-, 1-, 2-, 4-, and 8-h intervals after preparation, with absorbance values ( Fig. 2B ) used to compare Z′ values and signal-to-background values for each time point ( Fig. 2C,D ). In addition to this, the effect of freeze/thawing ABAD was also assessed. These experiments confirmed that while the reagents used for this assay are stable for a prolonged length of time when stored appropriately, when prepared and kept at room temperature, they are stable for up to 2 h and that ABAD is not stable when freeze/thawed. Furthermore, the addition of BSA appeared to stabilize the enzyme and produced Z′ values of 0.7 to 0.75, and the reaction still appeared in the initial velocity phase during the 45-min incubation period, so it was decided to also include 0.01% BSA in the assay buffer.
Collectively, these assay variations allowed an optimized 384-well plate scale (~20 µL) assay to be established, with more than suitable Z′ values. The key criteria are shown in Table 1 .
Assay Development Summary Table.
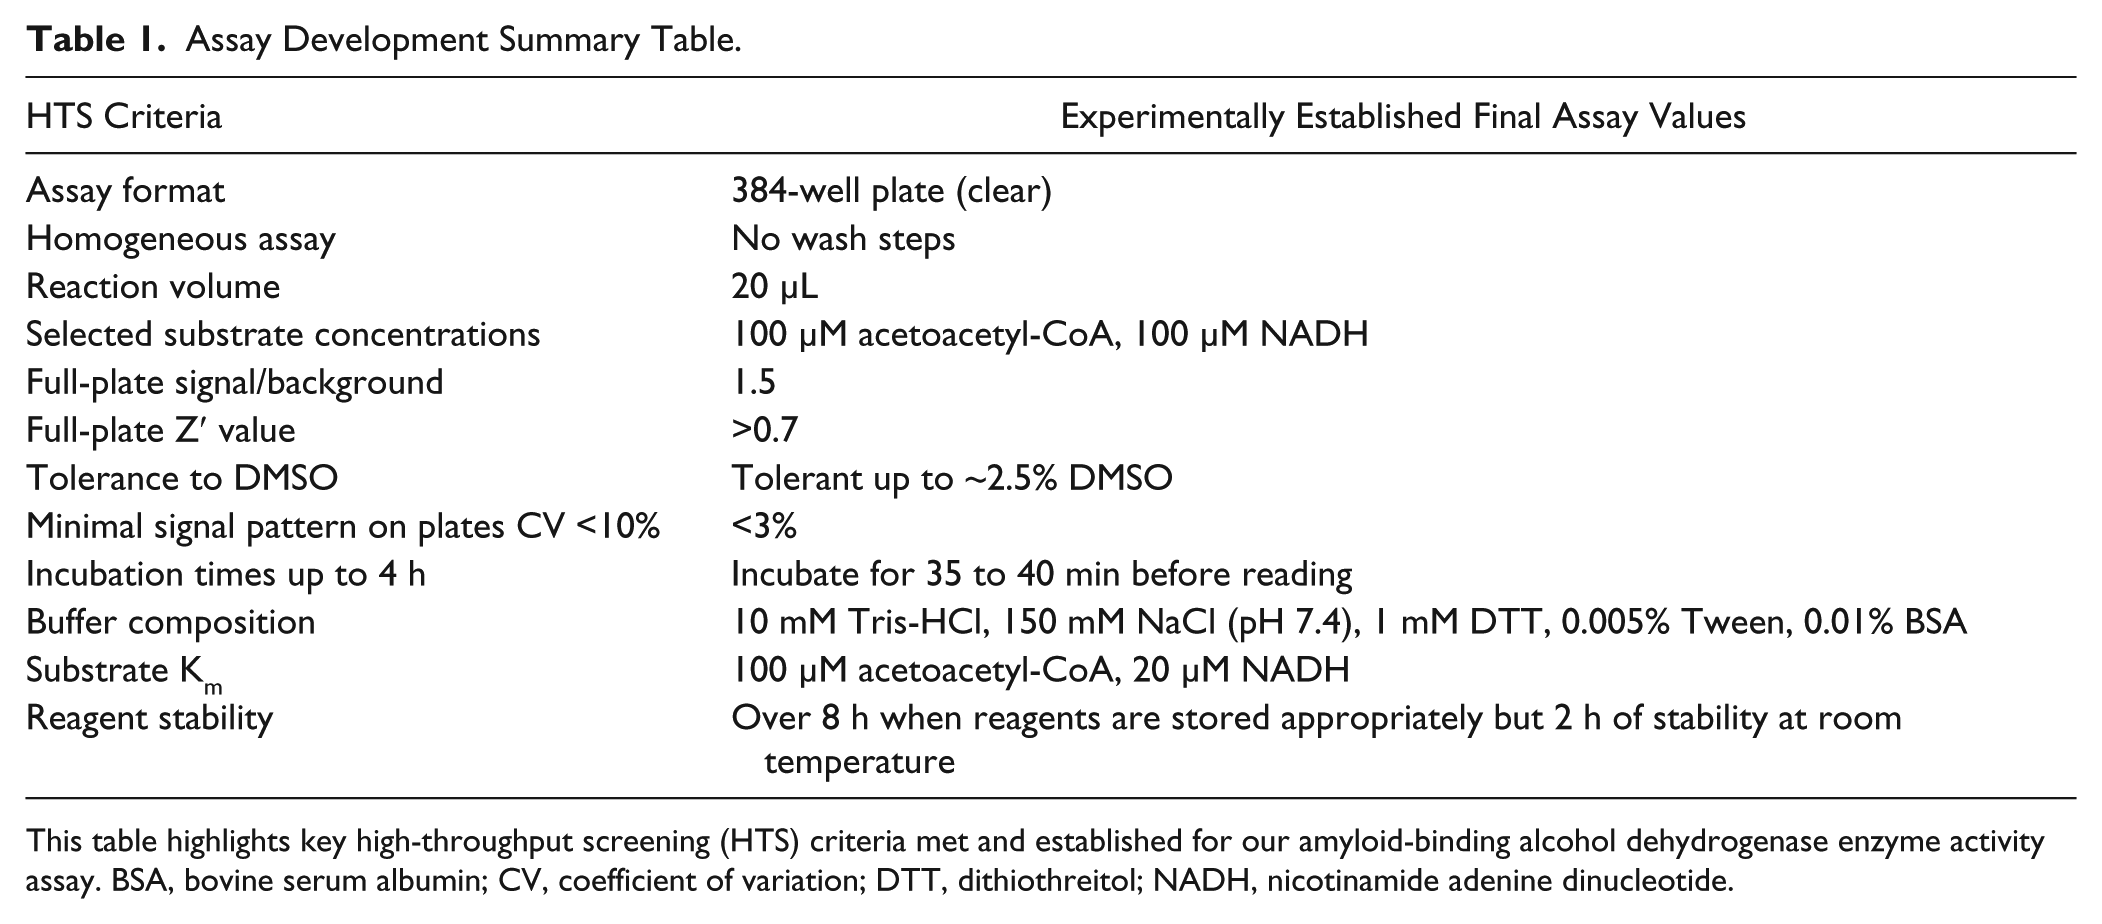
This table highlights key high-throughput screening (HTS) criteria met and established for our amyloid-binding alcohol dehydrogenase enzyme activity assay. BSA, bovine serum albumin; CV, coefficient of variation; DTT, dithiothreitol; NADH, nicotinamide adenine dinucleotide.
Robustness Set Testing
To evaluate what type of undesirable screening compounds our assay was susceptible to pick up as false positives, 118 small molecules with known HTS liabilities14,15 were screened at two concentrations (10 and 1 µM). There was a percentage hit rate of 27% of compounds at 10 µM and 9% of compounds at 1 µM; the full breakdown of the classification of compounds can be found in Table 2 .
Robustness Screening Set.
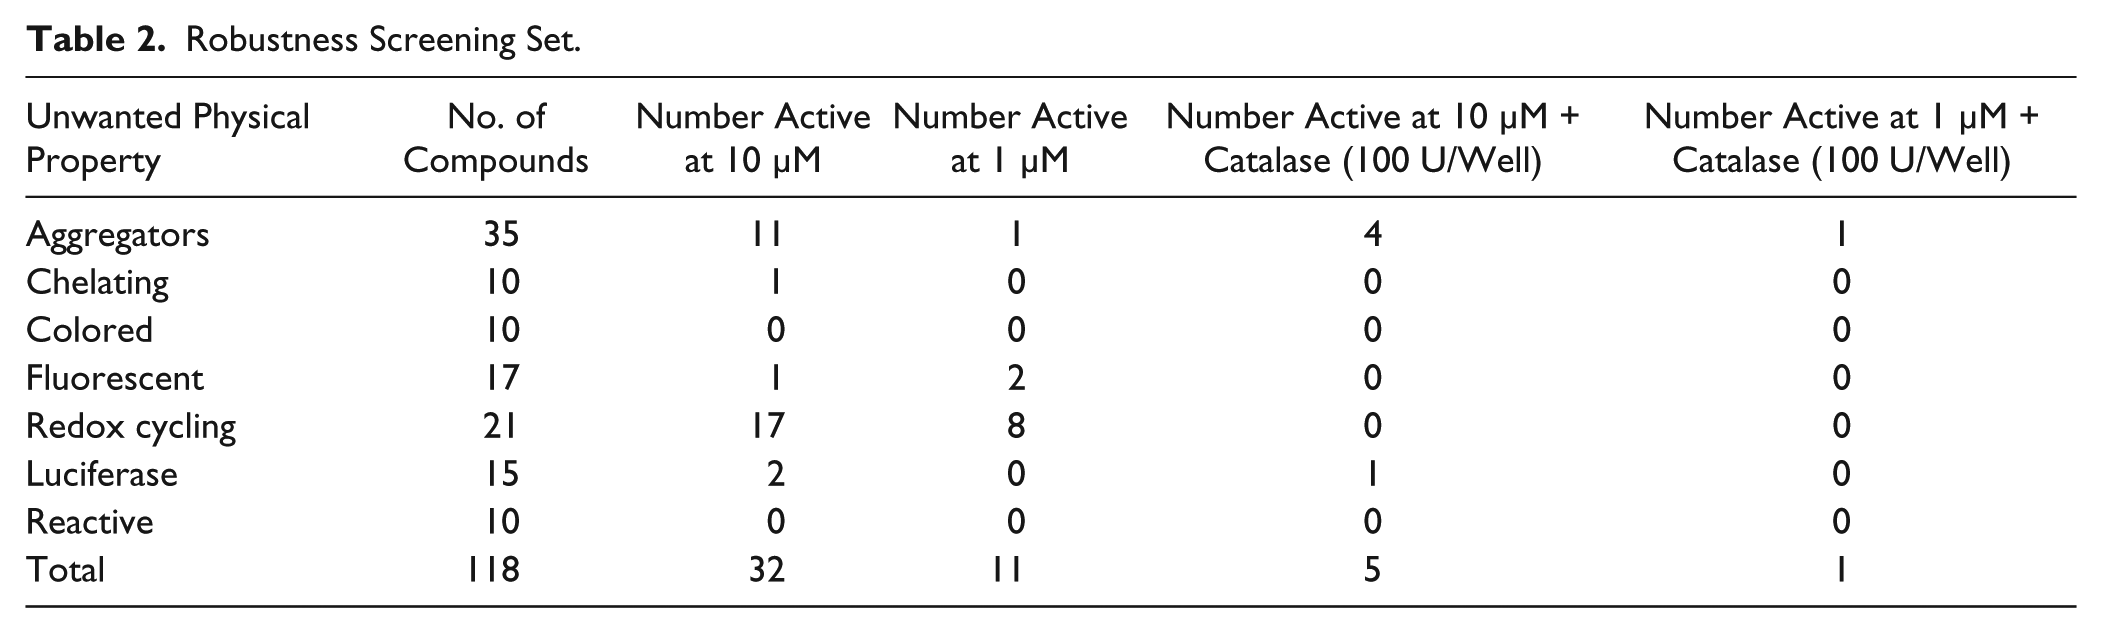
A very high percentage (81% at 10 µM and 38% at 1 µM) of the redox cycling compounds (RCCs) appeared to inhibit the effect of ABAD. The buffer for this assay contains the reducing agent DTT. RCCs generate H2O2 in the presence of strong reducing agents, and H2O2 can indirectly inhibit the catalytic activity of proteins. 16 This is often a major source of false positives when performing an HTS. Identifying that a target is sensitive to inhibition by RCCs during assay development allows steps to be taken to either minimize the sensitivity to RCCs through optimization of the assay buffer or to design a screening triage process that identifies and eliminates RCCs. 17 Unfortunately, despite alternative agents being available, it was not possible to remove or replace DTT from the assay buffer as this reagent was found to be essential for protein stability; however, addition of catalase, which degrades H2O2, abolished RCC-mediated inhibition of ABAD ( Table 2 ). The addition of catalase to the assay buffer did negatively affect the signal-to-background (S/B) and Z′ scores, so its inclusion was not considered ideal for primary screening, but it was used in lower throughput follow-up assays with a higher replication level to identify and eliminate RCCs.
Primary Validation Screen
To further assess the performance of the ABAD assay, a small HTS of 1564 known bioactive compounds from the NIH Clinical Collections (NCC) and SelleckChem, Food and Drug Administration (FDA)–approved drug libraries, combined with 5195 diverse compounds from the BioAscent Compound Cloud (http://www.bioascent.com/compoundcloud/), were screened, producing 262 and 508 potential hits, respectively, where hit compounds were classed as those producing a >20% effect on ABAD inhibition. The screen proved very robust, with Z′ values between 0.75 and 0.77, and percent coefficient of variation (CV) across the plates varying between 0.4% and 2.6%. S/B varied between 1.40 and 1.49. These 770 potential hit compounds were then screened kinetically against ABAD to identify compounds that genuinely inhibit product formation rather than simply absorb light at 340 nM and are therefore false positives when screened in the end-point assay. De-selection of these hits using the catalase assay to remove any redox cycling compounds left nine confirmed hits from the BioAscent collection and eight hits from the NCC/SelleckChem libraries ( Table 3 ), with final hit rates of 0.17% and 0.5%, respectively. Best hit compound pIC50 curves for ABAD ± catalase can be found in the supplementary information ( Suppl. Fig. S1 and Suppl. Table S1 ). A future step will be to obtain freshly prepared samples of these hit compounds and test them in orthogonal ABAD assays to validate target engagement.
Physiochemical Properties of 16 Best Hit Compounds.
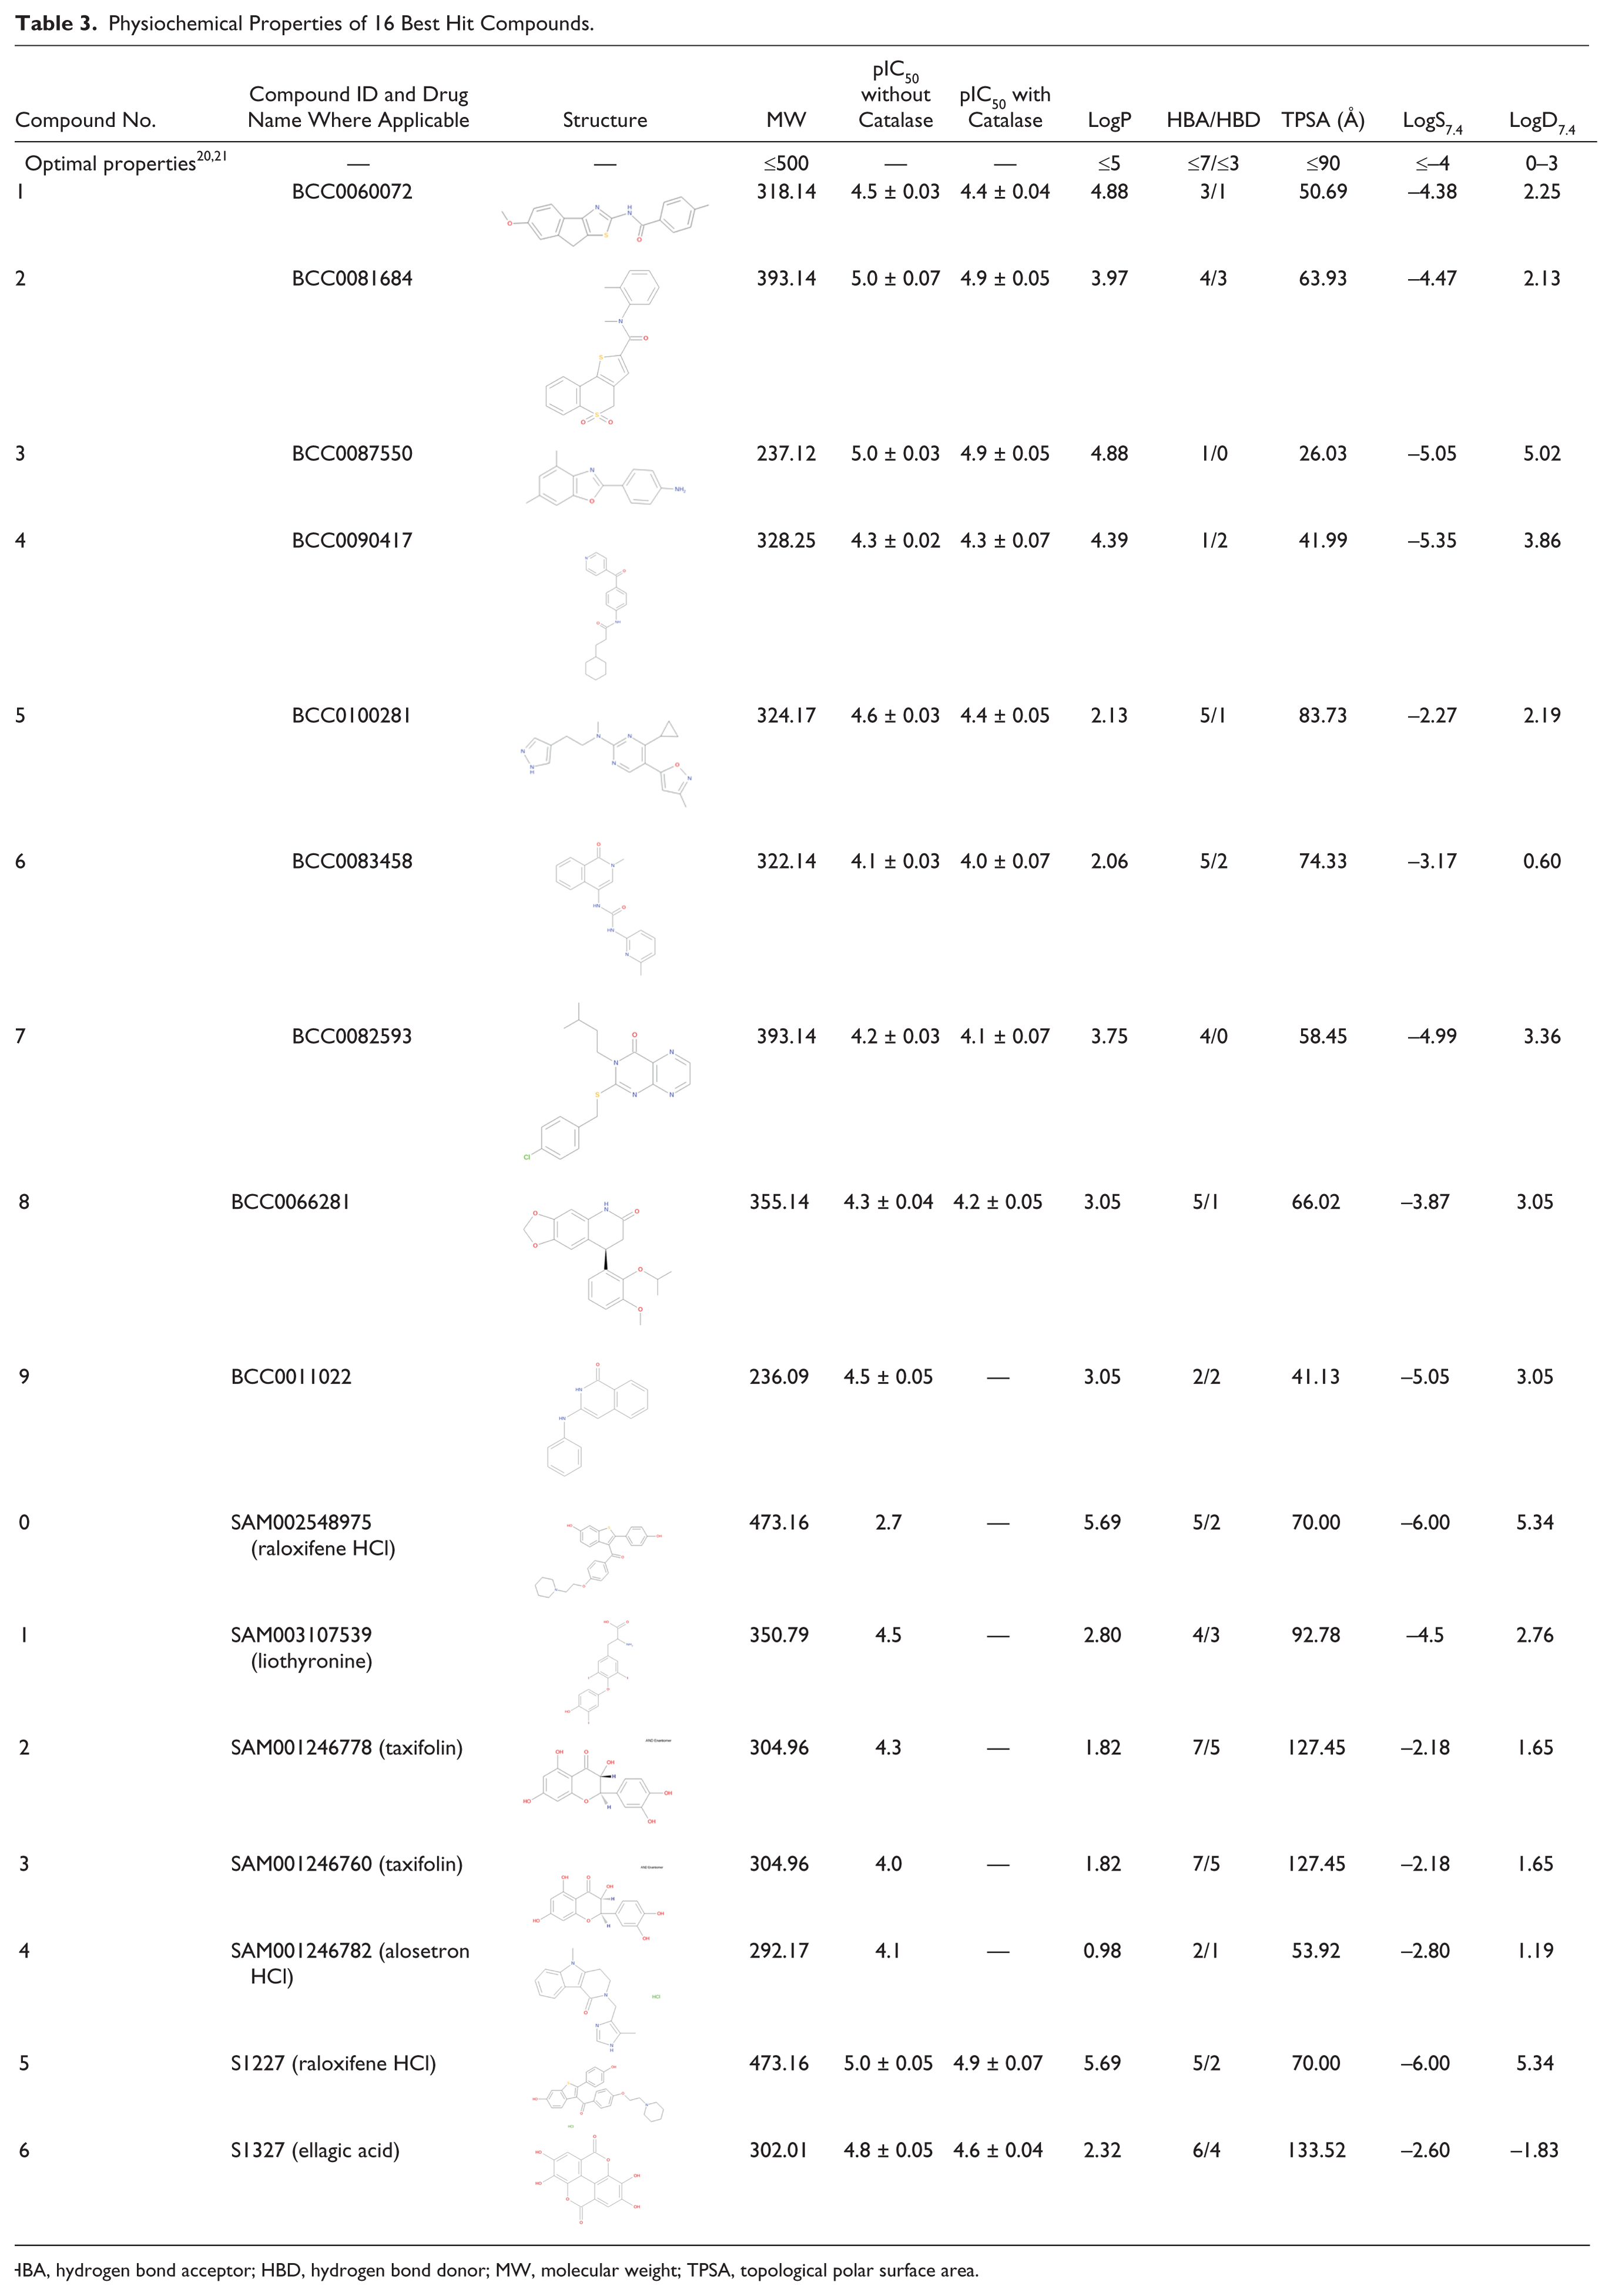
HBA, hydrogen bond acceptor; HBD, hydrogen bond donor; MW, molecular weight; TPSA, topological polar surface area.
A key aspect of any potential ABAD inhibitor is that to be of therapeutic value in AD, they should be CNS penetrant. As the NCC and SelleckChem libraries are composed of a focused set of FDA-approved drugs and National Institutes of Health (NIH) clinical candidates, these properties have already been published. 18 Physiochemical properties were calculated for the BioAscent compounds using ChemAxon software, where calculator plugins were used for structure property prediction and calculations 19 to give a direct comparison to those published for the NCC/SelleckChem hits ( Table 3 ). Notably, all of these hit compounds appear to be in good agreement with the optimal values for CNS bioavailability,20,21 with the predicted aqueous solubility values also being satisfactory for many of the compounds. The optimal values for CNS penetrance were taken as molecular weight ≤500, logP ≤5, hydrogen bond acceptor (HBA) ≤7, hydrogen bond donor (HBD) ≤3, topological polar surface area (TPSA) ≤90 Å, logS7.4 ≤–4, and logD7.4 = 0–3.20,21
The BioAscent compounds were selected principally on the basis of diversity, and so structure-activity relationships (SARs) are limited in the resulting data. However, future work may include purchasing structurally similar scaffolds from their larger 100,000 library, and once the hit compounds have been further validated, these could be acquired to develop SARs further.
The NCC/SelleckChem hits revealed several interesting molecules that have already been used and characterized as drugs for CNS diseases. For example, liothyronine (a synthetic form of the thyroid hormone) has previously been used to treat hyperthyroidism and myxoedema, as well as in an augmentation strategy in treating major depressive disorder in combination with antidepressants. 22 However, there are links to thyroid replacement therapy and the advancement of AD symptoms; therefore, this drug may not be the most promising starting point for a potential therapeutic for AD. 23
Another former FDA-approved drug identified in our screen was alosetron HCl (Lotronex). This compound blocks serotonin by targeting the 5-HT3 receptor. This drug was shown to be effective in treating irritable bowel syndrome but was officially withdrawn from the market in 2000 due to adverse side effects before being reintroduced in 2002 for patients who did not respond to conventional treatments.2424 Compounds that act against serotonin have already been implicated as a potential therapeutic strategy for AD due to the role of serotonin receptors in cognition and memory, 25 and an increase in serotonin signaling was associated with less Aβ accumulation in cognitively normal individuals. 26 With 5-HT3 antagonists capable of freely passing the blood-brain barrier and already implicated in other neurological conditions (schizophrenia and anxiety), 24 analogues based on this structure may prove to be more promising as a therapeutic agent against ABAD.
Ellagic acid, a natural phenol antioxidant, and taxifolin or silymarin, a member of the flavonoid family, are two of the more commercially available hits from this screen. Using transmission electron microscopy and thioflavin T, a β-sheet dye that fluoresces in the presence of Aβ aggregates, taxifolin has been shown to inhibit Aβ aggregation, although the mechanism of action is still to be determined. 27
Although not the most promising compound within the 16 hit compounds, raloxifene HCl appeared as a hit in both the NCC and SelleckChem libraries, but it was also the least active. Raloxifene has been licensed since 1997 (Evista) and used to treat osteoporosis in postmenopausal women. 28 Raloxifene has already participated in a small clinical trial for AD, where it was shown that a large dose of the drug resulted in the reduced risk of cognitive impairment in postmenopausal women. 29 It is already known that the inhibition of ABAD restores the amyloid-β–mediated deregulation of estradiol, 9 and with raloxifene classed as a selective estrogen receptor modulator, this compound proves to be very interesting, and its analogues require further investigation as possible therapeutics against ABAD.
Overall, we have optimized and evaluated our ABAD enzyme activity assay into a robust 384-well plate HTS and used it to identify several novel molecules that modulate ABAD activity and have physicochemical properties suggesting CNS penetration. These could be developed further into lead-like candidates against ABAD, a therapeutic target in AD. We have also identified several FDA-approved drugs that with further investigation may be classed as repurposed drugs if they prove to have a role in AD prevention/therapy.
Footnotes
Supplementary material is available online with this article.
Declaration of Conflicting Interests
The authors declared no potential conflicts of interest with respect to the research, authorship, and/or publication of this article.
Funding
The authors disclosed receipt of the following financial support for the research, authorship, and/or publication of this article: This research was funded by the Scottish Universities Life Science Alliance (SULSA) assay development fund. This research was also kindly supported by The Rosetrees Trust and The Alzheimer’s Society, specifically The Barcopel Foundation, and partly funded by the MSD Scottish Life Sciences fund. As part of an ongoing contribution to Scottish life sciences, MSD Limited, a global health care leader, has given substantial monetary funding to the Scottish Funding Council for distribution via SULSA to develop and deliver a high-quality drug discovery research and training program. All aspects of the program have been geared toward attaining the highest value in terms of scientific discovery, training, and impact. The opinions expressed in this research are those of the authors and do not necessarily represent those of MSD Limited or its Affiliates.
References
Supplementary Material
Please find the following supplemental material available below.
For Open Access articles published under a Creative Commons License, all supplemental material carries the same license as the article it is associated with.
For non-Open Access articles published, all supplemental material carries a non-exclusive license, and permission requests for re-use of supplemental material or any part of supplemental material shall be sent directly to the copyright owner as specified in the copyright notice associated with the article.