
Abstract
Lysine demethylase 1 (LSD1) and Jumonji C domain–containing oxygenase D2C (JMJD2C) participate in regulating the methylation status of histone H3 lysine residues. In some contexts, LSD1 and JMJD2C activity causes enhanced cellular proliferation, which may lead to tumorigenesis. The authors explored the utility of time-resolved fluorescence resonance energy transfer (TR-FRET) immunoassays, which employed peptides consisting of the first 21 amino acids of histone H3 in which lysine 4 (H3K4) or lysine 9 (H3K9) was methylated (me) to quantify LSD1 and JMJD2C activity. The LSD1 assay monitored demethylation of the H3K4me1 peptide using an antibody that recognizes H3K4me1 but not the unmethylated peptide product. The JMJD2C assay measured demethylation of H3K9me3 with an antibody that selectively recognizes H3K9me2. The optimized conditions resulted in robust assays (Z′ > 0.7) that required only 3 to 6 nM of enzyme in a reaction volume of 6 to 10 µL. These assays were used to compare the activity of different LSD1 constructs and to determine the apparent Km of each JMJD2C substrate. Finally, both assays were used in a high-throughput setting for identifying demethylase inhibitors. Compounds discovered by these TR-FRET methods may lead to powerful tools for ascertaining the roles of demethylases in a cellular context and ultimately for potential cancer treatments.
Introduction
Histones are subject to a broad spectrum of posttranslational modifications, including, but not limited to, methylation, phosphorylation, and acetylation. These modifications regulate differential gene expression by altering the accessibility of regulatory DNA sequence and by influencing the recruitment of factors responsible for gene activation or suppression. Aberrant histone H3 lysine (H3K) methylation is associated with a number of human diseases, including cancer.1,2 The methylation status of H3K4 and H3K9 appears to affect proto-oncogene and tumor suppressor gene expression. 3 These changes are thought to cause tumorigenesis by promoting excessive cellular proliferation. 4 Lysine methylation is reversible, which raises the prospect that inhibition of the specific enzymes that control these epigenetic modifications may have antitumor effects. Moreover, an increasing number of reports have associated the discovery of mutant and dysregulated expression of lysine demethylase proteins with cancer and have proposed an involvement of these enzymes in the development of cancer stem cells.3,4
Two distinct classes of histone lysine demethylases are defined based on their mechanism of catalysis. Flavin-dependent mono-amine oxidases can remove mono-methyl (me1) and di-methyl (me2) groups from H3K4. Lysine-specific demethylase 1 (LSD1) is a member of this group and was the first histone demethylase discovered. 5 LSD1 is found in a variety of transcription factor complexes. In complexes with RE1-silencing transcription factor corepressor (CoREST), LSD1 participates in regulatory silencing of neuronal specific genes. LSD1 has also been found to associate with the androgen receptor (AR) and stimulate androgen-dependent transcription. 6 Interestingly, LSD1 appears to demethylate H3K9 when bound with the AR. LSD1 contains three major structural motifs: Swi3p, Rsc8p, and Moira (SWIRM); amine oxidase-like (AOL); and Tower domains. 7 The SWIRM domain appears to be important for protein stability, but its function in LSD1 has not been established yet. The AOL domain contains important flavin adenine dinucleotide (FAD) binding, substrate binding, and monamine oxidase sites. The Tower domain is necessary for binding to CoREST but protrudes from the catalytic site and makes no obvious interactions with the rest of the protein to suggest an essential role for activity. LSD1 has been implicated to have a role in cancer settings. For example, high levels of LSD1 expression have been found in prostate cancer and correlate with tumor relapse during therapy.6,8 In colon carcinoma, inhibition of LSD1 by polyamine analogues was found to cause reexpression of aberrantly silenced genes important in the development of colon cancer, including members of the secreted frizzle-related proteins (SFRPs) and the GATA family of transcription factors. 9
The other class of histone demethylases is the Jumonji C domain–containing (JMJD) Fe2+ and 2-oxoglutarate (2-OG)–dependent oxygenases. Members of this class constitute the largest family of histone lysine demethylases. The human JMJD2 subfamily consists of six members (JMJD2A–F) and target methylated H3K9 and H3K36. 10 The JMJD2 enzymes exhibit substrate specificity based not only on the position of the lysine, H3K9 or H3K36, but also on the number of methyl groups on the lysine. For example, JMJD2D appears to be selective for H3K9me3 and H3K9me2, but JMJD2A and JMJD2C have been shown to demethylate H3K9me3 and H3K36me3. 11 The JMJD2 proteins contain several important structural domains. In addition to the catalytic JmjC domain, all contain a small JmjN domain, which is a small protein module found in the Jumonji family of transcription factors and may be important for protein stability. 12 JMJD2A–C also contain two plant homeodomain-type zinc fingers and two Tudor domains, which may participate in substrate recognition and binding to methylated histone tails.13,14 Several members of this JMJD2 subfamily are considered putative oncogenes due to the observation that they are upregulated in different cancer settings and can be genetically amplified. 3 For example, JMJD2C, located on chromosome 9p23-24, is amplified in a subset of esophageal and breast cancer patient samples.15–17 In human-derived cell lines, this amplification is associated with decreased H3K9me3 and increased cellular proliferation.15,18
Despite these discoveries, the biological impact of histone demethylases in normal cellular function and in the pathogenesis of human disease is not well understood. This is partly because these enzymes have been discovered only recently but also because of a general lack of specific tools to enable characterization of the role and function of these enzymes in a cellular setting. Small-molecule inhibitors of histone demethylases, in addition to having therapeutic potential, would serve as valuable tools for exploring and validating the role of these enzymes. The discovery of such compounds should be facilitated and hastened by high-throughput screening (HTS). Assays performed in an HTS setting need to be sensitive, robust, cost-effective, and scalable. Assays that fulfill these criteria have so far been limited for this class of enzymes.19,20 To address this, we sought to develop and evaluate new methods that could enable an HTS campaign to identify inhibitors of LSD1 and JMJD2C, which represent examples from each class of H3K demethylases.
The LSD1 reaction yields demethylated H3K4 and produces flavin adenine dinucleotide hydroquinone (FADH2), hydrogen peroxide (H2O2), and formaldehyde. The JMJD2C reaction demethylates H3K9me3 and produces H3K9me2, succinate, carbon dioxide, and, similar to LSD1, formaldehyde. 21 Detection of each different reaction product was considered when assessing demethylase activity measurement approaches. The quantitation of reaction by-products is an attractive option as this would enable different substrates, such as histones, nucleosomes, and peptides consisting of different sequences and modifications, to be evaluated using the same detection platform. Several homogeneous, automation-amenable, and commercially available assays have been described for the measurement of demethylase reaction by-products. In the case of LSD1, activity has been measured by detection of H2O2. 22 In addition, formaldehyde can serve as a common analyte for the detection of demethylase activity, and there are literature reports of this being used to study both LSD1 and JMJD2.5,20,23 Recently, an HTS campaign for JMJD2E inhibitors has been described that successfully used formaldehyde detection. 20 However, these by-product assays are not specific for the epigenetic mark of interest and are generally associated with a number of other caveats that make them less attractive for use in an HTS campaign. These assays tend to require large amounts of the target enzyme and use multiple coupled enzyme and incubation steps that require the incorporation of downstream counterscreening assays to triage compounds that are acting on these nontarget enzymes. We therefore focused our assay development efforts on the detection of methylation stoichiometry at specific lysine sites using time-resolved fluorescence resonance energy transfer (TR-FRET) immunoassays, which are a proven HTS-amenable assay format. TR-FRET, which includes both HTRF and LANCE technology, is well documented as a sensitive and reliable method for the HTS of diverse enzyme and receptor targets.24,25 Typical TR-FRET immunoassays involve the homogeneous detection of biotinylated substrate or biotinylated product by the binding of europium (Eu) donor-tagged antibodies. These antibodies bring the donor molecule in close enough proximity so that when it is excited at 337 nm, its subsequent emission (590 nm for the Eu-cryptate, which is used in HTRF, or 620 nm for the Eu-chelate used in LANCE) can be absorbed by an appropriate streptavidin-tagged acceptor molecule (allophycocyanin or ULight), which then emits light at 665 nm. However, the application of this assay design has not been demonstrated previously for the characterization of histone lysine demethylases and their inhibitors. The success of this strategy for assaying histone lysine demethylases depends on the ability of the demethylases to use artificial biotinylated H3-based peptides as substrates and on the availability of Eu-tagged methyl lysine antibodies with appropriate specificity. Here we report the development, optimization, and characterization of these new 384-well HTS-amenable TR-FRET assays for LSD1 and JMJD2C and discuss the benefits and caveats of this approach. Our work should add to the growing list of much desired practical, sensitive, and adaptable methods to facilitate the identification of histone demethylase inhibitors and to aid in broadening our knowledge of histone lysine demethylase biology.
Materials and Methods
Protein purification
For LSD1, recombinant H6-GST-tagged LSD1 (171-852aa), H6-GST-tagged LSD1 (158-852aa), and H6-GST-tagged LSD1 (171-426, 517-852, Tower domain deleted) were independently expressed in Escherichia coli BL21(DE3). Cell pellets were suspended in lysis buffer (1 L/200 g cells; 50 mM HEPES [pH 8.0], 25 mM NaCl, 10 mM 2-mercaptoethanol, 10% [w/v] gly-cerol, 0.5% [v/v] Complete protease inhibitor cocktail [Sigma-Aldrich, St. Louis, MO]) and ruptured using a microfluidizer at 10 000 PSI. Cell debris was removed by centrifugation (50 000 g for 1.5 h) at 4 °C, and the supernatant was incubated overnight at 4 °C with 10 mL of glutathione sepharose resin (GE Healthcare, Pittsburgh, PA). The resin was then batch washed four times with five column volumes of lysis buffer containing 600 mM NaCl and poured into a glass column. The column was washed with 10 column volumes of wash buffer (50 mM HEPES [pH 8.0], 100 mM NaCl, 0.10 mM 2-mercaptoethanol, 10% [w/v] glycerol) followed by 10 column volumes of elution buffer (100 mM HEPES [pH 8.0], 100 mM NaCl, 10 mM 2-mercaptoethanol, 10% [w/v] glycerol, 30 mM reduced glutathione). Fractions were analyzed by sodium dodecyl sulfate polyacrylamide gel electrophoresis (SDS-PAGE), and those containing the protein of interest were pooled. Tobacco etch virus (TEV) protease was added at a 1:10 ratio to the pooled eluant, and digestion was allowed to proceed overnight at 4 °C. The cleavage reaction was concentrated and applied to a Superdex 200 XK 26/60 gel filtration column (GE Healthcare) equilibrated in 25 mM Tris (pH 7.5), 100 mM NaCl, 10 mM 2-mercaptoethanol, and 10% (w/v) glycerol. The untagged LSD1 protein eluted at a retention time indicative of it being monomeric. Fractions containing the monomeric protein of interest were pooled, concentrated to ~2 mg/mL, and stored at −80 °C. For JMJD2C, recombinant GST-tagged JMJD2C (2-372aa) was expressed in Sf9 insect cells. The cell paste was resuspended in lysis buffer (50 mM Tris [pH 8.0], 150 mM NaCl, 1 mM tris(2-carboxyethyl)phosphine [TCEP], supplemented with Complete protease inhibitor mixture without EDTA) and disrupted by a microfluidizer. Cell debris was removed by centrifugation (45 000 g for 1.5 h at 4 °C), and the supernatant was incubated overnight at 4 °C with 10 mL glutathione sepharose resin. The resin was washed with 50 column volumes of lysis buffer before eluting the target protein with lysis buffer containing 10 mM reduced glutathione. The eluted protein solution was then loaded onto a Superdex 200, XK 16 gel filtration column (Amersham Biosciences, Pittsburgh, PA), which was equilibrated in 20 mM Tris (pH 8.0), 150 mM NaCl, and 1 mM TCEP. The final protein purity for LSD1 and JMJD2C was about 95% based on standard SDS-PAGE analysis.
HTRF TR-FRET H3K4me1 detection assay
Forty microliters per well of 1.25× concentrated detection mix (1.25 nM Eu-anti-H3K4me2 [H3K4me2 antibody (Cell Signaling Technology, Danvers, MA)] custom labeled with Eu-cryptate [Cisbio, Bedford, MA], 3.125 nM streptavidin [SA]–allophycocyanin [APC] [Streptavidin-XL665 (Cisbio)], 50 mM Tris [pH 7.5], 100 mM NaCl, 0.05% bovine serum albumin [BSA], 0.1% Tween 20, 5 mM EDTA, and 250 mM potassium fluoride (KF) was added to black polypropylene 384-well assay plates (Costar, Corning, NY) that contained 10 µL per well of LSD1 enzyme reaction or control peptides in LSD1 reaction buffer (50 mM HEPES [pH 8.0], 10 mM NaCl, 5% glycerol, 0.005% Triton X-100, 2 mM dithiothreitol [DTT]). The peptides consisted of the first 21 amino acids of histone H3. The sequences of the peptides were as follows: H3 (ARTKQTAR KSTGGKAPRKQLA-(biotin)-OH), H3K4me1 (ARTK(Me1)QTARKSTGGKAPRKQLA-(biotin)-OH), H3K4me2 (ARTK (Me2) QTARKSTGGKAPRK QLA-(biotin)-OH), or H3K4me3 (ARTK(Me3)QTARKST GG KAPRKQLA-(biotin)-OH) (Ana-Spec, Fremont, CA). For terminating and measuring LSD1-catalyzed demethylation, the detection reactions were supplemented with 1.0 µM of LSD1 ARTMQTARKSTGG KAPRKQLA (H3K4>M) inhibitory peptide (Biopeptide, San Diego, CA). Detection reactions were incubated for 1 h to overnight at room temperature before reading on an EnVision plate reader (PerkinElmer, Waltham, MA) using the LANCE time-resolved fluorescence (TRF) setting adapted for optimal HTRF detection with a 590-nm filter for lanthanide-cryptate emission. The ratio of the emission at 665 nm divided by the emission at 590 nm was used to quantify lysine methylation.
LANCE TR-FRET H3K9me2 detection assay
Six microliters per well of 2× concentrated detection mix (250 pM Eu-anti-H3K9me2, 25 nM SA-APC [PhycoLink SA-APC; Prozyme, San Leandro, CA], 50 mM Tris [pH 7.5], 100 mM NaCl, 0.05% BSA, 0.1% Tween 20, and 3 mM EDTA) was added to white 384-well low-volume assay plates (ProxiPlate; PerkinElmer) that contained 6 µL per well of JMJD2C enzyme reaction or control peptides in JMJD2C reaction buffer (20 mM MOPS [pH 7.0], 100 mM NaCl, 0.005% Triton X-100). The control peptides were as follows: H3 (ARTKQTARKSTG GKAPRKQLA-(biotin)- OH), H3K9me1 (ARTKQTARK(Me1)STGGKAPRKQLA- (biotin)-OH), H3K9me2 (ARTKQTARK (Me2)STGGKAPRKQLA-(biotin)-OH), or H3K9me3 (ARTK QTARK (Me3)STGGKAPRKQLA-(biotin)-OH) (AnaSpec). For terminating and measuring JMJD2C-catalyzed demethylation, the detection reactions were supplemented with 100 µM of deferoxamine mesylate (DFO; USP, Rockville, MD). For detection assay optimization, the signal from varying concentrations of Eu-antibody, TR-FRET acceptor (either SA-APC or ULight as recommended by the manufacturer for use with this antibody [PerkinElmer]), and control product was assessed. Eu-antibody and TR-FRET acceptor were prepared in detection buffer for a twofold serial concentration series that ranged from either 0.03 to 2 nM or 3.25 to 50.0 nM, respectively. Detection reactions were incubated for 1 h to overnight at room temperature before reading on an EnVision plate reader (PerkinElmer) using the LANCE TRF setting. The ratio of the emission at 665 nm divided by the emission at 615 nm was used to quantify lysine methylation.
LSD1 enzyme assay
Reactions were performed in black 384-well assay plates in LSD1 reaction buffer by adding 5 µL of 2× concentrated LSD1 to 5 µL of 2× concentrated peptide substrate. Test compounds were dissolved in 100% DMSO. In each compound assay plate, two columns of wells (16 wells per column) were reserved for assay controls. One column was used for high controls and consisted of enzyme reactions that were exposed to vehicle only (2% DMSO final). The other column was used for low controls and contained vehicle and substrate but no enzyme. Reactions for assessing compound potency against LSD1 (171-852) contained final concentrations of 6.25 nM LSD1 (171-852), 62.5 nM H3K4me1, and 2% DMSO. Reactions for assessing compound potency against LSD1 (158-852) contained final concentrations of 3.0 nM LSD1 (158-852), 25 nM H3K4me1, and 1.0 to 1.5% DMSO. Compound potency determinations were incubated at room temperature (RT) for 100 to 120 min before stopping and measuring the amount of lysine methylation with the HTRF TR-FRET H3K4me1 detection assay. To assess the feasibility of using either H3K4me1 or H3K4me2 as a substrate for the LSD1 enzyme assay, peptides were twofold serially diluted in LSD1 reaction buffer for a final concentration series that ranged from 0.100 to 100 nM and incubated with and without 100 nM LSD1 for 90 min at RT. Of note, addition of FAD was not required in the reactions. FAD was already bound to the purified bacterially expressed LSD1 as determined by mass spectrometry, and further addition of FAD did not increase activity (data not shown).
JMJD2C enzyme assay
Reactions were performed in white 384-well low-volume ProxiPlates in JMJD2C reaction buffer by adding 3 µL of 2× concentrated JMJD2C to 3 µL of 2× concentrated substrate mix (H3K9me3, 2-OG, FeSO4, ascorbate). Test compounds were dissolved in 100% DMSO. In each compound assay plate, two columns of wells (16 wells per column) were reserved for assay controls. One column was used for high controls and consisted of enzyme reactions that were exposed to vehicle only (1% DMSO final). The other column was used for low controls and contained vehicle, substrate, and no enzyme. Reactions for assessing compound potency contained final concentrations of 12.5 nM JMJD2C, 500 nM H3K9me3, 1.3 µM 2-OG, 100 µM FeSO4, 50 µM ascorbate, and 2% DMSO. Compound potency determinations were incubated at RT for 1 h before stopping and measuring the amount of lysine methylation with the LANCE TR-FRET H3K9me2 detection assay. Experiments to assess the effect of Triton X-100 and Tween 20 consisted of 300 nM H3K9me3 incubated with or without 50 nM JMJD2C for 120 min in standard JMJD2C reaction buffer. Experiments to evaluate pH and buffer effects were conducted with 300 nM H3K9me3 incubated with or without 50 nM JMJD2C for 90 min in reaction buffer made with either 20 mM MOPS or 20 mM Tris, at pH 6.5, 7.0, and 7.5. The apparent Km value for each substrate was determined by conducting time courses using 50 nM JMJD2C, different concentration ranges of the substrate of interest, and fixed saturating concentrations of the other substrates (4 µM H3K9me3, 200 µM 2-OG, 100 µM FeSO4) and 50 µM ascorbate. Reactions (20 µL) were performed in standard 384-well polypropylene plates and stopped at the indicated incubation times by adding 60 µL of JMJD2C reaction buffer (20 mM MOPS, 100 mM NaCl, 0.005% Triton X-100) supplemented with 40 µM DFO before transferring 1 µL to a white low-volume 384-well ProxiPlate that contained 11 µL 1× LANCE TR-FRET H3K9me2 detection assay mix. The final dilution of the Km reactions in the detection assay was 48-fold to ensure that the peptide concentrations corresponded to signal that was within the linear limits for detecting product.
Data analysis
The amount of signal generated in the presence of compounds versus that in the presence of DMSO vehicle alone (high control) was calculated using the following formula: % control (POC) = (compound – average low)/(average high – average low)*100. The raw values from the high and low controls were used to calculate plate signal over background (S/B) and Z′. Single-compound concentration POC, linear regression analysis plots, goodness of fit (R2), S/B, and Z′ values were determined with Screener (Genedata AG, Basel, Switzerland) data analysis software. Linear regression analysis plots, goodness of fit (R2), and correlation (Pearson r) of IC50 values were performed with Prism version 5 (GraphPad Software, San Diego, CA). For IC50 determinations, data were fit to a four-parameter equation (y = A + ((B −A)/(1 + ((x/C)^D))), where A is the minimum y (POC) value, B is the maximum y (POC), C is the x (compound concentration) at the point of inflection, and D is the slope factor using Prism. For Km and Kd determinations, the slope (which is equal to the initial velocity [vo]) was calculated from each progress curve, and nonlinear regression analysis using a rectangular hyperbola model was performed on plots of the v0 values versus substrate concentration. Apparent Km and Kd values were interpolated from this curve as the substrate or cofactor concentration that corresponded to half the maximum velocity determined under saturating conditions of all other substrate and cofactor concentrations. All analyses for Km determinations were also performed using Prism.
Results and Discussion
Transcriptional access to the genetic code is primarily regulated by covalent and reversible posttranslational modifications. Among these modifications, methylation of lysine residues on the amino-terminal tail of histone H3 and the enzymes that regulate them have been linked to the development of various human diseases, such as cancer.6,8,15-18 Increasing evidence suggests that modulation of methylation on H3K4 and H3K9 can activate proto-oncogenes or silence tumor suppressor genes. 3 To further our understanding of this emerging biology and to potentially develop novel anticancer therapeutics, we explored the utility of peptide-based TR-FRET HTS-amenable assays for the biochemical study of two histone lysine demethylases, LSD1 and JMJD2C, which regulate the methylation status of these lysine residues ( Fig. 1A , B ).
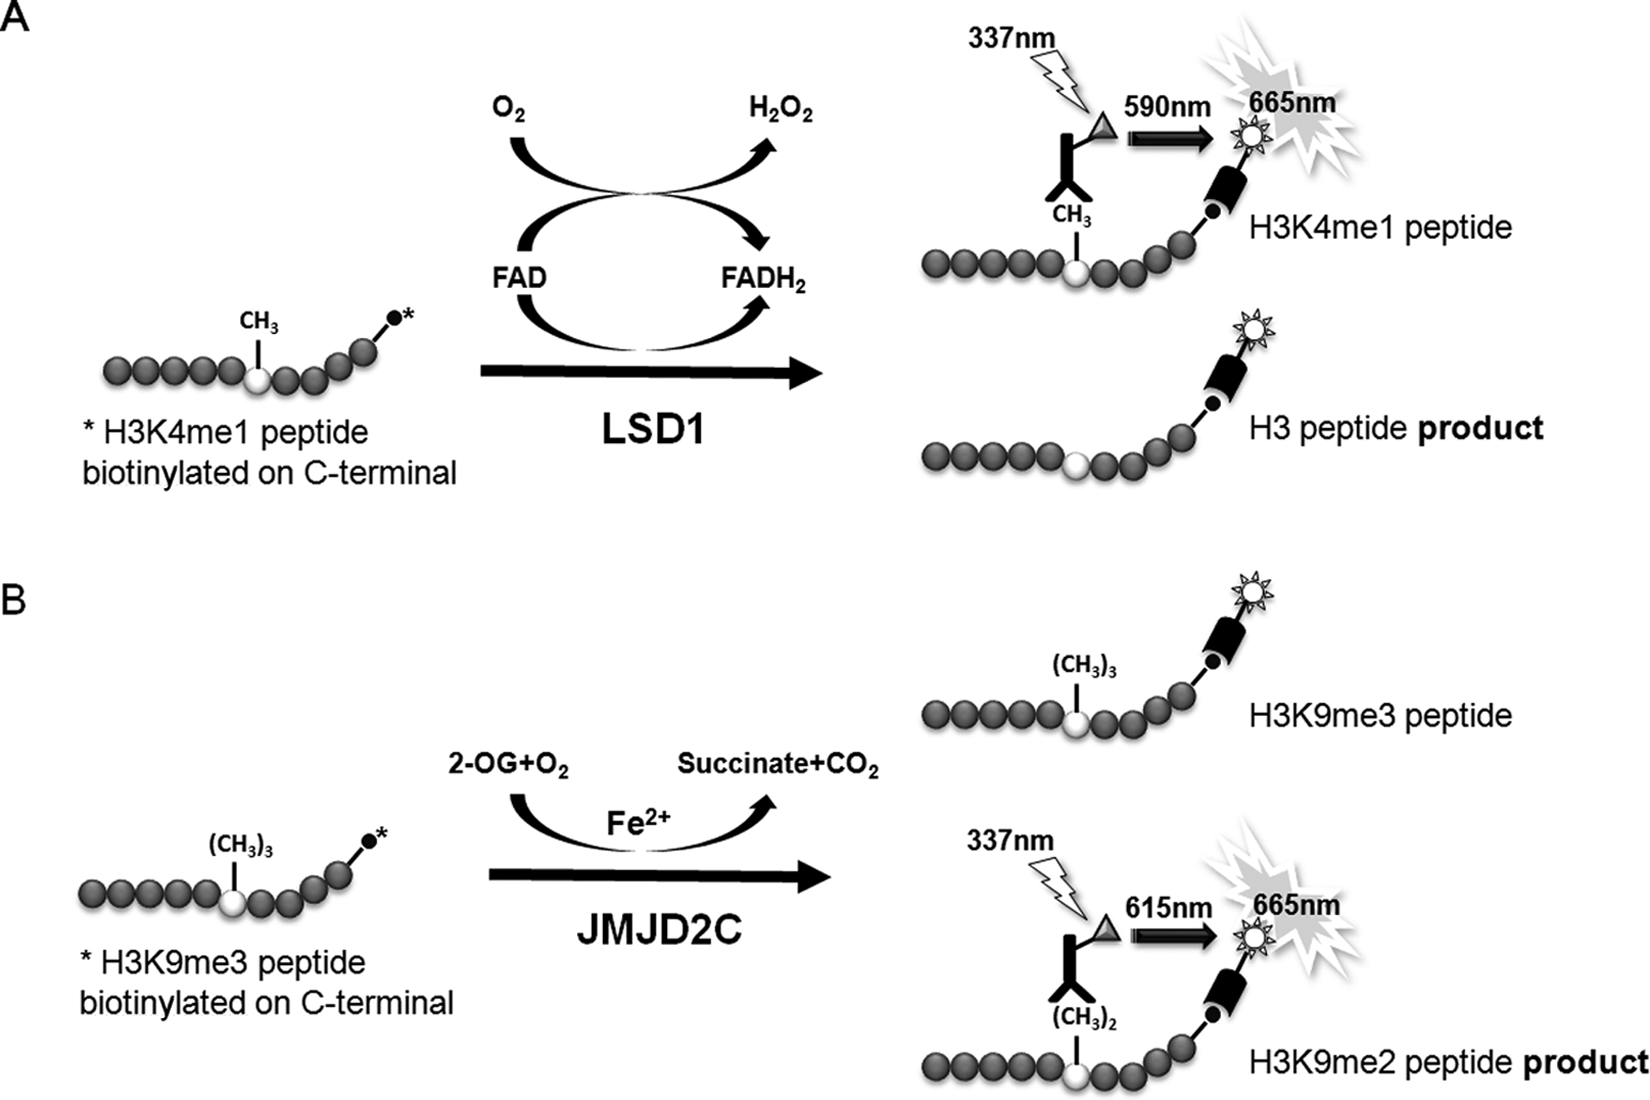
Schematic diagrams of LSD1 and JMJD2C time-resolved fluorescence resonance energy transfer (TR-FRET) assays. Diagrams highlighting the key features of the in vitro demethylase reactions (left) and TR-FRET detection assays (right). (
LSD1 TR-FRET assay development
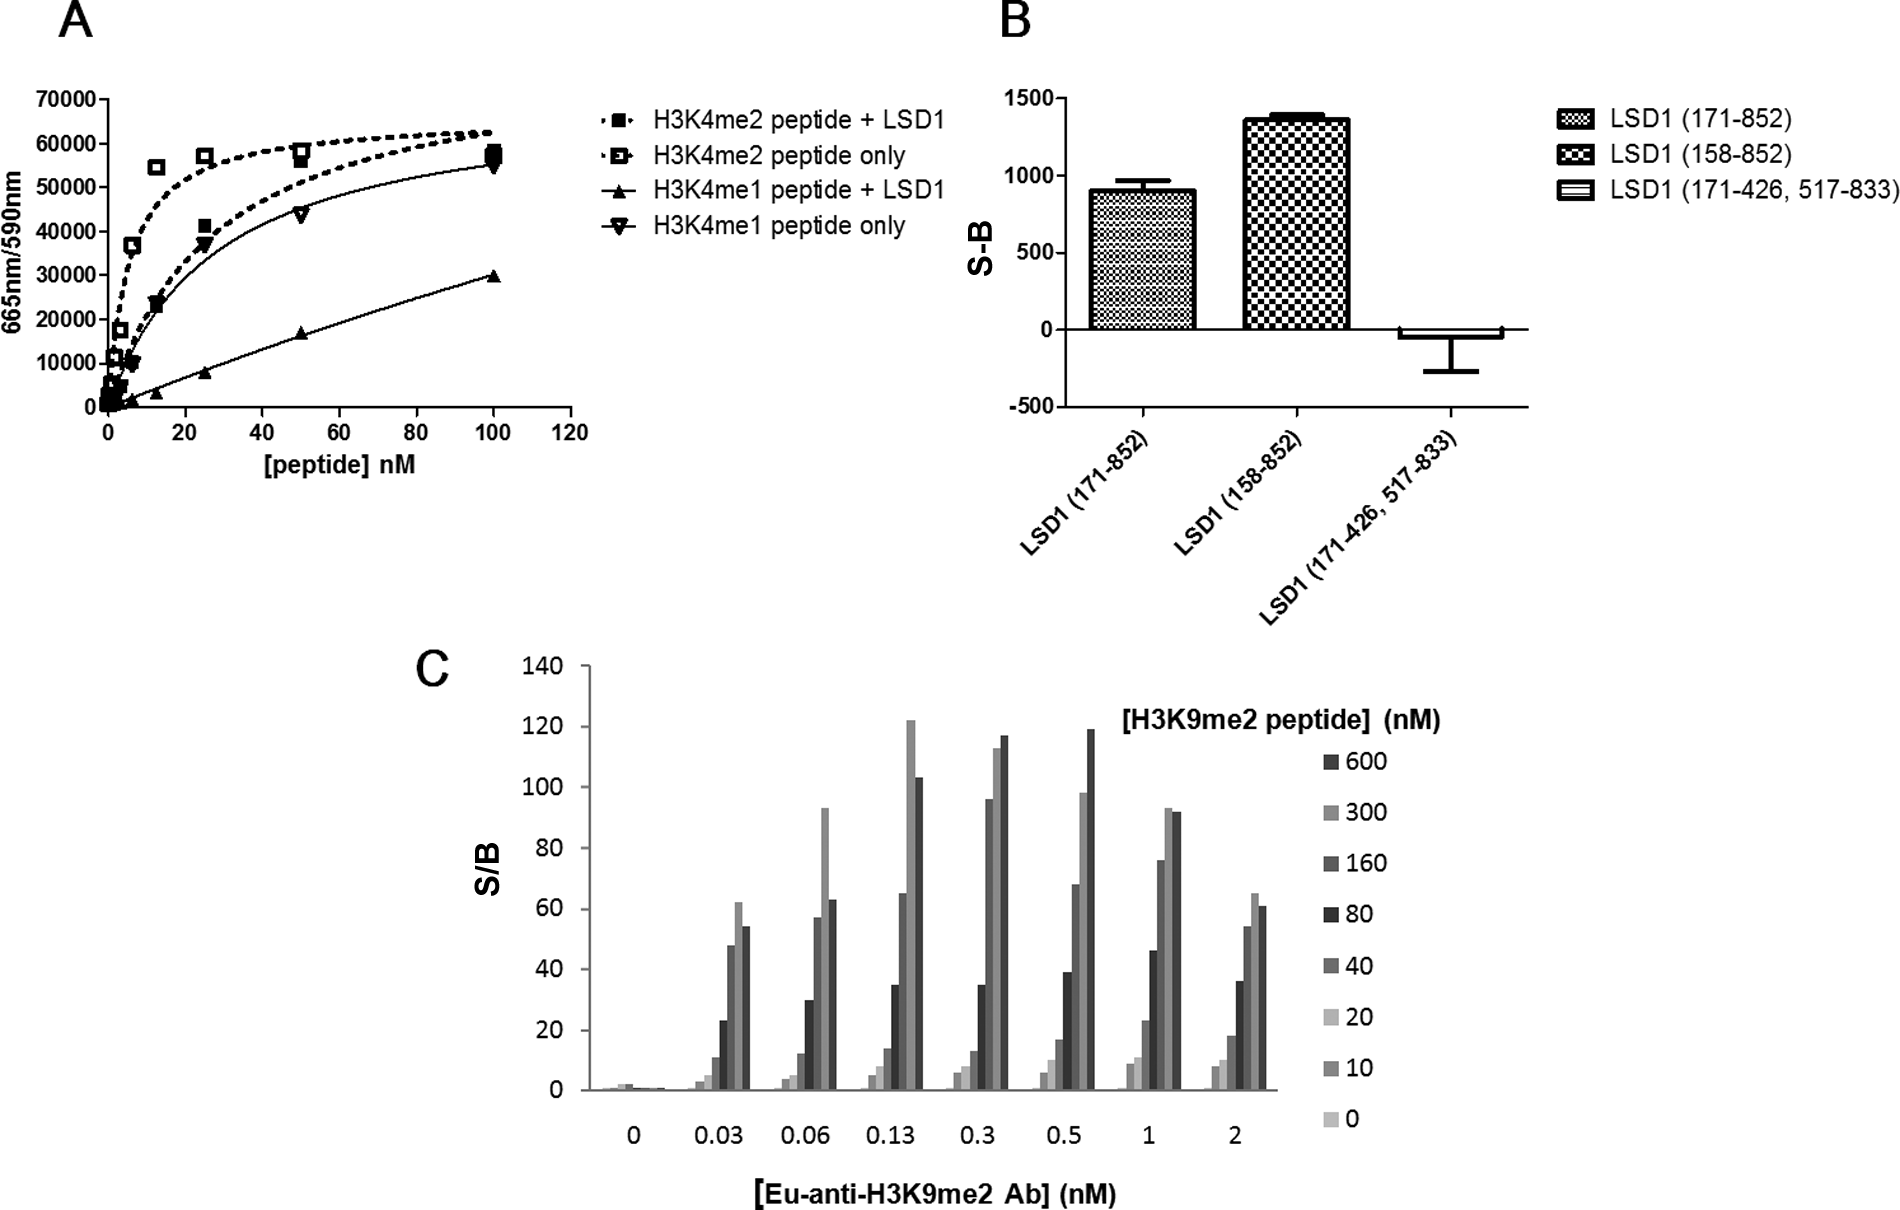
At the time of our assay development efforts, there were no commercial TR-FRET assays available to monitor di- or monomethylation of H3K4, but now several options exist that include AlphaLISA and LANCE formats from PerkinElmer. To build our TR-FRET assay, we tagged a commercially available H3K4me2 antibody with Eu-cryptate. We chose lanthanide-cryptate (HTRF technology) as it is associated with better stability at low pH compared to lanthanide-chelate (LANCE technology), and low pH was a possible concern due to H2O2 generation during the LSD1 reaction.24,25 When the Eu-tagged anti-H3K4me2 antibody was used in an HTRF format to compare the detection of biotinylated methylated H3K4 peptides, large specific signals were achieved with control substrate peptide compared to unmethylated product ( Fig. 2A , B ). This corresponded to a linear range of 1.0 to 25 nM for H3K4me1 and 0.10 to 13 nM for H3K4me2, where the lower limit is defined as an S/B ratio of 2. The S/B at the top of the linear range was 50 for H3K4me1 and 70 for H3K4me2. We subsequently tested the capacity for LSD1 to demethylate biotinylated H3K4me2 and H3K4me1 peptides ( Fig. 3A ). As expected, LSD1 was able to demethylate both of the biotinylated H3K4 peptides, but because the antibody detects H3K4me2 and H3K4me1, the signal difference in the presence and absence of enzyme was much larger for H3K4me1 than for H3K4me2. For more direct and uncomplicated data interpretation, we chose H3K4me1 as the substrate in the final LSD1 assay scheme. A loss of signal indicated demethylation of H3K4me1 by LSD1 since the Eu-anti-H3K4me2 antibody recognizes H3K4me1 but not the unmethylated form of the peptide ( Fig. 2A and Fig. 3A ). Although this assay was able to detect small amounts of substrate turnover, due to saturation of the TR-FRET signal (seen with the control H3K4me1 peptide in Figure 2B ) at 13 nM of substrate, we could not determine a peptide substrate Km. We relied instead on an orthogonal high-throughput mass spectrometry (HT-MS) assay for this information as well as for enzyme reaction buffer optimization (data not shown). The HT-MS assay determined the apparent substrate Km for H3K4me1 peptide to be 1.4 µM (± 0.038, n = 3), which corresponds to at least 22-fold above the concentration used in the LSD1 enzyme reaction and around 100-fold above the saturation limit for the detection assay. We next explored the activities of different LSD1 constructs ( Fig. 3B ). LSD1 (158-852) contained all three of the major LSD1 domains (SWIRM, AOL, and Tower). Additional truncations were performed at the amino terminal end of the protein to produce LSD1 (171-852), which lacks 5 amino acids of the SWIRM domain. LSD1 (171-426, 517-833) lacks the Tower domain as well as the first 19 amino acids of the AOL domain but has all necessary catalytic, FAD, and substrate AOL amino acids. 7 LSD1 (158-852) appeared to give a better signal compared to LSD1 (171-852). Although the Tower domain protrudes from the catalytic site and makes no obvious interactions with the rest of the protein, we did not detect any activity with the protein lacking this domain. It therefore appears that the Tower domain is necessary for activity, which is consistent with published results for a different LSD1 construct that had the Tower domain removed. 7 As a method to terminate the LSD1 reaction, we explored the use of an H3 peptide in which the lysine at position 4 was changed to methionine (H3K4 >M4). 26 This peptide was found to have an IC50 of 45 to 70 nM and was used at a final concentration of 1 µM to terminate the reaction ( Fig. 4A ). Progression curves were used to determine an appropriate amount of enzyme, within assay linearity, that could result in a large enough S/B for acceptable assay quality. We found that only 6.2 nM of LSD1 (171-852) or 3.0 nM of LSD1 (158-852) was needed to reliably achieve an S/B of at least 5. Comparing IC50 values for 100 compounds tested against LSD1 (158-852) and LSD1 (171-852) resulted in an R2 value of 0.78 and a Pearson r of 0.88, suggesting that similar IC50 values could be obtained by both LSD1 constructs.
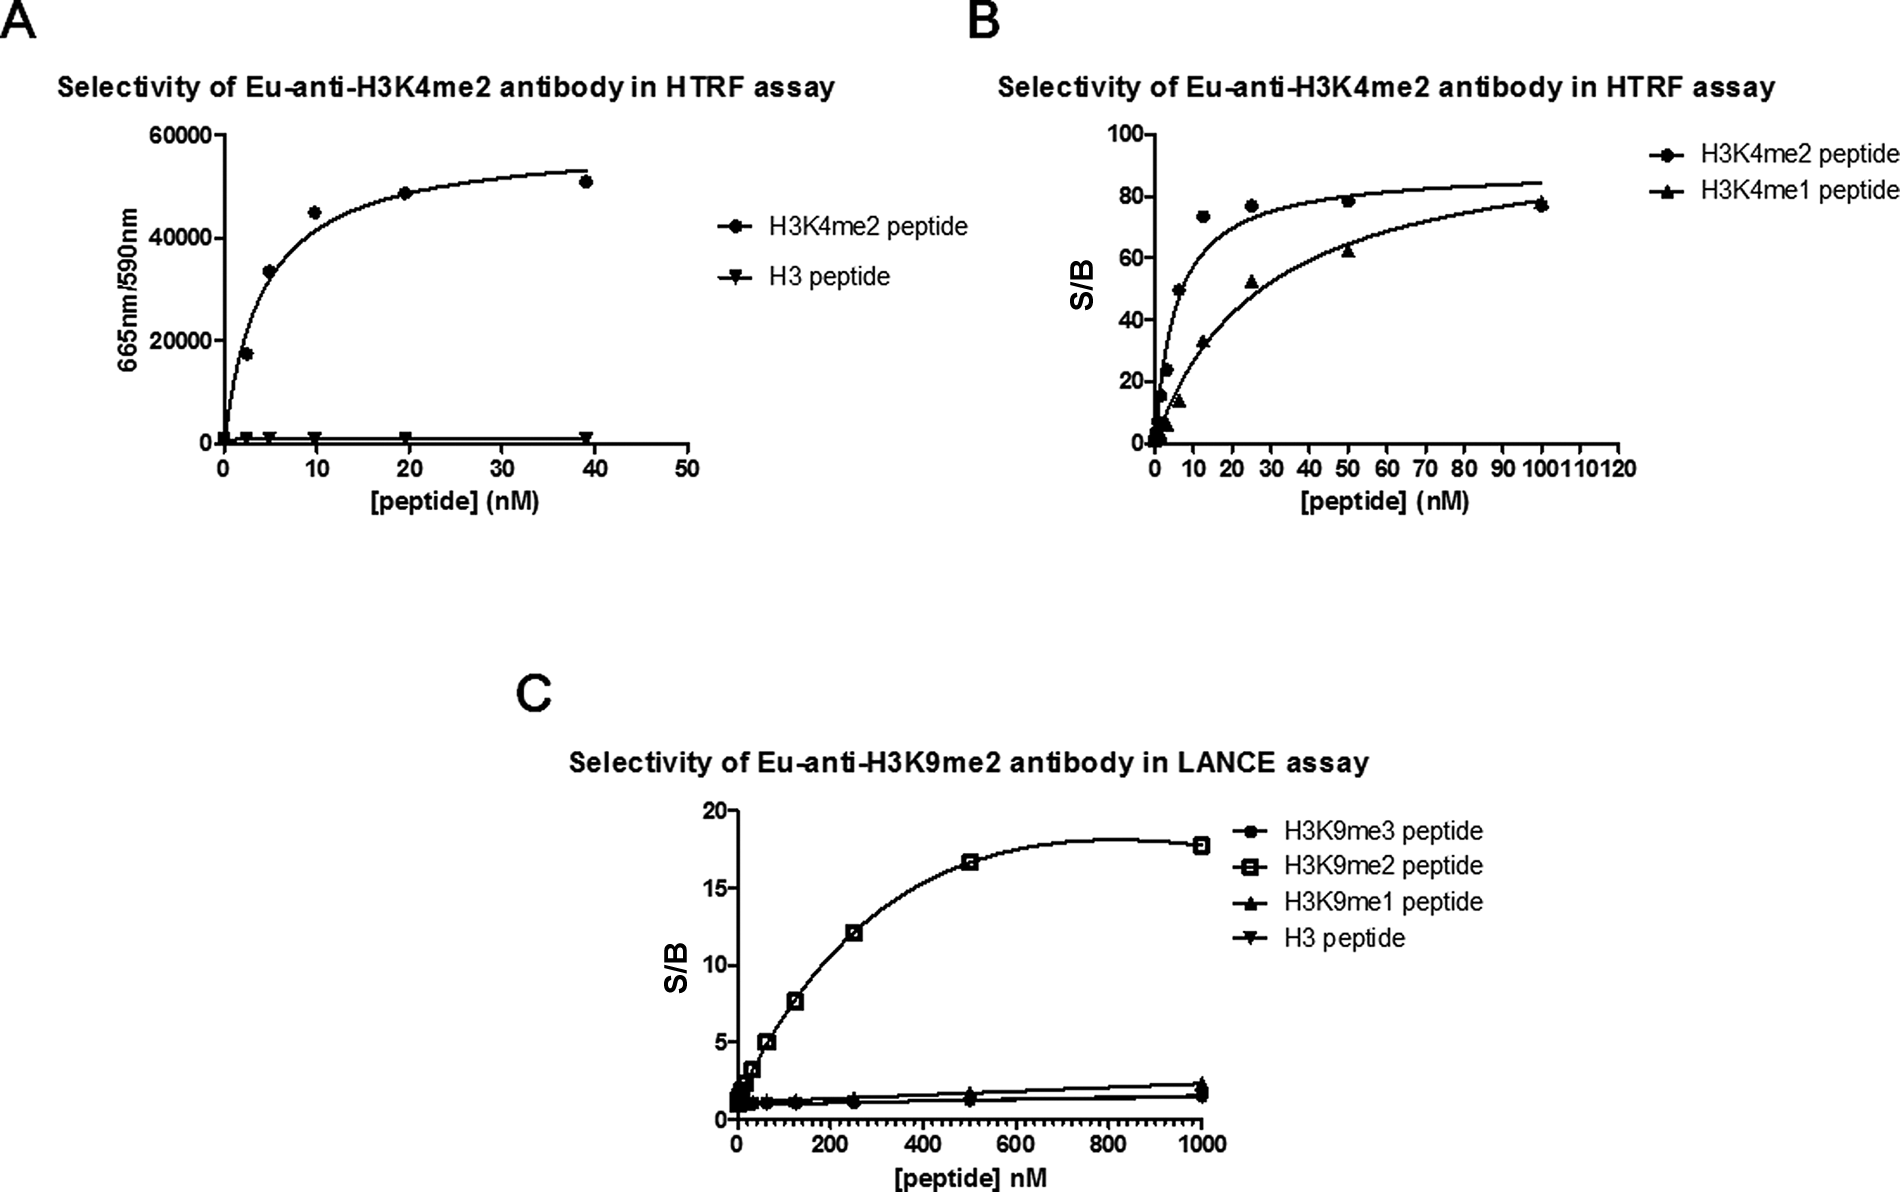
Selectivity of Eu-anti-H3K4me2 and Eu-anti-H3K9me2 antibodies by time-resolved fluorescence resonance energy transfer (TR-FRET). Standard curves for assay window and detection antibody selectivity assessment. (
Key parameters for the optimal LSD1 and JMJD2C time-resolved fluorescence resonance energy transfer (TR-FRET) detection assays. (
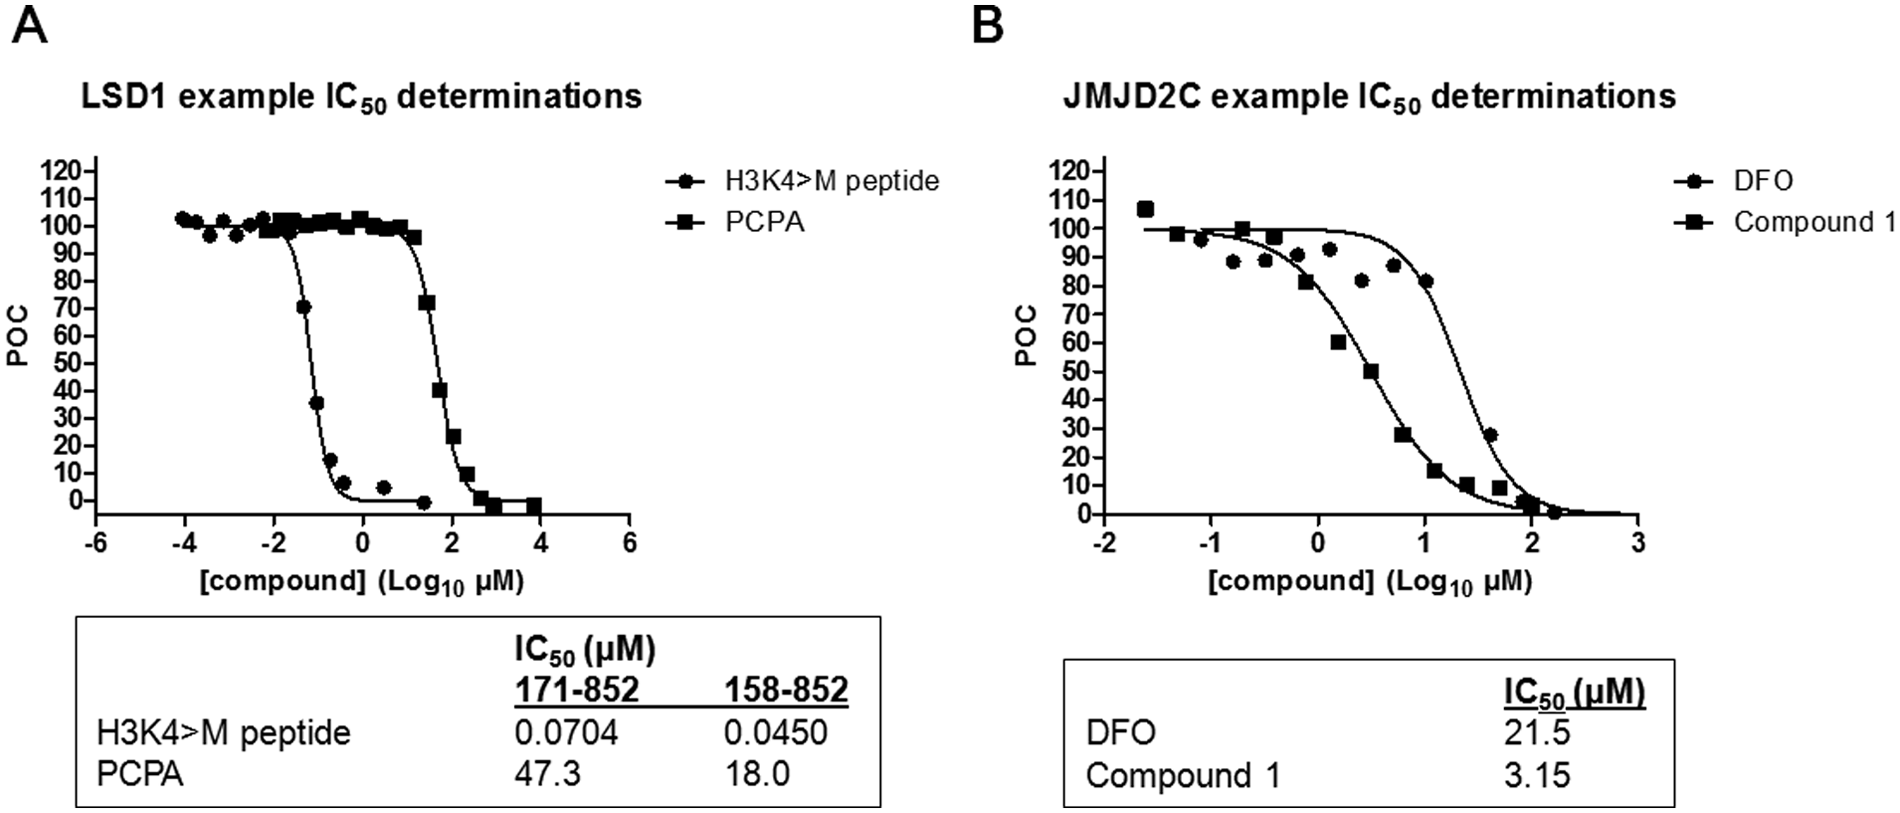
Representative IC50 determinations for LSD1 and JMJD2C time-resolved fluorescence resonance energy transfer (TR-FRET) assays. Compound inhibition of LSD1 (
JMJD2C TR-FRET assay development
There are currently several AlphaLISA assays available from PerkinElmer for the study of JMJD2 subfamily members. Recently, a sensitive HTS-amenable AlphaScreen assay has been described that performed well for characterizing JMJD2E activity and inhibitors, with IC50 values obtained that were similar to more traditional methods. 27 A potential benefit of AlphaLISA and AlphaScreen is that the singlet oxygen transfer that is necessary for signal can withstand distances of approximately 200 nm, which enables the use of larger, more biologically relevant substrates. 28 We chose not to use these formats since a commercial Eu-anti-H3K9me2 antibody suitable for TR-FRET was readily available and because Alpha technology is known to be sensitive to light, temperature, and JMJD2 enzyme reaction components (Fe2+ and ascorbate).28,29 However, the published AlphaScreen JMJD2E assay was not affected by up to 50 µM ascorbate and up to 5 µM of Fe2+ but had some loss of signal with 50 µM Fe2+. 27 Evaluation of the Eu-anti-H3K9me2 antibody in a LANCE format against biotinylated histone H3 peptides revealed that it was selective for H3K9me2 and did not detect unmethylated H3, H3K9me1, or H3K9me3 ( Fig. 2C ). We were able to increase the assay window from a 15-fold S/B using the conditions recommended by the Eu-anti H3K9me2 manufacturer to a 100-fold S/B with optimization ( Figs. 2C and 3C , respectively). This was achieved with a combination of optimized concentrations of antibody and streptavidin-tagged acceptor molecule and the use of APC instead of ULight as the acceptor fluorophore. The linear range for the detection of control H3K9me2 product was 6 to 600 nM, where the lower limit of detection was defined as an S/B of 2. To stop the enzyme reactions, DFO was considered because it is a selective chelator of Fe2+ ( Fig. 4B ). The IC50 for DFO, under the final assay conditions, was determined to be 21.5 µM, and hence detection reagents were supplemented with 100 µM DFO to ensure termination of JMJD2C activity. Using the H3K9me2 TR-FRET assay, enzyme reaction buffer optimization was performed. One noteworthy discovery was the dependence of enzyme activity on detergent ( Fig. 5A ). A 5-fold increase in enzyme activity was observed with the addition of only 0.001% of either Triton X-100 or Tween 20. JMJD2C also appeared to have a strict preference for pH 7.0, and this observation was stronger when Tris was used versus MOPS as a buffering agent ( Fig. 5B ). Apparent affinity values for each of the substrates as well as the Fe2+ cofactor were then determined with the optimized reaction buffer ( Fig. 6 ). The apparent Km values were determined to be 1.68 µM for H3K9me2 and 5.61 µM for 2-OG, and the apparent Kd for Fe2+ was 7.36 µM. Of note, the AlphaScreen assay was inhibited at 50 µM Fe2+, which was around the concentration required for maximal JMJD2C activity in our assay ( Fig. 6C ). 27 Finally, linear regression analysis was performed on progression curves that were generated from different concentrations of JMJD2C. These experiments used concentrations of 2-OG and peptide that were below their apparent Km to favor the detection of 2-OG and peptide competitive inhibitors. These titrations revealed that after 60 min of incubation, as little as 6.25 nM could be used for an S/B of at least fivefold ( Fig. 7B ).
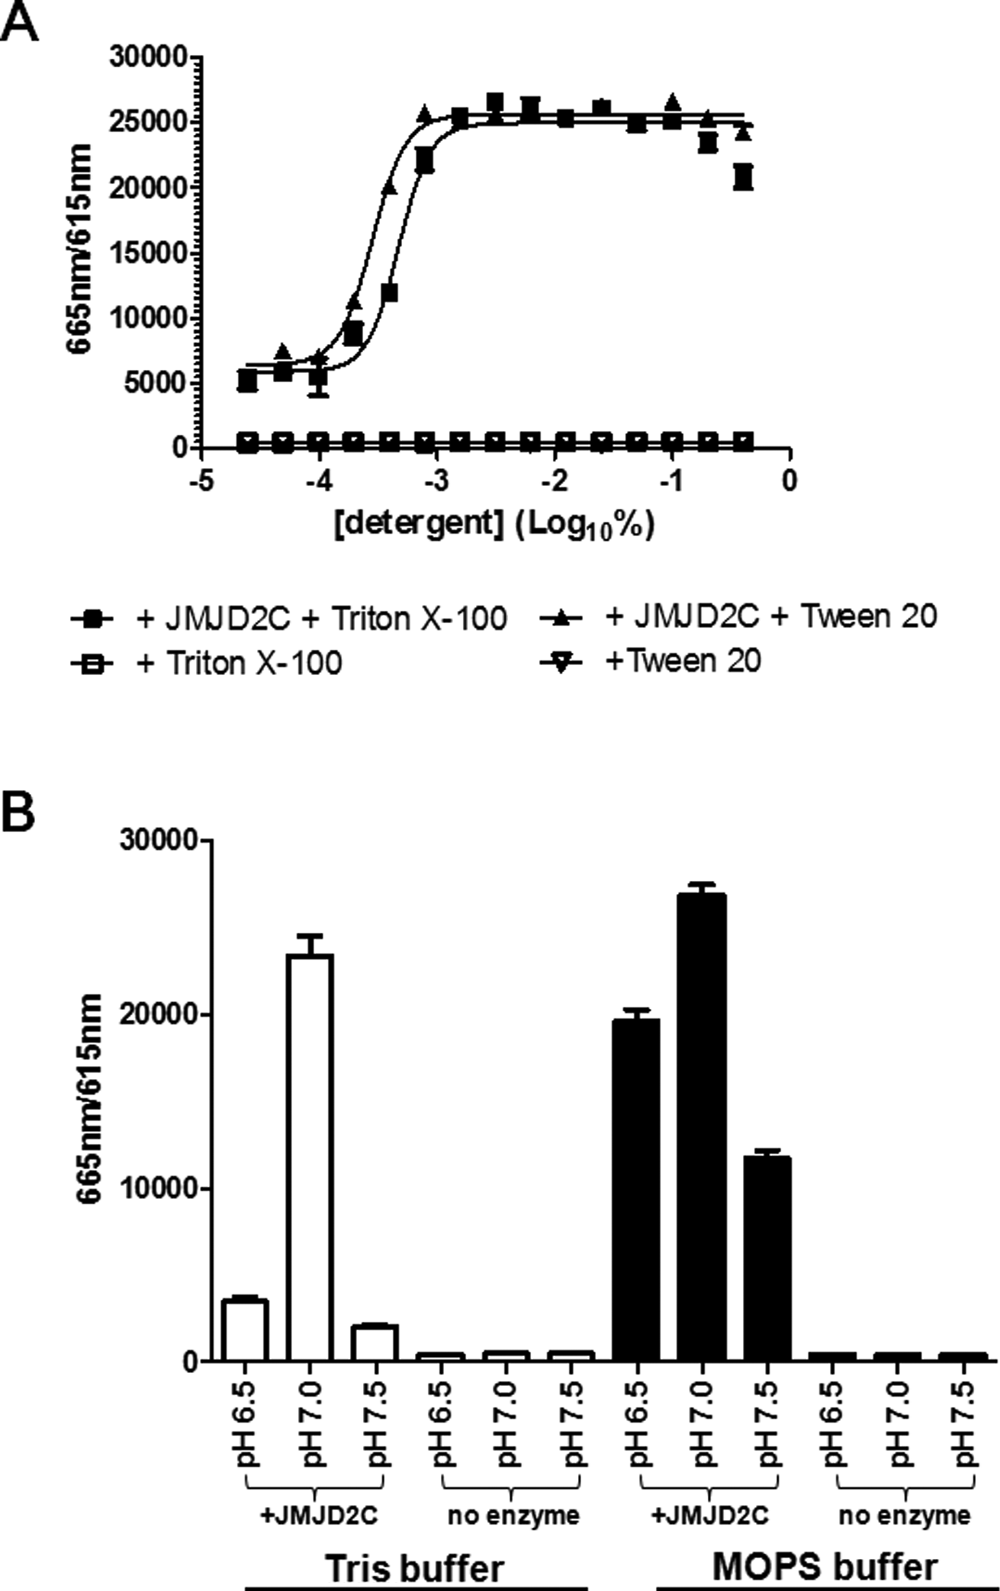
Key parameters for the optimal JMJD2C reaction buffer. Graphs demonstrate the effects of detergent, different buffers, and pH on the activity of JMJD2C. (
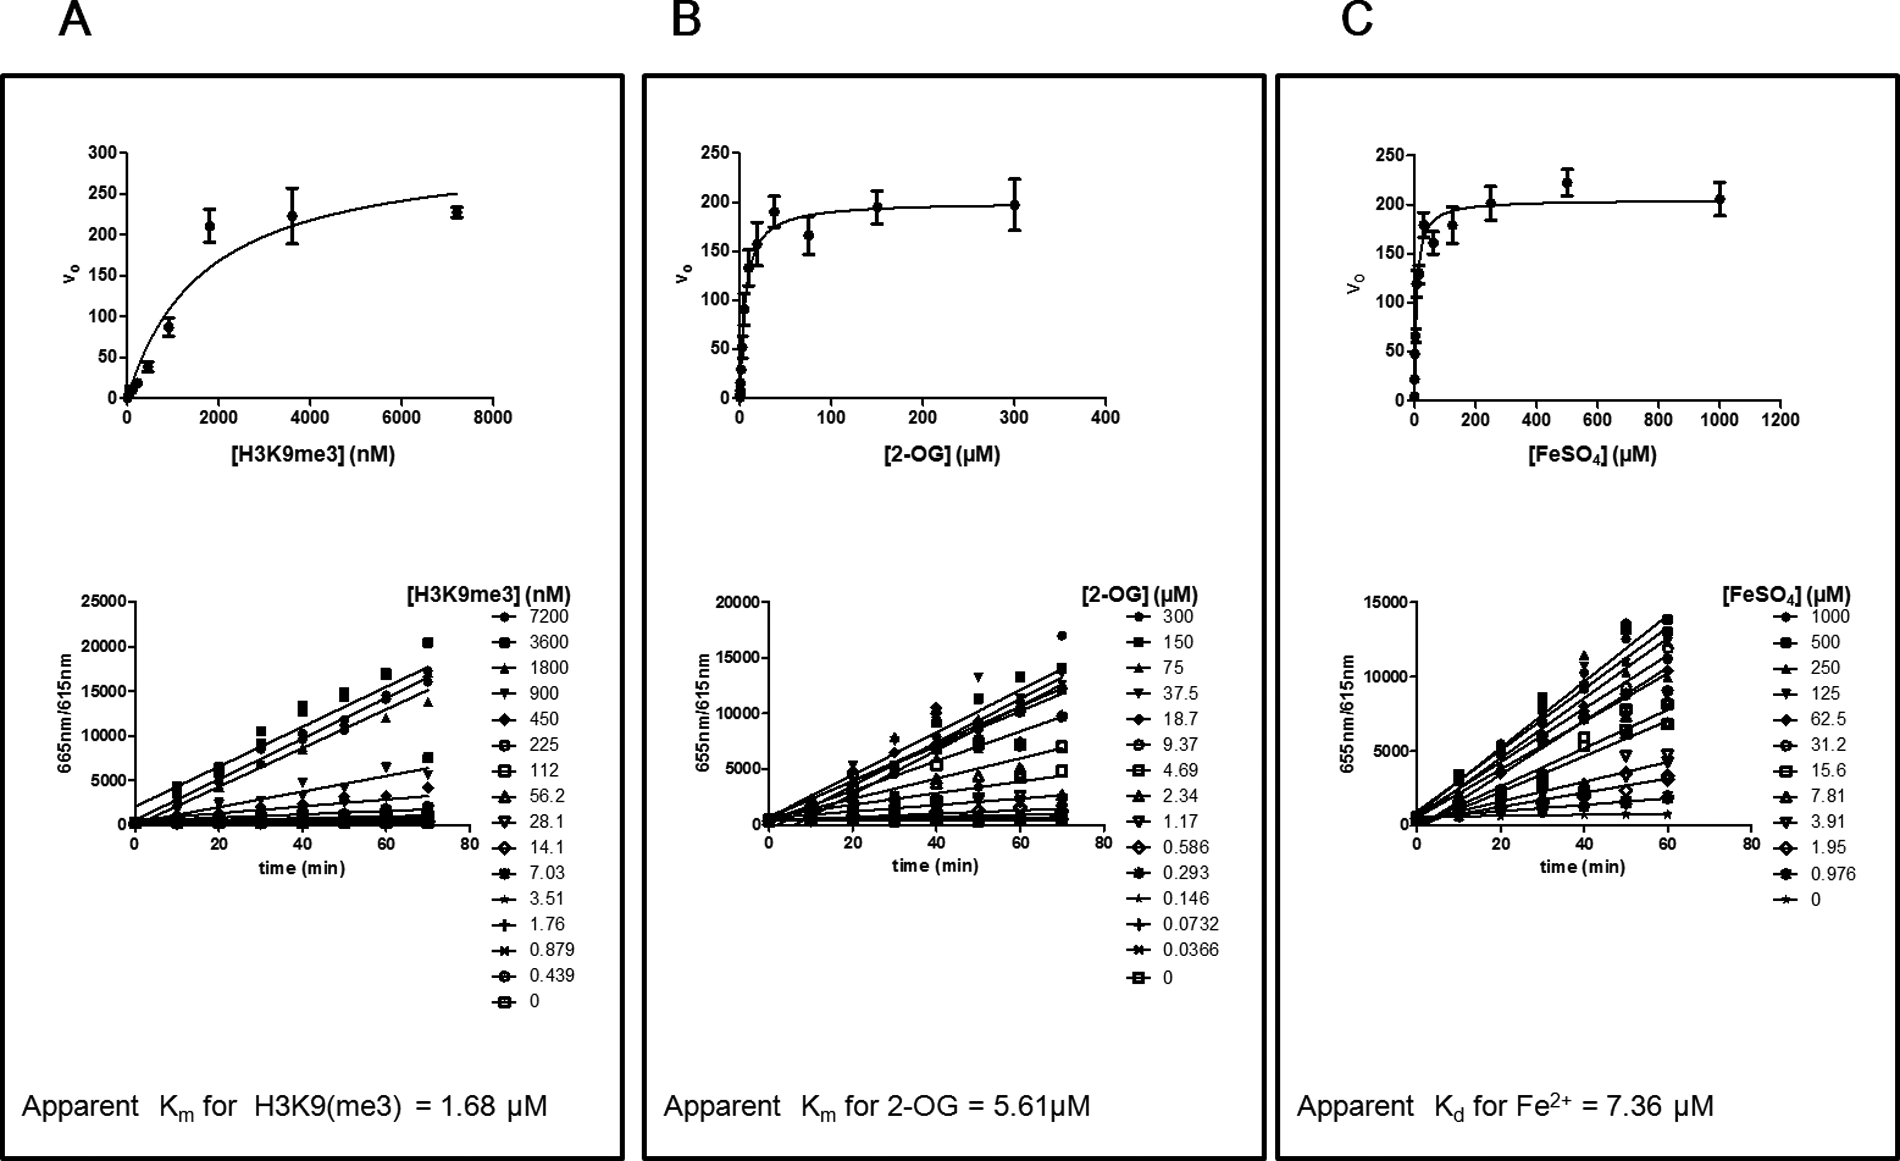
Apparent affinity determinations for JMJD2C substrates and cofactor. Apparent affinity values were calculated by plotting progress curves (lower panels) at different substrate and Fe2+ cofactor concentrations to determine v0 values and then performing nonlinear regression analysis (top panels) of the derived v0 values versus substrate. (
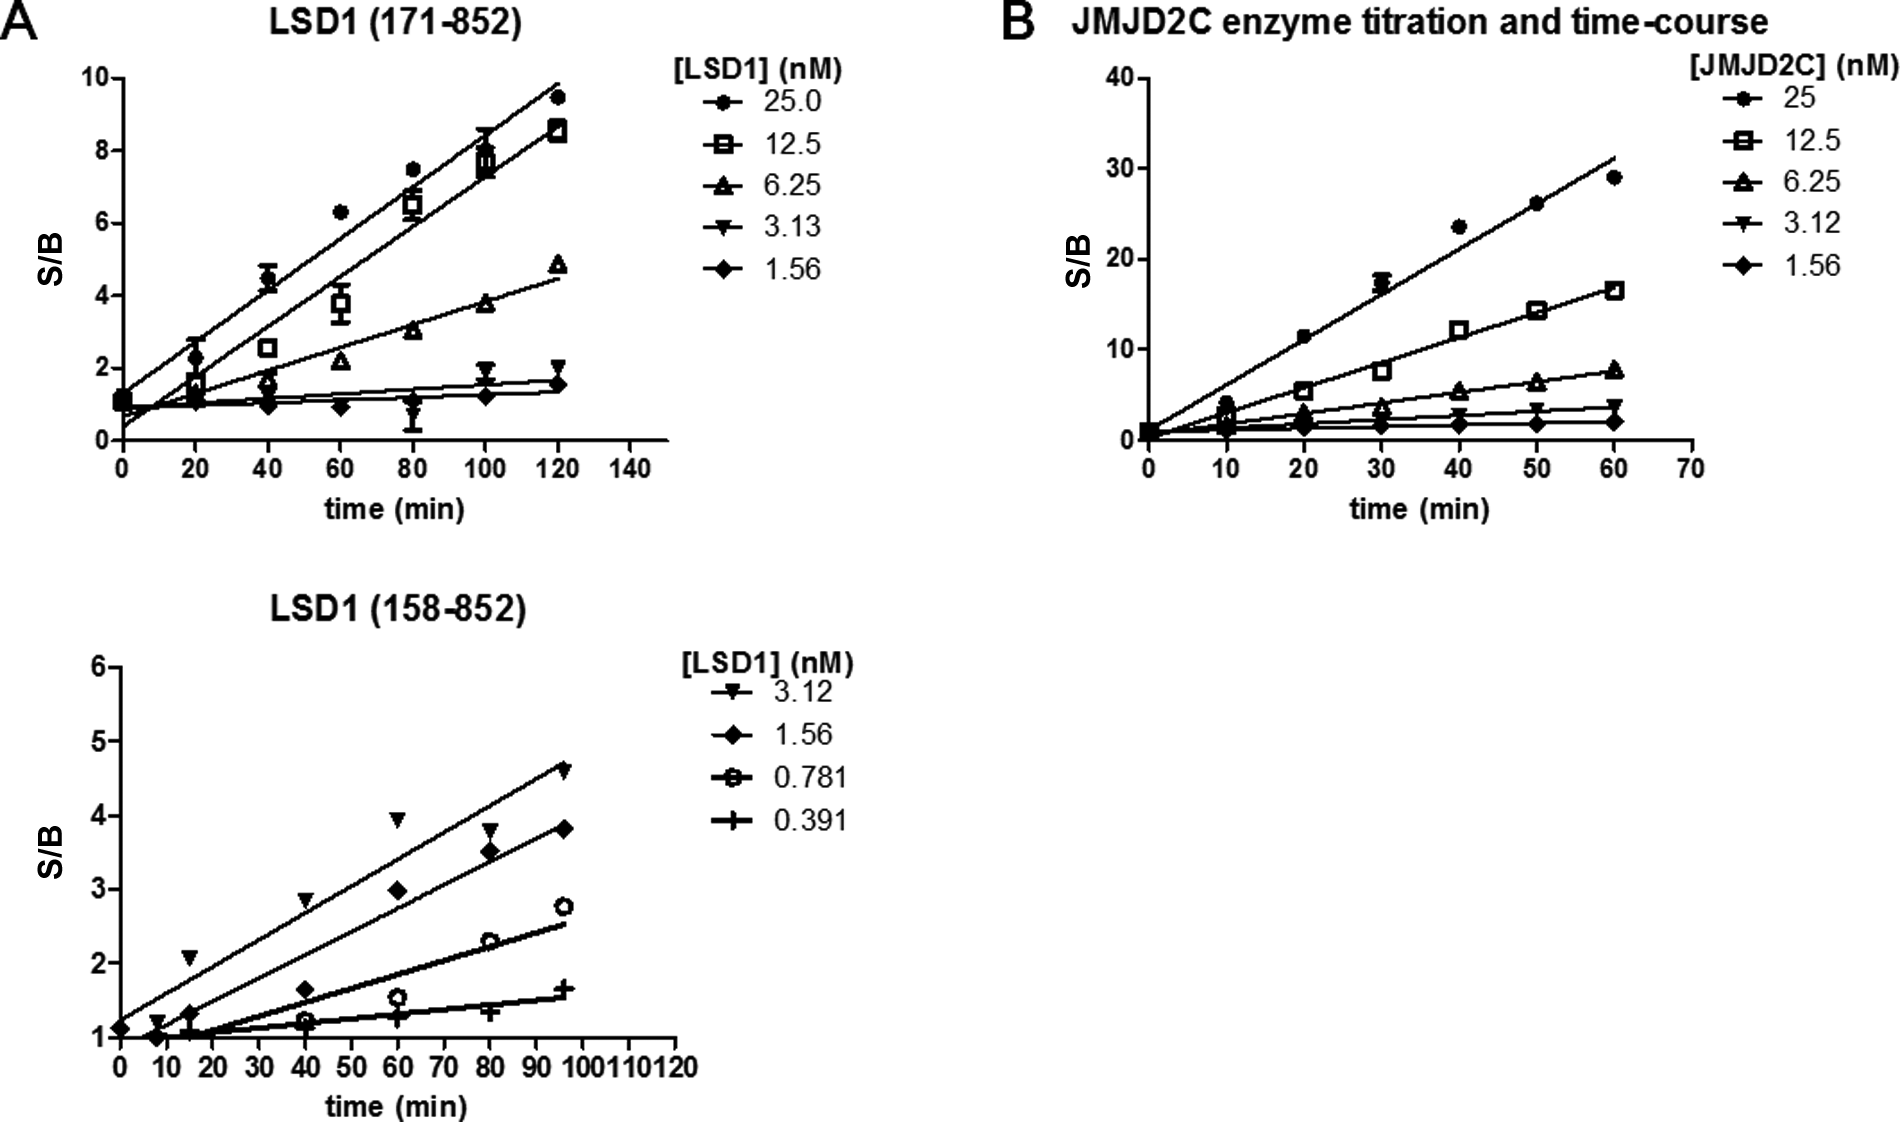
Enzyme titration and time-course for LSD1 and JMJD2C assays. Linear regression analysis representing the signal over background (S/B, where background represents the signal from no enzyme) for enzyme concentrations ranging from 1.56 to 25 nM of enzyme, after increasing amounts of enzyme reaction incubation time. (
Demethylase TR-FRET assay performance
Experiments designed to explore the quality and utility of the LSD1 and JMJD2C TR-FRET assays indicated that both demethylase assays could reliably identify inhibitors. For example, replicate inhibition measurements for compounds tested at a single concentration in the LSD1 assay corresponded to an average plate Z′ of 0.76, an average plate S/B of 4.1, and R2 of 0.84 for the linear regression analysis of the replicate single-point results ( Fig. 8B ). Similar measurements performed using the JMJD2C assay resulted in an average plate Z′ of 0.77, an average plate S/B of 17, and an R2 of 0.94 for the linear regression analysis of the replicate single-point results ( Fig. 8C ). Dose–response analysis of screening hits further confirmed that these assays could reliably detect compounds with different potency ranges ( Fig. 4 ). Moreover, the LSD1 IC50 for trans-2-phenylcyclopropylamine (PCPA), a small molecule that acts by covalent adduct formation with the cofactor FAD at the N5 and C4a positions of the flavin ring following one-electron oxidation and cyclopropyl ring opening, was determined to be 18.0 to 47.3 µM and was similar to values (20.0–32.0 µM) recently reported using H3K4me2 peptide substrate in a peroxidase-coupled assay.22,30

Linear regression and correlation plots to compare LSD1 (158-852) and LSD1 (171-852) IC50 values and to determine LSD1 and JMJD2C TR-FRET assay quality. (
Increasing evidence suggests that demethylases have key roles in maintaining normal cellular processes and in the development of several human disorders, including cancer.1–3 Methods for characterizing demethylase activity that are amenable to HTS should hasten the discovery of compounds that may serve as tools to further investigate these roles and could ultimately lead to novel therapeutics. However, few such methods have been described, and this information has only become available within the past few years. Here we describe HTS-amenable peptide-based LSD1 and JMJD2C TR-FRET immunoassays and evaluate their utility for the characterization of enzyme parameters and for the measurement of compound inhibition. The design of these assays posed a number of possible challenges. For example, success depended on the ability of the enzymes to use biotinylated-peptide substrates and on the availability of suitable antibodies. TR-FRET may not be applicable to the use of larger substrates, such as nucleosomes, as the maximum distance for sufficient energy transfer is about 9 nm. 27 Both enzymes used in our studies could demethylate peptide substrates, but one potential concern is the biological relevance of these substrates. In addition, the absence of other members of the demethylase complexes in the assay may result in poor IC50 translation into cells. Finally, the dependence of the TR-FRET assays described here on specific antibodies may limit its application to other demethylases that target other residues and/or proteins. Despite all of these possible caveats, the LSD1 and JMJD2C TR-FRET assays were straightforward to develop, execute, and implement in an HTS setting. Our work also demonstrates the versatility of TR-FRET technology and provides examples of two different approaches to monitor enzyme activity (i.e., product appearance and substrate disappearance). Although the low saturation limit for H3K4me1 substrate detection imposed limitations on LSD1 enzyme characterization, the H3K9me2 TR-FRET assay was easily applied for JMJD2C apparent substrate Km and cofactor Kd determinations. Both methods were associated with excellent Z′ values (>0.7) and were found to reliably measure demethylase activity and compound inhibition. Finally, both methods required as little as 3 to 6 nM of enzyme to achieve a robust signal in an enzyme reaction volume of only 10 µL for LSD1 and 6 µL for JMJD2C. These assays should serve as valuable, facile, and efficient tools to promote the discovery and characterization of histone lysine demethylase inhibitors.