
Abstract
Glycosylation is a key posttranslational modification that tags protein to membranes, organelles, secretory pathways, and degradation. Aberrant protein glycosylation is present both in acquired diseases, such as cancer and neurodegeneration, and in congenital disorders of glycosylation (CDGs). Consequently, the ability to interrogate the activity of enzymes that can modify protein glycan moieties is key for drug discovery projects aimed at finding modulators of these enzymes. To date, low-throughput technologies such as SDS-PAGE and mass spectrometry have been used, which are not suitable for compound screening in drug discovery. In the present work, a broadly applicable time-resolved fluorescence resonance energy transfer (TR-FRET) assay was developed that can determine the activity of endoglycosidase enzymes in high-throughput formats. The assay was validated using PNGaseF and EndoH as tool deglycosylases. Even though the current setup is based on the recognition of glycans that bind concanavalin A (ConA), the assay concept can be adapted to glycans that bind other lectins.
Introduction
Asparagine-linked (N-linked) glycosylation is a common protein modification occurring on proteins in the endoplasmic reticulum (ER) destined for the secretory pathway or to be integrated into the ER membrane. 1 N-linked glycosylation and the subsequent glycan trimming by ER-resident mannosidases and glycosidases are key signaling events involved in protein quality control and sorting (recently reviewed by Xu and Ng 2 ). Aberrant glycosylation has been associated with a number of diseases, including cancer 3 and neurodegenerative diseases. 4 Deglycosylation of N-linked glycosylated proteins also plays a role in ER-associated degradation (ERAD) of misfolded proteins. 5 The importance of this protein modification is underscored by the presence of multiple congenital disorders of glycosylation (CDGs) and deglycosylation.6,7 Being able to test for the activity of various glycosylating or deglycosylating enzymes can be beneficial for diagnostics and therapeutic drug development. 8
Assays that are commonly used to determine the enzymatic activity of deglycosylating enzymes typically rely on low-throughput technology such as SDS-PAGE9,10 and mass spectrometry.11–13 In addition, the availability of convenient synthetic substrates is typically limited by the complexity of the glycan chemistry. 14 There are some reports in the literature describing assays that are more adapt to routine testing and high-throughput screening; 14 nonetheless, they rely on either a nonhomogeneous process, such as immobilization of the substrate, or the use of fluorescence polarization as a readout, which is not widely adopted. Recently Ishii et al. published an elegant approach that is based on a noncommercial substrate that is challenging to synthesize. 15 Here we describe the development of a high-throughput screening-compatible assay to test for the activity of deglycosylating enzymes that remove N-linked glycosylations from proteins. PNGaseF and EndoH were used as prototype enzymes for assay optimization and pilot screening. Though their activity is not necessarily relevant for discovery biology purposes, they represent convenient tools for validating this approach.
Materials and Methods
RNAseB Biotinylation
Biotinylated RNAseB (bio-RNAseB) was produced from RNAseB (R7784, Sigma-Aldrich, St. Louis, MO) by using the EZ-Link Sulfo-NHS-LC biotinylation kit (21435, Thermo Fisher, Waltham, MA) per the manufacturer’s instructions. The extent of RNAseB biotinylation was determined by the HABA assay (included with the biotinylation kit) per the manufacturer’s instructions.
SDS-PAGE and Western Blot
Samples were boiled for 5 min in SDS-PAGE loading buffer: 1% sodium dodecyl sulfate (SDS), 10% glycerol, 200 mM dithiothreitol (DTT), and 0.1% bromophenol blue. SDS-PAGE was carried out on 4%–12% bis-tris polyacrylamide gels in MES buffer. Gel staining was carried out by using InstantBlue (Sigma-Aldrich) per the manufacturer’s procedure. For Western blot analysis, proteins were transferred to a PVDF membrane, blocked in TBS-T plus 5% nonfat milk, and washed with TBS-T. Membranes were treated with either concanavalin A–horseradish peroxidase (ConA-HRP; H-1104-1, EY, San Mateo, CA), anti-RNAse (PA5-28278, Thermo Fisher) followed by an HRP secondary antibody, or streptavidin-HRP (RPN1231, GE Healthcare, Uppsala, Sweden), and revealed by the Amersham ECL detection kit per the manufacturer’s procedure (GE Healthcare).
Surface Plasmon Resonance
Surface plasmon resonance (SPR) interaction analysis was performed using a Biacore 3000 (GE Healthcare, Uppsala, Sweden), as previously reported 14 with modifications. ConA was immobilized on a CM5 chip by amine coupling according to the manufacturer’s instructions (Amine Coupling Kit, GE Healthcare). Briefly, the surface of the sensor chip was activated for 7 min using a mixture of 0.1 M N-hydroxysuccinimide (NHS) and 0.4 M N-ethyl-N′-[3-dimethyl-aminopropyl] carbodiimide (EDC), and then 20 µg/mL of ConA in 10 mM sodium acetate (pH 5.0) was injected at 10 µL/min up to 3000 ΔRU. Finally, residual activated groups on the surface were blocked by a 7 min injection of 1 M ethanolamine (pH 8.5). A reference channel for background subtraction was prepared by activation with the EDC/NHS mixture (0.1 M/0.4 M as per ligand immobilization), followed by blocking with 1 M ethanolamine. The binding of RNAseB to the immobilized ligand was evaluated by a multicycle kinetic procedure in HBS-P buffer (GE Healthcare) or phosphate-buffered saline (PBS) supplemented with 0.1% Triton X-100 with identical results. Different concentrations of the analyte (from 3 µM to 6 nM) were injected for 120 s at 30 µL/min until equilibrium. Subsequently, analyte dissociation was monitored for 18 min. Biomolecular binding events were reported as changes of resonance units (RUs) over time. The data were analyzed by BiaEvaluation software: specific sensorgrams were obtained for the analyte by subtracting the signals of the reference channel from those of the immobilized ConA channel. The binding affinity was evaluated from kinetic parameters (koff /kon) calculated according to a 1:1 Langmuir binding model. From each sensorgram, the responses at the steady-state were plotted against the corresponding analyte concentrations to generate a calibration curve of RNAseB. Different concentrations (1.5, 0.5, 0.15, and 0 µM) of bio-RNAseB were incubated with or without 3 U/µL PNGaseF at room temperature for 30 min, and then fluxed over the chip, and the steady-state RU recorded. The amount of glycosylated RNaseB still present in the reaction mixture was calculated from the calibration curve.
TR-FRET Assay
Compounds were dissolved in DMSO and transferred to the bottom of a 384-well assay plate (781904, Greiner, Bahlingen, Germany) by acoustic droplet ejection (ATS-200, EDC Biosystems, Fremont, CA) to reach the desired assay concentration in a final volume of 15 µL. The assay buffer was 50 mM sodium phosphate, pH 6.5, 150 mM NaCl, and 0.1% Triton X-100. Mix 1—150 nM bio-RNAseB, 75 nM ConA-647 (C21421, Thermo Fisher), and 75 nM SA-Eu (AD0063, PerkinElmer, Waltham, MA)—was prepared in assay buffer and preincubated at room temperature for 1 h. After preincubation, 10 µL of mix 1 was added to each well and incubated at room temperature for 10 min. Five microliters per well of the appropriate concentration of PNGaseF (P0704S, NEB, Ipswich, MA) or EndoH (1108872601, Sigma-Aldrich) in buffer was added and incubated for 1 h at room temperature. The time-resolved fluorescence resonance energy transfer (TR-FRET) signal was revealed by a fluorescence detector (EnVision, PerkinElmer). The data analysis was carried out using Prism (GraphPad, La Jolla, CA).
Compound Library
The compound collection tested in the present work included 1280 FDA- or EMA-approved drugs sourced from Prestwick Chemical (Illkirch, France).
Calculations
To determine the experimental concentration of bio-RNAseB in the real-time measure, standard curves were prepared as follows: specific ratios of bio-RNAseB to bio-RNAseA were prepared by twofold dilutions of bio-RNAseB into bio-RNAseA (i.e., 0%, 50%, 75%, 87.5%, 93.5%, 99.4%, and 100% conversion) for different total bio-RNAse concentrations (20, 80, 320, and 1280 nM). TR-FRET ratios were determined, and the data were fit using a four-parameter logistic regression to generate standard curves. Experimental data (TR-FRET ratios) were converted to concentrations using the “interpolate a standard curve” function of Prism 7.0 (GraphPad).
Enzyme velocity was calculated as the first derivative of the calculated bio-RNAseA concentration in time. The bio-RNAseA concentrations were calculated by subtracting the calculated concentration of bio-RNAseB determined from the standard curve (see above) from the initial concentration of bio-RNAse in the reactions. Velocity calculations were carried out using the “smooth, differentiate or integrate curve” function of Prism 7.0 (GraphPad). Four neighbor time points and a second-order polynomial fitting were used for smoothening. The first value of the derivative time series was considered the enzyme velocity.
The Michaelis–Menten enzyme kinetic parameters were determined by plotting the enzyme velocity versus the substrate concentration and fitting the curve using the “Michaelis–Menten” function of Prism 7.0 (GraphPad).
The percentage of enzyme inhibition was calculated by normalizing each sample signal between DMSO-treated samples containing enzyme (representing 0% inhibition) and DMSO-treated samples without enzyme (representing 100% inhibition) using the following formula: [(no-enzyme signal) – (sample signal)]/[(no-enzyme signal) – (DMSO signal)]*100.
The compound potency (IC50) was calculated by fitting a dose–response curve with a four-parameter logistic regression using Prism 7.0 (GraphPad).
Results
Assay Design
To overcome the limitations of standard deglycosylase assays, we designed a new assay with the aim of making it homogeneous, broadly applicable to a variety of deglycosylase enzymes, and cost-effective. To this aim, RNAseB was leveraged as a substrate for such enzymes. RNAseB is widely used in glycobiology due to it being glycosylated on a single asparagine residue (Asn-34) 14 and easy to obtain at high purity and low cost. RNAseB is converted to RNAseA (the deglycosylated form of RNAseB) by the activity of deglycosylase enzymes such as PNGaseF and EndoH (technically, EndoH will leave a single N-acetylglucosamine attached to Asn-34; this form of RNAseB will also be referred to here as RNAseA for simplicity). To detect RNAseB in a homogeneous fashion, a TR-FRET assay was developed in which biotinylated RNAseB (bio-RNAseB) is recognized by europium-conjugated streptavidin (SA-Eu) and AlexaFluor-647-conjugated ConA (ConA-647) ( Fig. 1A ). The conversion of bio-RNAseB to bio-RNAseA by deglycosylating enzymes reduces ConA-647 binding, resulting in a TR-FRET signal decrease. All assay optimization steps were carried out in 384-well plates to allow a seamless transition to production.
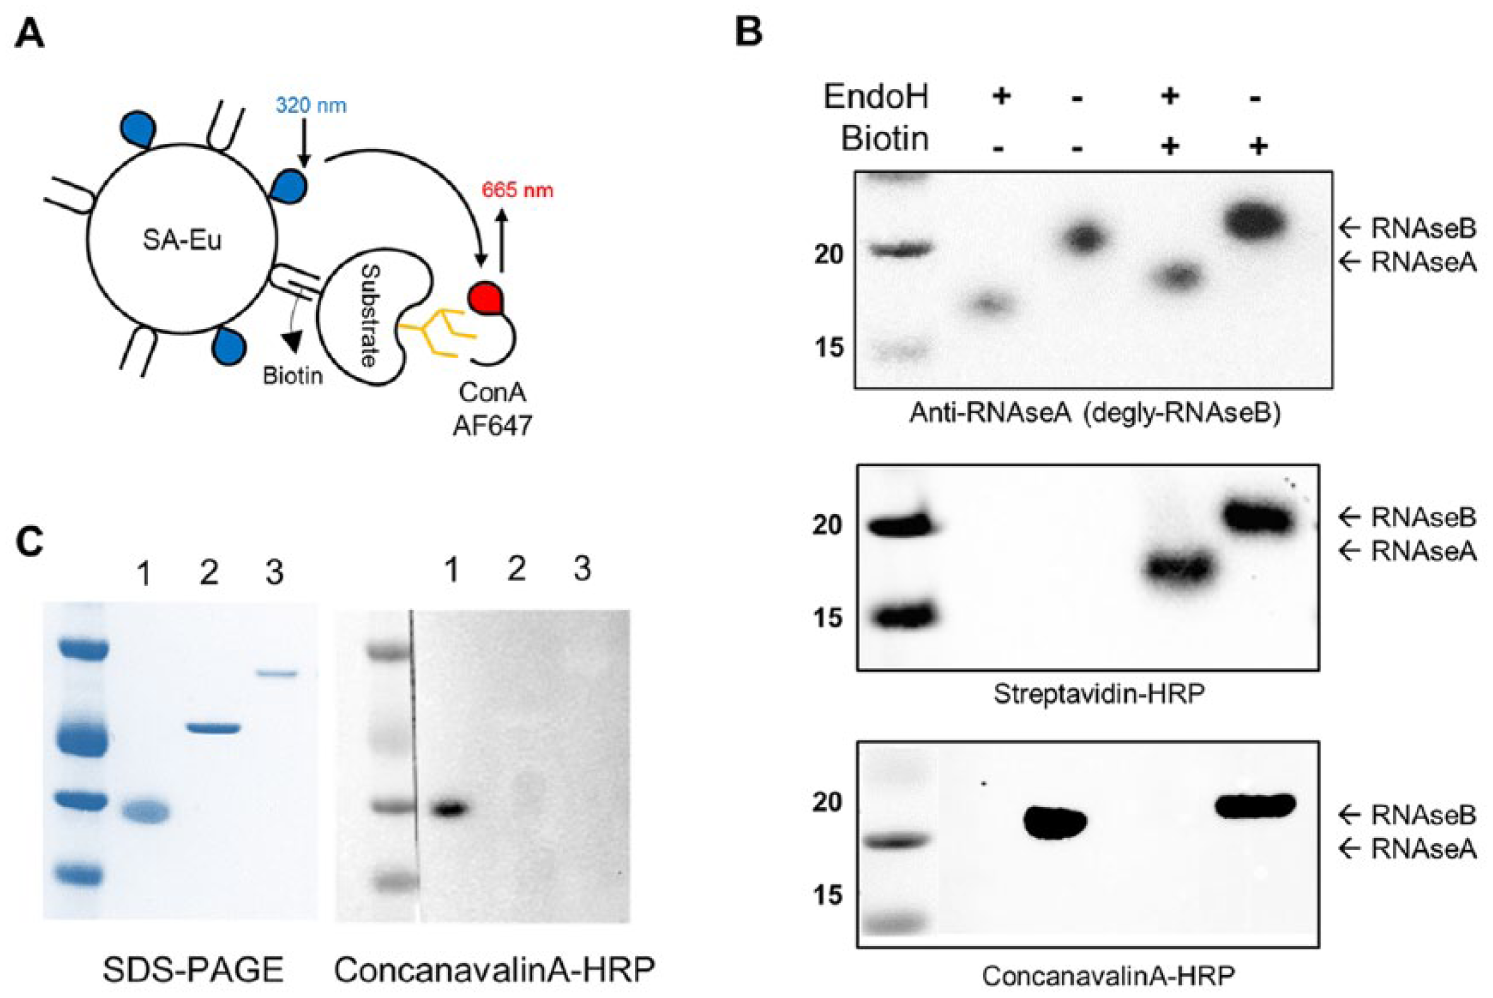
Assay concept and reagent quality and purity. (
Reagent Preparation and Qualification
With the aim of developing the TR-FRET-based detection, RNAseB was biotinylated in vitro (bio-RNAseB). The biotinylation efficiency was determined to be four biotins per RNAseB molecule by HABA assay. Both RNAseB and bio-RNAseB were then subjected to deglycosylation by EndoH per the manufacturer’s protocol. To determine the identity and purity of the obtained reagents, RNAseB and bio-RNAseB, treated with or without EndoH, were analyzed by Western blot ( Fig. 1B ). The upper panel of Figure 1B is a Western blot using anti-RNAseA, showing that EndoH can completely deglycosylate both RNAseB and bio-RNAseB. In addition, bio-RNAseA and bio-RNAseB migrate more slowly than their nonbiotinylated forms, indicating a higher molecular weight due to the addition of the biotin molecules. In terms of biotinylation, the middle panel of Figure 1B , obtained by streptavidin-HRP staining, shows that the in vitro biotinylation process was effective and, as expected, is not affected by treatment with EndoH. Finally, full deglycosylation of RNAseB and bio-RNAseB was confirmed by ConA-HRP staining ( Fig. 1B bottom panel), where only the glycosylated, higher-molecular-weight bands are detected.
The purity of the enzymes used in the present work was determined to be optimal by SDS-PAGE ( Fig. 1C ). In addition, the presence of glycosylated contaminants within the enzyme preparations was tested by Western blot by staining with ConA-HRP. No contamination was detected, as shown in Figure 1C .
TR-FRET Detection of Bio-RNAseB
In order to prove that the TR-FRET detection of bio-RNAseB is effective, and at the same time to provide information on the optimal amount of SA-Eu and ConA to be used, three concentrations of bio-RNAseB (3, 10, and 30 nM) were incubated with varying concentrations of SA-Eu (2.2, 6.6, 20, and 60 nM) and ConA-647 (0.4, 2, 10, and 50 nM). The same combination of detection reagents was tested on EndoH-treated bio-RNAseB as a negative control. The results presented in Figure 2A show that a higher TR- FRET signal can be achieved with bio-RNAseB than with EndoH-treated bio-RNAseB under most conditions, indicating the dependence of TR-FRET on the glycosylation state of RNAseB. In terms of detection reagent optimization, increasing concentrations of ConA-647 caused an increase of the signal-to-background ratio (fold over no RNAseB) at each SA-Eu concentration tested (individual curves within each plot in Fig. 2A ) without affecting the shape of the curves. On the other hand, increasing the concentration of SA-Eu not only increased the signal-to-background ratio (same color curve across different plots in Fig. 2A ) but also heavily influenced the shape of the curve. In fact, at the lower SA-Eu concentrations the TR-FRET signal decreases with increasing bio-RNAseB because of the hook effect—a phenomenon that occurs when the analyte being detected (bio-RNAseB) is in excess of at least one of the detection reagents. 16 The hook effect is also observed at higher concentrations of SA-Eu as the peak of the curves shift to the right with higher SA-Eu concentrations. Within the range of tested bio-RNAseB concentrations, the hook effect was not appreciable at 50 nM SA-Eu, although we would expect to see it if we went to higher RNAseB concentrations. Based on these data, 50 nM SA-Eu and 50 nM ConA-647 were used to further develop the assays.
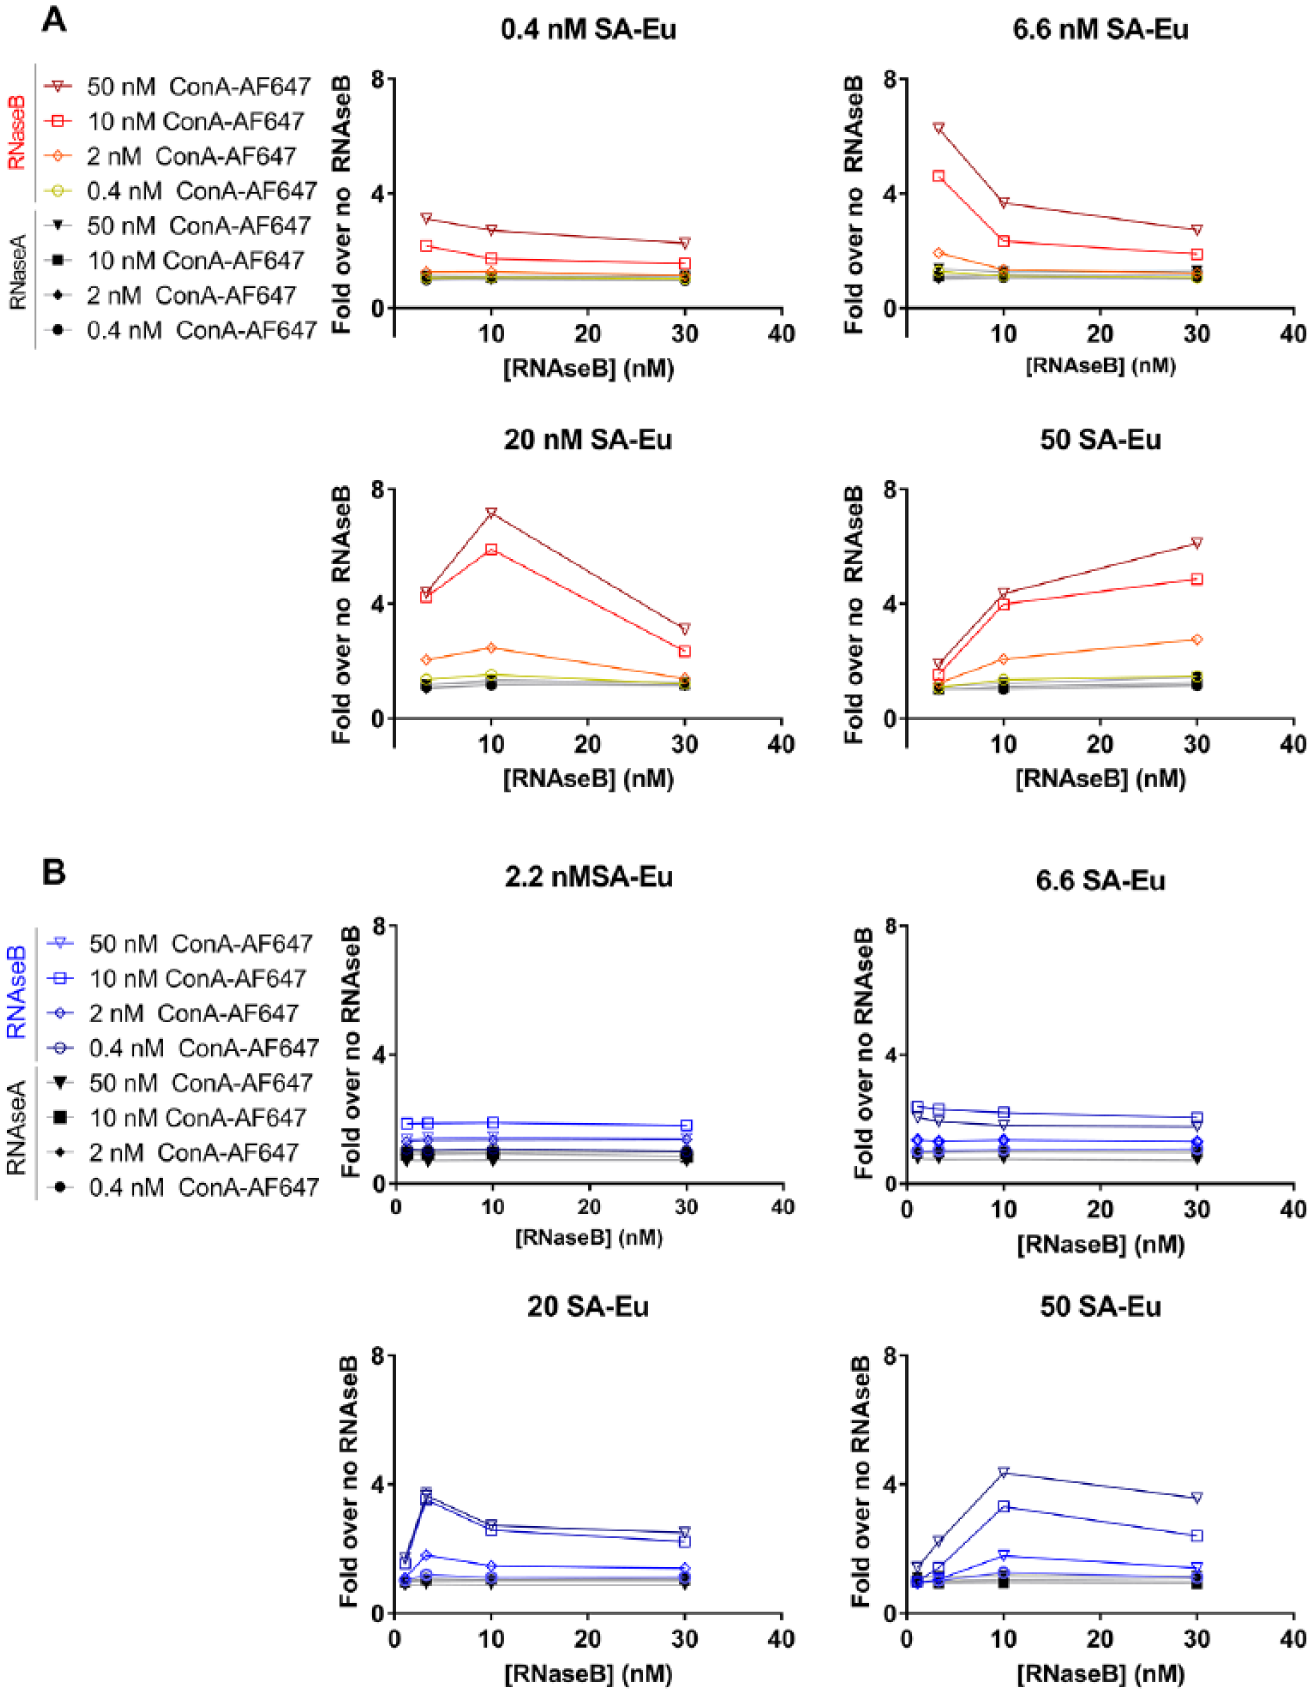
Bio-RNAseB detection by TR-FRET. (
RNAseB is commonly denatured before use as a tool for glycobiology studies. Consequently, we investigated whether RNAseB denaturation had an effect on the proposed detection system. To this aim, the same combination of detection reagents used for native bio-RNAseB in Figure 2A , was used for denatured bio-RNAseB treated with or without EndoH. The use of denatured RNAaseB resulted in a lower and slightly left-shifted peak signal-to-background ratio relative to native RNAseB, potentially due to a different spatial arrangement of the donor and acceptor reagents bound to the denatured RNaseB ( Fig. 2B ). Since denaturation did not improve on the signal-to-background ratio observed with native RNAseB, all further experiments were carried out using the native protein.
PNGaseF Activity Determination by TR-FRET
To determine if enzymatic deglycosylation could be quantitatively detected by the TR-FRET assay, different levels of deglycosylation were mimicked by preparing different ratios of bio-RNAseB and bio-RNAseA while keeping the total RNAse concentration constant at 15 nM. Each reaction was incubated with 50 nM SA-Eu and 50 nM ConA-647, and the TR-FRET ratio was measured to generate a standard curve ( Fig. 3A ). These data confirmed a linear relationship between the simulated percent substrate conversion and the TR-FRET, ratio indicating the suitability of the assay to detect the activity of deglycosylating enzymes and inhibitors thereof. To test the detection of PNGaseF activity on RNAseB by TR-FRET, 3 U/µL PNGaseF was incubated with multiple concentrations of bio-RNAseB (0, 20, 80, 320, and 1280 nM) for 30 min at room temperature. Following incubation, all reactions were diluted to reach a final concentration of 10 nM bio-RNAseB and then incubated with 50 nM SA-Eu and 50 nM ConA-647 for 1 h at room temperature. TR-FRET ratios were converted to product (bio-RNAseA) concentrations using the standard curve in Figure 3A , and enzyme velocities were calculated as described in Materials and Methods. When the enzyme velocity was plotted against the concentration of bio-RNAseB used in the reaction, the estimated Km of bio-RNAseB for PNGaseF was found to be 760 ± 150 nM ( Fig. 3B ).
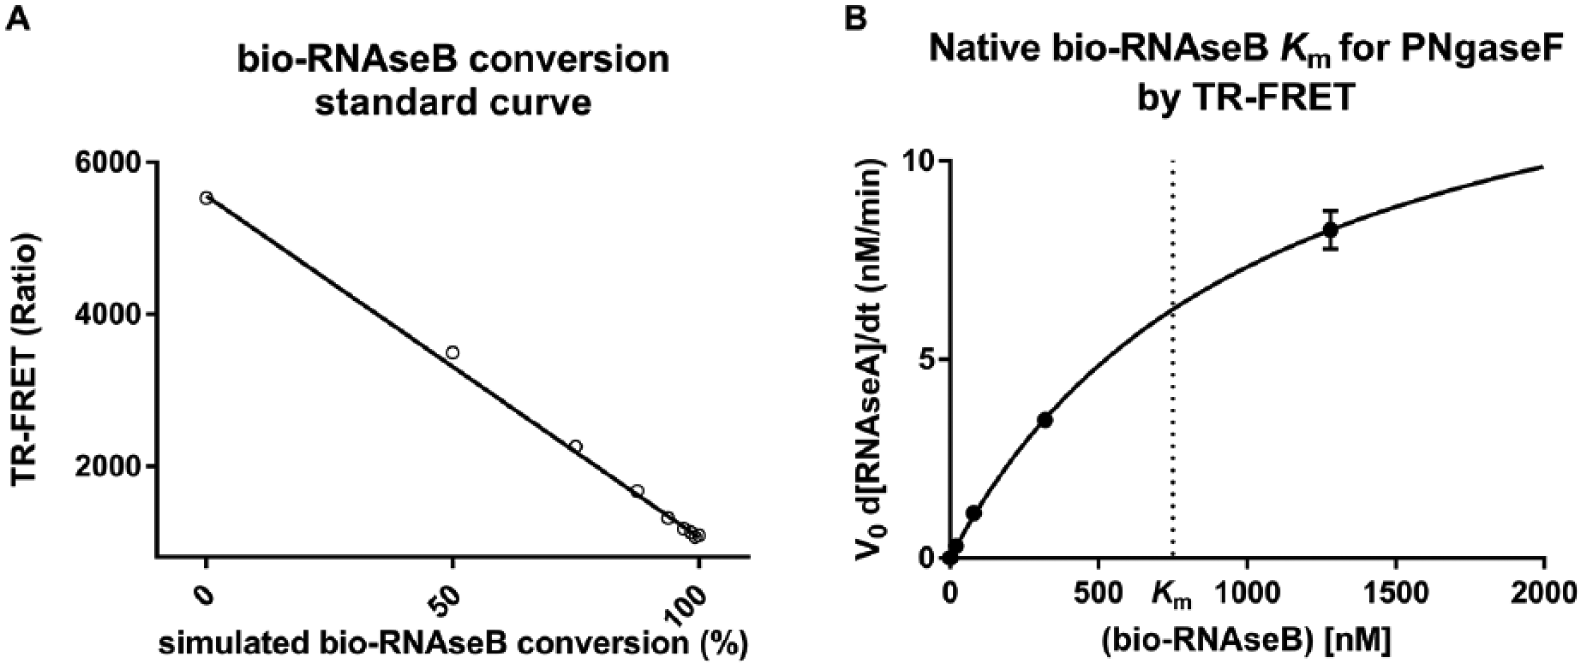
Bio-RNAseB Km for PNGaseF as determined by TR-FRET. (
PNGaseF Activity Determination by Western Blot and Surface Plasmon Resonance
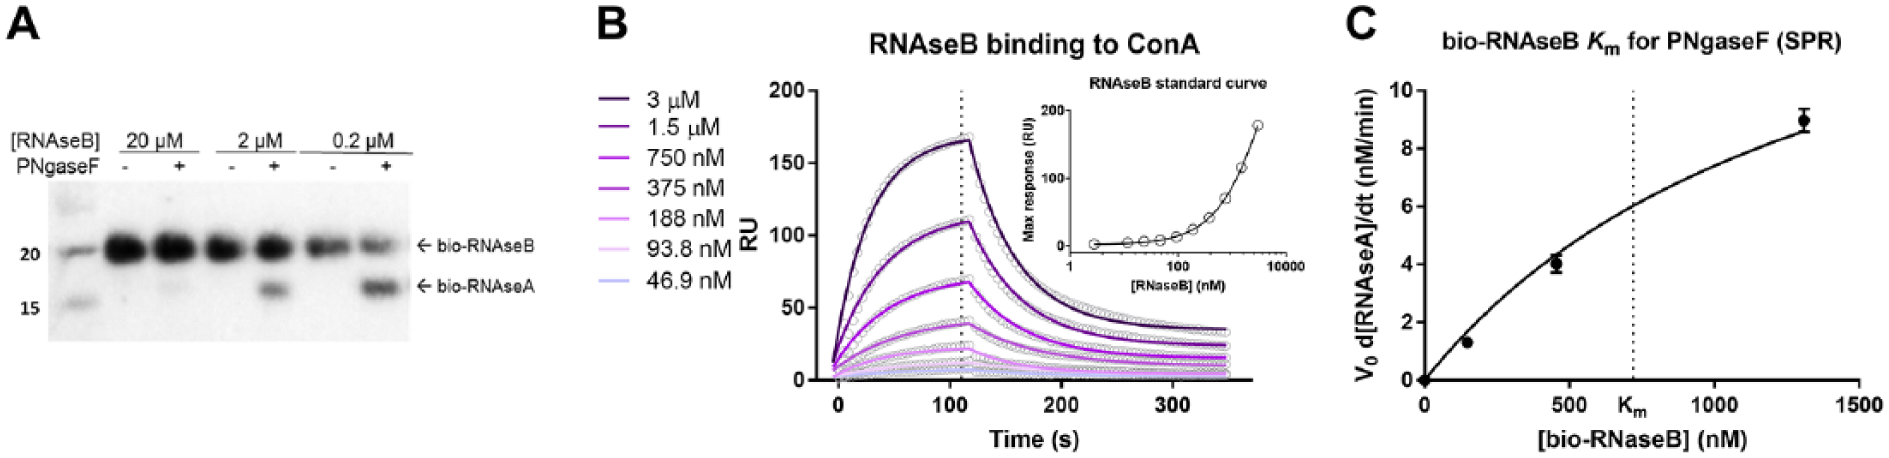
To validate the use of the TR-FRET assay to measure enzyme activity, three concentrations of bio-RNAseB (0.2, 2, and 20 µM) were incubated with 3 U/µL of PNGaseF at room temperature for 1 h, and cleavage was monitored by Western blot ( Fig. 4A ). Each lane was loaded with 30 ng of total RNAse, transferred to a membrane, and stained with anti-RNAseA. The cleavage is barely detectable at 20 µM bio-RNAseB (estimated ~5% cleavage) but is more evident at 2 and 0.2 µM (estimated ~60% cleavage). These data confirm that PNGaseF can cleave RNAseB under similar conditions as used for TR-FRET detection, and that the change in TR-FRET signals observed in the experiment described in Figure 3B is due to PNGaseF cleavage of RNAseB. It should be noted that although the percent cleavage is higher at lower bio-RNAseB concentrations, the reaction velocity increases with higher bio-RNAseB concentrations. In fact, the concentration of bio-RNAseA from 5% conversion of 20 µM bio-RNAseB (~1 µM) is higher than that from 60% conversion of 0.2 µM bio-RNAseB (~0.12 µM).
(
To further validate that the TR-FRET assay can quantitatively measure product formation from a deglycosylating enzyme, an SPR study was performed and the bio-RNAseB Km for PNGaseF was determined. First, ConA was chemically immobilized on an SPR chip, and the ConA chip was fluxed with a serial dilution of bio-RNAseB in order to establish a calibration curve ( Fig. 4B and inset). The calibration curve was produced by plotting steady-state RUs against the bio-RNAseB concentration. From these data, the bio-RNAseB Kd for ConA was found to be 1.13 ± 0.11 µM, well in line with literature data. 17 In addition, the kinetic parameters kon and koff were calculated to be 7.86 ± 92.9 × 10³ M−1 s−1 and 0.00927 ± 6.37 × 10⁻⁵ s−1, respectively. To determine the rate of product formation at different bio-RNAseB concentrations, 0, 150, 450, and 1300 nM bio-RNAseB were incubated with 3 U/µL of PNGaseF, or buffer as a control, at room temperature for 30 min. The reactions were then fluxed onto the ConA immobilized chip, the steady-state RU was recorded for all conditions, and the concentration of bio-RNAseB was interpolated using the calibration curve. The bio-RNAseA concentration for each condition was calculated by subtracting the interpolated bio-RNAseB concentrations in the presence of PNGaseF from those of the control (no-PNGaseF) reactions. When the enzyme velocities (determined as described in Materials and Methods) were plotted against the bio-RNAseB concentration used in the reaction, the estimated Km of bio-RNAseB for PNGaseF was 720 ± 71 nM ( Fig. 4C ), in good agreement with the value determined by the TR-FRET method ( Fig. 3B ).
PNGaseF and EndoH Activity on the Preformed Complex by TR-FRET Real-Time Measure
The data presented in Figure 3B were generated in a nonhomogenous manner by first incubating bio-RNAseB with PNGaseF, diluting the reactions to 10 nM bio-RNAseB, and then adding the SA-Eu and Con-647 detection reagents. For consistent enzyme kinetics during the time course of homogenous, high-throughput screening assays, it is desirable to either stop the enzyme reaction before detection reagent addition or run the reaction in the presence of detection reagents. For PNGaseF and EndoH, stopping the reaction is not feasible since suitable potent inhibitors are not known, and other physical or chemical methods are either ineffective or not compatible with antibody-based detection. In addition, to make the assay homogeneous, the dilution and transfer steps need to be removed. Therefore, to make a more high-throughput-compatible assay, we sought to determine if PNGaseF and EndoH were active on the SA-Eu/bio-RNAseB/ConA-647 preformed complex. One potential limitation is the relatively high bio-RNAseB Km (720–760 nM). Increasing the concentration of the detection reagents to allow the assay to be run close to the Km is not cost-effective for a large screening campaign, whereas running the reaction well below the Km could lead to an inefficient reaction and low substrate turnover.
To test the activity of PNGaseF and EndoH on the preformed complex, multiple concentrations of bio-RNAseB were preincubated with 50 nM SA-Eu and 50 nM ConA-647, and the TR-FRET complex was allowed to form for 1 h. PNGaseF was tested against a range of 5–1280 nM bio-RNAseB, and EndoH was tested against a range of 31.25–2000 nM bio-RNAseB. Standard curves for both ranges were prepared by serially diluting bio-RNAseB into bio-RNAseA while keeping the total bio-RNAse concentration the same for each condition. As expected, higher bio-RNAse concentrations resulted in lower signal-to-background ratios ( Fig. 5A ). PNGaseF (3 U/µL) or EndoH (5 nM) was added to the preformed complexes, and the reaction progress was determined by reading the TR-FRET signals over a 30 min period. The amount of bio-RNAseA produced over time was calculated by subtracting the bio-RNAseB concentration determined at each time point (interpolated from the standard curve) from the initial RNAseB concentration ( Fig. 5B ). The initial velocity (V0) of all the conditions for both enzymes was calculated (as described in Materials and Methods) and plotted against the concentration of bio-RNAseB ( Fig. 5C ). The Km of the SA-Eu/bio-RNAseB/ConA-647 complex for PNGaseF was found to be 901 ± 229 nM, which is in line with the previous measurement carried out by TR-FRET ( Fig. 3B ) and SPR ( Fig. 4C ). The Km of the complex for EndoH was found to 1098 ± 135 nM. In summary, these data show that both PNGaseF and EndoH are active on the preformed complex, and that this homogenous format can be used for high-throughput screening.
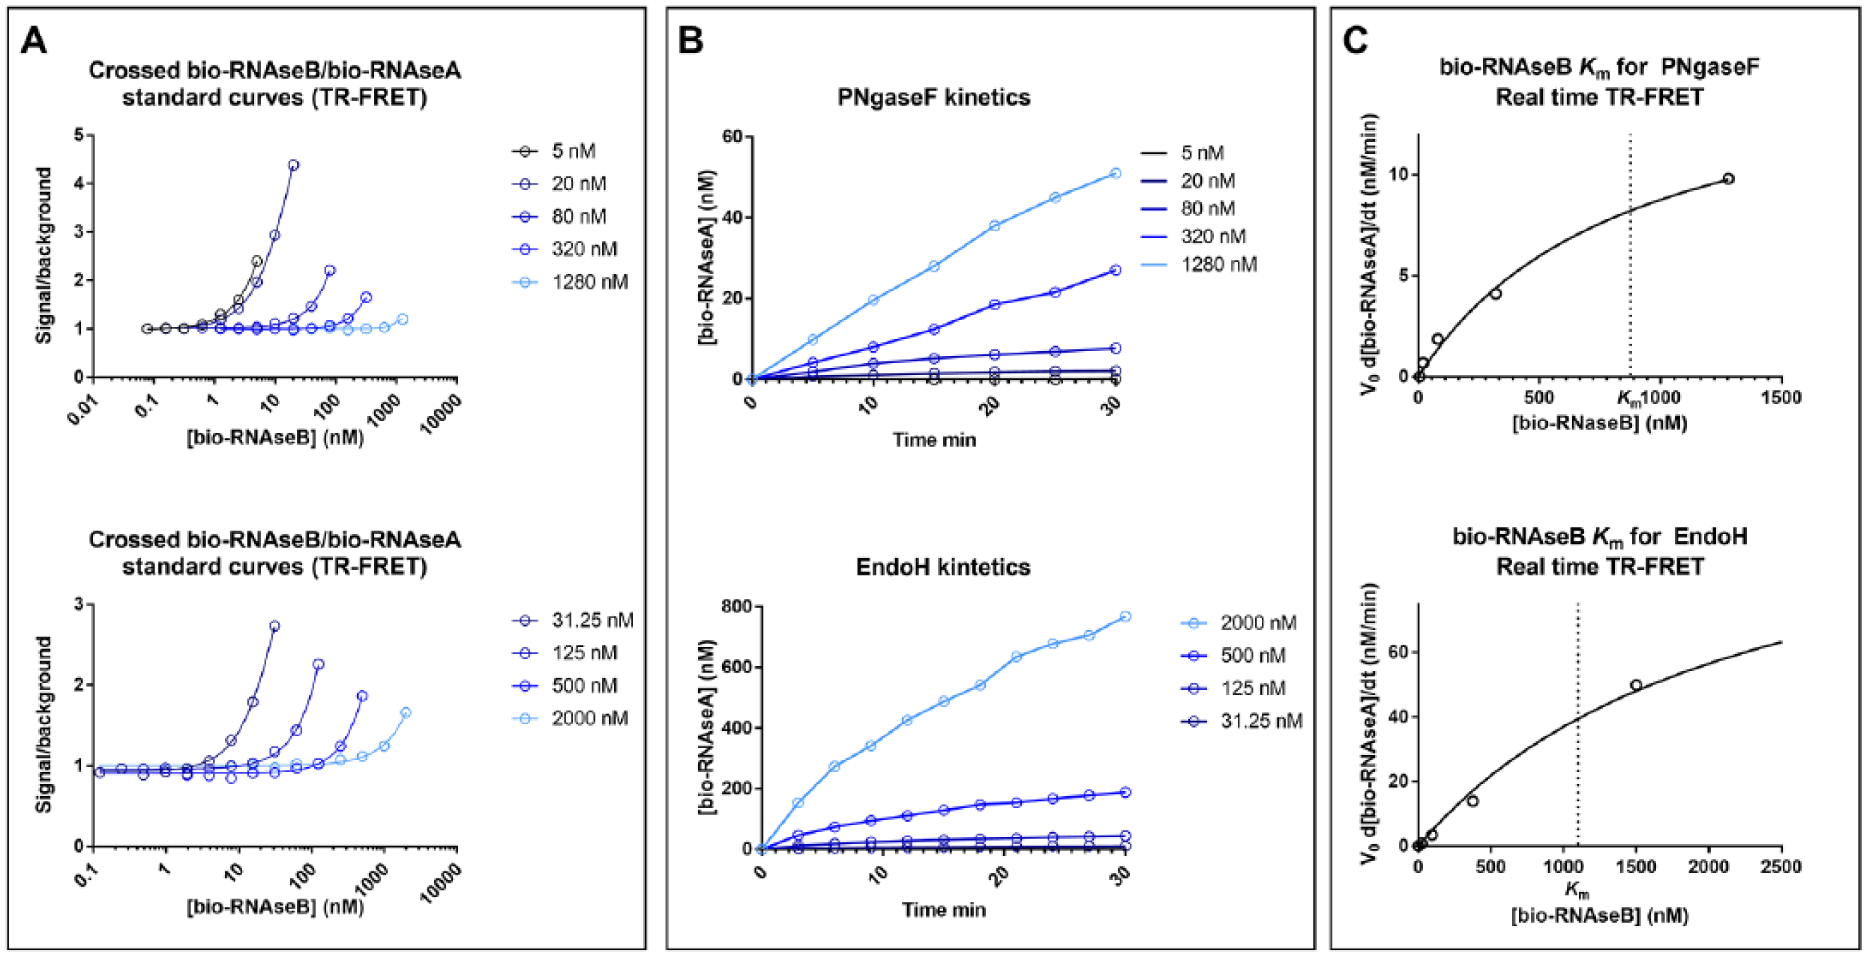
PNGaseF activity by real-time TR-FRET. (
PNGaseF Inhibitor Screening
To further optimize the TR-FRET assay for use in a pilot screening campaign, an enzyme activity time course and titration were carried out. Although this was suboptimal, the concentration of bio-RNAseB for this experiment was set to 100 nM to achieve sufficient substrate turnover and acceptable signal-to-background ratios. The PNGaseF titration time course showed that enzyme concentrations between 12 and 100 mU/µL produce a relatively linear signal increase within the first hour of incubation ( Fig. 6A ). Therefore, 100 mU/µL was chosen as the concentration of PNGaseF for the pilot screen.
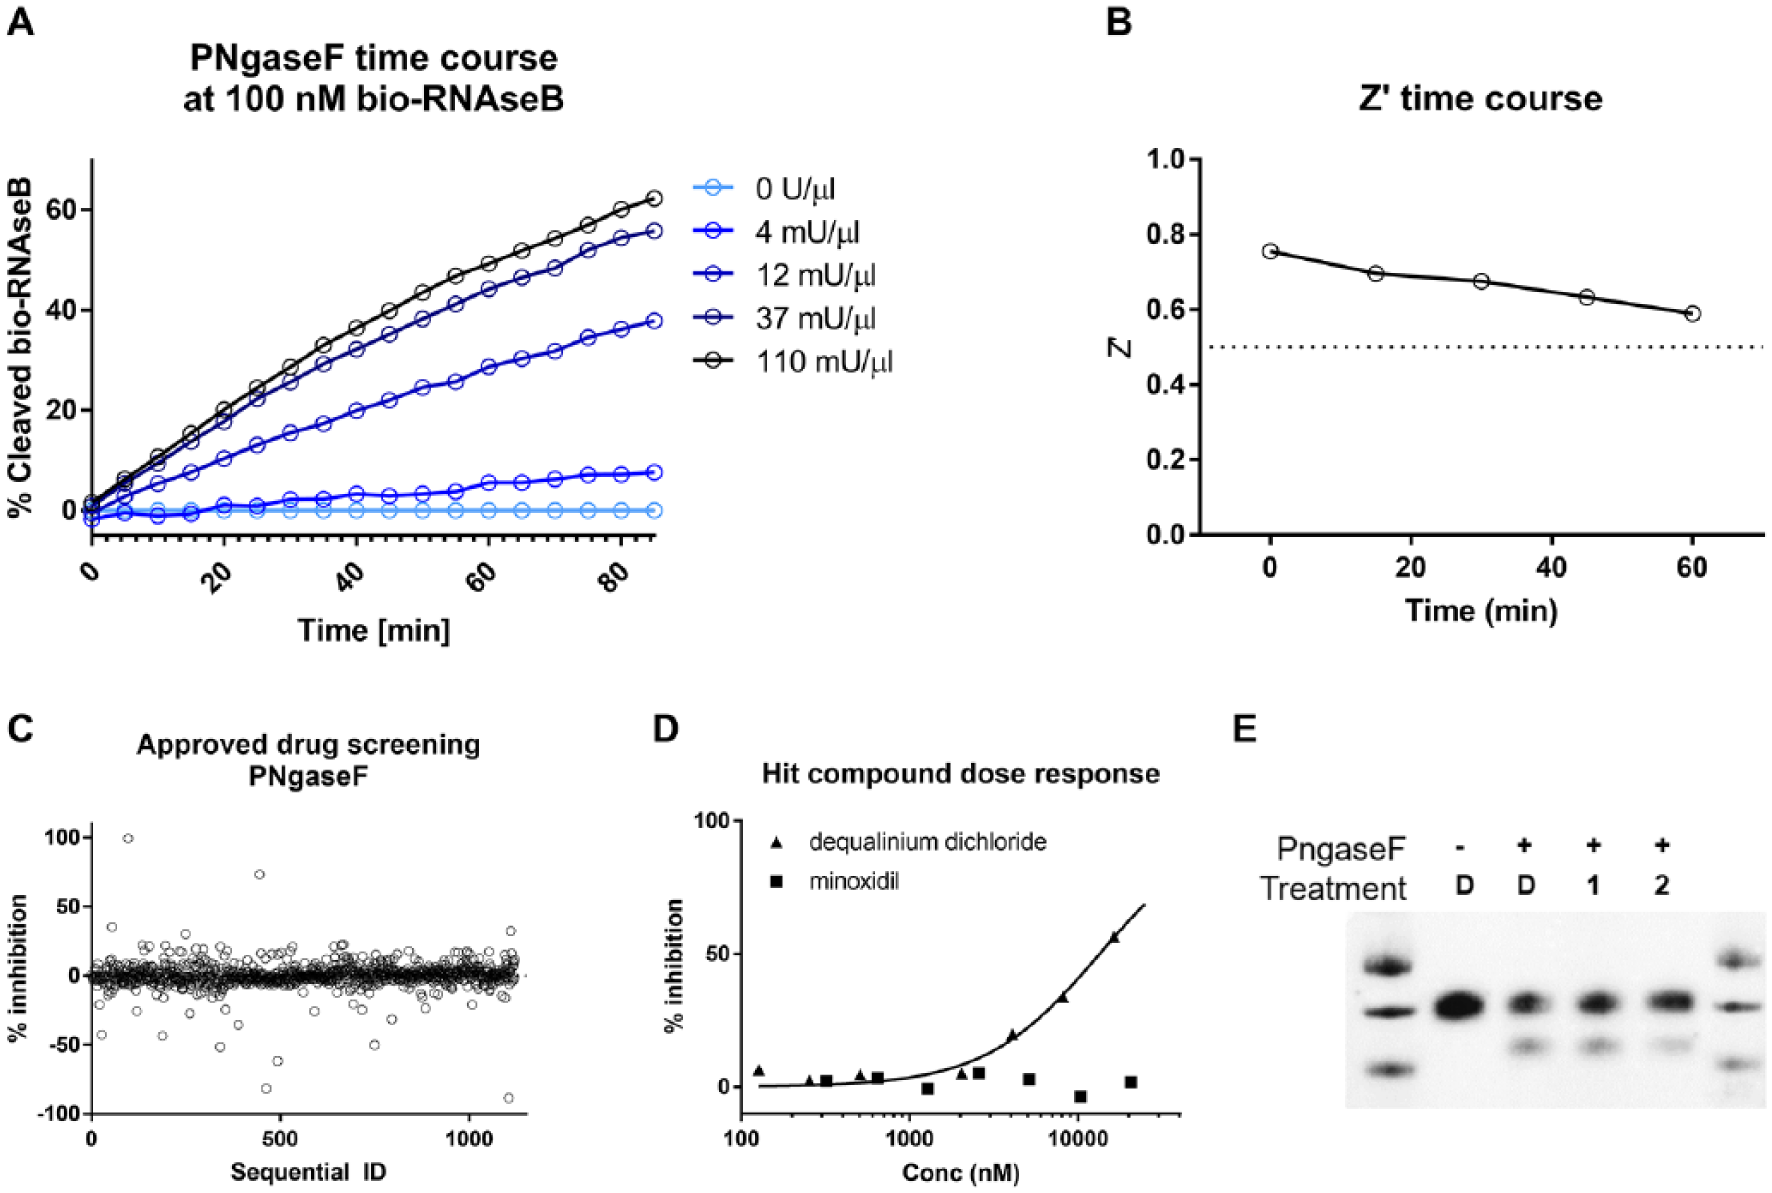
Proof-of-concept screening on PNGaseF. (
With the final assay conditions being 100 nM bio-RNAseB, 50 nM SA-Eu, 50 nM ConA-647, 100 mU/µL PNGaseF, and 1 h incubation at room temperature, the quality of the assay readout was investigated by determining the Z′ value 18 using a reaction without PNGaseF as a control. The calculated Z′ values were above the 0.5 threshold for all the time points ( Fig. 6B ). In addition, intra- and interplate variability, measured as coefficient of variation percentage (CV%), was determined to be less than 10%, demonstrating the reproducibility of the assay (data not shown).
A collection of 1120 FDA- and EMA-approved drugs (Prestwick collection) was tested at a fixed concentration of 10 µM in the PNGaseF TR-FRET assay. The average inhibition percentage was found to be −0.019%, the median was −0.39%, and the standard deviation of all samples was calculated to be 8.97% (
Fig. 6C
). Two compounds, minoxidil (compound
Discussion
The present work describes a novel, convenient assay format broadly applicable to the determination of endoglycosidase activity. To date, assays available for this purpose rely on low-throughput methods such as SDS-PAGE or mass spectrometry. 9 Here we describe a miniaturized, homogeneous, real-time TR-FRET assay that is suitable for high-throughput screening. The assay design is based on RNAseB as a substrate that bears a single glycosylated residue. A chemically biotinylated RNAseB (bio-RNAseB) is captured by SA-Eu as the fluorescence donor, while the N-linked glycan moiety on bio-RNAseB is detected by ConA-647 as the fluorescence acceptor producing a TR-FRET signal. Deglycosylase enzymes remove the glycan moiety from bio-RNAseB, thus physically separating the donor from the acceptor and lowering the TR-FRET signal. The assay is dependent on glycans that bind ConA, but the concept can be adapted to glycans that bind other lectins.
It was demonstrated that the assay can selectively recognize bio-RNAseB from bio-RNAseA, and that the recognition is similar between native bio-RNAseB and denatured bio-RNAseB, albeit with less TR-FRET efficiency. The complexity of the assay format calls for empirical determination of the optimal conditions of each component. The bio-RNAseB used in this study was determined to have an average of four biotins per RNAseB, suggesting that multiple SA-Eu can bind one RNAseB molecule. In addition, streptavidin is a tetramer with four biotin binding sites, suggesting it can bind multiple RNAseB molecules, potentially resulting in large multimeric complexes. This makes it difficult to predict what the optimal stoichiometry would be for efficient signal. An additional way to optimize the signal-to-background ratio in this assay would be to modulate the number of biotins per RNAseB by altering the ratio of the biotin to RNAseB in the labeling reaction. Given this potential complexity, it was important to demonstrate the linear relationship between the TR-FRET signal and the RNAseB/RNAseA ratio ( Fig. 3A ) to validate the suitability of the assay for accurately detecting enzyme activity.
To demonstrate the viability of the assay concept, PNGaseF from Flavobacterium meningosepticum and EndoH from Streptomyces plicatus were used as tool enzymes for assay validation. Their choice was driven by their availability as reagents rather than an interest in them as drug targets. PNGaseF activity in deglycosylating bio-RNAseB was verified by Western blot and SPR. The latter approach allowed the determination of the ConA-bio-RNAseB Kd which was found to be 1.13 ± 0.11 µM, well in agreement with literature data. 17 In addition, with the same SPR setup, the Km of bio-RNAseB for PNGaseF was calculated to be 720 ± 71 nM. To the authors’ knowledge, there are no literature data on RNAseB Km for PNGaseF from F. meningosepticum; nonetheless, the label-free nature of SPR allows the assumption that this result is free from detection biases. To determine the bio-RNAseB Km for PNGaseF by TR-FRET, each tested bio-RNAseB concentration was diluted to 10 nM prior to the addition of detection reagents rather than titrating up the concentration of the detection reagents. The Km of bio-RNAseB obtained by TR-FRET was found in line with that determined by SPR, confirming that the TR-FRET assay can accurately determine the kinetic parameters for the enzymes tested. It should be noted that the reaction was not stopped during the detection phase. Investigation into methods to stop the PNGaseF activity was not pursued due to the majority of the chemical or physical methods being incompatible with high-throughput testing and likely to have a chance of interfering with the TR-FRET detection. For these reasons, together with the requirement of a dilution step, no further development was carried out on this nonhomogeneous reaction approach.
To overcome the above-mentioned limitations, a homogenous TR-FRET readout was developed that required the endoglycosidase enzymes to be active on the SA-Eu/bio-RNAseB/ConA-647 complex. It was shown that PNGaseF is active on the complex with a Km similar to that of bio-RNAseB alone. In addition, EndoH was investigated as an alternative endoglycosidase enzyme showing that the homogeneous TR-FRET measurement is broadly applicable. The assay quality was high (Z′ > 0.5) during the screening. Two compounds were identified, one of which, dequalinium dichloride, was preliminarily confirmed by Western blot. As previously stated, the aim of the present work was not to identify inhibitors of PNGaseF, but rather to demonstrate the applicability of the assay as it was designed. Therefore, no additional efforts were put into following up the identified compound.
In conclusion, an approach to monitor endoglycosidase activity by homogeneous TR-FRET measurement was developed and optimized. The runtime of approximately 1 h, the compatibility with high-density microplates, and the homogeneous nature of the procedure make it particularly suitable for robust screening of hundreds of thousands of compounds. This represents a preferable assay format to SPR and Western blot methods, which are clearly lower throughput, or other nonhomogeneous approaches where robustness might be impaired. Finally, it should be noted that the use of ConA may not be suitable for some types of glycan and glycan-directed enzymes. Nonetheless, several other lectins are available, and the assay concept could be easily adapted and optimized for the study of deglycosylase enzymes relevant for human health.
Footnotes
Acknowledgements
The authors would like to acknowledge Matt Wilsey and Kevin Lee from the Grace Science Foundation; Rich Taylor, Matt Champion, Olaf Weist, Paul Helquist, Bruce Melancon, and Tony Serianni from the University of Notre Dame; and Adam Kallel, Dan Elbaum, and Beth Aselage from Retrophin for helpful discussions during the course of this work.
This work is dedicated to Dr. Sergio Altamura, who prematurely passed way at the age of 59. At IRBM, Sergio was that leader who feels rewarded by making things possible without asking for more. A rare person who we miss.
Author Contributions
A.B. and S.R. conceived and coordinated the study. A.B. wrote the paper. O.C. did the TR-FRET experimental work and screening. A.M. and L.T. conceived and did the SPR work. P.G.P. contributed to the interpretation of all results and preparation of the final figures. All authors reviewed the results and approved the final manuscript.
Declaration of Conflicting Interests
The authors declared the following potential conflicts of interest with respect to the research, authorship, and/or publication of this article: The authors from IRBM have no conflict of interest to report. S.R. may have an equity or other financial interest in Retrophin. There are no patents, products in development, or marketed products to declare.
Funding
The authors received no financial support for the research, authorship, and/or publication of this article.