
Abstract
ADP-ribosylation is a post-translational modification involved in the regulation of many vital cellular processes. This posttranslational modification is carried out by ADP-ribosyltransferases converting β-NAD+ into nicotinamide and a protein-linked ADP-ribosyl group or a chain of PAR. The reverse reaction, release of ADP-ribose from the acceptor molecule, is catalyzed by ADP-ribosylhydrolases. Several hydrolases contain a macrodomain fold, and activities of human macrodomain protein modules vary from reading or erasing mono- and poly-ADP-ribosylation. Macrodomains have been linked to diseases such as cancer, making them potential drug targets. Discovery of inhibitors requires robust biochemical tools mostly lacking for hydrolases, and here we describe an inhibitor screening assay against mono-ADP-ribosylhydrolyzing enzymes. The activity-based assay uses an α-NAD+, anomer of β-NAD+, which is accepted as a substrate by MacroD1, MacroD2, and ARH3 due to its resemblance to the protein-linked ADP-ribose. The amount of α-NAD+ present after hydrolysis is measured by chemically converting it on a microtiter plate to a fluorescent compound. We optimized the assay for MacroD2 and performed a proof-of-concept compound screening. Three compounds were identified as screening hits with micromolar potency. However, further characterization of the compounds identified them as protein destabilizers, excluding further follow-up studies. Validation and screening demonstrated the usability of the in vitro assay for MacroD2, and we also demonstrate the applicability of the assay as a tool for other human ADP-ribosylhydrolases.
Introduction
NAD+-dependent protein ADP-ribosylation is a reversible post-translational modification carried out mainly by ADP-ribosyltransferases (PARPs/ARTDs), attaching mono-ADP-ribose (MAR) or poly-ADP-ribose (PAR) to the target proteins, DNA or RNA. 1 -4 The modification is used to regulate vital cellular processes, for instance, DNA repair, cell signaling, and transcription. The ADP-ribosylation is read and/or erased mainly by Nudix hydrolases, macrodomains, and ADP-ribosylhydrolases (ARHs). 5,6 In humans, there are 16 macrodomains, which are structurally conserved protein modules. However, they have distinct functions relating to ADP-ribosylation. Some of the macrodomains bind and some also hydrolyze MAR/PAR. 6,7 MacroD1 and MacroD2 act as erasers of MAR. In addition to MAR, they hydrolyze metabolites produced independently of ARTD activity, for instance, O-acetyl-ADP-ribose generated by sirtuin family proteins. 6,8 Both enzymes and the other human macrodomains are strongly associated with human cancers where they are typically overexpressed. For example, in pancreatic cancer, the upregulation of MacroD1 promotes proliferation, migration, and invasion of cancer cells 9 and overexpression of MacroD2 mediates estrogen-independent growth and tamoxifen resistance in breast cancer. 10 MacroD2 also controls DNA repair signaling mediated by ARTD1/PARP1 as loss of MacroD2 has been seen to cause impairment of ARTD1/PARP1 activity leading to DNA repair deficiency of colorectal cancer cells. 11
In addition to MacroD1 and MacroD2, ARH1 and ARH3 from the family of ARHs hydrolyze O-acetyl-ADP-ribose. Moreover, ARH1 and ARH3 also erase ADP-ribosylation, but the activity of ARH1 is very weak (1%) compared with ARH3. ARH3 is a main eraser removing serine-linked ADP-ribose. 12 The family also contains ARH2, which binds ADP-ribose but is not shown to be enzymatically active. 13,14 ARH1 and ARH3 have different roles in cells where ARH1 is involved in tumorigenesis and activities of bacterial toxins, whereas ARH3 contributes to the apoptosis pathway, called parthanatos, by degrading the PAR produced by ARTD1/PARP1 in response to oxidative stress-induced DNA damage. 15,16
Due to their roles as hydrolases, macrodomains and ARHs have been implicated as potential drug targets against cancer. To date, the inhibitors discovered for poly(ADP-ribose) glycohydrolase (PARG) and MacroD1 have indeed provided important information about the roles of the enzymes and also their potencies as drug targets. The recent inhibitor of PARG sensitizes cancer cells to radiation-induced DNA damage and stalls the replication fork hindering cancer cell survival.
17
In the case of MacroD1, the inhibitor (MRS2578) blocks MacroD1 interaction with the RNA-dependent kinase (PKR) that eventually sensitizes cancer cells to DNA damage.
18
These discoveries demonstrate well the growing need of small-molecule compounds selectively inhibiting readers and erasers of ADP-ribosylation. However, no potent inhibitors are available for many human macrodomains and ARHs. One reason is a lack of inhibitor screening assays allowing identification of early hit compounds. In this paper, we describe a fluorescence-based homogenous assay to screen for inhibitors against MAR hydrolases. The assay utilizes α-NAD+, which mimics protein ADP-ribosylation due to the anomerization of β-NAD+. Indeed, several macrodomains have recently been shown to be able to hydrolyze α-NAD+,
19
and despite that this does not measure removal of the ADP-ribosyl group from a protein, it provides a way to measure the hydrolysis activity of a substrate analogous to it. After enzymatic reaction, α-NAD+ is chemically converted to a fluorophore for quantification (
Materials and Methods
Expression Constructs, Protein Expression, and Purification
MacroD1 (residues 58–325), MacroD2 (residues 7–243), PARP2, and TARG1 constructs were previously cloned in pNH-TrxT vector and proteins were produced and purified using established protocols. 20,21
The cDNA of full-length PARG was purchased from Source BioScience (Nottingham, UK) and the catalytic domain of PARG (residues 448–976) was also cloned into pNH-TrxT vector. PARG was expressed and purified as described earlier for other macrodomains. 21 Briefly, PARG construct was expressed in Escherichia coli Rosetta 2 (DE3) cells using terrific broth (TB) autoinduction media containing 8 g/L glycerol, 100 μg/mL kanamycin, and 37 μg/mL chloramphenicol. Cell suspension was supplemented by adding 0.1 mg/mL lysozyme, 0.02 mg/mL DNAase, and 0.1 mM pefabloc (protease inhibitor) (Sigma-Aldrich, St. Louis, MO). Cells were further lysed by sonication and the lysate was collected by centrifugation. The supernatant was filtered using a 0.45 µm filter and loaded onto a 5 mL HisTrap HP nickel-nitrilotriacetic acid (Ni-NTA) column (GE Healthcare, Chicago, IL, USA). The column was washed with lysis buffer, followed by wash buffer containing 25 mM imidazole, and protein was eluted by increasing the imidazole concentration to 300 mM in the buffer. TrxT tag was cleaved by using TEV protease at +4 °C overnight followed by a reverse-Ni-affinity chromatography. The protein was finally purified with size exclusion chromatography using a 16/600 Superdex 75 (GE Healthcare) preequilibrated column with 50 mM HEPES, pH 7.5, 300 mM NaCl, 10% glycerol, and 0.5 mM TCEP and flash frozen in small aliquots in liquid N2 at –70 °C.
Linear, double-stranded DNA fragments (gBlocks) of full-length ARH1 and ARH2 were purchased from Integrated DNA Technologies (IDT). The gBlocks contained 5′ and 3′ overhangs for sequence- and ligation-independent cloning (SLIC), which was used to clone the constructs in pNIC-Bsa4. pET30-ARH3-His-Sumo-HA was a gift from Thomas Muir (Addgene plasmid no. 11578). 22
ARHs constructs were expressed in E. coli BL21 (DE3) cells using TB autoinduction media containing 8 g/L glycerol and 50 μg/mL kanamycin. The cells were allowed to grow at 37 °C until the optical density at 600 nm (OD600) reached 1 and the temperature was reduced to 18 or 15 °C in the case of ARH3. The cells were collected by centrifugation and suspended in lysis buffer containing 50 mM HEPES, pH 7.5, 10 mM MgCl2, 300 mM NaCl, 10% glycerol, 10 mM imidazole, 0.5 mM TCEP, 20 μg/mL DNase, and 0.1 mM Pefabloc, and stored at –20 °C. The cells were lysed by sonication and the lysate was cleared by centrifugation. The supernatant was filtered using a 0.45 µm filter and loaded onto a 5 mL HiTrap Chelating HP column (GE Healthcare) precharged with Ni. The column was washed with lysis buffer, followed by wash buffer containing 25 mM imidazole. A His-Sumo tag from ARH3 was cleaved by using Senp2 protease at +4 °C overnight followed by a reverse-Ni-affinity chromatography. His-tags in ARH1 and ARH2 were resistant to cleavage by TEV protease at +4 °C overnight, and they were further purified by eluting from the second Ni-affinity column stepwise with increasing imidazole concentration between 40 and 250 mM. The purest protein fractions were finally purified with size exclusion chromatography using a 16/600 Superdex 75 column preequilibrated with 30 mM HEPES, pH 7.5, 10 mM MgCl2, 300 mM NaCl, 10% glycerol, and 0.5 mM TCEP and flash frozen in small aliquots in liquid N2 at –70 °C. The purity of the used proteins and thermal melting curves are shown in
The AF1521 macrodomain was produced for detection of poly(ADP-ribose) hydrolysis. Expression was carried out in BL21(DE3) cells in TB autoinduction media containing 8 g/L glycerol at 18 °C. The cells were harvested by centrifugation and suspended in lysis buffer containing 50 mM HEPES, pH 7.5, 500 mM NaCl, 10% glycerol, 10 mM imidazole, 0.5 mM TCEP, and 0.1 mM Pefabloc. Cell lysis was done by sonication and the lysate was cleared by centrifugation. The supernatant was loaded onto a 5 mL HiTrap Chelating HP column (GE Healthcare) precharged with Ni. The column was first washed with lysis buffer and then with wash buffer containing 25 mM imidazole. Protein was then eluted with buffer containing 300 mM imidazole. Eluted sample was further purified using a GST-Trap column (GE Healthcare), washed using the same buffer, and eluted in 50 mM Tris, pH 8.0, 200 mM NaCl, 0.5 mM TCEP, and 10 mM reduced gluthatione. Sample was dialyzed against 30 mM HEPES, pH 7.5, 350 mM NaCl, 10% glycerol, and 0.5 mM TCEP and stored at –70 °C.
Poly(ADP-Ribose) Hydrolysis Assays
PARG, TARG1, ARH1, and ARH3 hydrolytic activities were tested against PAR from automodified PARP2. For these assays, 7.6 µM PARP2 was incubated with 1 mM NAD+ and activating oligo DNA for 2 h at room temperature in 50 mM Tris, pH 8.0, and 5 mM MgCl2. The reaction was stopped by addition of SDS buffer and analyzed by sodium dodecyl sulfate–polyacrylamide gel electrophoresis (SDS-PAGE). Hydrolytic activity was assessed by visually comparing the control with active PARP2 (formation of a smear in SDS-PAGE) and its removal to restore the appearance of nonmodified PARP2. PARG, TARG1, ARH1, and ARH3 were added at the beginning of the reaction and the result analyzed with SDS-PAGE (
Activity Assay Development
α-NAD+ hydrolysis reactions were initially performed using black polypropylene U-shaped 96-well plates (Bio-One, Kremsmünster, Austria). The total volume of the reaction was 50 µL, and the reaction consisted of 100 nM macrodomain and 500 nM α-NAD+ in a buffer containing 25 mM HEPES, pH 7.5, 100 mM NaCl, and 1 mg/mL bovine serum albumin (BSA). The plate was sealed and incubated at 25 °C with constant shaking at 300 rpm on a Biosan PST-60 HL plus thermo shaker (Biosan, Riga, LV). After the incubation, the remaining α-NAD+ was chemically modified to a fluorophore by adding 20 µL of 20% (v/v) acetophenone in absolute ethanol and 20 µL of 2 M KOH followed by incubation at room temperature for 10 min. Next, 90 µL of 100% formic acid was added and the plate was incubated again at room temperature for 20 min. The fluorescent signal was measured with a Tecan Infinite M1000 pro plate reader using excitation at 372 nm and emission at 444 nm. The fluorescence spectra are very similar to the spectra reported for the fluorophore generated from β-NAD+ (
Assay Optimization
The assay was optimized for MacroD2 and the optimization parameters included incubation time and concentrations of BSA and α-NAD+. We first optimized the incubation time for the hydrolysis of α-NAD+ by testing different times from 3 min to 6 h. Next, we optimized the BSA concentration in the assay buffer. The following BSA concentrations were used in the test: 1, 0.9, 0.75, 0.6, 0.4, 0.25, and 0.1 mg/mL. The α-NAD+ concentration was optimized by performing the hydrolysis using 0.5, 1, 2, 4, 6, 8, and 10 µM α-NAD+. Finally, the DMSO tolerance of the assay was tested using 5, 3, 2, 1, 0.8, 0.4, and 0.1% DMSO concentrations.
The assay was validated on 96-well plates by measuring the repeatability of the maximal and minimal signals between different wells, plates, and days. In total, five plates were prepared, each of them containing 40 maximal and minimal signal points and 10 blank wells. For 384-well plates, 5 control plates were prepared containing 176 maximal and minimal signal points and 32 blank wells. These data points were used separately for both maximal and minimal signals to calculate well-to-well, plate-to-plate, and day-to-day mean signal, standard deviation, and coefficients of variation (CVs). Three of the plates were measured on the first day, one plate was measured on the second day, and the final plate was measured on the third day. The overall quality of the assay was determined with common statistical parameters: signal-to-background (S/B), signal-to-noise (S/N), and screening window coefficient (Z′). 23,24
Screening of Compounds
In total, 1108 compounds of the Tocriscreen Mini (Tocris Bioscience) were screened against MacroD2. Each compound was screened in duplicate at a single concentration of 10 µM. The compounds (0.01 µL) were supplied on the 384-well plates (Greiner, BioOne) by the Institute for Molecular Medicine, Finland (FIMM) using the Echo acoustic liquid dispenser (Labcyte, Sunnyvale, CA). Four microliters of MacroD2 (final concentration, 0.1 µM) and 5 µL of α-NAD+ (final concentration, 0.5 µM) were added to each plate in assay buffer (25 mM HEPES, pH 7.5, 100 mM NaCl, and 1 mg/mL BSA) and incubated for 3 h at room temperature, followed by an addition of 4 µL of 20% (v/v) acetophenone in absolute ethanol and 4 µL of 2 M KOH. After that, the plate was incubated at room temperature for 10 min followed by the addition of 18 µL of 100% formic acid. Finally, the plate was incubated at room temperature for 20 min and measured with a Tecan Infinite M1000 pro plate reader. Each plate contained blank wells (assay buffer only), a positive control (assay buffer with α-NAD+), and a negative control (assay buffer with α-NAD+ and MacroD2). The positive and negative controls were used to calculate the overall conversion. Compounds with 60% inhibition, corresponding to 3σ from the mean, to the activity of MacroD2 were considered as hit compounds. In order to assess the precision of the assay, a Pearson correlation was determined by plotting the percent inhibition produced by each of the two compound replicates. The hit compounds obtained from the primary screening were rescreened in quadruplicate at concentrations of 1 and 10 µM. In order to detect the possible fluorescence signal produced by a hit compound, compound controls (no MacroD2 present) were included in this secondary screening.
Potency Measurements
The dose–response curves were measured three times in quadruplicate from 100 to 0.003 µM using half-log dilutions. The compounds and macrodomains were diluted with the assay buffer (25 mM HEPES, pH 7.5, 100 mM NaCl, and 1 mg/mL BSA). One microliter of compound was manually transferred to the assay plate, followed by the addition of 4 µL of macrodomain (final concentration, 0.1 µM) and 5 µL of α-NAD+ (final concentration, 0.5 µM) using the Mantis microfluidic liquid handler (Formulatrix). The plate was incubated for 1 h at room temperature before the chemical reaction was performed. The dose–response curves were fitted using a nonlinear regression analysis with GraphPad Prism version 5.04 for Windows (GraphPad Software, La Jolla, CA, USA).
AlphaScreen Assay
An AlphaScreen assay for MAR hydrolyzing macrodomains was used as an orthogonal assay to determine the IC50 values of the hit compounds. 21 The assay is measuring hydrolysis of serine/threonine-protein kinase 2 (SRPK2) kinase-linked biotinylated ADPr. The compounds and proteins were diluted with the assay buffer (25 mM HEPES, pH 7.5, 100 mM NaCl, and 1 mg/mL BSA). The compounds were measured in quadruplicate with half-logarithmic dilutions from 320 to 3.2 nM and were transferred to the 384-well AlphaScreen plate (PerkinElmer). Then 7.5 µL of MacroD1 (final concentration, 800 nM) or MacroD2 (final concentration, 400 nM) and 7.5 µL of biotin mono-ADP-ribosyl-SRPK2 (final concentration, 50 nM) were added to the assay plate and incubated for 80 min at room temperature. After that, 10 µL of Ni chelate acceptor and streptavidin donor bead mixture (final concentration, 5 µg/mL) were added to the assay plate. The plate was incubated at room temperature for 3 h in the dark. Luminescence was read with a Tecan Infinite M1000 Pro plate reader using the AlphaScreen detection module. The dose–response curves were fitted using a four-parameter nonlinear regression analysis with GraphPad Prism version 5.04 for Windows.
Differential Scanning Fluorimetry
To study direct binding of the hit molecules to MacroD1 and MacroD2, we used differential scanning fluorimetry (DSF). All the samples were prepared with the buffer (25 mM HEPES, pH 7.5, and 150 mM NaCl) and the sample volumes were 30 µL containing 0.3 mg/mL macrodomain, 100 µM compound, and 5× SYPRO Orange dye (Thermo Fisher Scientific, Waltham, MA, USA). The melting curves for macrodomains were measured using an Applied Biosystems 7500 Real Time PCR system (Thermo Fisher Scientific) with the temperature range from 20 to 90 °C with a 1 °C increment per minute. The GraphPad Prism software (version 5.04 for Windows) was used to fit the melting curves.
Isothermal Titration Calorimetry
In order to measure affinities with isothermal titration calorimetry (ITC), MacroD1 and MacroD2 were first dialyzed in buffer (50 mM HEPES, pH 7.5, 250 mM NaCl, and 0.5 mM TCEP) at +4 °C with constant stirring overnight. Protein (40 μM) and compounds (500 μM) were prepared in dialysis buffer for each reaction. For later experiments, the compound concentration was reduced to 100 µM to eliminate compound precipitation. Binding experiments were carried out on a MicroCal iTC 200 instrument (GE Healthcare). All titration experiments were performed in dialysis buffer at 25 °C, 11.4 μCal/s reference power, and 500 rpm stirring speed. Each titration volume was 2.4 μL, followed by 17 identical cycles with a duration of 4.8 s between each titration and 180 s between injections to allow the baseline to stabilize.
Mass Spectrometry
For the mass spectrometric characterization, the hit compounds were diluted from 10 mM stocks in 100% DMSO to concentrations of 10 and 100 µM with three solutions: 50% (v/v) aqueous acetonitrile, 50% (v/v) aqueous methanol, and 10 mM ammonium acetate in water. The samples were ionized in the presence and absence of 1% (v/v) formic acid with direct infusion using electrospray ionization (ESI) in the positive mode. The ions were detected with a Thermo Orbitrap Fusion Lumos Tribrid.
Results
Optimization of the Activity Assay
The assay conditions, including time for incubation and concentrations of the reaction components affecting enzyme activity, were optimized. It is important to note that the α-NAD+ concentration significantly affected the substrate conversion percentage, which determines the signal window. At a 0.5 µM concentration, 70% conversion was achieved, while a higher substrate concentration reduced conversion and limited usability of the assay (e.g., 20% at 10 µM substrate; Fig. 1A ). ADPr produced from α-NAD+ acts as an inhibitor for the macrodomain since the ADPr K D values for MacroD1 and MacroD2 are reported to be 0.9 and 0.15 µM, respectively. 25 Hence, due to the product inhibition, it is essential for a robust screening assay to use a low substrate concentration.
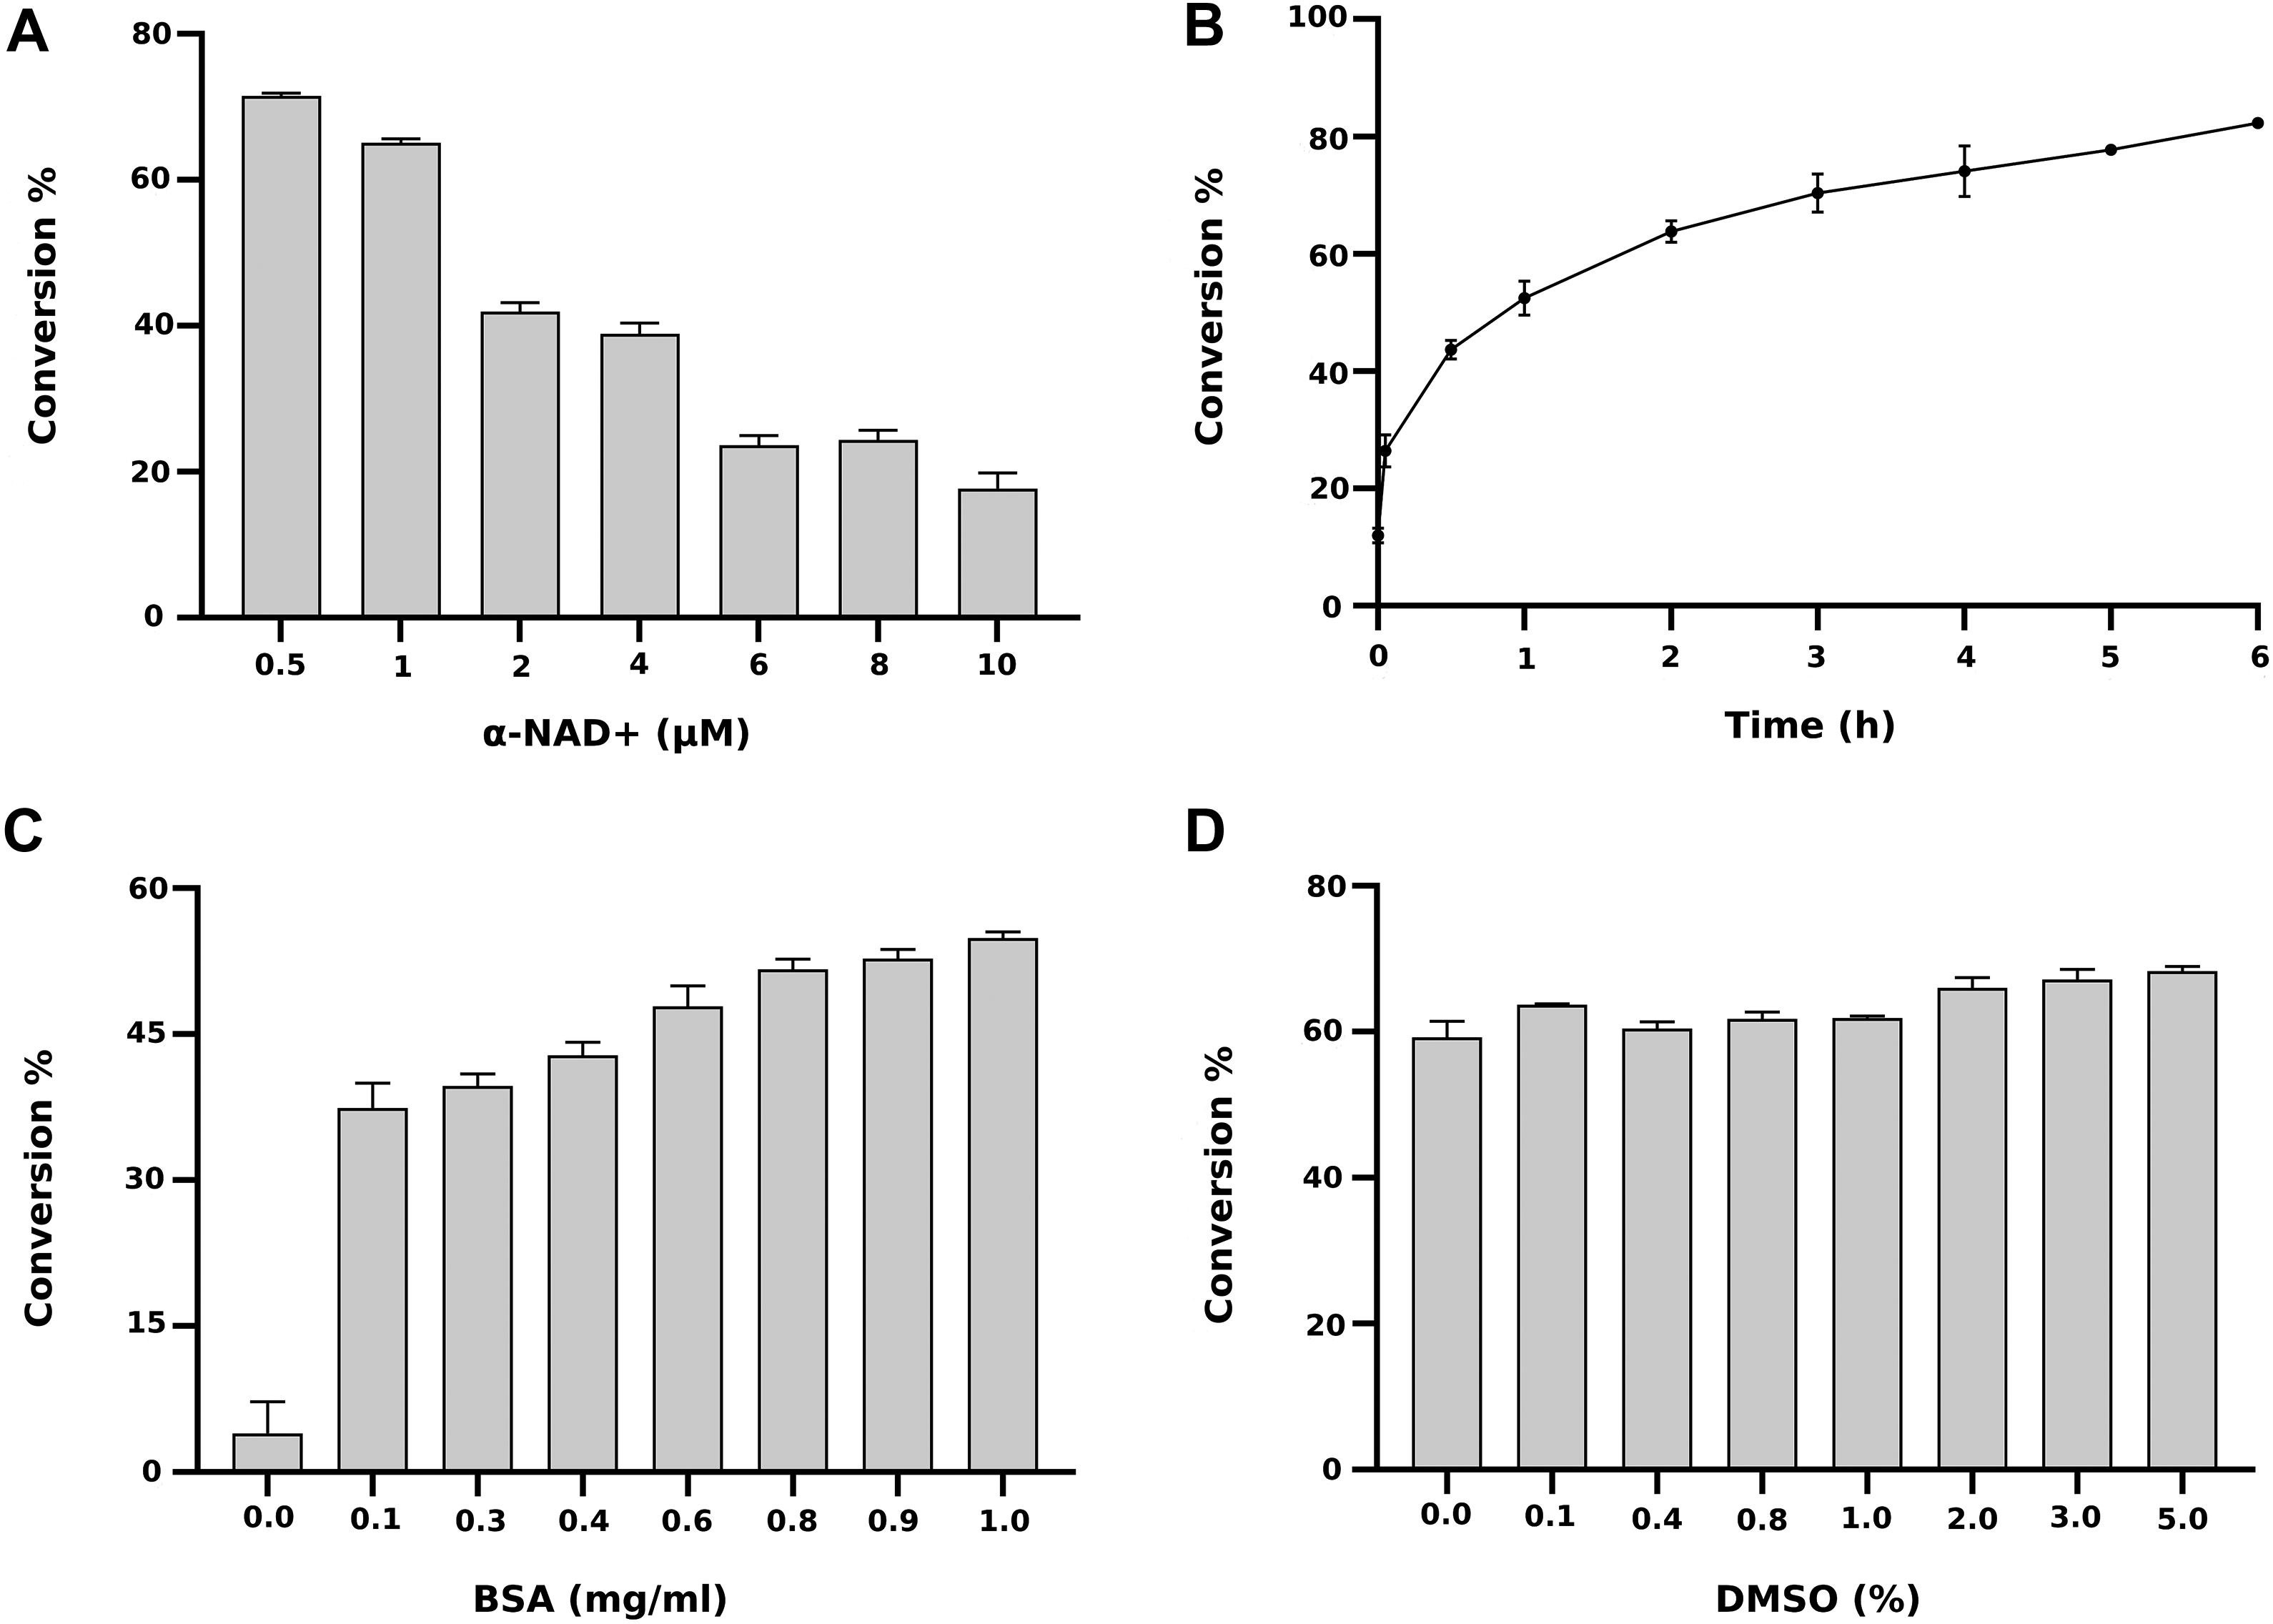
Optimization of the assay conditions for MacroD2. (
The enzyme activity was measured with 500 nM α-NAD+ at different time points with a range from 6 to 0.05 h, and we selected a 3 h incubation time for MacroD2 as it gave a 70% substrate conversion ( Fig. 1B ), which will result in a robust assay based on our previous experiments with PARP/ARTD enzymes. 26 BSA was included in the previous AlphaScreen activity assay we developed, and we next optimized its concentration for the fluorescence assay. 21 Increased BSA concentration increased MacroD2 activity, and BSA was shown to be essential for stable activity. A concentration of 1 mg/mL was selected to be used in further experiments ( Fig. 1C ). Small-molecule compounds are typically dissolved in DMSO in the libraries, and DMSO may affect the enzymatic activity. We tested concentrations up to 5% DMSO, and it did not significantly affect substrate conversion, making the assay readily suitable for compound screening ( Fig. 1D ).
Assay Performance
Assay quality was validated for screening by testing changes in plate-to-plate and day-to-day maximal and minimal signals over five different plates. The assay was first run and evaluated using manual pipetting on 96-well plates, and it showed robust statistics with acceptable S/B and S/N values, as well as a Z′ of 0.7, indicating a good screening assay (
Assay Performance.
a Calculated from Z′ values.
Validatory Screening
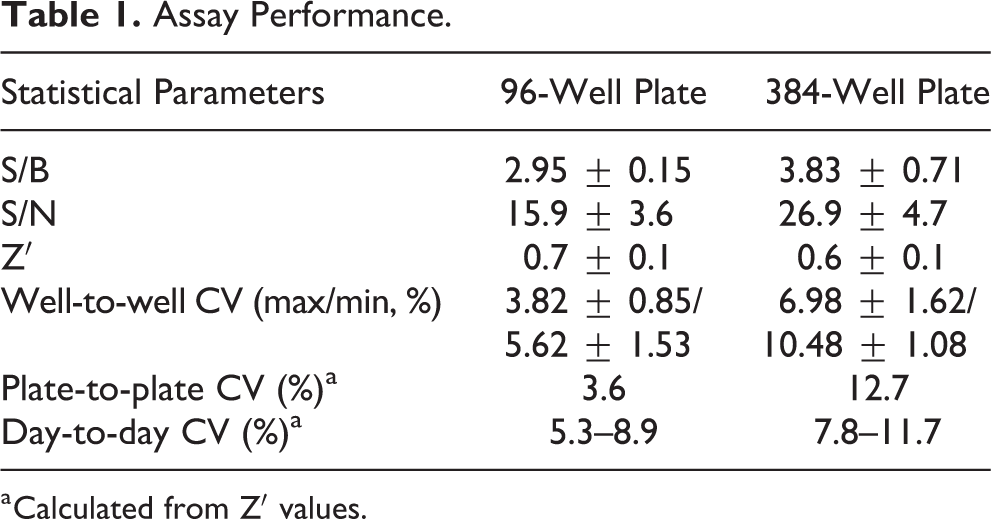
In order to test the assay capability in compound screening, we used the assay to screen the Tocriscreen Mini library in 384-well format. Twenty-three compounds showed higher fluorescence compared with the control, and after removing these false positives, 20 compounds were identified as initial hits for MacroD2 using a 60% hit limit ( Fig. 2A ). Overall, the assay performance was good in the screening with an average Z′ of 0.78 over controls on seven plates. The screening was carried out in duplicates located on different halves of the plate, and the Pearson correlation coefficient (r 2 ) was 0.89, confirming a good accuracy of the assay, while a few outliers could be identified in one or the other set. Almost the same set of hit compounds would have become hits even if the duplicates were treated independently ( Fig. 2B ).
Screening of TocrisScreen Mini library with MacroD2 at 10 µM concentration. (
Next, we carried out a secondary screening for 20 hit compounds at 1 and 10 µM concentrations and found that 16 out of 20 compounds produced fluorescence with the used wavelengths. The inherent fluorescence mimics inhibition (resulting in a 1.4% false hit rate) and can be controlled in the primary screen by using separate wells containing NAD+ and compound but no enzyme. Four compounds inhibited the enzymatic activity of MacroD2 more than 60% at a 10 µM concentration, and three of them inhibited the enzymatic activity more than 27% at a 1 µM concentration. These compounds were NSC 95397 (2,3-bis[(2-hydroxyethyl)thiol]-1,4-naphthoquinone), BI-78D3 (4-(2,3-dihydro-1,4-benzodioxin-6-yl)-2,4-dihydro-5-[(5-nitro-2-thiazolyl)thio]-3H-1,2,4-triazol-3-one), and BAY 11-7085 ((2E)-3-[[4-(1,1-dimethylethyl)phenyl]sulfonyl]-2 propenenitrile).
Concentration–Response Measurements
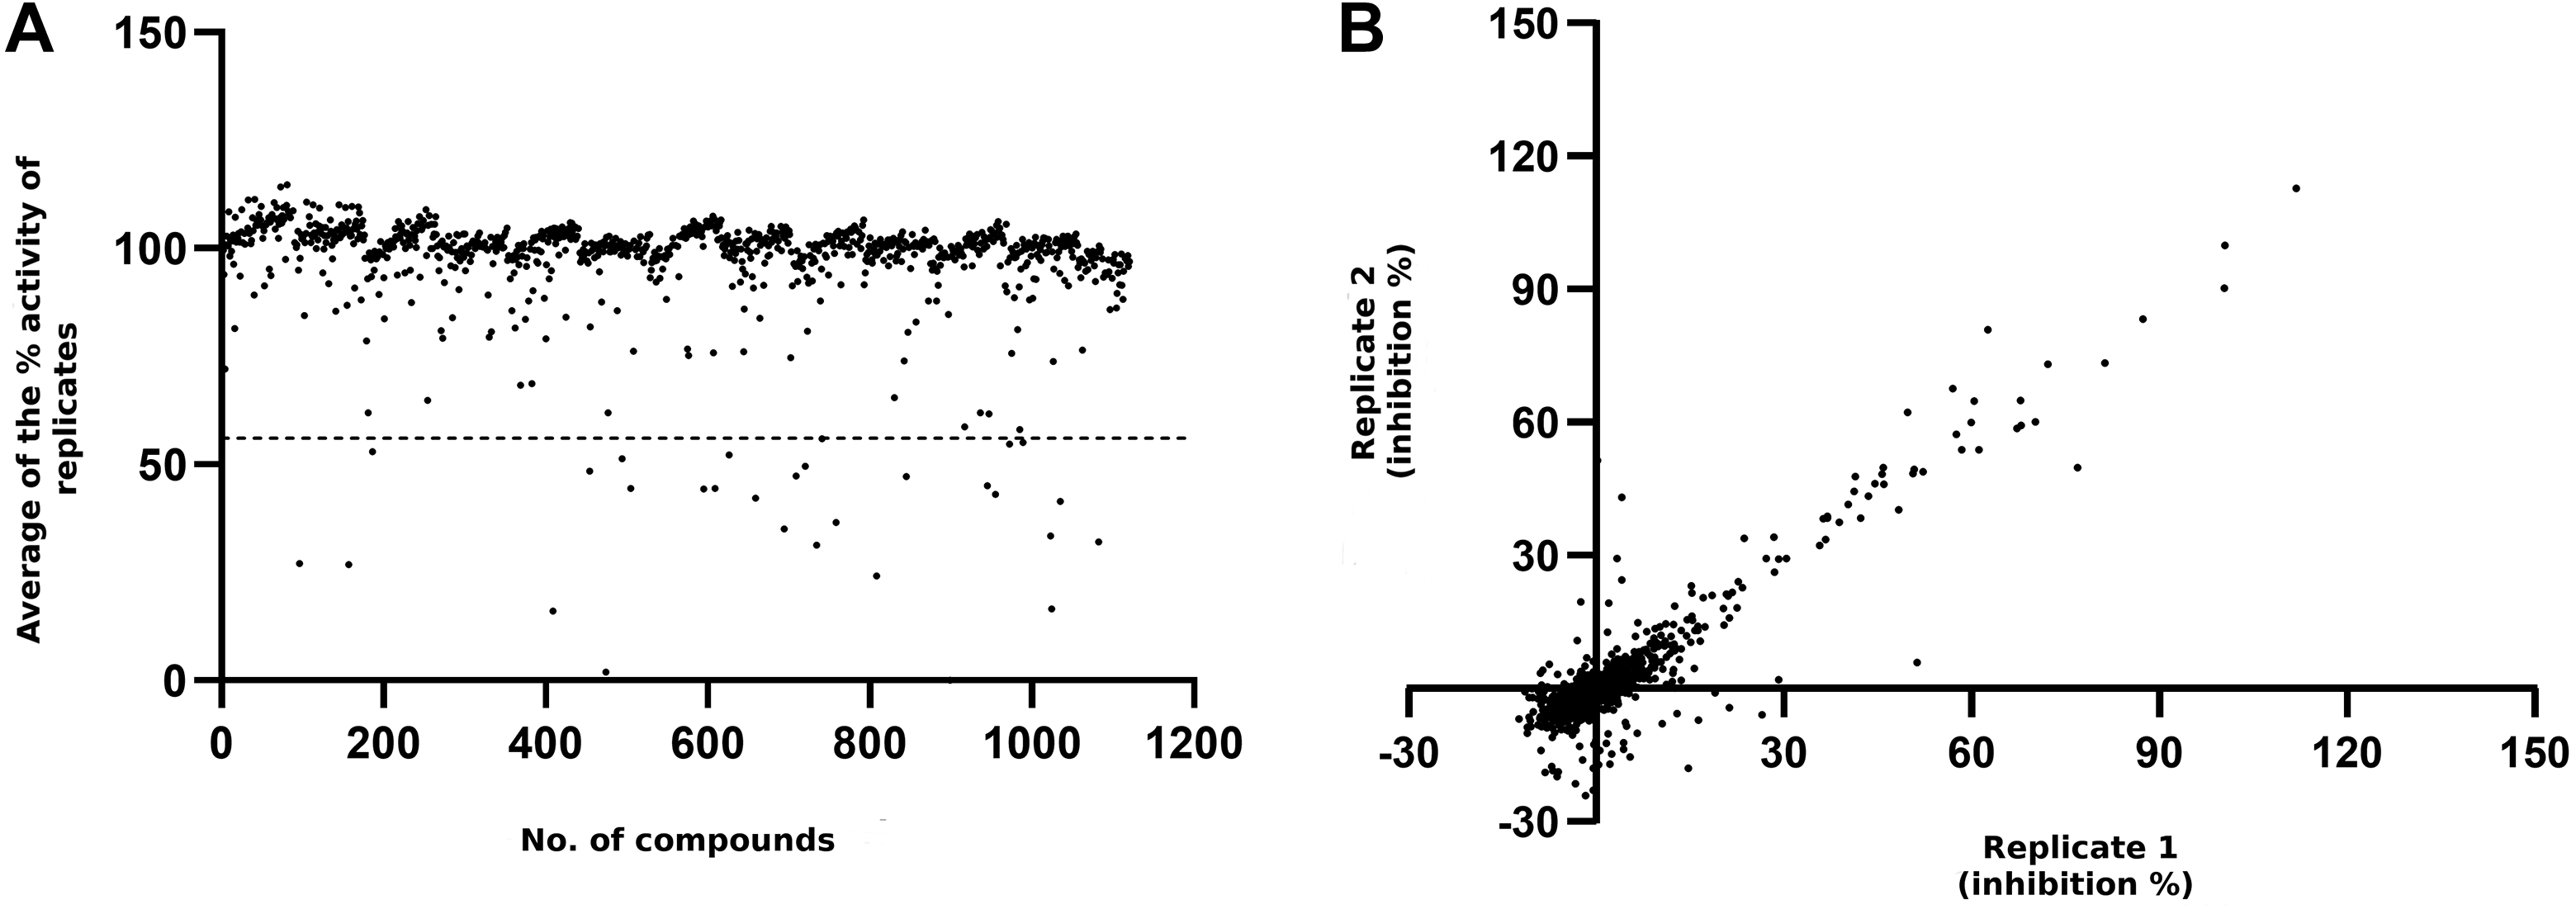
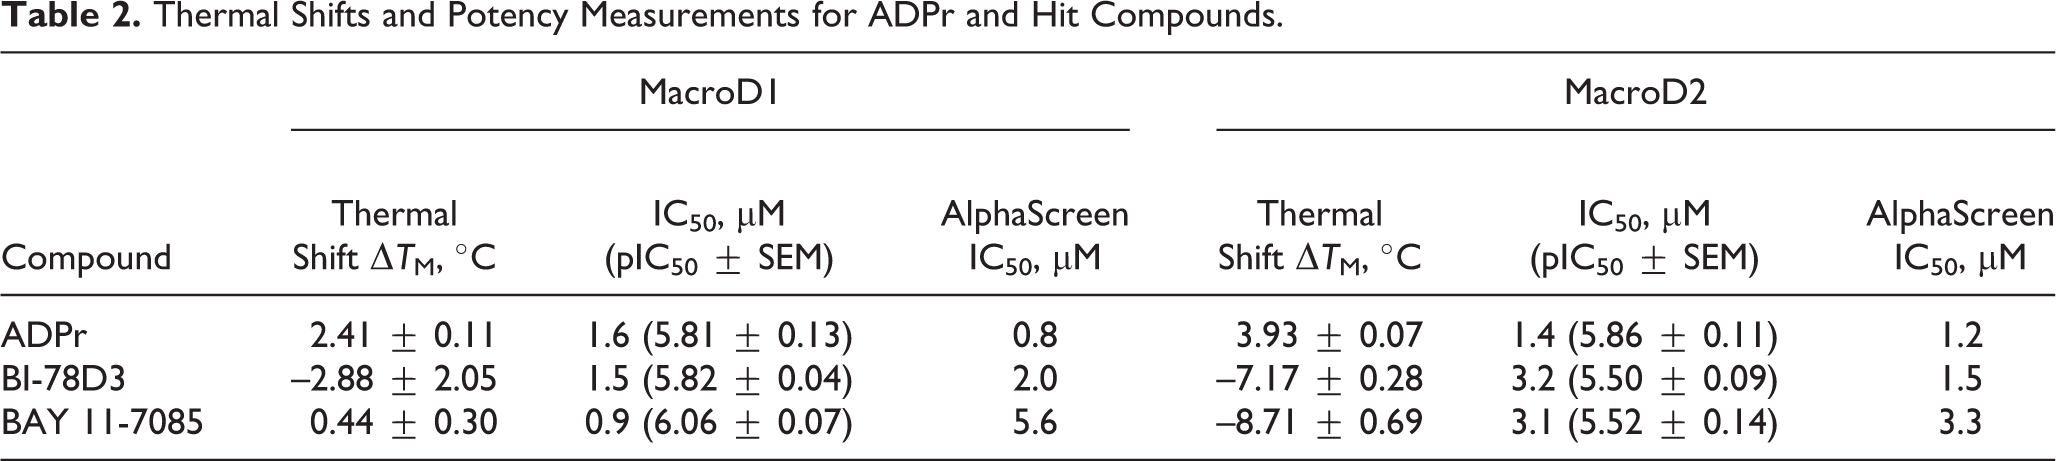
Concentration–response measurements could be carried out for two of the three hit compounds as NSC 95397 precipitated in the assay buffer. No further experiments were carried out with the compound, and we performed IC50 measurements for BI-78D3 and BAY 11-7085. Based on the average of three measurements, the IC50 values of BI-78D3 for MacroD1 and MacroD2 were 1.5 and 3.2 µM, respectively. BAY 11-7085 was slightly more potent, having 0.9 and 3.1 µM IC50 values for MacroD1 and MacroD2, respectively. In addition, we also carried out the measurement for ADPr as a control and the IC50 values of ADPr for MacroD1 and MacroD2 were 1.6 and 1.4 µM, respectively (
Fig. 3
,
Table 2
). The results for all the individual potency measurements of the compounds with MacroD1 and MacroD2 are shown in the supplementary information (
Measurements of half-maximal inhibitory concentrations of the inhibitors. Dose–response curves for the inhibitors (
Thermal Shifts and Potency Measurements for ADPr and Hit Compounds.
Orthogonal Assays and Compound Characterization
In a thermal shift assay, we measured the melting curves for MacroD1 and MacroD2 in the absence and presence of BI-78D3, BAY 11-7085, and ADPr (
Assay for Other ARHs
While we focused our efforts on MacroD2 in the validatory screening, we also tested the applicability of the α-NAD+ hydrolysis reaction with a range of human enzymes reported as ADP-ribosyl hydrolases. In addition to MacroD1 and MacroD2, the known macrodomain-containing ARHs TARG1 and PARG were active in the assay ( Fig. 4 ). Their activity is lower than that of MacroD1 and MacroD2, indicating that the assay conditions used would not be optimal for these enzymes and would require further optimization. ARH family enzymes (ARH1, ARH2, and ARH3) were also tested for α-NAD+ hydrolysis. Consistent with the literature, only ARH3 showed robust activity in the assay at the same level as MacroD1 and MacroD2 ( Fig. 4 ). 19
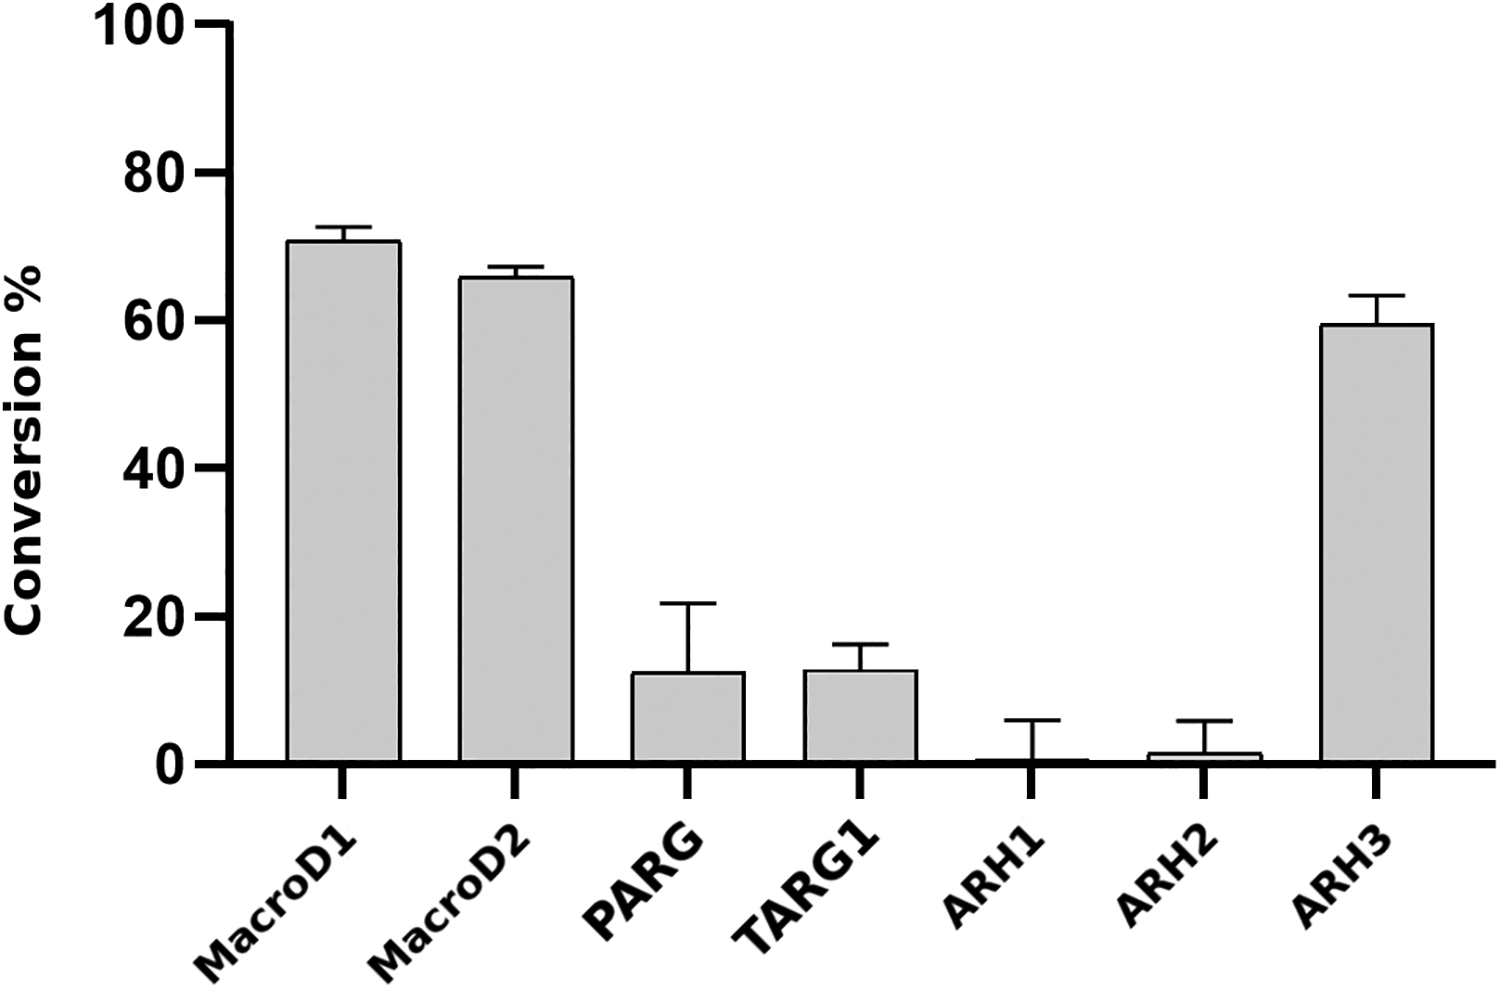
Activity test of human macrodomains and ARHs utilizing the assay. α-NAD+ hydrolyzing activity was tested with selected enzymes at 0.5 µM substrate concentration. Enzymes were tested at 100 nM concentration. Data reported as mean values of 12–16 replicates ± SD.
Discussion
Fluorescence-based activity assays using β-NAD+ were previously developed aiming for mono- or poly-ADP-ribosyltransferases. 26 -28 During the ADP-ribosyltransferase reaction, a proximal ribose is attached to the protein side chain from the opposite side of the nicotinamide attached to the ribose 1′-position. Macrodomains are designed to bind protein-linked ADPr groups, and therefore they are capable of binding α-NAD+, which mimics protein-linked ADPr. Some macrodomains can hydrolyze α-NAD+, and this opened up the way to develop an assay for hydrolyzing macrodomains by chemically converting α-NAD+ to a fluorophore with similar fluorescence spectra as reported for β-NAD+. 27
Some assays have been developed in the past to screen inhibitors and monitor activity and functions of different macrodomains. For example, the AlphaScreen-based inhibitor screening strategy and a strategy related to the identification of enzymatic activity were developed for PARP14 macrodomains that act as readers of ADP-ribosylation. 29,30 Contrary to these, an AlphaScreen assay was established that specifically measures the hydrolyzing activity of MAR macrodomains onto protein-linked ADPr. 21 All the methods including AlphaScreen technology are bead based and generate an amplified signal in the presence of a specific biological interaction. Also, immunoblotting, mass spectrometry, and cell-based assays have been used to study the hydrolyzing and deacetylase activity of various macrodomains and ARHs. 31 -33 In comparison to the previously used methods, the assay described here requires only addition and incubation steps with common reagents that, together with high-density microtiter plate compatibility, result in assay costs of only 0.03 USD/well excluding compound and dispensing costs.
ARHs are potential therapeutic targets, and specific inhibitors would help to validate them. We described a simple, cost-effective, and easy-to-execute assay using active enzyme fragments that can be produced in E. coli. The assay was optimized for human MacroD2, and to validate the assay we screened a random compound library. This allowed us to evaluate potential limitations of the assay in screening campaigns that one should take into account. Notably, some small molecules showed fluorescence and interfered with the assay signal at the wavelengths used. On the other hand, some compounds might have converted to a fluorophore during the chemical reaction. It is possible to assess these effects during the hit validation step or by including a compound-only control in the primary screening. It should also be noted that one cannot overcome this limitation by increasing substrate concentration and subsequently the signal due to the product inhibition by ADPr. Despite this drawback, the homogenous assay is inexpensive, easy to perform, and easy to automate.
The validatory screening yielded three hits inhibiting MacroD2, and two were further validated in dose–response measurements and in orthogonal assays. The identified micromolar inhibitors BI-78D3 and BAY 11-7085 are biologically active compounds belonging to different chemical classes. The compounds have a range of activities, but mainly identified as phosphatase and kinase inhibitors. BI-78D3 is reported as a competitive c-Jun N-terminal kinase (JNK) inhibitor and BAY 11-7085 inhibits TNF-α-induced lkBα phosphorylation. 34 -36 The compounds indeed displayed some inhibition toward both MacroD1 and MacroD2, but failed in orthogonal assays and were identified as protein destabilizers, which likely results in the inhibition seen in the primary assay. The negative orthogonal assays and quality control data showing likely compound degradation did not justify further studies with the hit compounds. However, identification of the hit compounds demonstrated the capability of the assay to identify inhibitors. Our results also show that the assay principle is applicable for all ADPr hydrolases accepting α-NAD+ as a substrate. The assay can therefore be readily established in laboratories to facilitate the development of chemical probes against these enzymes.
Supplemental Material
Supplemental_Material_for_Activity-based_Screening_Assay_for_Mono-ADP-ribosylhydrolases_Wazir_et_al - Activity-Based Screening Assay for Mono-ADP-Ribosylhydrolases
Supplemental_Material_for_Activity-based_Screening_Assay_for_Mono-ADP-ribosylhydrolases_Wazir_et_al for Activity-Based Screening Assay for Mono-ADP-Ribosylhydrolases by Sarah Wazir, Mirko M. Maksimainen, Heli I. Alanen, Albert Galera-Prat and Lari Lehtiö in SLAS Discovery
Footnotes
Acknowledgments
We thank the FIMM (UH) Technology Centre and Dr. Laura Turunen for help in preparing the assay plates. We thank Dr. Teemu Haikarainen for help in the cloning of PARG and Dr. Yashwanth Ashok for help in the cloning of ARHs and for the production of Af1521. Construct encoding for His-GST-Af1521 was a generous gift from Dr. Arto Pulliainen. We also thank Dr. Ulrich Bergmann from the Proteomics core facility for help in the mass spectrometry analysis of the inhibitors. The use of the facilities of the Biocenter Oulu Protein Crystallography core facility member of Biocenter Finland and Instruct-FI is gratefully acknowledged.
Declaration of Conflicting Interests
The authors declared no potential conflicts of interest with respect to the research, authorship, and/or publication of this article.
Funding
The authors disclosed receipt of the following financial support for the research, authorship, and/or publication of this article: This work was funded by the Academy of Finland (grant nos. 287063 and 294085) and by the Sigrid Jusélius Foundation.
Supplemental material for this article is available online.
References
Supplementary Material
Please find the following supplemental material available below.
For Open Access articles published under a Creative Commons License, all supplemental material carries the same license as the article it is associated with.
For non-Open Access articles published, all supplemental material carries a non-exclusive license, and permission requests for re-use of supplemental material or any part of supplemental material shall be sent directly to the copyright owner as specified in the copyright notice associated with the article.