
Abstract
We previously developed a flow cytometry assay that monitored lytic granule exocytosis in cytotoxic T lymphocytes stimulated by contacting beads coated with activating anti-CD3 antibodies. That assay was multiplexed in that responses of cells that did or did not receive the activating stimulus were distinguished via changes in light scatter accompanying binding of cells to beads, allowing us to discriminate compounds that activate responses on their own from compounds that enhance responses in cells that received the activating stimulus, all within a single sample. Here we add a second dimension of multiplexing by developing means to assess in a single sample the effects of treating cells with test compounds for different times. Bar-coding cells before adding them to test wells lets us determine compound treatment time while also monitoring activation status and response amplitude at the point of interrogation. This multiplexed assay is suitable for screening 96-well plates. We used it to screen compounds from the National Cancer Institute, identifying several compounds that enhance anti-LAMP1 responses. Multiple-treatment-time (MTT) screening enabled by bar-coding and read via high-throughput flow cytometry may be a generally useful method for facilitating the discovery of compounds of interest.
Introduction
One of the major goals of basic immunology research is to identify targets that can be used as the basis of strategies to manipulate the immune system for therapeutic purposes. We recently reported a flow cytometric assay that can detect compounds that inhibit or enhance T-cell receptor (TCR)-dependent activation of cytotoxic T lymphocytes (CTLs), 1 cells that kill virus-infected or transformed cells by releasing granules that contain cytolytic agents. 2 In the assay, cellular responses were measured by binding of fluorescently labeled antibody against lysosome-associated membrane protein 1 (LAMP1, also known as CD107a3,4), and polystyrene beads coated with anti-CD3 antibodies were used to stimulate cells by binding to and cross-linking a component of their TCRs. The beads we use are inherently fluorescent in all channels, and their binding to cells also causes a characteristic increase in side scatter, allowing us to measure by gating on scatter and bead fluorescence responses of cells that received the activating stimulus and cells that did not in a single sample. The assay was thus multiplexed in a single dimension, that of cell stimulation. This enabled us to discriminate compounds that augment TCR-stimulated responses from compounds that stimulate cells in the absence of TCR engagement. The former affect only cells that received a relevant activating stimulus and are potentially useful as immune-enhancing agents that could augment antiviral and antitumor immunity. The latter affect all cells, regardless of whether they have been stimulated via their TCRs, and would likely nonspecifically stimulate cells and produce serious deleterious effects that would limit their utility.
There are two general ways in which we envision compounds could augment TCR-stimulated responses. The first involves acute effects occurring after short compound treatments, perhaps by effects on the signals that control the release of granules. It is well established that increases in intracellular calcium 5 and the activation of protein kinase C and ERK 6 are required for granule release, so compounds that enhance these signals might be expected to act acutely to increase exocytosis. Consistent with this, using the assay to screen a plate containing extracts from tunicate-associated bacteria, we identified the PKC activator teleocidin A as an immune enhancer. 1 Compounds that activate MAP kinases or inhibit phosphatases that dephosphorylate PKC or ERK targets would likely produce similar effects. Compounds that enhance the activity of calcium channels or inhibit calcium-extruding transporters could have similar effects. However, there is reason to believe that at least in some cases effects such as these might not be detected after longer compound treatment times. For example, some PKC-activating compounds can trigger time-dependent downregulation of PKC isoforms, 7 and effects would therefore only be observed at short treatment times. The second broad category of mechanism that could enhance immune responses involves changes in the level of expression of genes that control lytic granule exocytosis and biogenesis. Such effects would likely be observed only after long-term incubation, but would be missed if only shorter treatment times were assessed.
Based on these considerations, we reasoned that an assay with the maximum power to detect compounds with immune-enhancing effects would assess the effects of multiple compound treatment times in a single sample. In flow cytometry, it is possible to bar-code cells (or beads) at channels other than those used to measure parameters of interest, a powerful strategy that has been used in multiple ways to extend the degree of multiplexing. 8 Here, we describe a further modification of our assay that uses bar-coding to make it possible to assess the effects of treating cells with compounds for various lengths of time prior to measuring the effects on cellular responses, a development we call multiple-treatment-time (MTT) screening.
Materials and Methods
Chemicals, Cells, and Solutions
TALL-104 human leukemic CTLs were maintained as described previously.
9
Early experiments were conducted in complete culture medium. Later experiments were in culture medium without interleukin-2 (IL-2). Complete culture medium contains 40 mL of heat-activated fetal bovine serum, 4 mL of pen-strep, 8 mL of
Fluorescent Bar-Coding with Calcein
TALL-104 cells were incubated with calcein AM (Thermo Fisher) at 0, 20, 50, 75, or 200 nM for 25 min, washed with dye-free medium twice, and then mixed together at the indicated time points.
Flow Cytometry, Plate Format Assays, and Screening
Some preliminary experiments were conducted on a BD FACSCalibur flow cytometer equipped with 488 and 640 nm lasers. Most experiments were conducted on a five-laser (350, 405, 488, 540, and 640 nm) BD Fortessa X-20 with a plate reading unit. Both instruments are housed in the University of Connecticut’s Flow Cytometry Facility. When the FACSCalibur was used, pulse height was measured. Pulse area was used for all other experiments. For experiments conducted in plates, including plate screening, the sample volume was 120 µL and samples were acquired a rate of 3 µL/s. Sixty microliters of sample was collected, unless 20,000 events were acquired first, in which case sampling was terminated. Samples were mixed three times with 60 µL per well at a mixing speed of 100 µL/s. It took approximately 40 min to read a whole plate, and for screening, generally only one plate was read per day. Data were analyzed offline using FlowJo software (Tree Star, Inc., Ashland, OR). Statistical analysis of data was performed using Prism 7 (GraphPad Software, La Jolla CA).
For screening, 1 µL of compound at a concentration of 1 mM in DMSO or 1 µL of DMSO was added to wells of test plates (Greiner 675076, Kremsmünster, Austria). One hundred microliters of medium-washed TALL-104 cells (1.25 × 10⁶/mL) was added to each well, mixed with the compound or DMSO, and incubated at 37 °C for 24 h. This comprised the 24 h treatment time sample. Cells for the 30 min treatment time were maintained in medium at 37 °C for 23 h, before being bar-coded with 20 nM calcein AM and added to the plate in 10 µL of cell solution (1.25 × 10⁷/mL). Each well was thoroughly mixed and incubated at 37 °C for 30 min. To stimulate cells, 10 µL of CD8 bead solution (medium supplemented with anti-CD8 beads, anti-LAMP1, 4% DMSO), CD3 bead solution (medium supplemented with anti-CD3 beads, anti-LAMP1, 4% DMSO), or stimulation solution (medium supplemented with anti-CD3 beads, anti-LAMP1, 1 µM PMA, 20 µM TG) was added to the appropriate wells and mixed by repeated pipetting. All manipulations were performed with digital multichannel pipetters. Plates were incubated at room temperature for 1 h with constant rotation (resulting in plate inversion) before being sampled.
Measuring Enhancement of Anti-LAMP1 Fluorescence
After data compensation for fluorescence spillover, the geometric mean of anti-LAMP1 fluorescence for cells bound to beads was obtained. Values from sample compound-containing wells (S) were compared with those from DMSO-treated wells from CD3 bead (CD3) or CD8 bead (CD8) controls. Values from CD8 controls represent the inherent fluorescence of nonresponding cells bound to beads, and we subtracted their average values before calculating the percent enhancement (% Enhancement) using the following equation (eq 1):
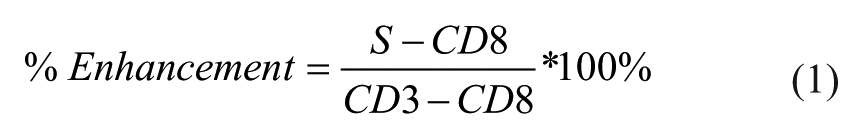
Plate data were also normalized using the Z score, 10 calculated as (eq 2)

where Xi is the value of a given sample, µ is the mean of all the samples in the plate, and σ is their standard deviation.
Dose Response of Active Compounds
Potential enhancing compounds were obtained from NCI in powder form and dissolved in DMSO. The same procedure described in Flow Cytometry, Plate Format Assays, and Screening was used for dose–response testing except for compound NSC 125095, which was tested at only 24 h. Serial fold dilutions were created from 10 or 3 mM DMSO stock for each compound. One microliter of compound or DMSO was added to plates. Cell-containing solutions were added, mixed, and incubated at 37 °C for 23 h. Cells loaded with 20 nM calcein AM were added to the wells, mixed, and incubated at 37 °C for 30 min. CD8, CD3, or stimulation solutions were prepared as described and added to appropriate wells. Percentage enhancement was calculated, and the dose response was fitted to the Hill equation for compounds that demonstrated dose dependence.
Results
Bar-Coding Cells with Calcein
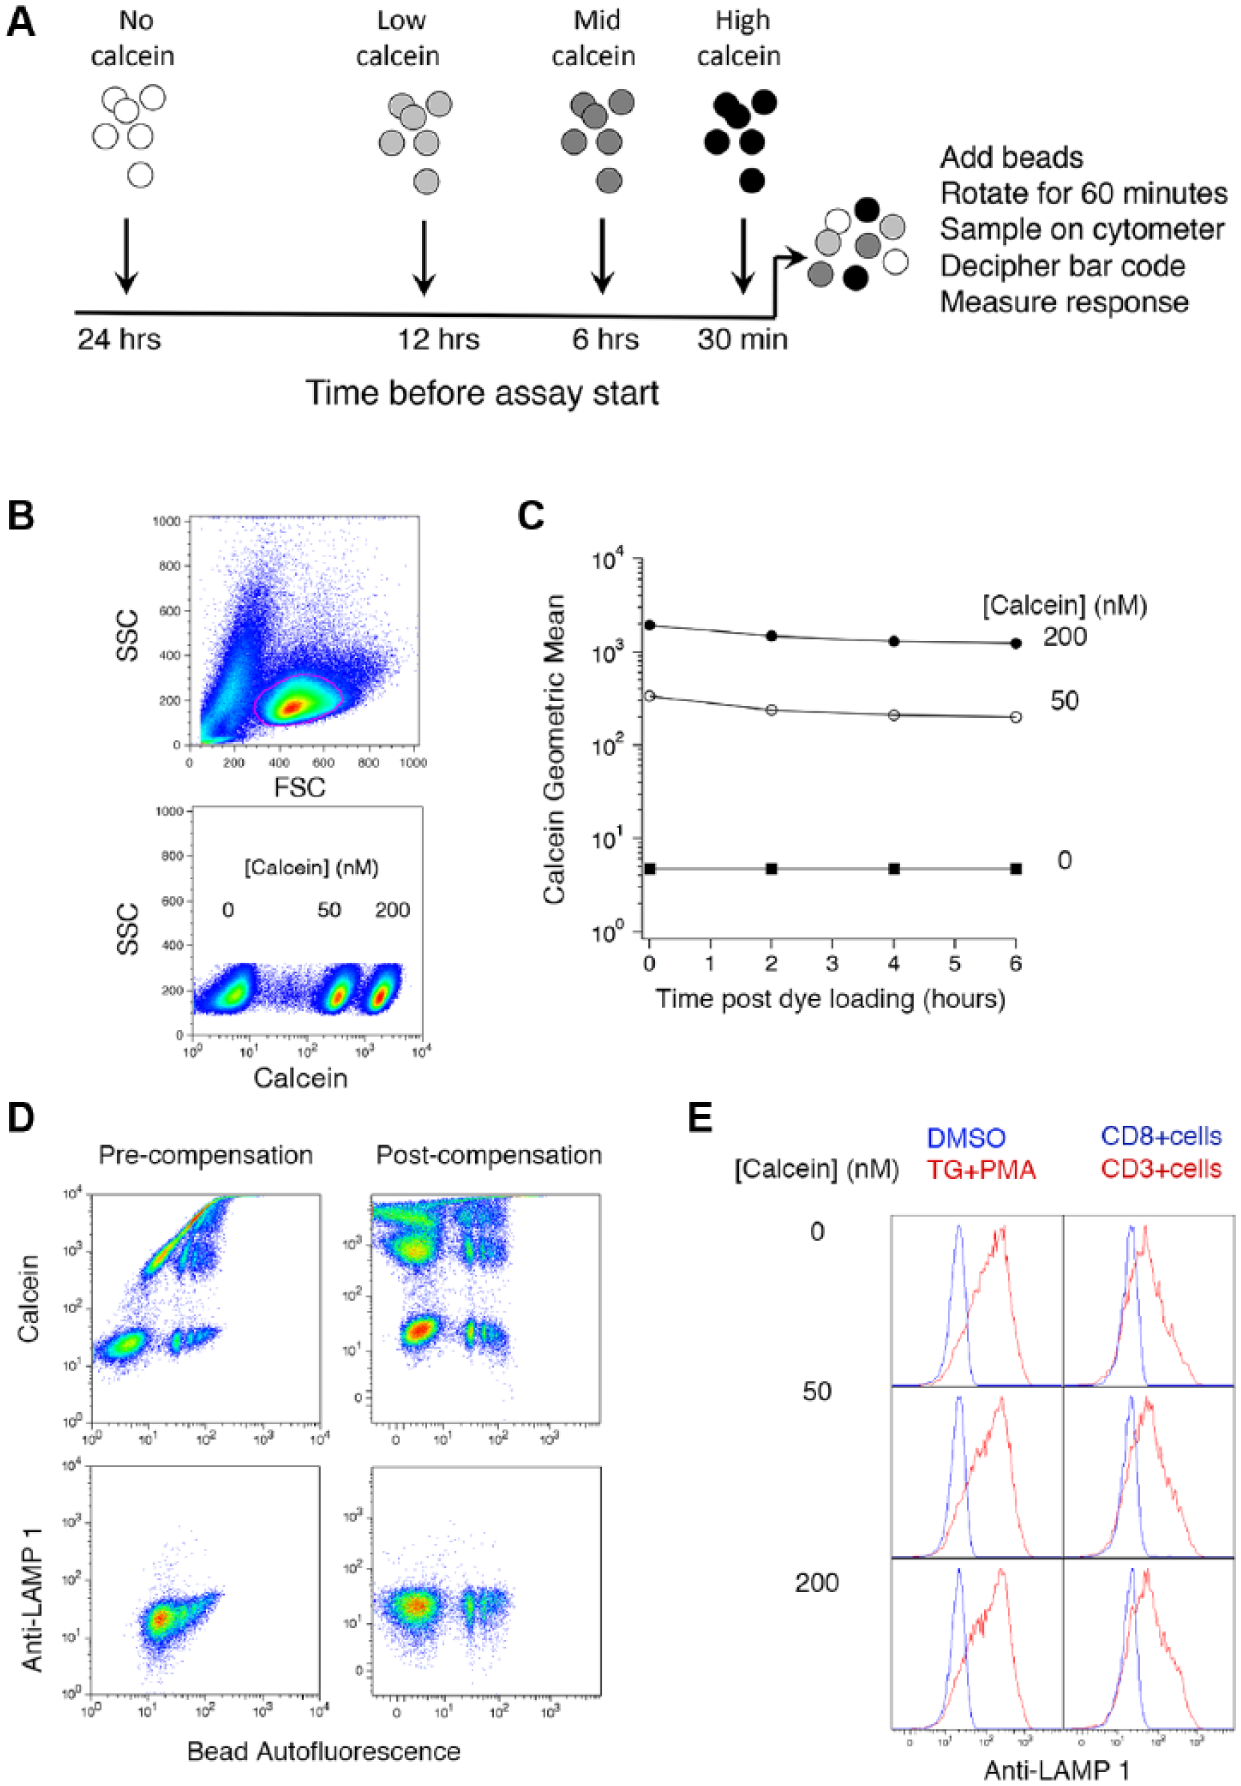
We reasoned that we could implement an assay in which the effects of treating cells with compound for various lengths of time before stimulating them was assessed by adding cells to compound-containing wells at different times prior to the start of the assay ( Fig. 1A ). As long as the volume in which cells are added is small relative to the volume of compound-containing solution in the assay wells, the compound concentration will only be changed by a few percent with each subsequent addition. Bar-coding would allow the time at which cells were added to compound-containing wells to be determined at the same time as responses are measured. In our assay, lytic granule exocytosis is measured with an Alexa Fluor 647-conjugated anti-LAMP1 antibody, and the anti-CD3 beads we use for stimulation are inherently fluorescent in multiple channels. Maximal fluorescence is observed with 488 nm excitation and 670 nm emission. We thought it would be possible to bar-code the time of addition using calcein AM, which is efficiently excited at 488 nm and emits at wavelengths > 530 nm, provided three requirements are met. First, we must be able to compensate fluorescence signals for spillover. Calcein spills into the 488/670 channel used to measure bead fluorescence on the FACSCalibur, and as stated above, there is inherent fluorescence of beads in the channel used for calcein on both of the cytometers to which we had access. Compensation for bead fluorescence in the channel used for Alexa Fluor 647-conjugated anti-LAMP1 antibody is also necessary on all cytometers for accurate measurement of anti-LAMP1 fluorescence. Second, calcein fluorescence levels must be stable enough so that the fidelity of bar-coding is retained. Finally, calcein should not affect cellular responses.
Bar-coding for MTT screening. (
Figure 1 shows that the prerequisites for using calcein for bar-coding up to three samples are met, even when using the FACSCalibur, an instrument in which spillover is more of a problem. Cells could be loaded with two dye concentrations such that three populations—one unloaded—can be distinguished ( Fig. 1B ). Loading was stable over the course of many hours ( Fig. 1C ). Provided we leave cells treated for the longest time (24 h) unloaded, which would likely be a good choice given potential effects of long-term dye loading for cell health, these results suggest that calcein loading is stable enough for bar-coding. Figure 1D shows that spillover between fluorescence channels can be adequately compensated, even under the relatively adverse circumstances that pertain when using a two-laser instrument. In this experiment, cells were incubated with beads coated with anti-CD8 antibodies, which bind to cells but do not trigger exocytosis. 1 Without compensation, fluorescence from calcein contributed so much signal in the channel used to measure bead binding that discriminating cells bound to beads was impossible. After compensation, however, the different populations were clearly discernible. Figure 1E shows that loading cells with calcein per se does not affect lytic granule exocytosis as measured with anti-LAMP1 antibodies. Cells were treated by adding 1 µM TG and 50 nM PMA, soluble compounds that stimulate maximal responses in TALL-104 cells, 1 and compared with responses to cells treated with DMSO as a vehicle control. No differences were observed at different levels of calcein loading (including no loading). We also examined the effects of incubating cells with beads coated with anti-CD8 (nonstimulating) or anti-CD3 (stimulating) antibodies. Again, no differences were apparent in cells loaded with different amounts of calcein.
Detection of Compounds with Actions Occurring on Different Timescales
Our major rationale for seeking to develop an MTT assay is to be able to detect compounds that might only be active after either short or long compound treatments. We identified two compounds that we thought might serve as exemplars. PMA activates PKC and enhances lytic granule exocytosis after short-duration treatment, 1 but the downregulation of PKC isoforms that occurs between 2 and 6 hours after stimulation 11 could result in inhibition of lytic granule exocytosis. Imiquimod, in contrast, has been reported to increase perforin levels in CTLs after ~12 h, 12 suggesting that it might enhance lytic granule exocytosis in a time-dependent manner. Figure 2 shows results of an experiment in which we examined the effects of treating cells with PMA or imiquimod using our BD Fortessa X-20. We placed cells into wells containing DMSO, PMA, or imiquimod 24, 6, or 0.5 h prior to adding either CD3 beads or CD8 beads to DMSO-containing wells, or CD3 beads to PMA- and imiquimod-containing wells. Cells added at 24 h were not loaded with calcein, cells added at 6 h were loaded with 7.5 nM calcein, and cells added at 30 min were loaded with 20 nM calcein. After adding beads, plates were rotated end over end for 60 min prior to analysis. We found that, as expected, PMA greatly enhanced responses when cells were treated for 30 min (~8-fold enhancement compared with CD3 controls after subtracting the fluorescence of cells bound to anti-CD8 beads, which is a measure of intrinsic cell/bead fluorescence). The effect was substantially smaller after 6 h (~2.4-fold), while after 24 h the responses were actually reduced compared with those of the DMSO-treated CD3 controls. Imiquimod, by contrast, enhanced responses in cells treated for 24 h by 1.5-fold but was without effect at earlier times. The effect of imiquimod after 24 h was statistically significant as assessed by one-way ANOVA, as were the effects of PMA at all time points.
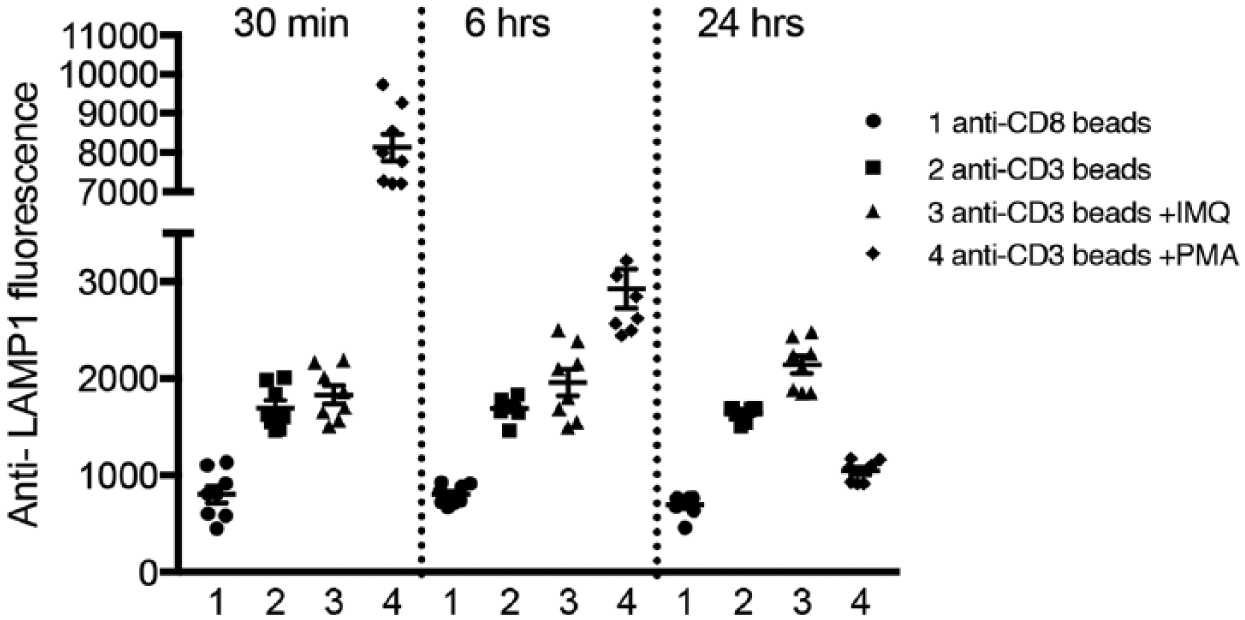
Detecting compounds with different modes of action via multiple time point measurements. Plots of anti-LAMP1 fluorescence for the conditions indicated from cells treated with imiquimod (IMQ) or PMA for 30 min, 6 h, or 24 h. Cells treated for 24 h were not loaded with calcein, and cells treated for 6 h or 30 min were loaded with 7.5 and 20 nM calcein, respectively. For each time point, samples are arranged in the order (from left to right): anti-CD8 beads, anti-CD3 controls, anti-CD3-stimulated cells treated with imiquimod, and anti-CD3-stimulated cells treated with PMA. Note that the left axis is discontinuous to allow the large enhancing effect of PMA after 30 min of treatment (~8-fold) to be displayed while allowing the differences between other conditions to be visible.
A Two-Time-Point Assay May Be Suitably Robust for Screening
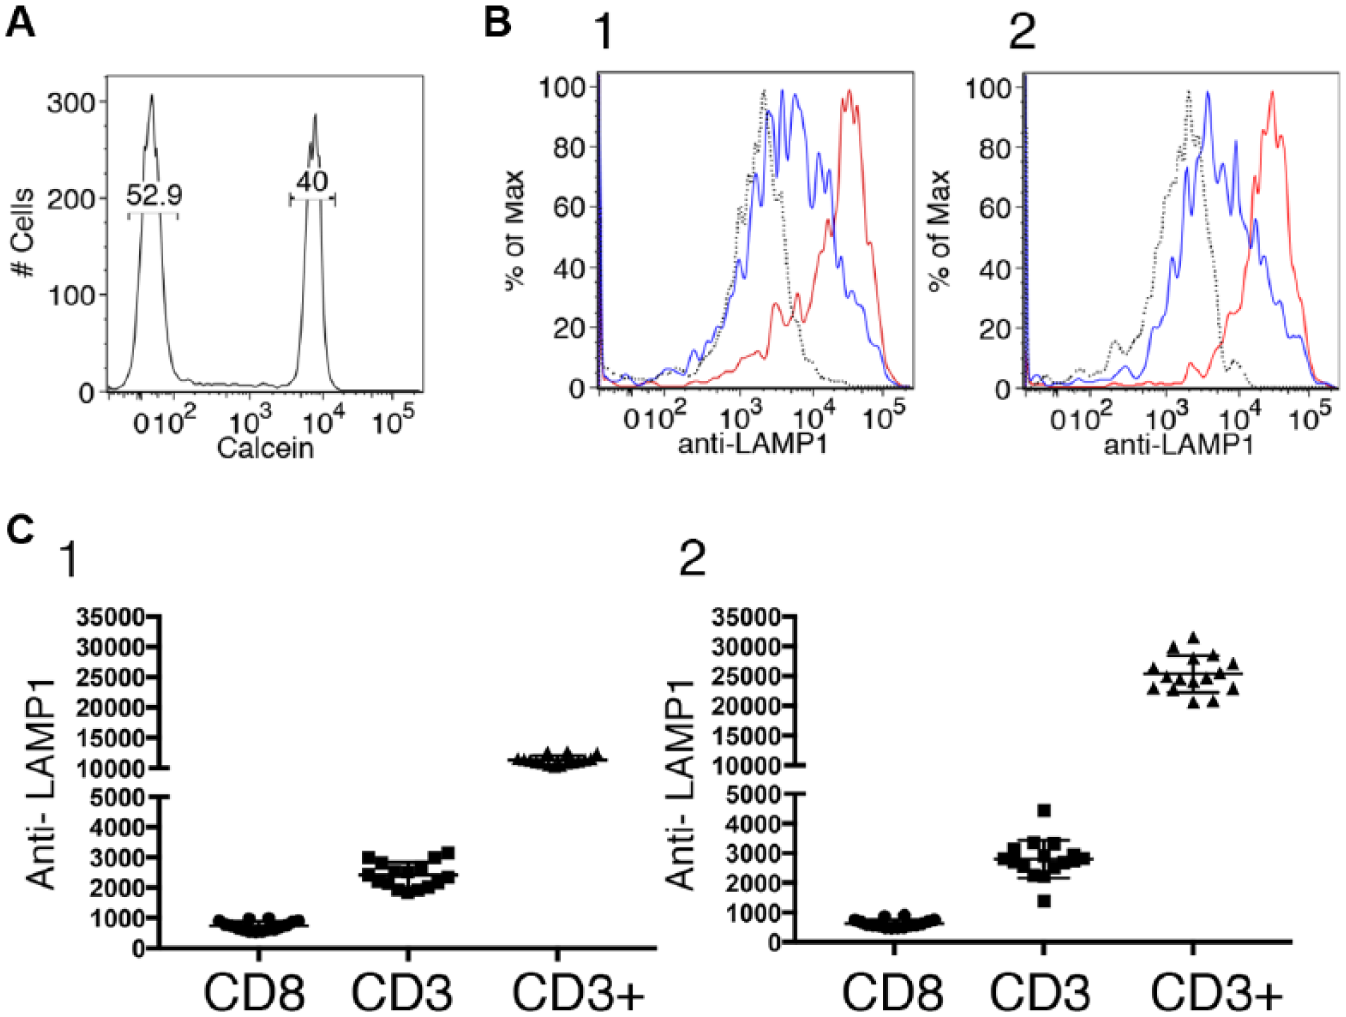
In high-throughput flow cytometry, a fixed sample volume is typically acquired from each well. 13 This means that each treatment time added to the assay necessarily decreases the number of events acquired for any given treatment time, unless the cell density is increased to compensate. We decided to focus on developing a two-time-point assay in which cells are treated for either 30 min or 24 h, as this seemed likely to offer the optimal ability to identify acute-acting and long-term-acting compounds. It also made the workflow much easier, as a 6 h time point is difficult to incorporate into most workdays. To determine whether a two-time-point version of the assay might be robust enough for screening ( Fig. 3 ), we laid out 48 wells of a half-area 96-well plate with two repeats of two columns containing DMSO and one containing TG + PMA. Unloaded cells were added 24 h prior to the start of the stimulation period, and calcein-loaded cells were added 30 min prior. CD8 beads were added to one set of columns of DMSO-containing wells, and CD3 beads were added to the other column of DMSO-containing wells and also to the TG + PMA-containing wells. The plate was read on the Fortessa X-20. Samples were mixed three times before 60 µL was sampled to collect ~20,000 events. Responses of cells bound to beads were measured and used to calculate the assay performance parameter Z′ 14 for both treatment times. We found Z′ > 0.5 computed from 16 samples, each comparing DMSO-treated CD3-stimulated cells to TG + PMA-treated CD3-stimulated cells for both 30 min- and 24 h-treated cells, indicating that the assay is likely suitable for screening in our hands using relatively low-throughput manipulations. At each time point, responses of CD8 bead-treated cells, CD3 bead-treated cells, and TG + PMA-treated CD3-stimulated cells were significantly different from one another as assessed using one-way ANOVA.
Assay performance is suitable for screening in low-density format. (
Screening an NCI Compound Library Probes Assay Performance and Reveals Candidate Immunomodulators
We screened 12 plates from the NCI’s Diversity Set V containing a total of 960 compounds using the two-treatment-time assay format (
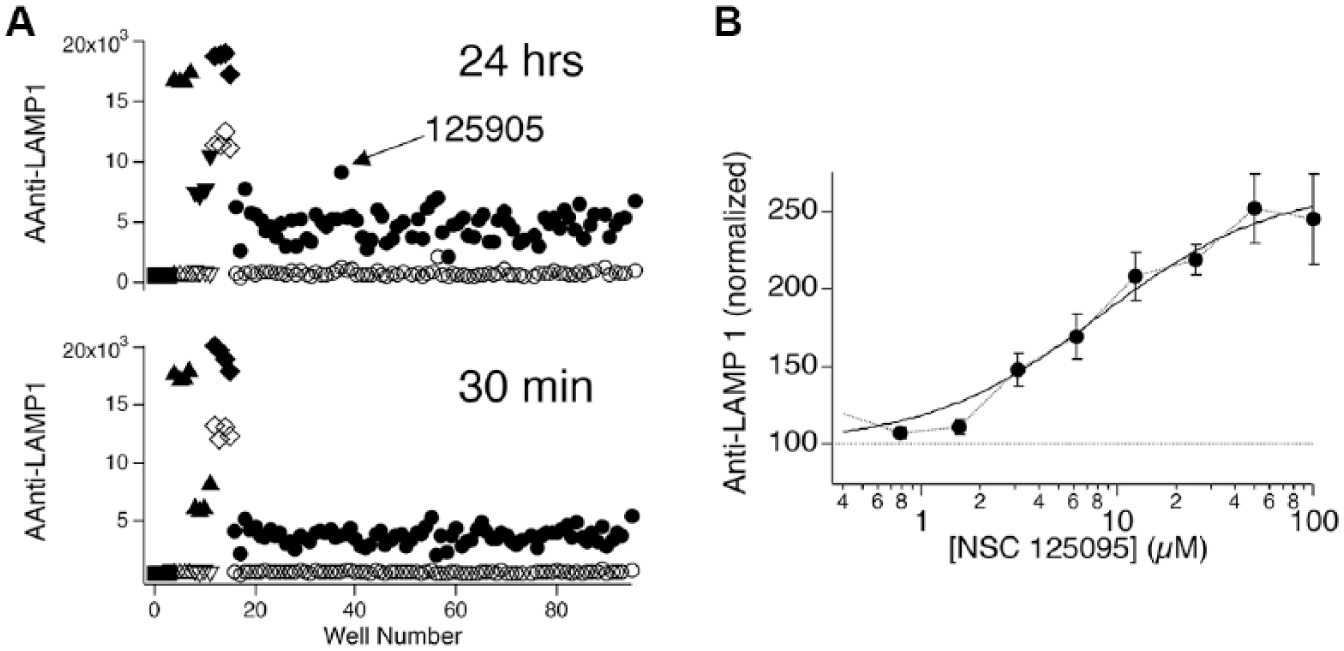
Identifying a potential immune-enhancing compound in a preliminary screen of two plates from NCI’s Diversity Set V. (
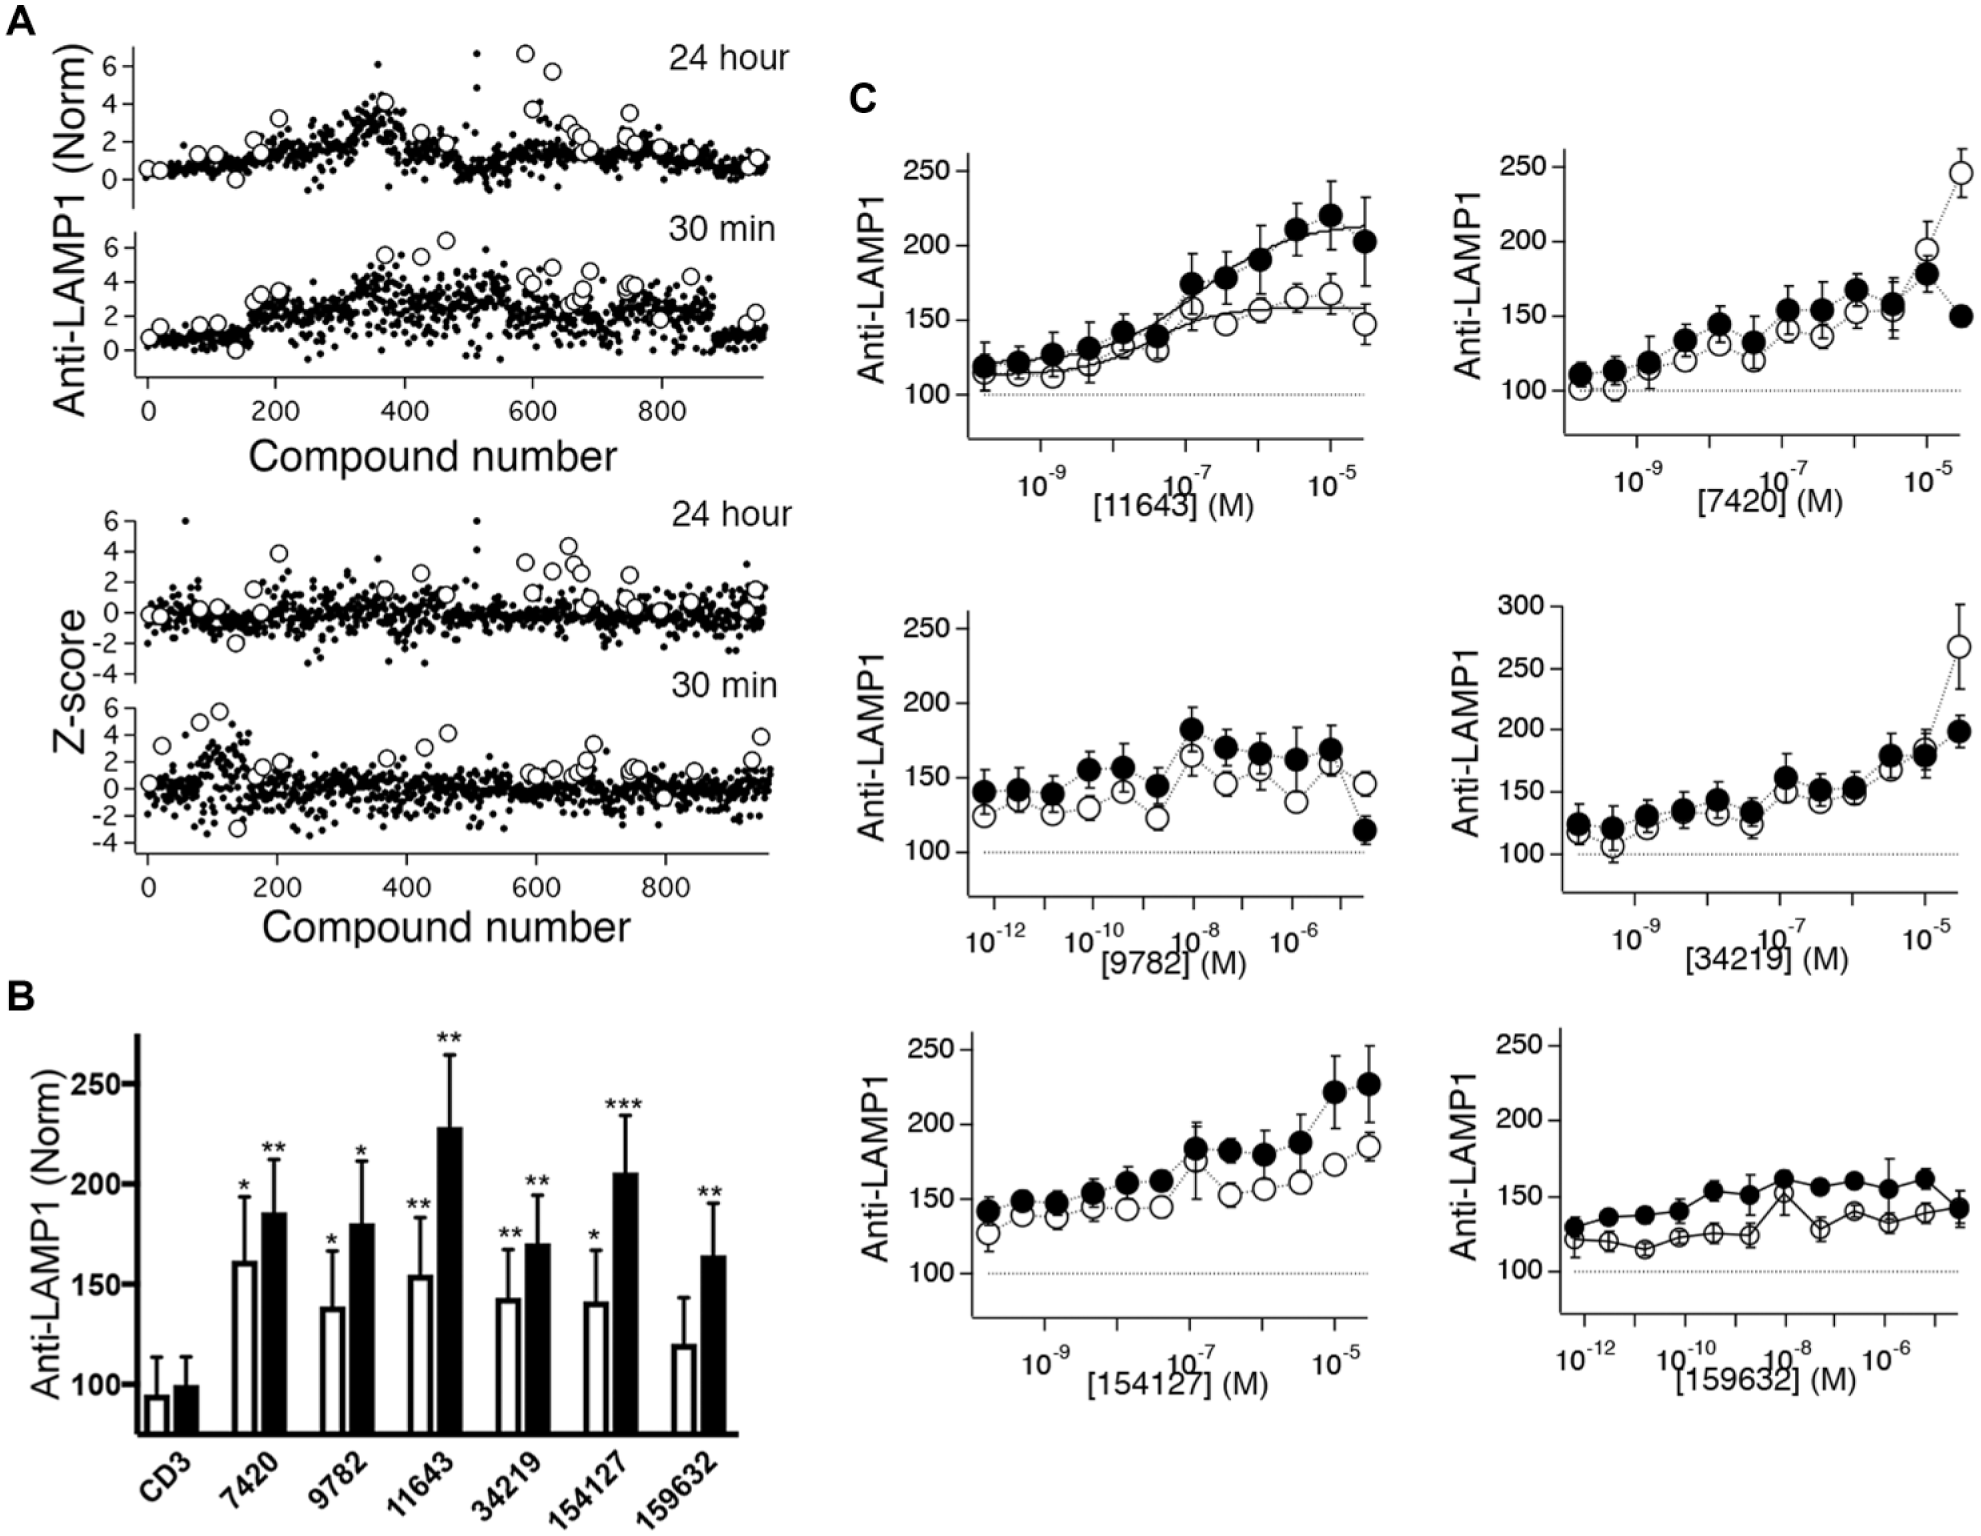
Screening the remainder of Diversity Set V probes assay performance and generates additional candidates. (
We later screened the other 10 plates in the Diversity Set, also at a compound concentration of 10 µM. For these experiments, we included all the controls described above except the PMA + anti-CD3 bead condition. We instead added four additional anti-CD3 bead control wells. We were able to assess assay performance during our limited plate screening ( Fig. 5 and Table 1 ). Seven out of 12 plates gave Z′ > 0.5 (measured by comparing eight anti-CD3 controls with four controls stimulated with anti-CD3 + TG + PMA) for 30 min-treated cells, while only 2 out of 12 did for 24 h-treated cells. Note that for this analysis we did not exclude outliers. If we instead compute robust Z′ (Z′R), 15 a variant of Z′ that uses median and robust standard deviation (1.48 × median absolute deviation) instead of mean and standard deviation and is thus more resistant to outliers, 10 out of 12 plates at the 30 min treatment time and 4 out of 12 after 24 h treatment had values > 0.5. There was a correlation between Z′ for the two treatment time points (r2 = 0.49). The enhancement of anti-LAMP1 fluorescence signals caused by adding soluble stimuli in addition to anti-CD3 beads varied between plates, and there was a strong correlation between the magnitude of enhancement for 30 min treatment and 24 h treatment times (r2 = 0.65). However, the Z′ and Z′R values were only weakly correlated with enhancement produced by soluble stimuli (r2 = 0.002 and r2 = 0.1, respectively), suggesting that suboptimal response amplitude (low signal too high or high signal too low) was not responsible.
Assay Performance during Screening of NCI Diversity Set V.
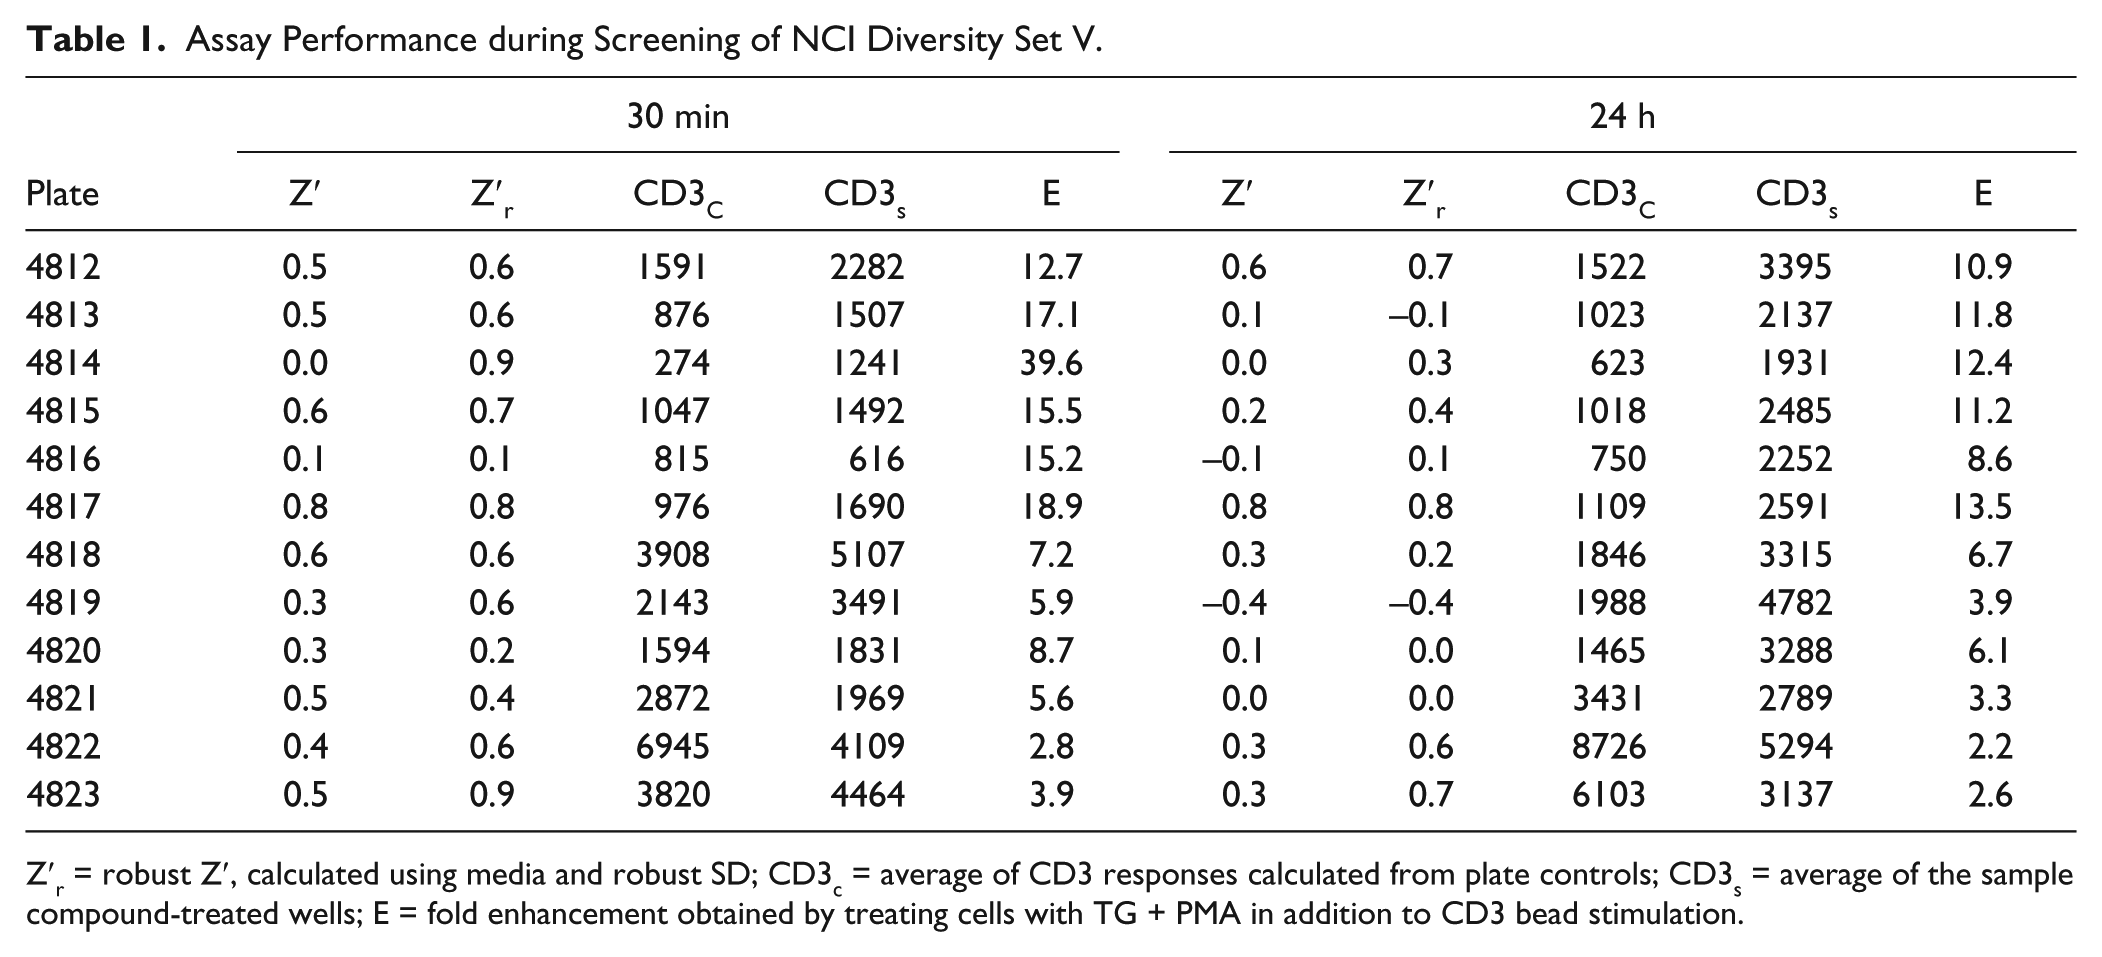
Z′r = robust Z′, calculated using media and robust SD; CD3c = average of CD3 responses calculated from plate controls; CD3s = average of the sample compound-treated wells; E = fold enhancement obtained by treating cells with TG + PMA in addition to CD3 bead stimulation.
There was for most plates a quantitative discrepancy between the amplitude of responses in anti-CD3 bead-stimulated controls and the average values obtained from compound-treated cells stimulated with anti-CD3 beads that made normalizing data problematic (see Fig. 5A , top, for data from all plates in the collection normalized to CD3 control values after subtracting CD8 control values). As a result, we found it most useful to normalize data from different plates using the Z score as defined in Methods. Plots of Z score for all the compounds we screened are shown in the bottom panel of Figure 5A . Compounds that were selected for retesting are shown as open circles.
Twenty-three compounds that produced Z scores > 1.5 at either 30 min, 24 h, or both in the initial screen were selected for retesting. Compounds that enhanced anti-LAMP1 fluorescence in cells that did not contact beads or were fluorescent in any of the channels collected were excluded. We did not select all the compounds that produced the highest Z scores, as we felt exploring the effects of compounds that produced a range of responses might be informative. Powder resupply of 10 selected compounds that produced the highest levels of anti-LAMP1 responses upon retesting was obtained, and these compounds were then retested at 10 µM. In five replicate experiments, seven compounds that enhanced anti-LAMP1 responses after 24 h of treatment were identified. Five of these also enhanced responses at 30 min, but the effect appeared smaller than at 24 h (data not shown). We investigated the dose dependence of inhibition of the seven compounds, using a two-time-point protocol that assessed the effects of compounds after 30 min and 24 h of treatment using concentrations ranging down from a maximum concentration of 30 µM. Four such experiments were performed. As these experiments included 10 µM doses, we added these additional data points to the five single-point measurements described and used the pooled sample to assess statistical significance of effects. Note that one compound appeared to result in significant cell death at both 10 and 30 µM as assessed by measuring the number of events in the live-cell forward and side scatter gate for the calcein-negative (24 h treatment) population ( Suppl. Fig. S2 ), so we decided to exclude this compound from further analysis. We found that all six of the remaining compounds significantly enhanced anti-LAMP1 fluorescence compared with controls at both treatment times as assessed by repeated measures one-way ANOVA conducted on nonnormalized data. ( Fig. 5B shows normalized results from these measurements.) Inspection of the dose–response relations ( Fig. 5C ) indicated that only one compound, NSC 11643, produced saturable dose-dependent augmentation that could reasonably be fit to the Hill equation. Concentrations of NSC 11643 producing half maximal enhancement were 33 nM for cells treated for 30 min and 150 nM for cells treated for 24 h. Responses were significantly smaller for 30 min treatment than for 24 h treatment (p < 0.01 using a paired t test). Other compounds produced dose–response relations that were either flat or increased monotonically over the concentration range examined. These seem less likely to us to reflect genuine or useful biological effects than the effects of NSC 11643. We believe based on the results we present that NSC 120595 and NSC 11643 represent promising candidates for immune-augmenting compounds that can be pursued in future studies.
Discussion
Multiplexing a cell-based assay so that it examines the effects of multiple compound treatment times has a number of possible uses. First, it increases the assay’s ability to detect compounds with different kinds of activity. This was the use to which we put the method. We envision that a second use might be to increase an assay’s reliability. In such an implementation, assessing effects of MTTs could be thought of as analogous to quantitative high-throughput screening (qHTS), 16 where compounds are screened at different doses as a means of reducing the number of false positives and identifying the most promising compounds in the initial screening step. The assumption behind such an implementation of MTT screening would be that compounds with genuine activities should exhibit graded time-dependent changes in responses. One advantage of assessing MTTs in this manner compared with qHTS would be that higher throughput should be achievable, as the time series would all be contained in a single well.
The assay was not as robust during plate screening ( Table 1 ) as we would have anticipated based on its performance in control testing ( Fig. 3 ). We failed to reliably obtain Z′ values for control wells that were > 0.5, although robust Z′ values were somewhat higher. We note that Z′ > 0.5 appears not to have been intended by its creators to be an absolute criterion for assay feasibility. Zhang et al. 14 certainly seem to have noted that assays with Z′ > 0 could be fruitful. Based on the difficulties we encountered with the assay at low throughput, we anticipate that it might be challenging to translate it to a higher-density format. The main technical limitation is likely to be in mixing the activating beads and cells well enough, as beads tend to settle much more rapidly than cells. The inherent difficulties involved in trying to measure complex physiological responses from living cells will also present problems. However, we would argue that the unmet need for immunomodulatory small molecules makes the challenges worth confronting. Also, as we noted, there was a discrepancy between the amplitude of anti-CD3 controls and the average response of compound-treated anti-CD3-stimulated cells. As we would expect most compounds to have no effect on lytic granule exocytosis, we anticipated that the two measures would give similar results. The discrepancy was not related to the way we sampled plates. For the first two plates we tested (4822 and 4823), controls were sampled first, yet compound-treated samples had lower average fluorescence levels. For the remainder of the plates, controls were acquired interleaved amidst compound-treated samples. Controls were treated with DMSO at the same concentration as compound-treated cells. At present, we have no explanation for the discrepancy.
The real test of whether our assay is useful is whether it identifies compounds as anticipated. We were able to identify seven compounds in NCI compound collections that reproducibly enhance responses to CD3 beads as assessed by anti-LAMP1 staining. However, five of those compounds exhibit dose–response behavior that seems inconsistent with a plausible mechanism of action. Of the two others, NSC 125095 affects responses only after longer-term incubation, with an EC50 of ~7 µM and a calculated maximum enhancement of 150% after 24 h treatment, as derived from fits of the Hill equation to dose–response data, while NSC 11643 is effective after both short-term (EC50 33 nM, calculated maximum enhancement 59%) and long-term (EC50 150 nM, calculated maximum enhancement 115%) treatment. Thus, the assay reveals compounds with different temporal patterns of activity, as we hoped. Assuming that compound penetration into cells is not the limiting factor, we suspect that the effects of NSC 125095 reflect changes in gene expression. Since NSC 11643 has much faster effects, we would imagine that it likely affects some aspect of the signaling cascade that controls lytic granule exocytosis. There is little information available upon which to formulate hypotheses regarding possible targets of these compounds. NSC 125095 has been tested in 771 assays reported in PubChem and found to be active in only 6. One effect reported was the promotion of myeloid differentiation in myeloid leukemia cells (PubChem AID 624256), which seems as though it might be relevant. NSC 11643 has been tested in 322 assays and found to be active in only 2. One (AID 743287) was for compounds that enhance glucose-dependent insulin secretion, which seems promising. However, both of those assays yielded several thousand hits, and it is not clear that compound activities were confirmed.
It remains to be determined whether these compounds have useful effects on immune functions. Although LAMP1 externalization is believed to be a faithful measure of lytic granule exocytosis,1,3,4 we have yet to confirm compound effects with an orthogonal measure and are in the process of devising the needed assays to do so reliably. Furthermore, even if compounds are confirmed to increase lytic granule exocytosis, it is not clear what effect this would have on CTL-dependent target cell killing, or immune function more generally. It appears that CTLs release only a fraction of their lytic granules when they kill a target. 9 Releasing more granules may not enhance overall target cell killing; in fact, releasing more granules than needed to kill a single target could reduce overall killing by depleting granules that could have been used in later “lethal hits.” Of course, compounds that affect lytic granule exocytosis might also affect the activity of other immune cell types. There are sufficient similarities between the signals that activate CTLs and other immune cells that compounds that act on CTLs might be expected to have broader effects. For example, imiquimod, which we found enhanced anti-LAMP1 responses by about 50% (i.e., responses were 1.5-fold higher than in control cells), somewhat less than the increases caused by NSC 125095 (~2.5-fold) and NSC 11643 (~2.2-fold), has effects on multiple immune cell types, including dendritic cells and B cells.17,18 It is possible that the compounds we found may do the same.
Supplemental Material
Supplemental_data_for_Zhao_et_al_rev – Supplemental material for A Multiplexed Assay That Monitors Effects of Multiple Compound Treatment Times Reveals Candidate Immune-Enhancing Compounds
Supplemental material, Supplemental_data_for_Zhao_et_al_rev for A Multiplexed Assay That Monitors Effects of Multiple Compound Treatment Times Reveals Candidate Immune-Enhancing Compounds by Ziyan Zhao, Liza Henowitz and Adam Zweifach in SLAS Discovery
Footnotes
Acknowledgements
We thank Dr. Wu He and the University of Connecticut’s COR2E Flow Cytometry Facility.
Declaration of Conflicting Interests
The authors declared no potential conflicts of interest with respect to the research, authorship, and/or publication of this article.
Funding
The authors financial support for the research, authorship, and/or publication of this article: This work was supported by NIH grant AI 120169.
Supplemental material is available online with this article.
References
Supplementary Material
Please find the following supplemental material available below.
For Open Access articles published under a Creative Commons License, all supplemental material carries the same license as the article it is associated with.
For non-Open Access articles published, all supplemental material carries a non-exclusive license, and permission requests for re-use of supplemental material or any part of supplemental material shall be sent directly to the copyright owner as specified in the copyright notice associated with the article.