
Abstract
High-throughput screening, based on subcellular imaging, has become a powerful tool in lead discovery. Through the generation of high-quality images, not only the specific target signal can be analyzed but also phenotypic changes of the whole cell are recorded. Yet analysis strategies for the exploration of high-content screening results, in a manner that is independent from predefined control phenotypes, are largely missing. The approach presented here is based on a well-established modeling technique, self-organizing maps (SOMs), which uses multiparametric results to group treatments that create similar morphological effects. This report describes a novel visualization of the SOM clustering by using an image of the cells from each node, with the most representative cell highlighted to deploy the phenotype described by each node. The approach has the potential to identify both expected hits and novel cellular phenotypes. Moreover, different chemotypes, which cause the same phenotypic effects, are identified, thus facilitating “scaffold hopping.”
Keywords
Introduction
High-content analysis (HCA) enables monitoring of a wide range of phenotypic image readouts, such that the cellular phenotype is described in detail. For example, the cell’s morphology is characterized with respect to its size and shape as well as the subcellular localization of entities (e.g., organelles and proteins). Such information-rich data sets have been exploited in various studies for biomedical research.12–3 Recently, the technology has also become widely used in drug discovery for primary and secondary screening of small molecules.4,5
Despite its potential to acquire a wide range of image readouts, hit identification in primary high-content screening (HCS) is still usually based on a single readout that is thought to reflect the desired biological effect. For example, the ratio of antibody staining intensities in the nucleus versus the cytoplasm can be used to indicate translocation of the targeted protein, 6 or the (average) intensities are used to detect enhanced or decreased expression of certain target proteins. 6 Such straightforward approaches have the advantage that the results are easily interpretable. However, alternative image readouts describing other phenotypic changes that are not reflected in the selected readout are disregarded.
To avoid a (manual) preselection of a single readout but rather to analyze multiple readouts, Duerr et al. 7 suggested the use of classification methods for hit selection. With a classification approach, compounds are selected as hits if their treatment results in a similar phenotype to the positive control samples—as described by multiple image parameters. In the example given by Duerr and coworkers, 7 the validation rate was higher for the classification approach compared with a univariate hit selection. However, the detection of unexpected phenotypes (i.e., those that are not reflected by the controls) is not possible with such an approach. The dependency on positive controls also means that such classification methods are simply not applicable if controls are not available.
To extend the analysis of HCS data from univariate to multivariate and not to restrict the analysis to one particular phenotype, researchers can apply clustering. This technique has been extensively used in cheminformatics to cluster chemicals with similar structures. Also, in microarray analysis, clustering is often applied to identify either genes having a similar expression profile across the sample set or samples having a similar gene expression profile. 8 There are also examples of using clustering techniques for analysis of HCS results, such as k-means clustering, which has been used to group cells according to their respective cell cycle phase by high-content readouts within a sample population. 9 Only recently, Caie et al. 10 used self-organizing maps (SOMs) in a screen of low molecular weight compounds to group similar samples based on the average cellular phenotype. In this clustering method, samples are sorted onto the nodes of a grid to which they are most similar. The grid is organized such that neighboring nodes still share some similarity. Using this method, it was possible to identify different modes of action for the compounds in different cancer cell lines.
Clustering approaches could also be used to detect diverse phenotypes from primary screening results. However, two eminent challenges exist when applying clustering techniques to primary screening data. First, particularly for screens without positive controls, it is not, per se, clear which clusters consist of compounds relevant for the screening campaign. Hence, visual inspection of the phenotypes in each cluster is essential to enable the screener to select the relevant group(s) created by the clustering method. Second, the visualization of the very large number of compounds tested in such a screen makes the selection of relevant groups difficult. In this work, we demonstrate a strategy to use SOMs for a non-control-based analysis and visualization of primary screening data. To help focus the researcher on the potentially relevant compounds, we filtered the samples based on their dissimilarity to the negative controls prior to clustering.
The results analyzed in this work originated from a screen to identify compounds that may have application for the treatment of cystic fibrosis (CF). In most cases of this hereditary disease, the CF transmembrane conductance regulator (CFTR) is improperly folded, often due to a deletion of a phenylalanine, and is not localized to the apical membrane of epithelial cells.11,12 This lack of the active chloride channel leads to improper mucus clearance and subsequently severe secondary bacterial infections. As no tool compounds with the desired effect (i.e., correction of the improper folding) are known, no control compound for comparison of the test samples was available. In the initial analysis of the screening results, hits were selected if they enhanced the intensity of a fluorescent staining of the CFTR protein above a certain threshold. Hence, only a single image readout was used to detect hits, and other changes, such as the localization of the stain within the cells or the cell morphology, were neglected.
To analyze the compound responses beyond just the single preselected readout, we employed a multivariate description to group compounds using an SOM. To illustrate the properties of the 2-dimensional SOM, we also projected the samples to the first two principal components of a commonly used principal component analysis (PCA). The biological response of the respective SOM groups will be discussed based on the acquired images as well as whether active compounds detected by the standard univariate analysis are detected by the SOM as well. Moreover, the similarity of the chemical structures within the SOM groups was analyzed.
Material and Methods
High-Content Screening Assay
The CHO 4S-Tag ΔF508 CFTR cells were licensed from Ron Kopito (Stanford University, Stanford, CA). Expression of the 4S-Tag ΔF508 CFTR gene was under the control of a tetracycline-inducible promoter. CFTR was tagged in the first extracellular loop with four copies of an S peptide from the N-terminus of bovine RNase A (S-Tag, KETAAAKFERQHMDS). The cells were seeded in 384-well microtiter plates in 25 µL medium containing 1 µg/mL tetracycline, thus inducing CFTR expression. The cells were cultivated at 37°C with 5% CO2 and 95% relative humidity overnight. Then, 5 µL compound solution was added, resulting in a 10-µM solution, and cells were incubated with compounds for a further 2 days. After incubation and addition of the primary mouse anti-S-tag antibody, cells were fixed with paraformaldehyde (PFA) and washed. The secondary antibody (goat antimouse IgG Alexa Fluor 488; Invitrogen, Carlsbad, CA) was applied simultaneously with a solution of DRAQ5, which predominantly stains the cell nucleus but also, to a much lesser degree, the cell cytoplasm.
Image Acquisition and Analysis
The plates were imaged using the IN Cell Analyzer 3000 (GE Healthcare, Piscataway, NJ). Two images per well were acquired with a 40× objective of the instrument.
For the standard hit identification, hits were identified using a univariate readout obtained from the object intensity module, OBI1, from IN Cell Analyzer 3000 software. Cells were detected based on the nuclear stain, and a cytoplasmic region was defined as a ring around the nuclei. The mean intensity of the antibody staining of the CFTR protein within the ring region was measured and averaged over the imaged cell population. Hits were then selected based on this intensity measurement. To validate the hits selected by this univariate measure, we confirmed hits in the same assay in dose response at eight concentrations with four replicates at each concentration. The set of compounds that displayed a concentration-dependent response in this validation experiment is referred to as “validated compounds.”
To obtain a multivariate description of imaged cells, we used the Cellomics BioApplication (module “Morphology V3”; Cellomics, Pittsburgh, PA). Besides its high staining intensity of the nucleus, DRAQ5 also stains the cytoplasm at lower levels. It was therefore possible to use this background staining to define the cells and their cytoplasmic borders. Nuclei within the cells were determined as regions within the cells with high DRAQ5 intensity. Readouts describing the shape of the cells (11 readouts) and nuclei (7 readouts) were derived from the images. Total and average intensity of the DNA stain (DRAQ5) were determined within the nuclei. The intensity, as well as the distribution and texture of the antibody staining, was measured in the cytoplasmic region using 15 parameters. In total, 35 parameters were measured on each single cell (
Data Analysis
The cell population of each sample was summarized using the median value of each image readout. To check for pipetting errors or edge effects, we visually inspected the results by plotting heatmaps of each image readout. Parameters directly related to reagent amounts (i.e., total and average stain intensities) exhibited a stripe pattern on some plates. Therefore, these image readouts were corrected for systematic errors as follows. Well-to-well variations were modeled for each plate separately using the median polish method: The values of each particular well were multiplied by a correction factor such that the differences of the row- and column-wise medians were minimized (cf. Gubler 13 for a detailed description of the algorithm). The row and column medians were used in this method as the median values were more robust and less influenced by outliers as compared with mean values. If the plate samples required more than 20% correction, the plates were retested to ensure data quality. Plate-to-plate variation was corrected by normalizing the wells on each plate to the median of all wells on the respective plate. Values were standardized with the median and median absolute deviation of untreated samples pooled from all plates. Compounds that reduced the number of cells by 70% compared with untreated samples were assumed to be cytotoxic and eliminated from further analysis.
For each sample, the Mahalanobis distance to the untreated samples was calculated using a robust estimate of the correlation matrix (orthogonal quadrant correlation estimator), and the median of the untreated samples was pooled from all plates. This distance measure is a Euclidean distance that takes the variability of the samples into account. The calculation of the covariances assumes normal distribution, which does not strictly hold true in our case. Nevertheless, we prefer to apply this distance measure because it weights a distance in a direction with low variability more than the same Euclidean distance in a direction where the variability is high. The 521 compounds with the most pronounced responses (i.e. the 5% of the compound samples having the highest Mahalanobis distance) were then subjected to further analysis (
PCA was performed on the biological results obtained for the 5% of selected compounds. The two first principal components used for 2-D visualization covered 58% of the total variance. The parameter contributing most to the first principal component (PC) was a readout on cell convexity (“ObjectConvexHullPerimeterRatioCh1”), whereas a readout on the total DNA staining in the nucleus (“MemberAvgTotalIntenCh2”) had most weight in the second PC. However, the intensity of CFTR staining (“TotalIntenCh3”) also had a significant contribution to the second PC (
In the SOM clustering, samples were mapped onto a 10-by-10 rectangular, nontoroidal grid of neurons. The neurons were trained by presenting the data 100 times with a learning rate linearly decreasing from 0.05 to 0.01. A square neighborhood was assumed with a decreasing neighborhood radius starting to cover two-thirds of the closest neurons. During this training procedure, convergence was reached as the mean distance of a sample to a neuron did not change significantly for the last 30 runs (
YFP-Based Halide Indicator Assay
CFTR function was assayed in a doubly transfected cell line that expresses wild-type or mutant CFTR together with a yellow fluorescent protein (YFP)–based halide sensor. 14 Quenching of the YFP fluorescence reflects iodine influx, and kinetics can be monitored using imaging assays. The assay was performed in 384-well plates with 2500 cells/well. The restored function of the CFTR channel was assessed after a 24-h compound incubation. Forskolin stimulation (10 µM, 5 min) followed by NaI injection (final concentration 67.5 mM) resulted in channel activation and CFTR-mediated YFP quench, respectively.
Results and Discussion
High-Dimensional Data Visualization Using SOM
In this work, results from a primary HCS hit-finding campaign were analyzed using SOMs. To focus on the samples that actually show a phenotypic response, we filtered 521 from the original set of 10 921 compounds of the screening set based on their high Mahalanobis distance (i.e., high dissimilarity to neutral controls). This remaining set was clustered on a 10-by-10 rectangular grid of nodes (i.e., clustering using SOM was performed). The similarity measure of the samples used for SOM clustering was based on all 35 image readouts, including morphology features of the cells (cf.
To evaluate the SOM visualization, we chose to compare it with PCA as this method is widely used, by biologists, to map and visualize high-dimensional data on a 2-D plane. Five groups of samples were labeled with the same colors on the PCA projection and SOM, respectively (

Visualization of the self-organizing map (SOM) with a 10-by-10 rectangular grid. (
In general, there is agreement between the clustering of samples by PCA and SOM. The samples from selected SOM nodes are usually located in the same region in the PCA projection. Also, validated compounds clustering in neighboring SOM nodes are in the same region in the PCA projection. Besides the general agreement of PCA projection and SOM, there are cases in which samples that are projected closely with PCA are not mapped to the same or neighboring SOM nodes. One example is the sample labeled in orange in
Another example for discrepancy between PCA and SOM mapping is the set of three red-labeled samples that are clustered in one node (9-3 [nodes are referred to by their x-y coordinates in
Fig. 1
]) on the SOM (“red granules”). The images show that the phenotypes of these samples are similar and show an aggregation of the DRAQ5 stain in the cytoplasm (
In summary, SOM and PCA correlate to a large extent as compounds grouped together in one SOM node are co-localized on the plane spanned by the first two principal components of the PCA projection. However, SOM was able to discriminate between distinct phenotypes that could not be discriminated on the 2-D PCA projection. This advantage is due to the ability of SOM to nonlinearly project data onto a 2-D plane. Other nonlinear mapping techniques (e.g., multidimensional scaling) would also feature this advantage. In any case, it has to be accepted that the actual distances based on a high-dimensional descriptor cannot perfectly be reflected on 2-D visualization. Other clustering techniques, such as k-means or hierarchical clustering, are potential alternatives. We, however, preferred SOM as the number of clusters does not have to be selected a priori as is the case for k-means clustering.
Besides the comparison with PCA, the SOM clustering was also evaluated by analyzing chemical structure similarity of compounds clustered together in a node.
However, it has to be noted that repeated SOM clustering with randomized initialization usually leads to different mapping of the clusters, and therefore samples may be clustered differently. However, we found that samples with the same pronounced phenotype (i.e., samples with high Mahalanobis distance;
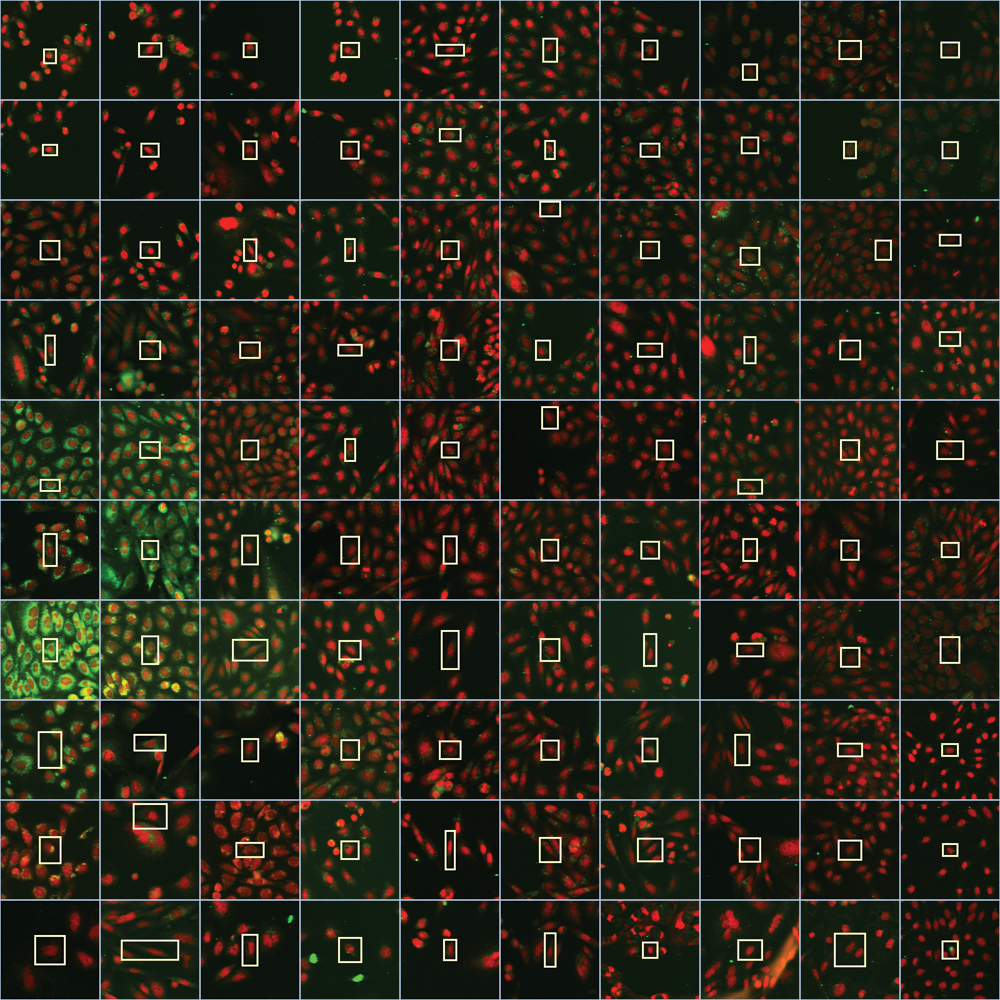
Visualization of the self-organizing map (SOM) by representative images. For each SOM node, a cell close to the SOM group’s center is displayed. First, the sample being closest to the group’s center is determined, with the cell within this sample identified being closest to the center. A section of the whole image is shown containing the representative cell highlighted by the surrounding box.
The Mahalanobis distance has also another function in this analysis. It was used to keep only interesting compounds (i.e., compounds showing a different phenotype than untreated samples). If a smaller number of samples were clustered on the same SOM grid, more nodes were available to resolve their differences. If all samples were clustered, most nodes were used to resolve the rather small distances among the majority of samples, resulting in lower resolution of the differences (
Visualization Using Representative Images
To intuitively explore the responses observed in the screen, we visualized each SOM node with a representative image ( Fig. 2 ). The sample closest to the centroid of all samples in the respective node was determined, with only a section of the acquired image shown, allowing us to inspect the images better. The cell closest to the sample centroid is centered in the displayed image section and highlighted with the bounding box. Without having to analyze and understand the underlying image readouts, the biologist can interpret the results based on experience and knowledge by visualization of the most representative images in the SOM nodes.
For example, one SOM cluster displayed enlarged cells in the lower left corner (SOM node: 1,1), which potentially could be due to blocking the cell cycle by compound treatment. This hypothesis is supported by the observation that these compounds are representatives of a class annotated to target Cdk1, which is involved in the cell cycle. Or, apoptotic cells are seen in the upper left region. More interestingly in the context of the CFTR screening campaign, in the SOM representation, the groups containing potential CFTR correctors are immediately identified in the middle left part of the SOM as the cells have an enhanced CFTR antibody staining in green.
Hence, this representation is able to give a quick overview of responses evoked by compound treatment. Diverse and unanticipated responses could be identified. The analysis was not restricted to a set of preselected image readouts and samples not only selected as hits if they resembled the response of the control compounds. Instead, SOM nodes that revealed a high Mahalanobis distance identified groups of compounds that display similar effects on the cells.
Hit Selection Performance: Additional CFTR Trafficking Correctors
To evaluate the performance of the SOM strategy with respect to hit identification, we compared it with the standard univariate hit identification procedure. The set of compounds selected as hits in the standard procedure and validated by showing a concentration-dependent response are referred to as “validated hits.”
Validated hits, based on the hit selection by univariate readout, localized in one region of the SOM (
Fig. 3
). These hits appeared in the visualization of the SOM map due to their brighter green staining (
Fig. 2
). Picking these groups to identify hits would have covered all the validated hits from the standard univariate analysis, confirming the applicability of SOM for hit identification. Interestingly, additional compounds were mapped into these nodes, suggesting that these could be potential trafficking correctors. Based on visual inspection of the respective images, 10 additional compounds were selected and tested for enhanced ion transport across the membrane of cells expressing a mutant form of the CFTR protein. In this functional YFP-halide sensor assay, 5 of 10 compounds showed a positive effect
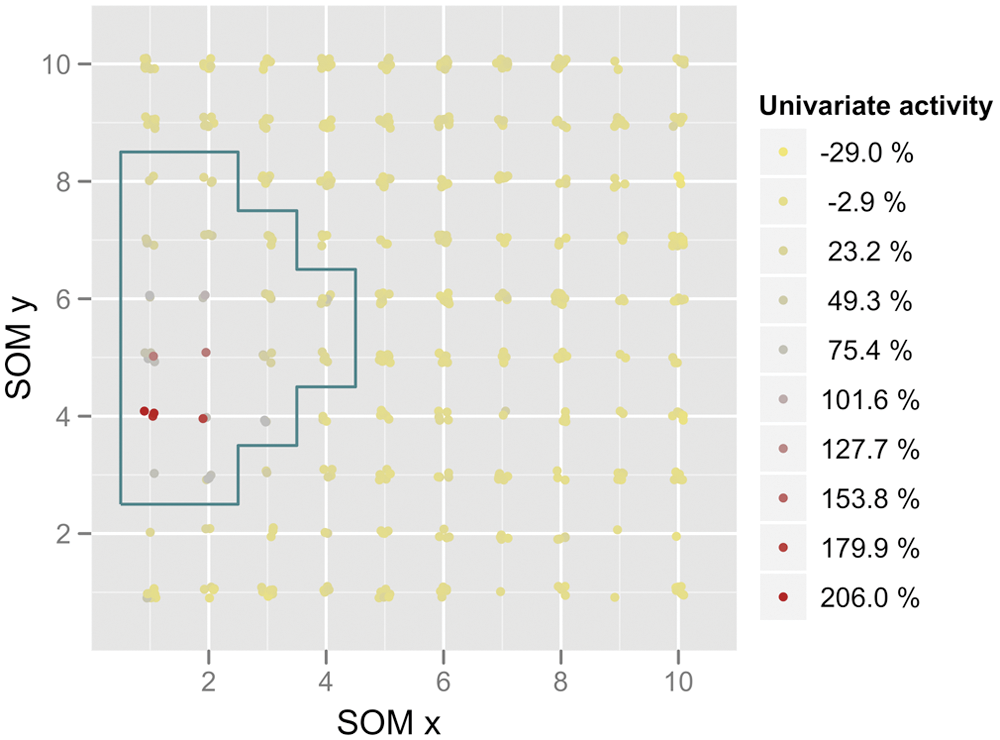
Self-organizing map (SOM) activity. The samples mapped on the SOM are labeled according to their activity as determined by the univariate analysis. Coloring based on activity in the univariate fluorescence intensity increase of cystic fibrosis transmembrane conductance regulator (CFTR) antibody staining. Samples with high univariate activity (red label) are clustered on a subpart of the SOM. Framed samples indicate the selection for hit picking.
The additional hits even had different chemical structures. For example, two hits that showed response in the functional assay were structurally different (maximal Pearson correlation of 0.39 and 0.43, using radial distribution function compound descriptors) from any of the compounds validated in the univariate analysis (see
In addition to the work presented in this report based on the visualization of primary screening results, we explored the ability of univariate and multivariate analysis to identify hits. A manual analysis of all 10 parameters calculated for the univariate analysis was sequentially conducted to identify hits. This was then compared with hits selected using the SOM multiparameter hit list. The validation rate of the hits selected using the multiparametric SOM analysis was much higher than that achieved by the univariate hit rate (40% validation vs. 20%). Furthermore, the automated analysis was much less tedious and time-consuming (data not shown) than the manual selection process.
In summary, we evaluated self-organizing maps to visualize and analyze phenotypic responses as determined by high-content analysis. The image-based visualization of diverse phenotypes facilitates the non-control-based analysis of screening results. But also, in case (multiple) controls are available, one can visualize their response based on similarity or dissimilarity on such visualization. If their mode of action or target is known, this information helps to annotate the clusters or regions on the map. In a broader perspective, such clustering or mapping methods may also have value in early toxicity studies, as it will allow a more comprehensive evaluation of possible compound effects on cellular physiology and not just those that have previously been identified. Similarly, a potential application could also be to use SOM for clustering single-cell data and for visually assessing whether subpopulations are present in a sample. It has already been shown to determine cell cycle subpopulations by k-means clustering. 1 SOM could be an alternative in cases in which the number and kind of subpopulations are not known a priori.
Footnotes
Acknowledgements
The authors acknowledge Ron Copito and Martin Gosling for cell line generation and previous assay development. Hanspeter Gubler and Martin Beibel assisted with fruitful discussions.
Declaration of Conflicting Interests
The authors declared no potential conflicts of interest with respect to the research, authorship, and/or publication of this article.
Funding
AK was funded as a postdoctoral fellow by the NIBR Education Office.
References
Supplementary Material
Please find the following supplemental material available below.
For Open Access articles published under a Creative Commons License, all supplemental material carries the same license as the article it is associated with.
For non-Open Access articles published, all supplemental material carries a non-exclusive license, and permission requests for re-use of supplemental material or any part of supplemental material shall be sent directly to the copyright owner as specified in the copyright notice associated with the article.