
Abstract
The tedious sample preparation for flow cytometry limits the throughput and thus its usage as a primary screening method despite its sensitivity and accuracy. With the growing focus on utilizing antibodies as a therapeutic modality in drug discovery, it is critical to develop a high-throughput flow cytometry (HTFC) workflow to cope with the increasing need to support antibody discovery programs. We have developed a seamless HTFC sample preparation and readout workflow using the HighRes modular robotic system and the IntelliCyt iQue Screener PLUS. To fully utilize the advantages offered by flow cytometry, we typically multiplex multiple cell lines of interest in one well to simultaneously quantitate on-target activity and nonspecific activity along with measurement of antibody concentration. The ability to measure multiple parameters coupled with speed and increased accuracy provides gains in productivity and helps speed up antibody lead discovery.
Introduction
Biologics are becoming critical modalities in drug discovery, especially monoclonal therapeutic antibodies, not only in the areas of inflammation and autoimmune disease, but also in cancer treatment. 1 The emerging therapeutic strategies of utilizing antibodies include antibody drug conjugates (ADCs), 2 bi-specific antibodies to engage effector cells with target tumor cells, 3 CAR-T approaches to engineer T cells to target specific tumor cells, 4 and checkpoint blockade antibodies. 5 All these approaches rely on identifying a specific antibody binding sequence as their first step. No matter which platform is used to generate antibodies to the targets of interest, phage display, yeast display, Escherichia coli display, or the Trianni mouse platform,6–9 it is important to develop a high-throughput antibody screening platform. Traditionally, an enzyme-linked immunosorbent assay (ELISA) has been the most popular method to screen binders from hybridoma supernatants. Although on-cell binding assessment is more physiologically relevant, conventional flow cytometers, which are limited in their data acquisition and management abilities, are not amenable to automation and face many challenges to achieve the throughput required to screen for binders directly from supernatants. 10
Flow cytometry has been widely used for small-scale research, such as characterizing cell activation markers and profiling cell types. The University of New Mexico started establishing the high-throughput sampling unit, and IntelliCyt has further developed it into a full-fledged high-throughput unit called the iQue Screener that is capable of supporting the needs of drug discovery. This high-throughput flow cytometer is capable of acquiring high-quality data at fast speeds utilizing low sample volumes and is also capable of in situ processing and management of large quantities of data.11–13 We recently acquired an iQue Screener PLUS with a violet/blue/red laser configuration and up to 13 fluorescence parameters for building our high-throughput flow cytometry (HTFC) workflow to support the needs of Takeda’s growing large-molecule programs.
The typical sample preparation workflow for flow cytometry involves cell/sample preparation, adding primary antibodies, adding secondary antibodies, and multiple rounds of washes and centrifugation in between steps. This lengthy sample preparation is another factor limiting the utility of flow cytometry for high-throughput applications. If we were to automate this procedure to achieve a higher throughput, it would require an enabling technology, an integrated automation system that is equipped to handle the multiple types of instrumentation required for the various steps. The HighRes (Beverly, MA) robotic system provides an integrated, flexible, and modular solution to laboratory automation, along with a dynamic scheduling system. 11 Most of the automated instruments, like washers and centrifuges, establish communication with the HighRes system via the instrumentation application programming interface (API) and driver in Cellario, the controlling software. We decided to reconfigure a six-sided MicroStar system (HighRes) that we had utilized previously for cell viability-based combinatorial library screen to meet the requirements for HTFC sample preparation. The implementation of this automation system not only increases the throughput by taking care of the tedious procedure, but also provides precise control for the timing of each step to have more consistent and robust results from plate to plate and from run to run.
Recently, HTFC has been deployed for several high-throughput applications in drug discovery. The Genomics Institute of Novartis Research Foundation has built a fully automated flow cytometry sampling workflow that is compatible with 1536- or 384-well plates for human hematopoietic stem cell self-renewal screen. 14 Another HTFC-based screen was conducted to look for selective ATP-binding cassette subfamily G member 2 efflux inhibitors. 15 AstraZeneca has also deployed HTFC in their workflow in a variety of assays, 16 such as screening of GTPases and T-reg phenotypic screen. The HTFC system we have built here will mainly be utilized for antibody generation screening. We have developed on-cell binding assays in various formats to cope with the challenges in screening antibody clones or purified antibodies. We typically multiplex multiple cell lines of interest in one well to simultaneously quantitate on-target activity and nonspecific activity, along with measurement of antibody concentration. In addition, we incorporated the in-house high-density freeze–thaw ready-to-use cell platform with HTFC workflow to not only simplify the workload for screening but also guarantee batch-to-batch consistency. Overall, we are able to support various flow-based assays, including on-cell binding, competition binding assay, and cytokine quantitation. This HTFC system provides us the advantages of ease of use, miniaturized sample volume, and robustness for facilitating the discovery of antibody therapeutics and beyond.
Materials and Methods
Cells and Reagents
All cell culture experiments were performed in compliance with tissue culture guidelines in tissue culture hoods and humidified tissue culture incubators at 5% CO2 and 37 °C. Cell culture medium was purchased from Thermo Fisher (Waltham, MA): DMEM (cat. 11995-040) and RPMI 1640 (cat. A10491-01). Fetal bovine serum (FBS) was from Sigma-Aldrich (St. Louis, MO, cat. F2442-100 mL). Phosphate-buffered saline (PBS) was made by Takeda’s in-house reagent facility. The cell line used for primary screening, Expi293F, was purchased from Thermo Fisher and grown in the optimized medium suggested by the manufacturer. Parental cell lines were used for eliminating nonspecific binders in the screen. Target-overexpressing cells were either transiently transfected or developed as stable cell lines in-house. An endogenous cell line, NALM-6, growing in RPMI with 10% heat-inactivated FBS, for follow-up screening and purified antibody affinity assessment, was purchased from DSMZ (Braunschweig, Germany). The P3X63Ag8U.1 mouse myeloma cells for hybridoma fusion were obtained from ATCC (Rockville, MD). Secondary antibodies were purchased from Jackson ImmunoResearch Lab (West Grove, PA), including anti-human immunoglobulin G (IgG) Fcγ specific (cat. 109-605-098), anti-mouse IgG Fcγ specific (cat. 115-606-071), and anti-mouse IgG Fcγ (1+2a+2b+3) specific (cat. 115-606-164). All chemicals for making buffers were purchased from Sigma-Aldrich. Ninety-six-well V-bottom plates (Costar 3894) were from Corning (Corning, NY) and 384-well V-bottom plates (cat. 781280) were from Greiner (Kremsmunster, Austria). Anti-mouse IgG capture beads were simply cellular from Bangs Lab (Fishers, Indiana).
Generation of Stable Target-Expressing Cells for Immunization
HEK293T cell line (ATCC, cat. CRL-11268) was grown in DMEM medium supplemented with 10% FBS at 37 °C and 5% CO2. Murine pre-B lymphocyte cell line, 300-19 (purchased from Dr. Naomi Rosenberg’s Lab, Tufts University), was grown in RPMI 1640 medium supplemented with 10% FBS, and 50 µM 2-ME (Thermo Fisher, cat. 21985-023). Lentiviruses were produced by transfecting HEK293T cells with pLenti6.2C-V5-DEST vector containing the full-length gene of interest together with Sigma Mission Lentiviral Packaging Mix (Sigma-Aldrich, cat. Sigma SHP001-1.7ML) by using a Fugene 6 transfection reagent (Promega, cat. E269A) according to the manufacturer’s protocol. Sixteen hours posttransfection, the culture medium was replaced with fresh growth medium. The culture medium containing virus was collected 48 h after transfection and then precleaned with a 2000g centrifuge and a 0.45 µm filter unit (PALL Life Sciences PN, cat. 4614). 300-19 cells cultured in the growth medium were transduced with the viral packaging supernatant in the presence of 2 µg/mL polybrene (Sigma-Aldrich, cat. 107689-10G). The culture medium was replaced with fresh growth medium containing 1.5 µg/mL puromycin (Thermo Fisher, cat. A11138-03) 3 days after incubation. Puromycin-resistant pooled cells were maintained in the selection medium for 10 days and evaluated by FACS analysis.
Flow Cytometry-Based On-Cell Binding Assay
The cells, either collected from fresh culture or thawed from frozen stock, were washed and resuspended in cold FACS buffer (PBS + 2% FBS) at the desired concentration. It is typical to have cells at 1 million/mL to incubate with primary antibodies for 30 min at 4 °C in a 30 μL volume in a 384-well plate. After this, three rounds of washing using cold FACS buffer were performed to remove extra primary antibody. Then 30 μL of secondary antibody was added to each well and the plates were shaken on an orbital shaker to ensure proper mixing. The secondary antibody is goat anti-mouse or human IgG Fcγ specific conjugated with Alexa 647 based on the primary antibody tested. After 30 min of incubation at 4 °C, the plates were washed twice with FACS buffer and then resuspended in 10 µL/well for final sample acquisition unless otherwise noted. The protocol could be operated manually or on an automated system and was more specifically for sample to be read on iQue Screener PLUS (IntelliCyt, Albuquerque, NM). Data were directly analyzed using ForeCyt software (IntelliCyt). In some experiments, the labeled cells were run on a FACS Canto (BD, Mountain View, CA) and were analyzed using FlowJo software (Tree Star, Ashland, OR).
ELISA
The ELISA was performed in 384-well plates (maxi-sorb, thermo). Plates were coated with recombinant target protein of 3 μg/mL in 25 µL of coating buffer (50 mM Na2CO3 and NaHCO3, pH 9.6) per well at 4 °C overnight. The recombinant protein concentration was determined by titration using positive antibodies. Sixty-five microliters of blocking buffer (PBS with 1% bovine serum albumin [BSA]) was added to each well on the next day and incubated at room temperature for 2 h. After washing twice with PBS, 20 µL of diluted hybridoma medium (the dilution of hybridoma supernatant was determined empirically for each antibody campaign; if overconcentrated supernatant was tested, more false positives would be identified due to the saturation issue) was added to each well and incubated for 1 h, followed by washing with PBS three more times and a 1 h incubation with horseradish peroxidase (HRP)-conjugated anti-mouse secondary antibody (Jackson ImmunoResearch Lab, goat anti-mouse, cat. 115-036-071, 115-035-208, and 115-036-164, mixed together at a final 1:5000 dilution in PBS with 0.5% BSA). At the end of the incubation, plates were washed with PBS and the reaction was allowed to run for another 15 min after addition of 25 µL of TMB (Thermo Fisher) to allow for color development. The reaction was stopped using 25 µL of 0.5 N HCI after color development. The absorbance at the wavelength 450 nM was acquired on the PHERAStar (BMG LABTECH, Ortenberg, Germany).
Generation of Monoclonal Antibodies and Hybridoma Preparation
Hybridoma cell cultures for the targets of interest were generated in-house in a 96-well format. The antibodies were generated by immunizing mice with recombinant protein or cell lines as previously described. 17 Briefly, 20 µL of 0.25 mg/mL recombinant protein or 1 × 10⁷ target-expressing 300-19 cells mixed 1:1 with adjuvant were injected. The lymphoid cells or splenocytes from the mice showing high plasma titer were fused with P3X63Ag8U.1 mouse myeloma cells following standard procedures. 18 The fused cells were cultured in HAT (hypoxanthine-aminopterin-thymidine)-supplemented medium to eliminate the unfused myeloma cells.
After a period of time in culture, the hybridoma supernatants were collected for screening to identify positive clones. Using the Lynx1200 (Dynamic Devices, Wilmington, DE) with volume-verified pipetting (VVP) technology, we removed supernatants in the 96-well cell plate utilizing liquid-level detection to ensure that the tips do not touch the cells that have settled at the bottom of the well, and transferred them into a 384-well plate format for further assays. All 96 samples were detected and dispensed individually at the same time. Four 96-well cell plates were reconciled into one 384-well plate.
Purified Antibody Dilution Preparation
Purified antibody clones were stored in two-dimensional barcode tubes in the Arktic (TTP Labtech, Cambridge, MA) at −80 °C. Serial dilutions for a 384-well assay plate were carried out on the Lynx1200 with a VVP 96 head. The initial top concentration was set up and dispensed into columns 1 and 13 by hand. The instrument was programmed to dispense the diluent into the entire diluting plate first, using the VVP 96 channel. The dilution started from column 1 or 13, where the VVP 96 head picked up a column of tips and aspirated a specified volume from the user input at the beginning of the procedure and dispensed it into the next column, followed by a mixing step. It repeated the cycle for a 10-point titration.
Cell Labeling and Freezing
Suspension cells were collected from the tissue culture flask directly. To freeze down cells, the collected cells were spun down at 1200 rpm for 5 min in conical tubes. The extra medium was aspirated, and the cells were resuspended using CellBanker2 (amsbio, Cambridge MA) at 10 million cells/mL. The cell suspension was then transferred into cryo-vials to be placed in −80 °C for short-term storage. For long-term storage, the cryo-vials were transferred into a liquid nitrogen tank. To label cells with specific dye, the collected cells were washed once with PBS to remove extra serum. Then the washed cells were labeled using CellTraceViolet (Thermo Fisher) as per the manufacturer’s instructions. The concentration of specific dye for labeling was optimized individually for different cell types.
Evaluation of Antibody Kinetic Properties
Surface plasmon resonance (SPR) experiments were performed using a Biacore 3000 instrument (GE Healthcare, Boston, MA) equipped with a CM5 sensor chip. Immobilization of the sensor chip involved the binding of anti-human IgG (Fc) antibody to the chip surface via amine coupling chemistry. To collect kinetic binding data, one antibody was captured over a designated active flow cell (Fc2, Fc3, or Fc4) at 10 µg/mL for 1 min. Fc1 was used as the surface control. Protein analyte, at 200 nM, was injected over all four flow cells at a flow rate of 30 µL/min. The analyte was allowed to associate and dissociate for 3 and 5 min, respectively. An anti-human IgG (Fc) surface was regenerated by a 30 s injection of 3 M magnesium chloride at a flow rate of 20 µL/min in order to prepare the surface for the next cycle. The antibody capturing level was about 100–450 RU depending on the antibody clone. For data analyses, a 1:1 Langmuir fitting model was applied, which is available within the BiaEvaluation software. All measurements were performed at 25 °C. The running buffer used was HBS-EP+ containing 0.01 M HEPES, 0.15 M NaCl, 3 mM EDTA, and 0.05% v/v surfactant P20.
Data Analysis
Data were plotted using GraphPad Prism (La Jolla, CA) and TIBCO Spotfire (Palo Alto, CA). Some dose–response curves were fitted using the nonlinear fit model of log (agonist) versus response—variable slope (four parameters). The EC50 and Emax in the purified antibody affinity assessment were analyzed using a four-parameter smart fit in Genedata Condoseo (Basel, Switzerland). The dot plots and histograms for flow cytometry data were from ForeCyt.
Results and Discussion
HTFC Automation Protocol Development
Previously, our workhorse flow cytomter was a FACSCanto that supported screening in a 96-well format along with manual sample preparation, all of which limited our throughput for performing large-scale antibody screens. To start developing an HTFC workflow, we first acquired a iQue Screener PLUS (iQue) to take advantage of its acquisition speed, sample miniaturization, and plate-based data management. Second, we needed to automate each step of the sample preparation workflow to achieve a reasonably high throughput utilizing the six-sided HighRes system.
First, we ran a 96-well on-cell binding experiment on both iQue and FACSCanto to compare and validate iQue. Compared with at least 1 h/plate (~2000 cells/well) on FACSCanto, we were able to obtain data using 1 s (~200 cells/well) and 4 s (~800 cells/well) sip times on iQue at acquisition times of 6 and 13 min/plate, respectively. Further, not only did the data acquired looking at the titration of five antibodies yield comparable results for iQue using 1 s and 4 s sip times ( Fig. 1A ), but also they were in good agreement with the data obtained on FACSCanto ( Fig. 1B ). To develop the assay in the 384-well format on iQue, we first evaluated a series of cell titrations and obtained linearity between counted cells and originally seeded cells in the range of 100–3000 cells/µL ( Fig. 1C ). We could run a 384-well plate in 20 min with intermittent shaking and clean/wash every 12 wells. All these experiments indicated that the iQue was capable of running small volumes that represent the whole sample in a well at high speeds and also of generating reliable data from well to well.
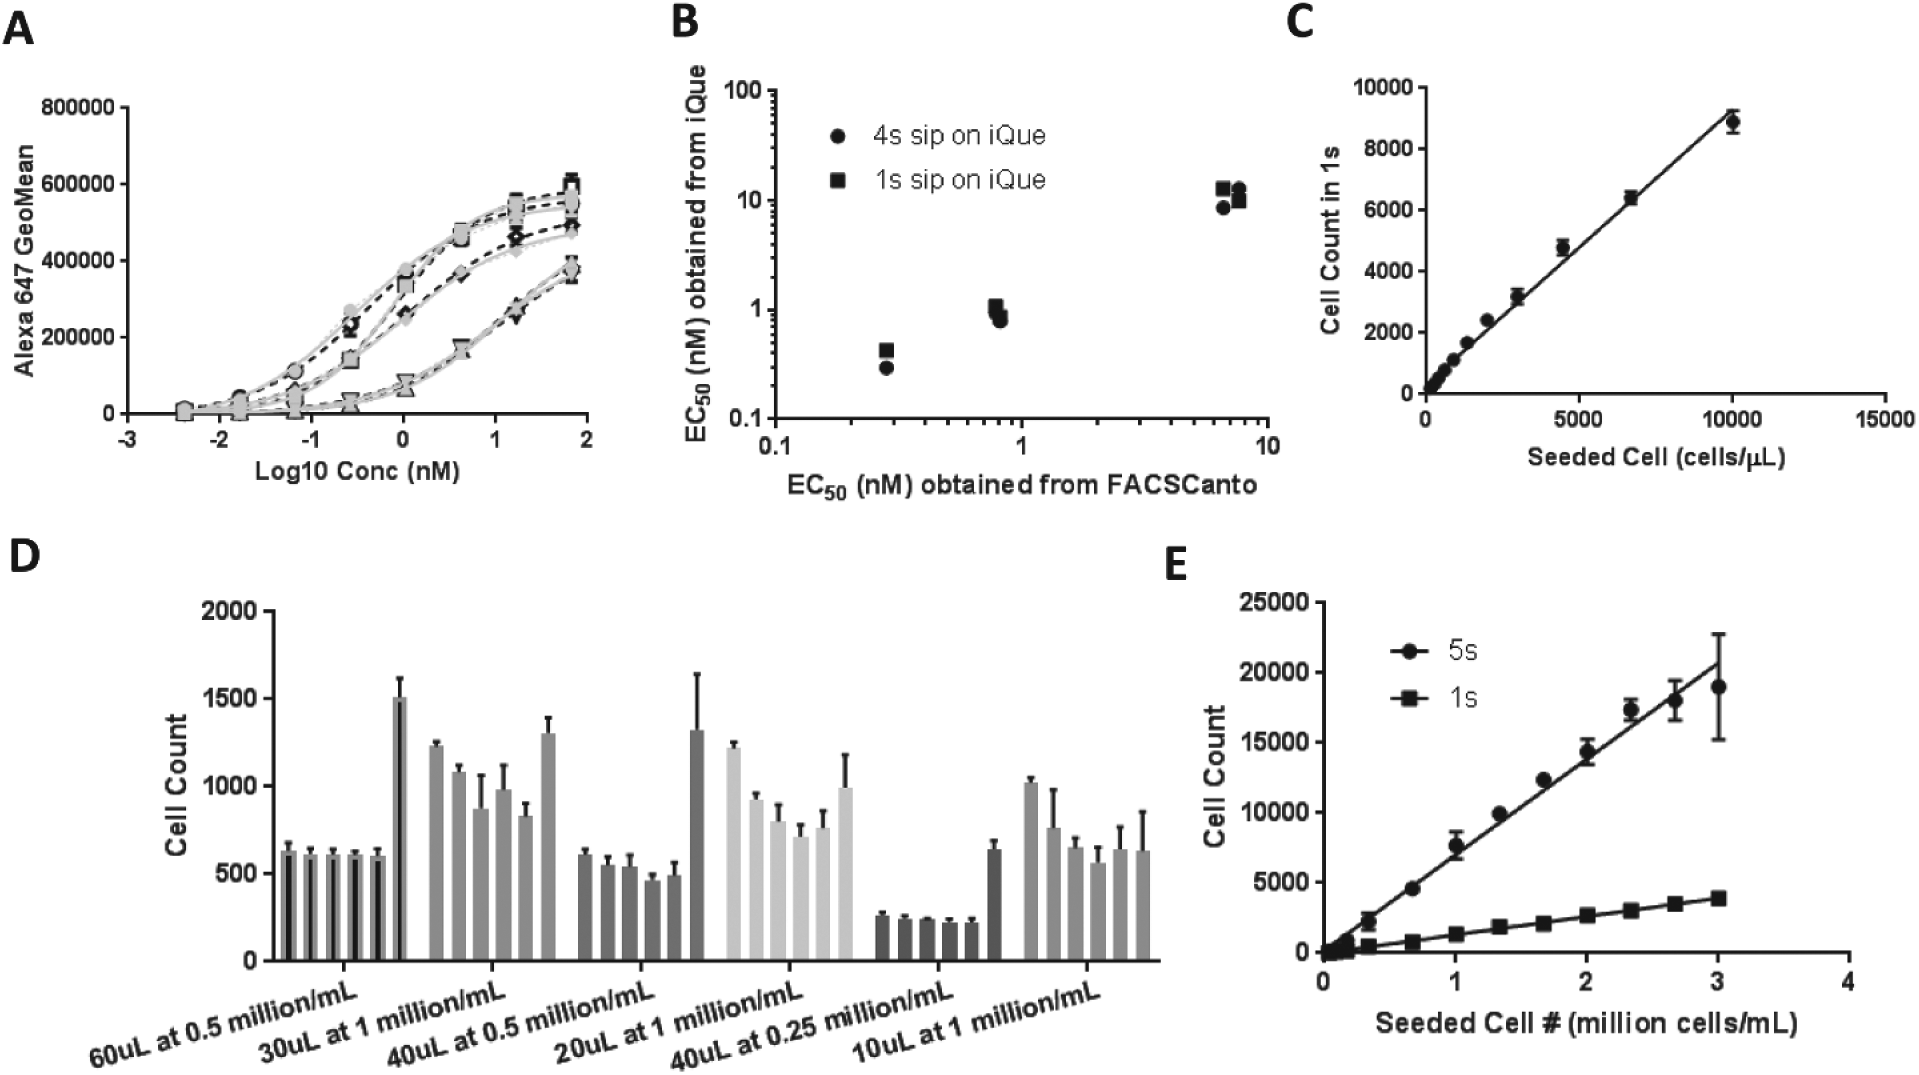
Validation of iQue Screener PLUS and optimization of an automated FACS assay. (
After we had validated iQue, we then started to automate the sample preparation step for on-cell binding assays. The typical workflow for such an experiment involves the addition of antibody, centrifugation, and multiple wash steps. The most critical step in this process is to minimize cell loss during the centrifugation and aspiration wash steps. After several rounds of optimization, we determined that centrifugation at 150g for 30 s on the V-spin centrifuge (Agilent, Santa Clara, CA) was sufficient to spin down most cell types. The aspiration height setting in the EL406 washer (BioTek, Winooski, VT) varied according to the size of the cells, and we had to ensure that the aspiration tip did not affect the cell pellets at the bottom while efficiently removing the supernatant. To optimize the working cell concentration and volume, we tested various combinations, as shown in Figure 1D , counting the cell number on iQue both prewash and after each wash. The starting cell concentration or total cell number did not affect the results. However, it was important to keep the wash volume greater than 30 µL to avoid significant loss of cells. We finally decided to choose 60 µL at 0.5 million cells/mL as a working condition for washing. Figure 1E shows that the linearity between seeded cells and counted cells still holds after five rounds of washing using the optimized working conditions.
A large number of cells are required for a primary antibody screen, for example, 140 million cells for 4000 antibody clones, if we use 30 µL of 1 million/mL in one well. It would take a lengthy time to prepare enough fresh culture cells on the day of screening. To shorten assay preparation time and keep consistency of cell quality from run to run, we have established a freeze–thaw ready-to-use cell platform. Most of the antigens on the cell surface were not affected by the freeze–thaw procedure, and the cells were usually 95% viable. The cells could be frozen in high-density formats to ease handling procedures. Fresh and frozen cells showed comparable dose–response curves of selected purified antibodies for stably overexpressed cell lines ( Fig. 2A ) and endogenous cell lines ( Fig. 2B ). The roughly 30% drop in maximal binding in the frozen cells compared with the fresh cells in Figure 2A indicated that there might be reduction in antigen density in this cell line after the freeze–thaw cycle; however, this still provided a sufficient signal window for screening. Also, frozen cells showed consistent binding curves on two independent occasions for this transiently overexpressed cell line ( Fig. 2C ). The target expression was more homogenous for stably overexpressing ( Fig. 2D ) and endogenous cell lines ( Fig. 2E ) but much more heterogeneous in transiently overexpressing cell lines ( Fig. 2F ), as shown in the histograms comparing positive and negative controls. All these cell types could be used in on-cell binding assays to screen antibody clones.
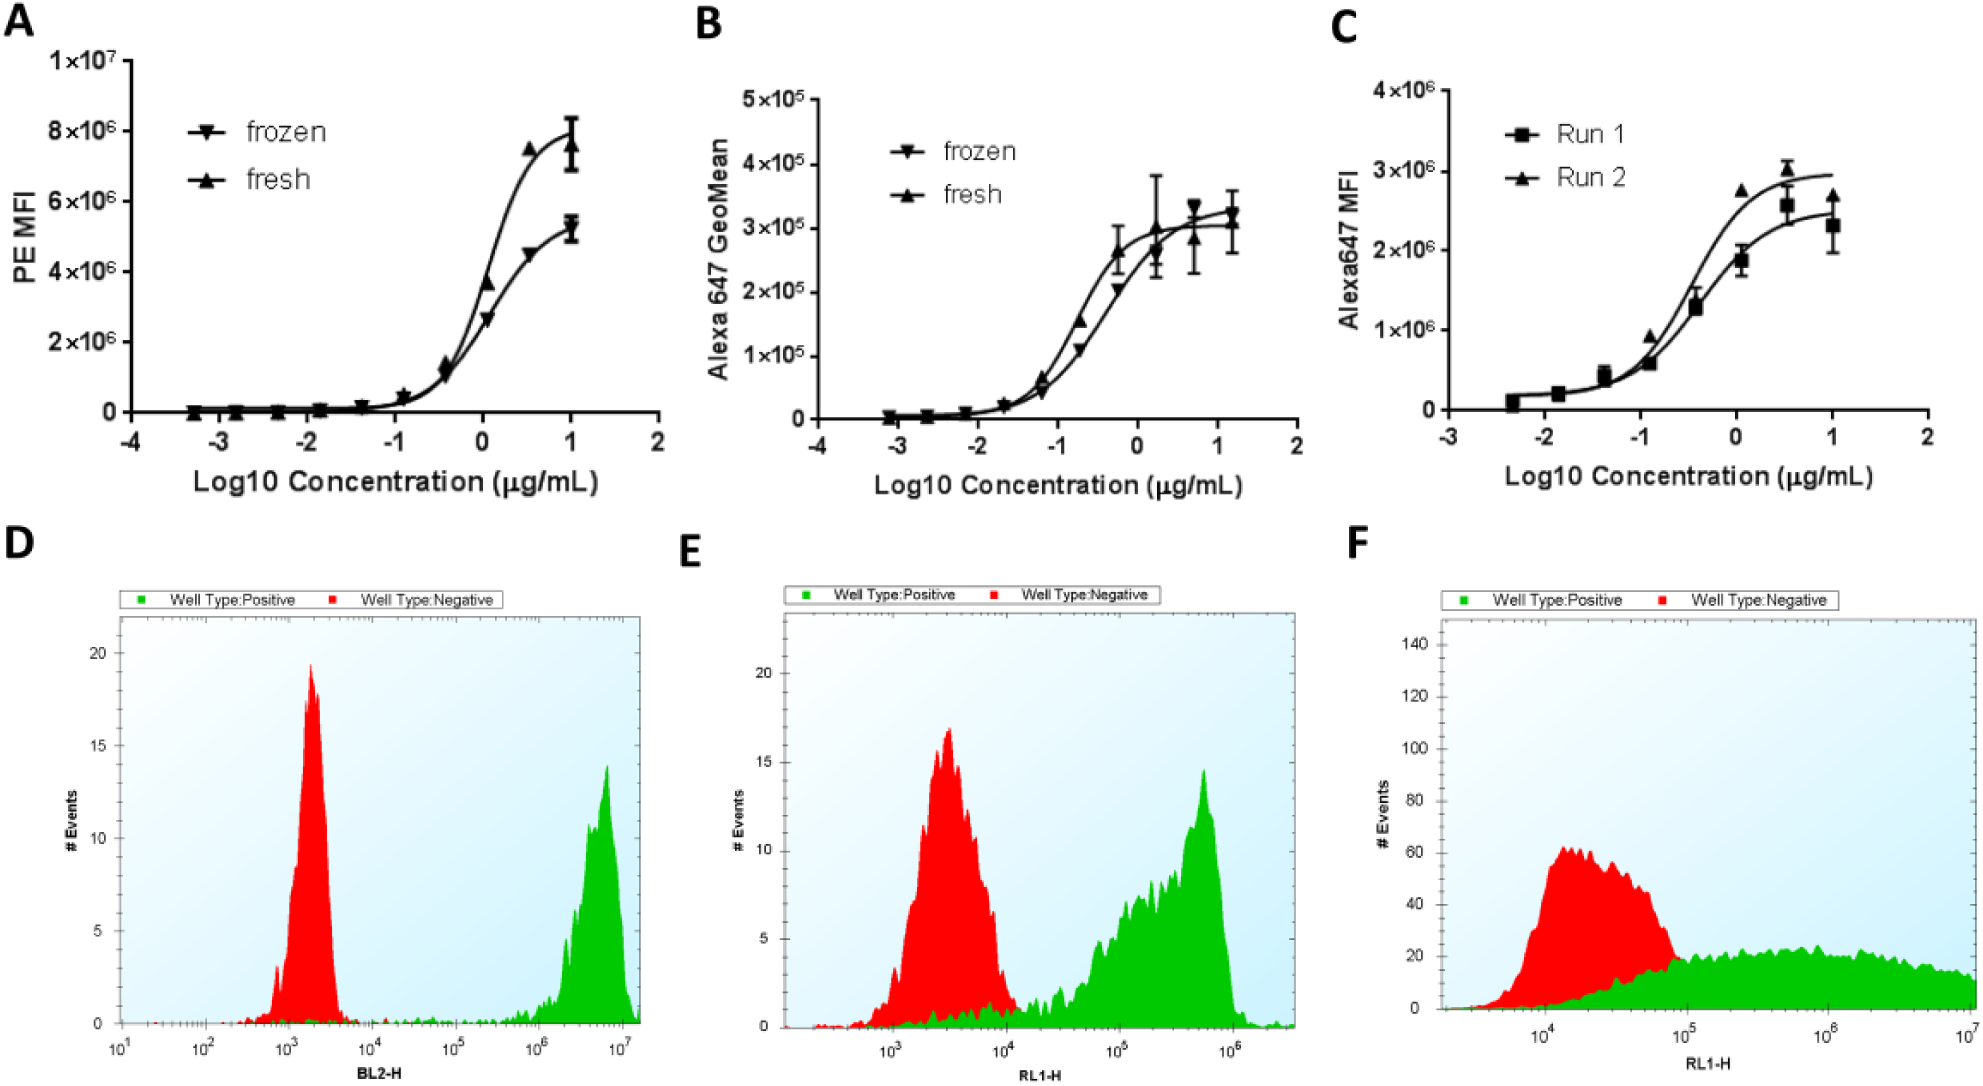
Validation of freeze–thaw ready-to-use cells. (
Integrated Robotics System for HTFC
To automate the HTFC workflow from the beginning to the end, we utilized the HighRes MicroStar system, which is composed of six dock positions arranged around a Staubli robotic arm. Instruments mounted on carts can be attached to these dock positions and accessed by the robot. Different combinations of instruments can be selected, as needed for each experiment/assay type. In this case, the docks are configured as shown in Figure 3 , including (1) automated incubator, (2) automated microplate centrifuge, (3) automated liquid handling platform, (4) automated washer, (5) ambient storage and automated dispensers, and (6) flow cytometer. SetriStore (HighRes) is an automated storage system with the capability of maintaining temperatures ranging from 4 to 100 °C, with controllable humidity and CO2 levels. It takes about 15 s to unload or load the plates. The microplate centrifuge V-spin can spin two plates simultaneously up to 300g. The EL406 washer can aspirate the buffer with its 96-washer head and dispense wash buffer using a peristaltic pump dispenser automatically. The Bravo liquid handling platform (Agilent) is equipped with a 384-well head and can transfer the desired amount of antibody supernatants from a source plate to the destination plate. The Multidrop Combi μL (Thermo Fisher) is used to dispense secondary antibody. The iQue PLUS screener is capable of acquiring samples from a 96- or 384-well plate in a high-speed fashion. Multiple iterations of the automation protocol were tested until an optimized configuration was achieved. We were able to run sixteen 384-well plates in an 8 h workday without human supervision during the run, which drastically reduced labor time and increased efficiency.
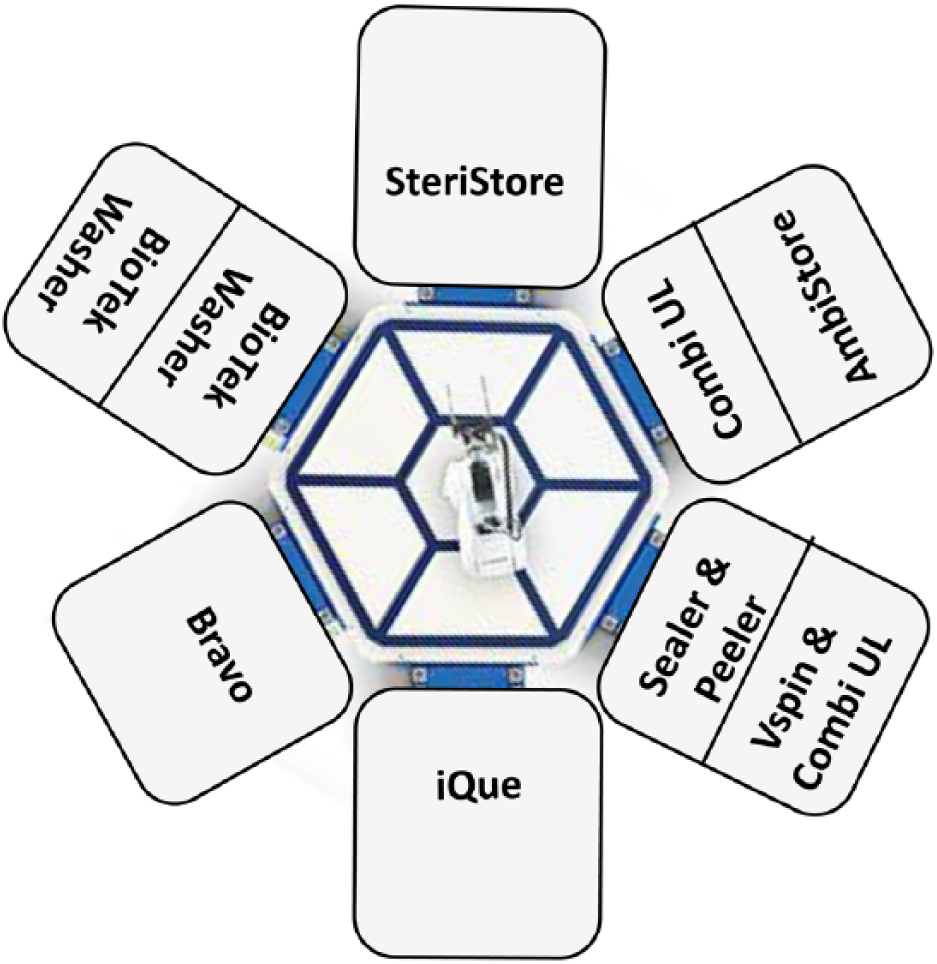
HTFC workflow overview: schematic layout of HighRes six-sided MicroStar.
Affinity Assessment of Purified Antibodies
Before we established an HTFC workflow, the on-cell binding assay was conducted with manual dilution of purified antibody candidates in a 96-well format, which only allowed running the samples in singlicate at six concentrations and one in five dilutions. We have now developed an automated antibody dilution method in the 384-well format using a liquid handling platform, capable of generating more reliable binding curves and affinity assessments in duplicate at 10 concentrations and one in three dilutions. In the example discussed below, we have evaluated 64 purified human IgG1 antibody clones for target 1 (different from target 2 discussed below for hybridoma screening) in the high-throughput on-cell binding assay with high-density freeze–thaw ready-to-use cells. In two independent runs, we had consistent results based on affinity defined by the concentration reaching half of the maximal binding, EC50, and maximum binding where the dose binding curve reaches a plateau, measured as the detected fluorescence intensity (arbitrary unit), Emax ( Fig. 4A , B ), validating the robustness of this HTFC workflow. Interestingly, it appeared that both Emax and EC50 varied for these clones. The on-cell binding assay was designed to assess the equilibrium binding properties of the test antibodies. Ideally, EC50 was associated with the binding affinity of each antibody to its corresponding epitope on the target, while Emax was determined by the expression level of the target epitopes. The difference in EC50 across these clones reflected the affinity of each test antibody dependent on the unique sequence (data not shown here) in the variable region, as expected. However, the variation in Emax could not simply be explained by epitope expression level alone since some antibodies targeting the same epitope still had different Emax values. All the antibodies in bin 1 shown in Figure 4B are to the same epitope as a commercial antibody with known epitope determined by competition binding assay. We further measured the kinetic properties of these antibodies using SPR and found that the Emax for a group of clones was inversely correlated with the off-rate, koff; that is, the faster the off-rate, the lower the Emax. As shown in Figure 4C, the two inverse correlations seem to be dependent on the various lineages in the third complementarity-determining region (CDR3) of immunoglobulin variable genes for the heavy chain (VH). Although the on-cell binding assay is used to measure equilibrium properties, the assay is not an in situ measurement as the washes postaddition of primary and secondary antibody binding to remove the excess antibody could also result in some target-bound antibody coming off and reaching a new equilibrium. The new maximum binding equilibrium, which was measured on flow cytometry as Emax, could possibly be determined by the off-rate and the time to reach a new equilibrium. Therefore, it was critical to precisely control the timing for each wash step to allow for a consistent comparison of Emax. The developed HTFC workflow was designed to assess binding properties of test antibodies and to provide reliable and high-content information, not only binding affinity but also kinetic properties, to select candidates for the next step.
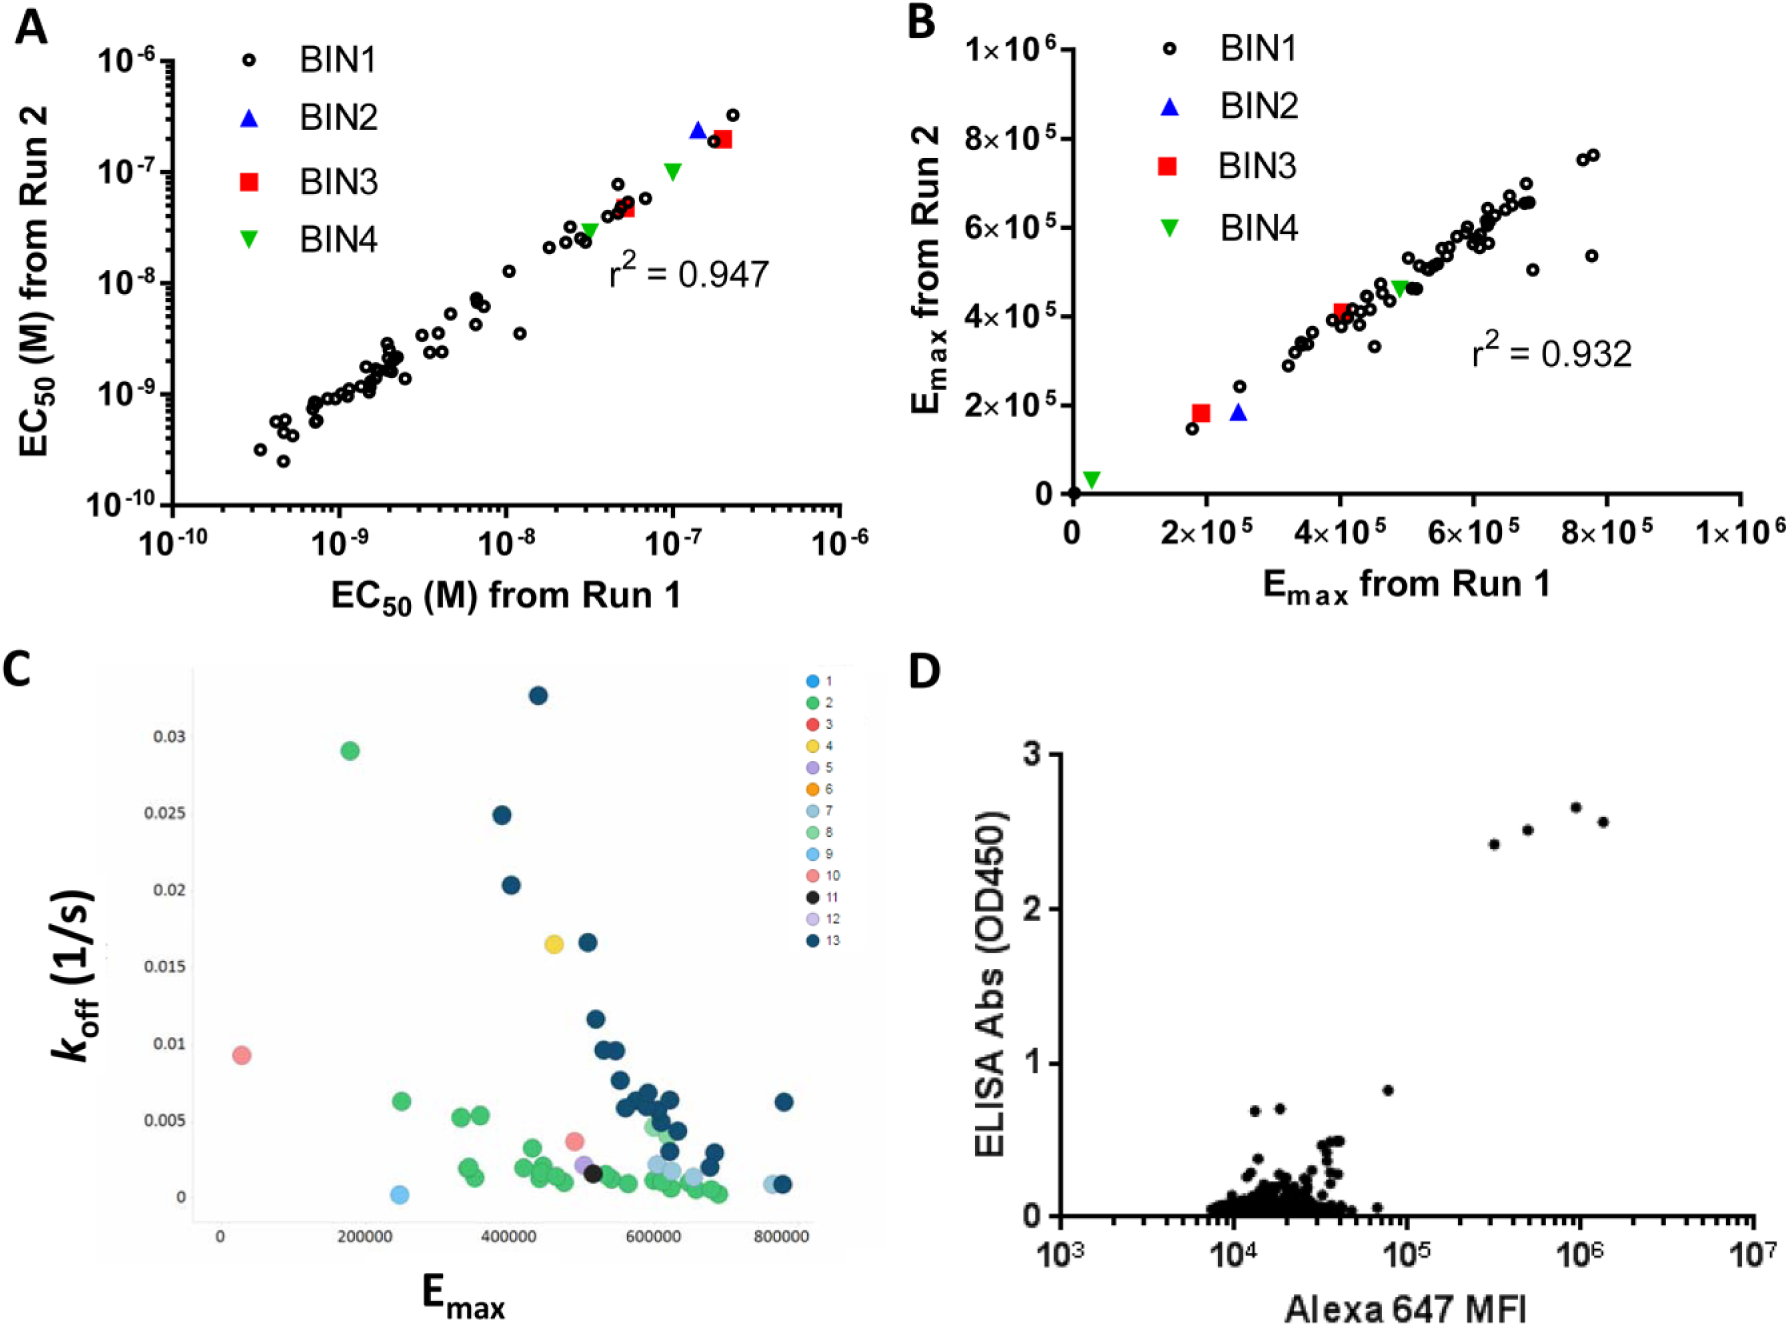
Single cell type for on-cell binding assay to assess binding affinities of purified antibodies (target 1) or screen antibody hybridoma (target 2). (
HTFC Screen of Mouse IgG Hybridoma Supernatants
The Antibody Engineering group in Takeda has been working on generating antibodies toward specific targets using the Trianni mouse platform. We obtained the hybridoma cell culture plates in 96-well format, aspirated the supernatants from four 96-well plates, and converted them into a single 384-well plate by quadrant. Then we carried out the target-specific on-cell binding assays to identify specific target binders for the hybridoma clones. In this section, we have shared the results from a screen of 3520 hybridoma clones to target 2, which were generated by subcutaneous immunization of recombinant human protein. Here we only utilized the transiently target-overexpressing Expi293F cells for testing on-cell binding as nonspecificity is usually not a concern for recombinant protein immunization. We utilized immunized mouse plasma as a positive control and mouse IgG isotype control as a negative control. The z′ values 19 calculated based on positive and negative controls were > 0.6 and passed all the QC criteria. However, the subcutaneous immunization of this specific target was not as immunogenic as expected. We only identified four binders through ten 384-well plates, which were consistent with those obtained from recombinant protein-based ELISAs ( Fig. 4D ). Despite the low number of hits, this screen validated the use of on-cell binding assay on the HTFC platform as a primary screening assay to identify binders from a hybridoma campaign, in addition to providing the advantages of physiological relevance, throughput, sensitivity, and a greater dynamic window.
Multiplexing Using Different Cell Types by HTFC
The antibody campaign to target 2 using subcutaneous immunization of recombinant target protein did not generate sufficient antibody hits and hits with enough epitope diversity. The Antibody Engineering group at Takeda therefore initiated more immunogenic cell-based hock immunizations in the hope of finding more diverse binders. To eliminate nonspecific binders during primary screening in the cell-based immunization campaign, we deployed the strategy of mixing parental cells labeled with cell tracker violet dye with unlabeled target-expressing cells in a 1:1 ratio to perform on-cell binding assays. Multiple color flow cytometry is able to collect content-rich information for single cells. Based on intensity in the violet (VL1-H) channel, we could differentiate these two cell types and monitor the antibody binding in the Alexa 647 (RL1-H) channel separately, as illustrated in Figure 5A . Zooming into single wells, we could visualize the dot plots of two cell populations, indicating the strong, medium, weak, and nonbinders ( Fig. 5B ). We normalized the Alexa 647 mean fluorescence intensity (MFI) of target overexpression cells in the test hybridoma supernatants to that in mouse IgG isotype control, called fold of increase, to gauge out nonbinders. The higher the parameter of fold of increase, the more target binding IgG, either at higher affinity or at higher concentration, that would exist in that sample. Then we calculated the ratio of Alexa 647 MFI of target expression cells to that of parental cells in the same well, called the specific ratio, to eliminate nonspecific binders. The higher the parameter of the specific ratio, the more specific the identified binder would be for the target. As shown in Figure 5C , we identified 79 hits in the upper right quadrant based on the cutoff threshold of fold of increase 7.5 and specific ratio 18. The incorporation of parental cells in the screen eliminated nonspecific binding hybridoma clones clustered in the upper left quadrant. As shown in Figure 5D , most of the hits identified in the on-cell binding assay were saturated with no observed differential in ELISAs, and the on-cell binding assay offered a higher dynamic window to screen antibodies. Also, there was one hit identified in the on-cell binding assay that was missed in the ELISA, which might reflect the difference in target protein on formation on cells compared with the recombinant protein. In summary, we showed here that multiplexing of target and parental cells in HTFC was powerful and physiologically relevant in a cell-based immunization campaign. Similarly, the methodology of multiplexing various cell types would provide a high-throughput scale to further screen multiple-target campaigns or evaluate cross-species activity.
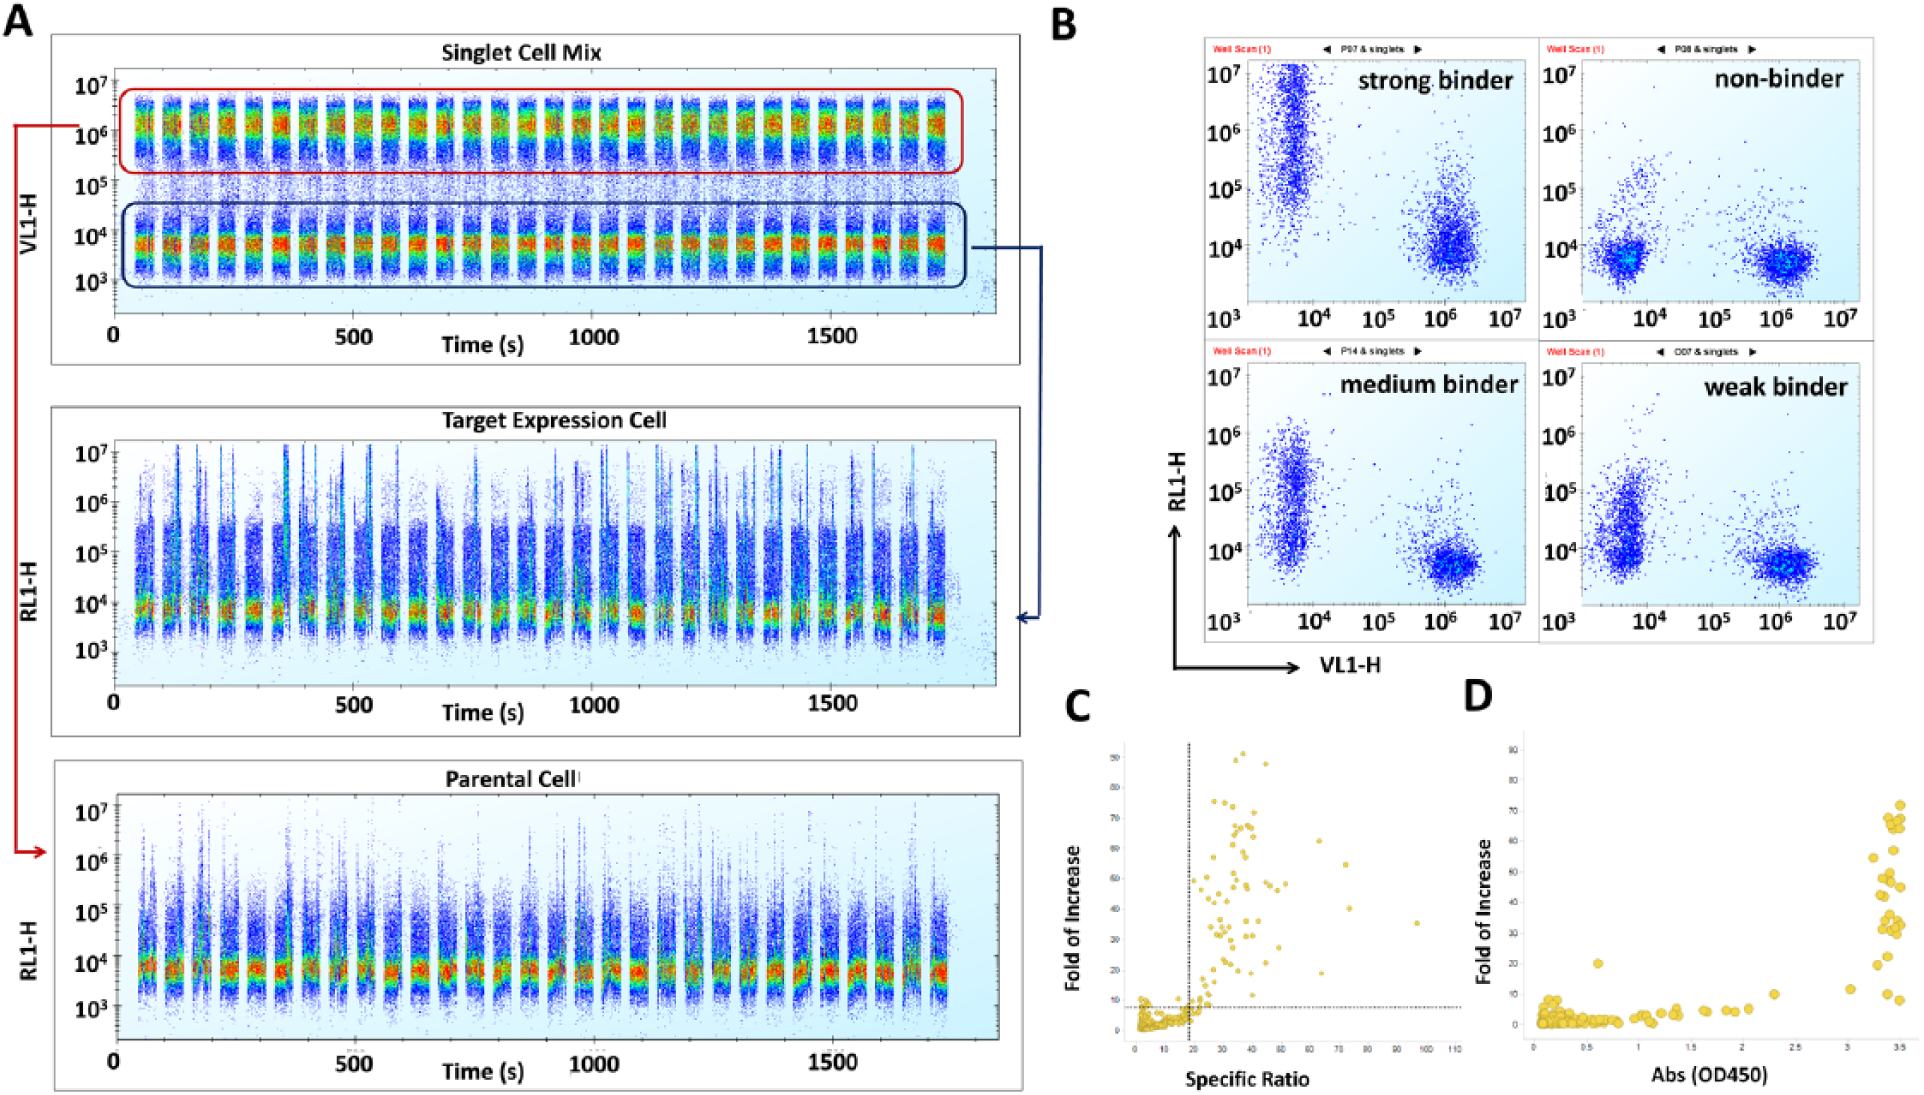
Multiplexing two cell types, that is, unlabeled target-expressing cells and violet dye-labeled parental cells, to screen antibody hybridoma of 1232 clones (target 2). (
Detecting IgG Concentration in Hybridoma Primary Screen
In primary hybridoma screens, we usually only evaluate single concentrations in on-cell binding assays due to the large number of clones. With single-point data, all the binders specific for the antigen of interest that are identified from the screen lack the information related to their affinity for the target, imposing challenges for selecting a reasonable number of hits, especially when many antibody clones pass the set threshold. To quantify the concentration of antibody in hybridoma supernatants, we started to test the possibility of multiplexing screening cells with mouse IgG capture beads, which are capable of being spun down along with the cells and also provide a distinguishable scattering pattern from the cells. We finally picked such beads, simply cellular from Bangs Lab, which were 8 µm in size and anti-mouse IgG conjugated on the surface. Figure 6A shows that the Expi293F cell population could be differentiated from the capture bead population based on forward/side scattering. The capture beads could detect mouse plasma and mouse IgG isotype controls with 100× signal window when compared with no IgG-containing buffer controls ( Fig. 6B ). Taking one 384-well plate of hybridoma clones to target 2 as an example, we examined the IgG concentration along with the cell mixture of labeled Expi293F parental cells and unlabeled target-overexpressing cells in an on-cell binding assay. As illustrated in Figure 6C , we first identified highlighted specific binders based off specific ratio and fold of increase. Then, based on the staining intensity on capture beads, we could take into account the IgG concentration to better understand the affinity of interesting clones. If the number of hit clones that could be handled is limited, some weak binders with high expression level indicating lower affinity could be eliminated. Here we demonstrated that multiplexing mouse IgG capture beads and cells in a primary hybridoma screen could potentially add more information during the decision-making process. Similarly, multiplexing of cytokine capture beads can be applied to monitor multiple cytokine levels and cell activation status simultaneously. In summary, this strategy of multiplexing beads and various cell types demonstrated that HTFC is indeed capable of providing high-content information during an antibody generation campaign.
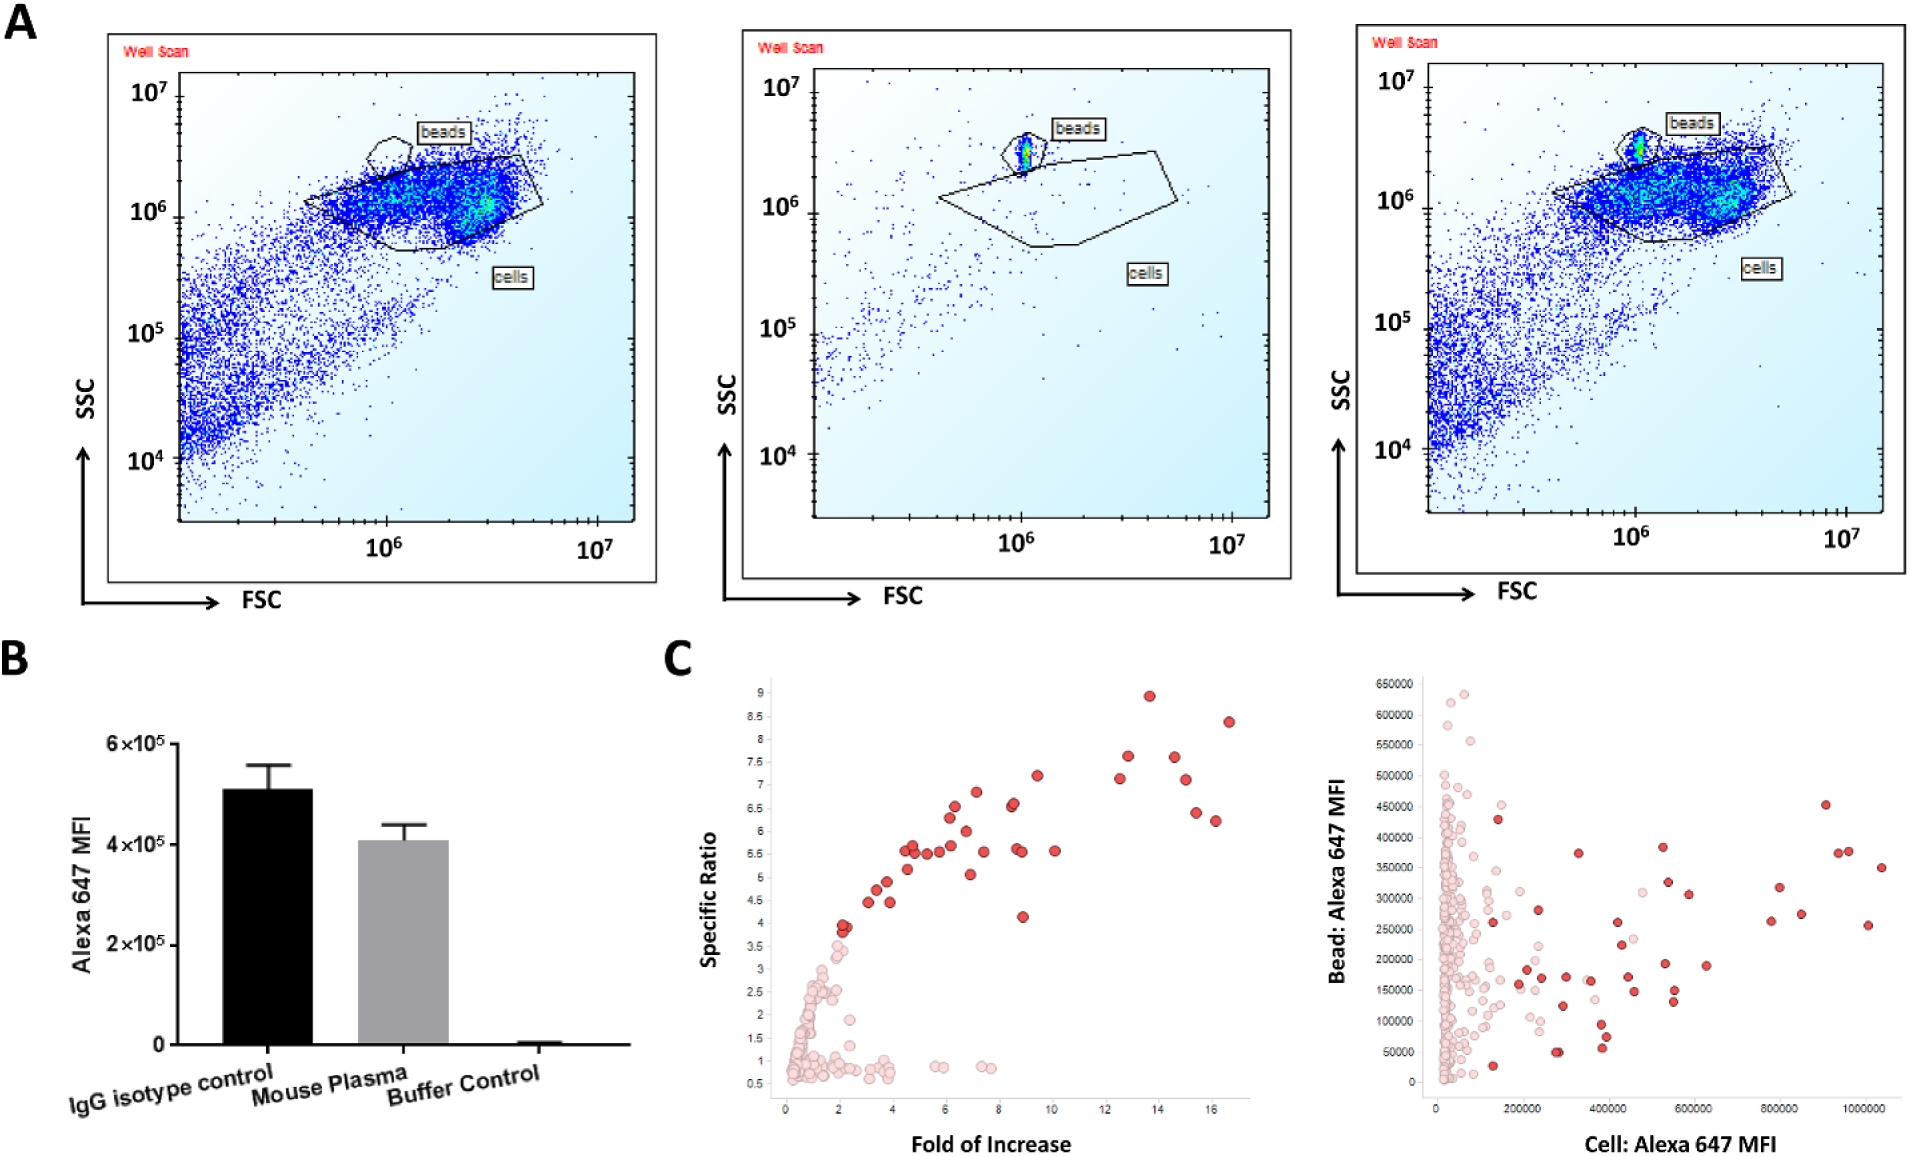
IgG capture beads can detect the hybridoma antibody concentration. (
Footnotes
Acknowledgements
We thank Thomas Hasaka, Josh Nelson, and Matthew Hess from IntelliCyt for supporting iQue Screener PLUS and useful discussion in designing assays. We thank Daniel Tavares and Shawn Jennings from the Antibody Engineering group for useful discussions on establishing antibody screening workflows. We thank Pamela Brauer, Zhi Li, and Christopher Achorn from the Protein Sciences group for providing stable target-expressing cells. We thank Ben Knight from the Lead Discovery group for helping with data analysis using a pipeline pilot and Genedata Condoseo.
Declaration of Conflicting Interests
The authors declared potential conflicts of interest with respect to the research, authorship, and/or publication of this article: All authors are employed by Takeda Pharmaceuticals and their research and authorship of this article was completed within the scope of this employment.
Funding
The authors received no financial support for the research, authorship, and/or publication of this article.