
Abstract
Immunoassays, utilizing the affinity of antibodies to their antigens, are powerful techniques and have been widely used for quantifying analytes, such as cytokines, in biological samples in the clinic and in drug discovery. Various immunoassays have been developed to fit for different purposes. Recently, bead-based flow cytometry assays have emerged as interesting options for multiplex quantification of analytes. In this study, we compared high-throughput flow cytometry multiplex iQue QBeads PlexScreen assays with several other commonly used immunoassays, including MSD, Luminex, ELISA, HTRF, and AlphaLISA assays. Head-to-head comparisons of quantification data of the following cytokines were made: (1) IL-2, IL-4, IL-6, IL-13, IL-17A, IFNγ, KC/GRO, RANTES, and TNFα in mouse bronchoalveolar lavage fluid samples; (2) IL-10 and TNFα in supernatants from a THP-1 cell assay; (3) IL-6, IL-10, IL-12p70, and TNFα in supernatants from a human monocyte-derived dendritic cell assay; and (4) IL-2 in supernatants from a human CD4+ cell assay. The results demonstrated a good assay correlation between the iQue and the compared assays for the cytokine studied. Although overall good assay correlations were observed, our results showed that the iQue assay generated different absolute cytokine values for some cytokines in the same sample sets compared with other assays.
Introduction
Immunoassays, utilizing the affinity of antibodies to their antigens, are powerful techniques for quantifying analytes in biological samples and have been broadly used in many important areas, such as clinical diagnostics, biomarker study, and drug discovery.1,2 The traditional method for quantifying analytes is enzyme-linked immunosorbent assay (ELISA), 3 a relatively low-throughput assay measuring a single analyte per well (single plex). A need for simpler, more robust, and higher-throughput assays has led to the development of various immunoassay technologies, such as homogenous time-resolved fluorescence (HTRF) and the Amplified Luminescent Proximity Homogenous Assay (AlphaScreen).4–6 Furthermore, multiplex immunoassay technologies, such as Luminex xMAP and MesoScale Discovery (MSD), have been developed to simultaneously quantify multiple analytes in a single sample to save time, sample volumes, and reagent costs.7–9
The MSD assay uses capture antibodies against up to 10 analytes coated in spots at the bottom of each well utilizing electrochemiluminescence detection technology. 7 Luminex is a bead-based flow cytometric technology using capture beads coated with a specific capture antibody against one analyte of interest and a fluorescent dye-labeled detection antibody. 10 MSD and Luminex assays are the multiplex assay platforms commonly used for simultaneous analysis of multiple analytes. HTRF is a technology combining fluorescence resonance energy transfer (FRET) technology with time-resolved measurement. In HTRF assays, a signal is generated through fluorescent resonance energy transfer between a donor and an acceptor molecule when in close proximity to each other. 4 HTRF is the most frequently used assay technology in high-throughput drug discovery. AlphaLISA is a bead-based assay relying on PerkinElmer’s AlphaScreen technology using a luminescent oxygen-channeling chemistry. 5 AlphaLISA assays can be set up as sandwich or competition immunoassays.
Recently, a bead-based flow cytometry QBeads PlexScreen assay developed by IntelliCyt has emerged as an interesting assay option for multiplex quantification of analytes. QBeads PlexScreen assays function on the same principle as a sandwich ELISA and are developed for the high-throughput flow cytometry platform iQue Screener. The iQue QBeads assay technology uses a similar assay principle as the Luminex assay. Analytes of interest in the samples bind to capture beads and fluorescent detection antibodies to form bead complexes. The intensity of fluorescence signal of the detection antibodies correlates directly to the quantity of bound analyte. Beads designed to capture different analytes are encoded with different intensities of fluorescent dyes to get a unique signature, allowing up to 30 unique analytes to be measured in a single sample.
Several studies to compare ELISA with multiplex assays10–14 and MSD with Luminex assays 7 have been reported. These studies demonstrate good correlation between the compared assays using culture supernatants, but poor correlation in more complex biological matrices. Different immunoassays also have different properties in terms of assay throughput, sensitivity, and dynamic range. Therefore, assay comparison studies are needed to understand assay correlation between the iQue QBeads assay and other commonly used immunoassays, as well as the property of the iQue assays, in order to define where the assays can be best applied.
In this study, we have performed head-to-head comparison of high-throughput flow cytometry multiplex iQue QBeads assays with multiplex MSD and Luminex assays, as well as with single-plex ELISA, HTRF, and AlphaLISA assays, to analyze multiple cytokines in mouse bronchoalveolar lavage fluid (BALF) samples, as well as culture supernatants from THP-1 cells, human monocyte-derived dendritic cells (MO-DCs), and human primary CD4+ T cells.
The results showed good correlation between the iQue QBeads assays and the corresponding MSD, ELISA, HTRF, and AlphaLISA assays. Although we observed overall good assay correlations, our results showed that the iQue assays generated different absolute cytokine values for some cytokines in same sample sets compared with other assays.
Materials and Methods
Materials
Chemical reagents were purchased from Sigma-Aldrich Sweden AB (Stockholm, Sweden) or synthesized in-house unless otherwise stated. Cell culture medium and supplements were purchased from ThermoFisher Scientific (Waltham, MA) unless otherwise stated. The 384- or 96-well plates were purchased from VWR (Stockholm, Sweden). QBeads PlexScreen kits were purchased from IntelliCyt Corporation (Albuquerque, NM), MSD kits were purchased from Mesoscale Discovery (Rockville, MD), ELISA kits were purchased from R&D Systems (Minneapolis, MN), Luminex kits were purchased from Merck-Millipore (Darmstadt, Germany), HTRF kits were purchased from Cisbio (Codolet, France), and AlphaLISA kits were purchased from PerkinElmer (Waltham, MA).
Preparation of BALF
BALF samples were obtained from in vivo mouse experiments carried out at AstraZeneca, Gothenburg. In short, ovalbumin- or lipopolysaccharide (LPS)-challenged mice were euthanized with an intraperitoneal injection of 0.2 mL of pentobarbital (Alfatal 100 mg/mL, Apoteksbolaget, Sweden). A syringe was connected to a polyethylene tube (PE120) and inserted into the trachea through a cut between two upper cartilage rings and secured with a silk suture. 15 The BALF was collected by lavaging manually with either 2 × 0.8 mL or 3 × 0.3 mL of phosphate-buffered saline (PBS; without Ca2+ and Mg2+) and centrifuged to pellet the cells, and the recovered supernatants were aliquoted and stored at −80 °C until cytokine analysis. The same sample sets were run in the iQue, MSD, ELISA, and Luminex immunoassays for head-to-head comparison.
THP-1 Cell Assay
Seventy-two hours prior to the assay, THP-1 cells were suspended in culture media (RPMI 1640 [72400-021, Gibco, Waltham, MA] + 10% heat-inactivated fetal bovine serum [FBS; 10270-106, Gibco]) in the presence of 100 nM 4-beta-phorbol 12-myristate 13-acetate (PMA), seeded in Greiner 384-well tissue culture-treated plates at a density of 30,000 cells/well and incubated at 37 °C. On the day of the experiment, the media was removed and fresh culture media containing different concentrations of HG-9-91-01, a salt-induced kinase (SIK) inhibitor, 16 were added to the cells. Cells were incubated for 1 h at 37 °C before addition of 100 ng/mL LPS, followed by 6 h incubation at 37 °C before being centrifuged at 1000g for 5 min. Supernatants were collected, diluted according to assay needs, aliquoted, and stored at −80 °C until cytokine analysis. The sample sets were run in both the iQue and HTRF immunoassays for head-to-head comparison.
Human MO-DC Assay
Human peripheral blood mononuclear cells (PBMCs) were isolated from healthy volunteer donors at AstraZeneca, Gothenburg (approval number from the ethics committee in Gothenburg, Sweden: Dnr T705-14 Ad 033-10), by Ficoll-Paque Plus (17-1440-03, GE Healthcare, Pittsburgh, PA) density gradient centrifugation (Leucosep vials, 227290, Greiner Bio-One, Monroe, NC), and monocytes were purified by positive selection using CD14 MicroBeads (130-050-201, Miltenyi Biotec, Bergisch Gladbach, Germany). Human MO-DCs were generated as described elsewhere. 17 In brief, monocytes were seeded in Costar 96-well tissue culture-treated plates at a density of 75,000 cells/well in culture media (RPMI 1640 + 10% heat-inactivated FBS + 100 U/mL penicillin/streptomycin + 1 mM sodium pyruvate) containing 100 ng/mL GM-CSF (15575, Peprotech, Rocky Hill, NJ) and 40 ng/mL interleukin 4 (IL-4; 200-04, Peprotech) and incubated at 37 °C. On day 3, media with cytokine was replenished and cells were treated with 50 nM rapamycin or 1 nM vitamin D3 (D1530, Sigma-Aldrich) + 1 µM dexamethasone. To induce mature MO-DCs, cells were treated with 100 ng/mL LPS (L4516, Sigma-Aldrich) for 48 h starting on day 6. On day 8, supernatants were carefully removed, aliquoted, and stored at −80 °C until cytokine analysis. The same sample sets were run in the iQue and MSD immunoassays for head-to-head comparison.
Human CD4+ Cell Assay
Human PBMCs were isolated as described above and CD4+ cells were purified using a CD4+ cell isolation kit 18 (130-096-533, Miltenyi Biotec) on Auto MACS Pro (Miltenyi Biotec). A CD4+ cell suspension was prepared in culture media (RPMI 1640 + 10% heat-inactivated FBS + 56 nM 2-mercaptoethanol + 1% penicillin/streptomycin) and seeded in Costar 96-well tissue culture-treated plates at 80,000 cells/well. Cells were recovered for 30 min at room temperature (RT) and were pretreated with an NF-κB pathway inhibitor for 1 h incubation at 37 °C. Human T-activator CD3/CD28 Dynabeads (1131D, Gibco) were prepared according to the manufacturer’s instructions and added to the plate, and the cells were incubated for 18 h at 37 °C. Supernatants were carefully removed, aliquoted, and stored at −80 °C until cytokine analysis. The same sample sets were run in the iQue and AlphaLISA immunoassays for head-to-head comparison, as well as for the iQue miniaturization study.
iQue QBeads PlexScreen Assay
Cytokines were quantified using the QBeads PlexScreen assay kits according to the manufacturer’s instructions (IntelliCyt). Cytokine standards for QBeads PlexScreen assays were provided as individually packaged lyophilized spheres with the QBeads assay kits (IntelliCyt). A cocktail mix of the cytokine standards for each QBeads assay kit was prepared by combining all the lyophilized spheres into one vial and then dissolving the spheres with assay buffer to reach the desired stock concentrations, ranging from 5000 to 20,000 pg/mL. The cytokine standard stocks were aliquoted and stored at −80 °C until use. Twelve- to 16-point standard curves with twofold serial dilutions were made. QBeads PlexScreen Mouse 9-plex kits for IL-2, IL-4, IL-6, IL-13, IL-17A, IFNγ, KC/GRO, RANTES, and tumor necrosis factor alpha (TNFα; 90832, IntelliCyt); QBeads PlexScreen Human 2-plex kits for IL-10 and TNFα (90602, IntelliCyt); QBeads PlexScreen Human 2-plex kits for IL-2 and IFNγ (90602, IntelliCyt); and QBeads PlexScreen Human 4-plex kits for IL-6, IL-10, IL-12p70, and TNFα (90604, IntelliCyt) were used to analyze the cytokines on an iQue Screener Plus (IntelliCyt). Ten microliters of undiluted mouse BALF samples or undiluted supernatants from different cell assays, as well as 10 µL of iQue cytokine standard solutions, was transferred to 384-well V-bottom plates (781280, Greiner Bio-One). Ten microliters of mixed capture beads for the multiplex cytokines of interest was added to each well. After 1 h of incubation at RT, 10 µL of detection reagent was added. The plates were incubated in the dark at RT for 2 h for human analytes and for 1 h for mouse analytes. Washing QBeads once could be applied if needed to improve assay sensitivity for analyzing certain cytokines. The plates were analyzed on the iQue Screener Plus with a 1 s/well sip time using a predefined QBeads template provided with the QBeads assay kits. The raw data were collected as BL2-H median fluorescence intensity (excitation 488 nm, emission 572/28 nm).
An iQue QBeads assay miniaturization study was performed as described previously 19 by modifying the standard human IL-2 assay protocol. In brief, 2 µL of supernatants or IL-2 cytokine standard, 2 µL of mixed capture beads, and 2 µL of detection reagent were used instead of 10 µL followed by one wash step. The supernatants from the MO-DCs assay were also analyzed using the miniaturized iQue assay protocol.
MSD, ELISA, Luminex, HTRF, and AlphaLISA Procedures
The MSD, ELISA, Luminex, HTRF, and AlphaLISA assays were performed according to the kit protocols provided by the suppliers.
MSD Assay
Analysis of the mouse cytokines IL-6, KC/GRO, and TNFα was carried out using the MSD mouse V-plex proinflammatory panel 1 (K15048D, Mesoscale Discovery). Analysis of the human IL-6, IL-10, IL-12p70, and TNFα was carried out using the MSD human V-plex proinflammatory panel 1 (K15049D, Mesoscale Discovery).
A ready-made lyophilized calibrator cocktail of cytokine standards was dissolved in milliQ H2O or diluent and a 7-point standard curve with fourfold serial dilution was made. The concentrations in the mix are batch specific and different for each cytokine, adapted to physiologically relevant concentrations. Fifty microliters of cytokine standards, as well as undiluted mouse BALF samples or twofold diluted MO-DC supernatants, was loaded into each well. The electrochemiluminescence signal for each cytokine was measured on a Sector Imager 6000 reader (Mesoscale Discovery).
ELISA
Analysis of mouse RANTES was carried out using an ELISA kit (DY478, R&D Systems). A lyophilized standard was dissolved in milliQ H2O and a 7-point standard curve with twofold serial dilution from 7.8 to 500 pg/mL was made. Fifty microliters of standard or undiluted sample was loaded into each well in a 96-well plate precoated with a monoclonal mouse/rat RANTES antibody. A biotinylated detection antibody was used and coupled to streptavidin-tagged horseradish peroxidase (HRP). Following TMB substrate incubation where the HRP reacts with the substrate, absorbance was measured at 450 nm with the 630 nm signal subtracted on a Spectramax 250 reader (Molecular Devices, Sunnyvale, CA).
Luminex Assay
Analysis of mouse IL-2, IL-4, IL-13, IL-17A, and IFNγ was carried out using a Mouse Cytokine/Chemokine Luminex panel kit (MCYTOMAG-70K, Millipore). This is a flow-based assay using magnetic beads coated with antibodies for each analyte. The lyophilized standard cocktail was dissolved in milliQ H2O to a top concentration of 10,000 pg/mL. A 7-point standard curve with fivefold serial dilutions to 0.13 pg/mL was made. Twenty-five microliters of standard or undiluted mouse BALF sample was loaded into each well in a 96-well plate. The mean fluorescence intensity was measured on a BioPlex200 reader (Bio-Rad, Hercules, CA).
HTRF Assay
Analyses of THP-1-derived human IL-10 and TNFα were carried out using HTRF kits (6FH10PEB and 62TNFPEB, Cisbio). TNFα standard for HTRF was lyophilized and stock solution of 10 ng/mL was made by reconstitution in supplied buffer. IL-10 standard for HTRF was provided as a 710 ng/mL stock solution. An 8-point standard curve with a twofold serial dilution from 19 to 2500 pg/mL was made for TNFα, and a 9-point standard curve with a twofold serial dilution from 19 to 5000 pg/mL was made for IL-10. Ten microliters of standard, undiluted or diluted sample was loaded into each well of low-volume 384-well plates (784076, Greiner Bio-One). Five microliters of anti-TNFα-Cryptate followed by 5 µL of anti-TNFα-XL665 or 5 µL of anti-IL-10-d2 followed by 5 µL of anti-IL-10-Eu3+-Cryptate antibodies was added. After excitation at 337 nm, direct emission and FRET emission were measured at 620 and 665 nm, respectively, using a Pherastar plate reader (BMG Labtech, Ortenberg, Germany). The ratio between 665 and 620 nm was then used for further calculations.
AlphaLISA Assay
Analysis of human IL-2 was carried out in 384-well plates (OptiPlateTM-384HB, PerkinElmer) using AlphaLISA kits (AL218, PerkinElmer) following the kit protocols with fivefold diluted samples. In this study, the sandwich format was used. The cytokine standard for the AlphaLISA assays was provided lyophilized and dissolved in 100 µL of milliQ H2O to a concentration of 3 µg/mL. A 12-point standard curve with threefold serial dilution from 0.3 to 60,000 pg/mL was made. Five microliters of cytokine standard or diluted sample was loaded into each well in 384-well plates. The induced proximity-based fluorescence emission of the acceptor beads created by the excitation at 680 nm of the donor beads was measured using an Envision reader (PerkinElmer).
Data Analysis
The absorbance or fluorescence signals generated in the immunoassays were converted to analyte concentrations using a nonlinear four-parameter fit of the respective standard curves, except for human MSD and HTRF, where linear regression was used. Assay correlation data analysis was performed in GraphPad Prism 7 using linear regression through point (X0, Y0). Compound concentration response data were analyzed using nonlinear regression and fitted to a sigmoidal four-parameter equation.
Results
Detection Ranges of Cytokines in Different Immunoassays
Different top concentrations and different dilution factors of cytokine standards were used when preparing cytokine standard curves from different kits according to the provided kit protocols, adapted to physiologically relevant concentrations, or with some modifications for certain assay kits. Table 1 shows the detection ranges of cytokine standards in all the compared immunoassays based on the suppliers’ assay kit information combined with information based on our own experiences. From this table, we can see that the detection ranges of the cytokines in the respective assays vary between the assays and assay formats. For the human cytokines IL-2, IL-6, IL-10, IL-12p70, and TNFα, the iQue QBeads assays showed detection ranges from 10–20 pg/mL to 5000 pg/mL, corresponding to a detection range factor of 250–500 (a ratio of the top standard concentration and lowest detection limit of quantification for individual cytokines), while for the MSD assays this figure is approximately 500. For the tested mouse cytokines, these factor ranges were 500–2000 and 4000 for the iQue and MSD assays, respectively. The mouse RANTES ELISA had a factor of 64 compared with 1000 for iQue. The iQue and HTRF assays have similar ranges for human IL-10 and TNFα. The AlphaLISA assay shows a very broad detection range for IL-2 with a factor of 400,000 compared with 250 for the iQue assay.
Detection Ranges of Mouse and Human Analytes in the Compared Immunoassays.
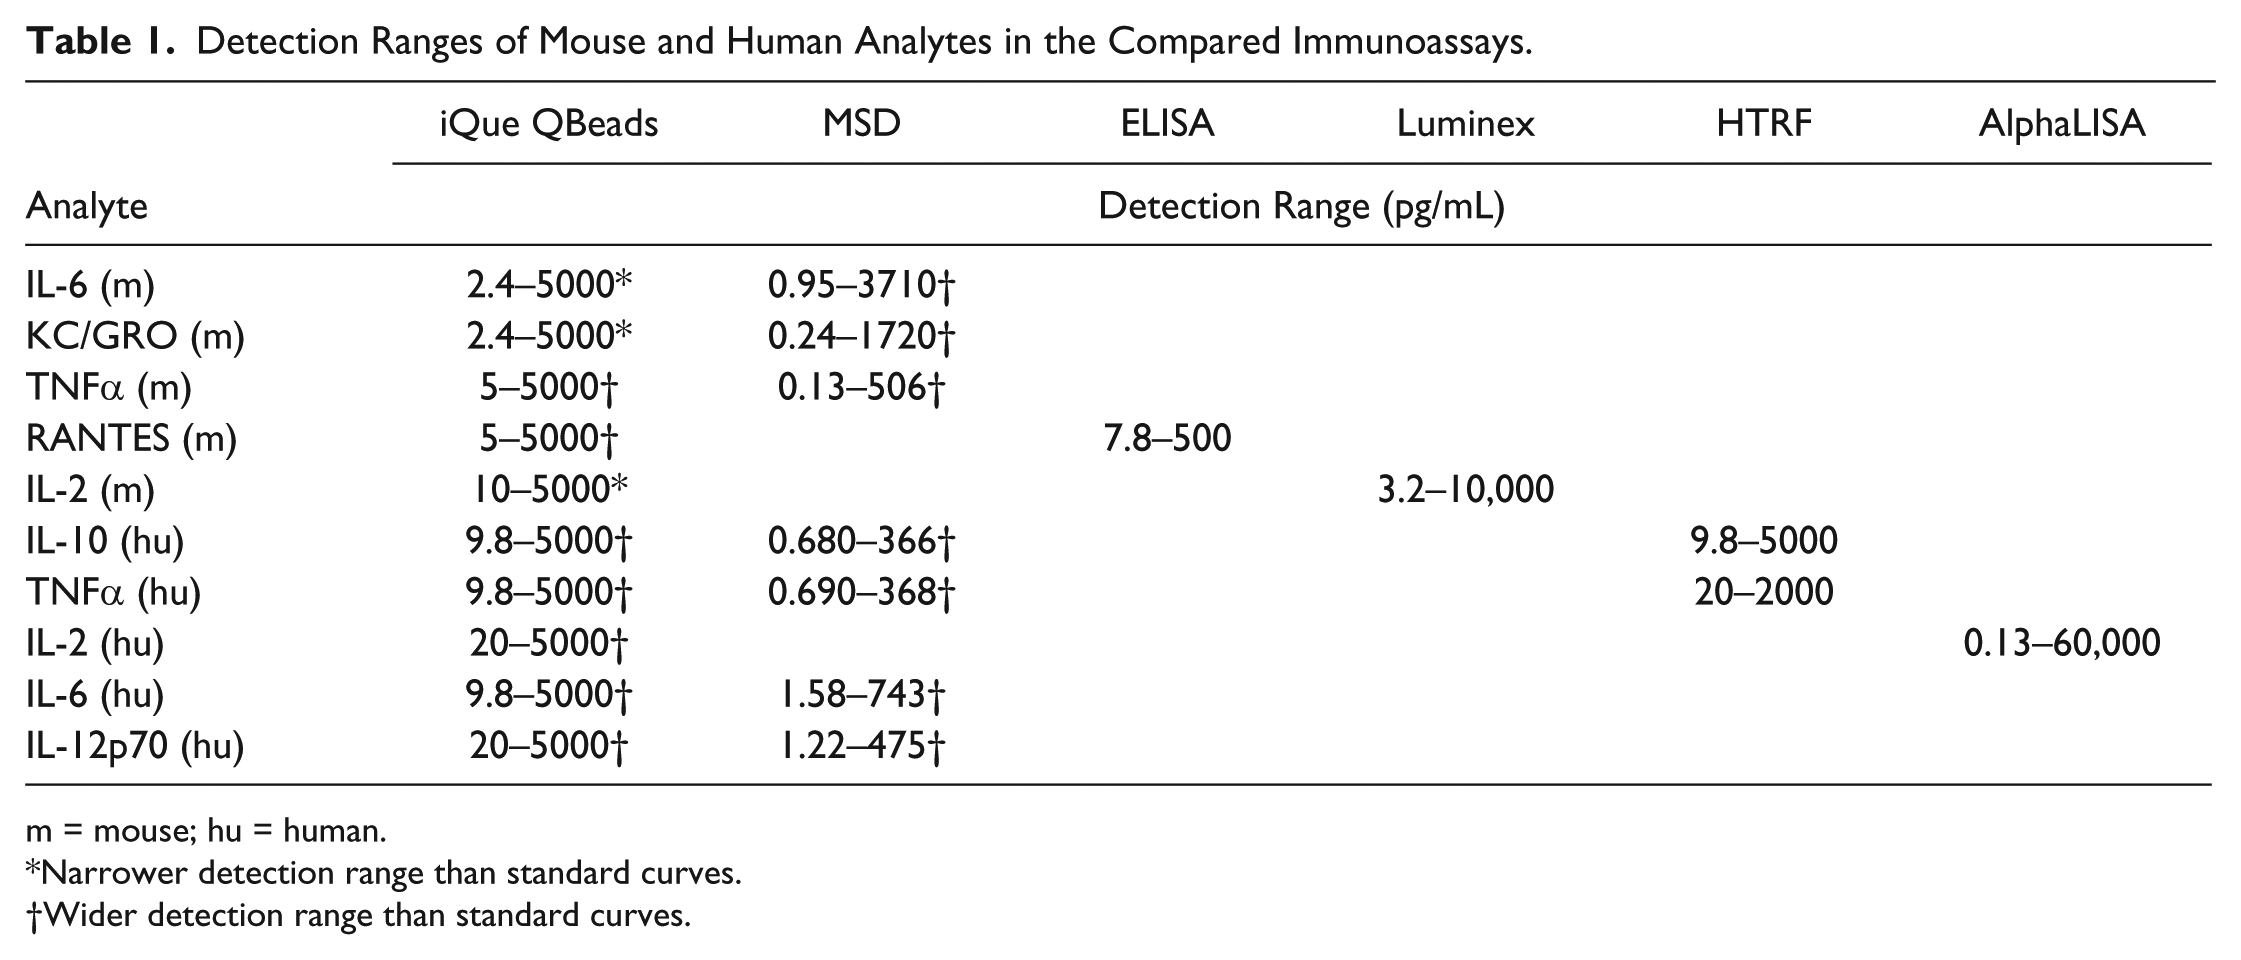
m = mouse; hu = human.
Narrower detection range than standard curves.
Wider detection range than standard curves.
It should be noted that for some of the assays we have observed that the detection range could be extended († in Table 1 ) or that it was narrower compared with the supplier information (* in Table 1 ). More replicates would be needed for these panels to better quantify the detection ranges.
Assay Correlation and Accuracy
iQue versus MSD, ELISA, or Luminex (Mouse Cytokines)
A mouse 9-plex (IL-2, IL-4, IL-6, IL-13, IL-17A, IFNγ, KC/GRO, RANTES, and TNFα) QBeads PlexScreen assay kit was run in 384-well format using an iQue Screener Plus to analyze 80 undiluted mouse BALF samples obtained from two in vivo studies with 30 and 50 mice for study 1 (an LPS challenge model) and study 2 (an ovalbumin challenge model), respectively. Thirty BALF samples from study 1 were analyzed for mouse IL-6, KC/GRO, and TNFα in the MSD assay in 96-well format. For study 2, 50 BALF samples were analyzed in 96-well format for mouse RANTES, using ELISA, as well as a panel of mouse IL-2, IL-4, IL-13, IL-17A, and IFNγ using the Luminex assay. However, with the exception of IL-2, the levels of the analytes in the samples from study 2 were too low for reliable detection using either iQue or Luminex. Therefore, only the IL-2 results were used for assay correlation analysis.
A strong assay correlation was observed between the compared assays when we used linear regression through the zero point (X0, Y0) to compare the cytokine concentrations ( Fig. 1A–E ). Measured concentrations for mouse IL-2, KC/GRO, and TNFα showed very good correlation between iQue and MSD, with R2 values larger than 0.9, while R2 values for mouse RANTES between iQue and ELISA, or IL-2 between iQue and Luminex, were lower at 0.65–0.70, but still acceptable. The slope values for mouse TNFα measured by iQue versus MSD and mouse RANTES measured by iQue versus ELISA were 0.9 and 1.5, respectively, indicating that the concentrations determined for these cytokines in iQue, MSD, and ELISA were similar. However, the slope values for mouse IL-2 determined by iQue versus Luminex, and mouse IL-6 and KC/GRO determined by iQue versus MSD, were 3.0, 7.9, and 7.3, respectively. These high slope values suggest that the concentrations determined for these cytokines using the iQue assays were substantially lower than the values measured by the MSD or Luminex assays.
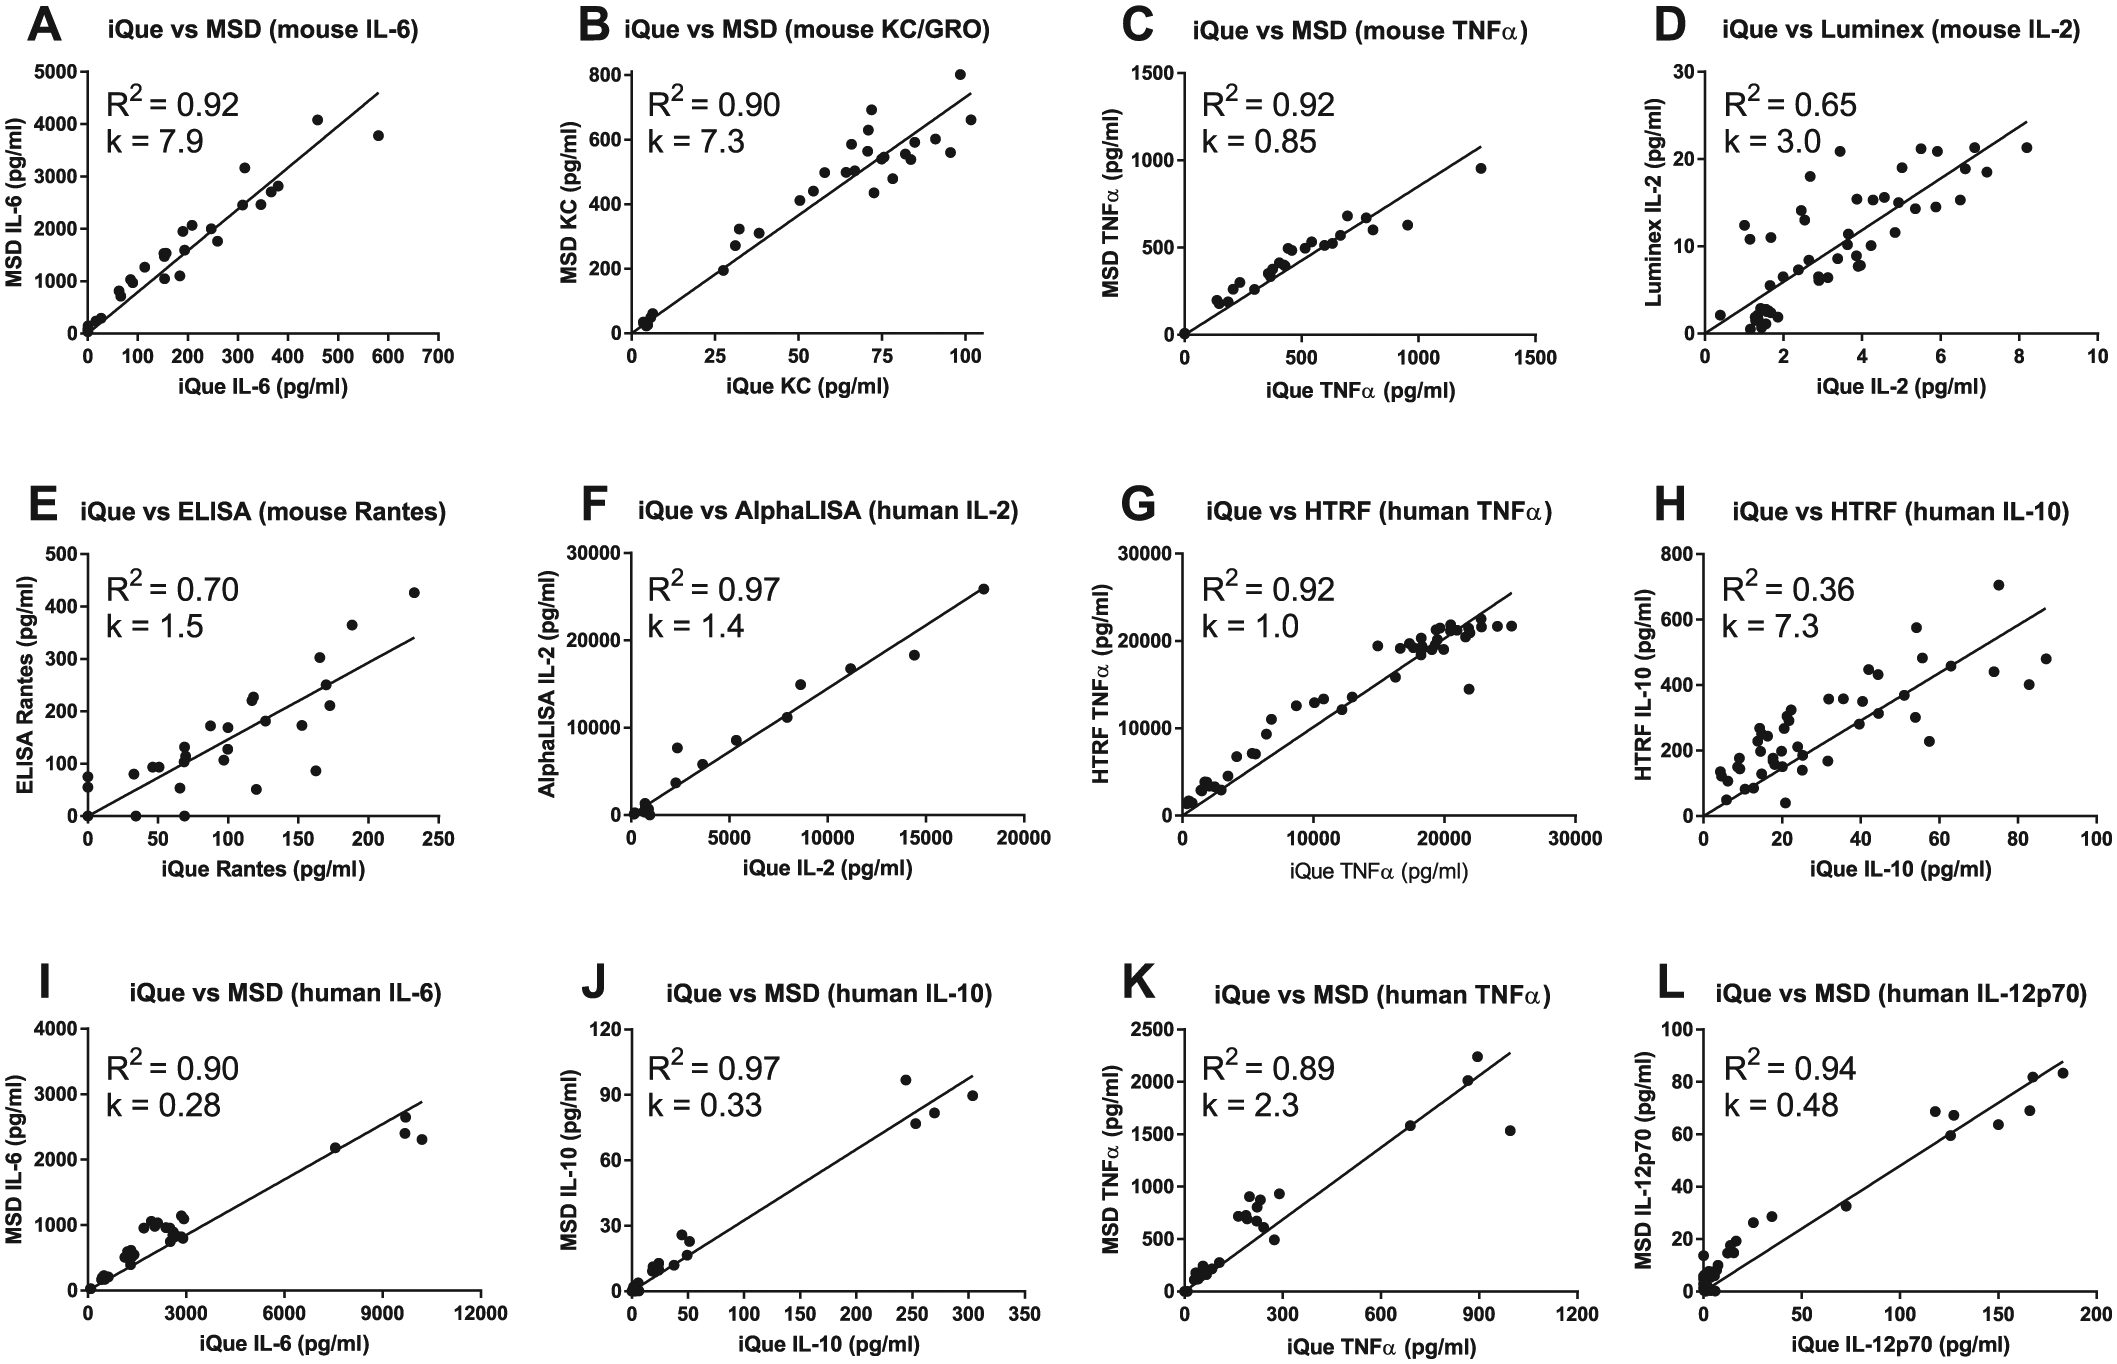
Levels of analytes analyzed in the iQue QBeads assays and MSD, AlphaLISA, HTRF, or Luminex assays for comparison. (
In order to find out if the concentration discrepancy observed for mouse IL-6 and KC/GRO between MSD and iQue assays was caused by any interference from other proteins in BALF samples, we analyzed the calibration standards from the MSD 4-plex mouse IL-2, IL-6, TNFα, and KC/GRO kits on the iQue ( Fig. 2 ) and the calibration standards from the iQue 4-plex mouse IL-2, IL-6, TNFα, and KC/GRO on the MSD assay (data not shown). Using these calibration standards, we again observed good correlations between the iQue and MSD assays with R2 values more than 0.9. However, when comparing the expected concentrations for the calibration standards reported in the MSD certificate analysis supplied with the kit with the values we measured by iQue, we observed lower concentrations for mouse IL-2, IL-6, and KC-GRO, with high slope values at 5–11 ( Fig. 2 ). When we compared the expected concentrations of these same cytokines in the calibration standards supplied with the iQue assay and measured their concentration using the MSD platform, we observed low slope values at 0.1–0.2; that is, higher concentrations of mouse IL-2, IL-6, and KC/GRO were detected by MSD than reported in the iQue certificate of analysis for these cytokines. Taken together, these results suggest that the absolute values of cytokine concentrations measured can dramatically vary from one platform to the other, with MSD usually resulting in higher values.
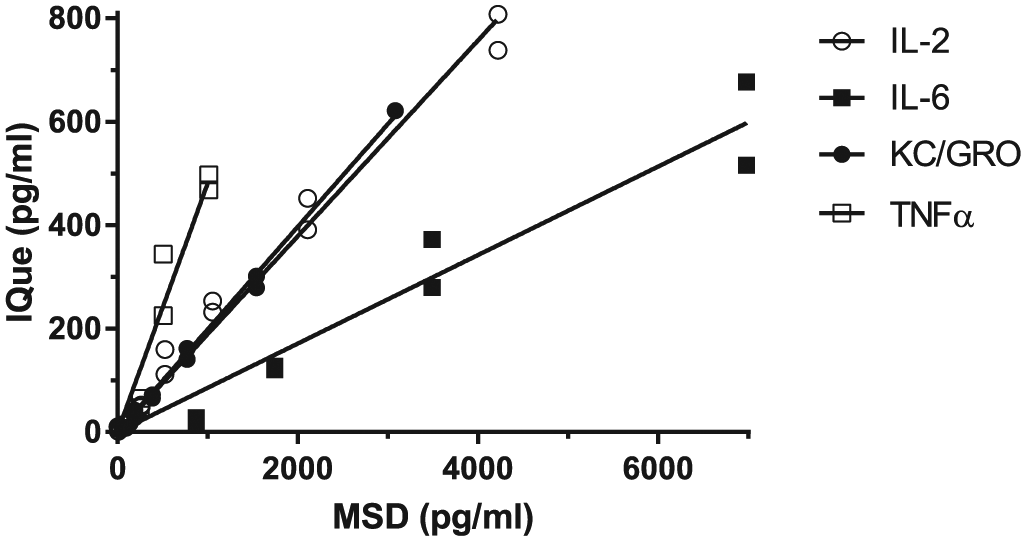
MSD mouse IL-2, IL-6, KC/GRO, and TNFα 4-plex calibration standards analyzed in the iQue QBeads assay. Twelve-point MSD mouse 4-plex cytokine calibration standards with twofold serial dilution were run in duplicates on iQue. iQue raw data for each MSD cytokine were converted to cytokine concentrations using a four-parameter sigmoidal fit of the standard curves of the respective iQue standards (log-log values). Assay correlation analysis between the expected MSD cytokine concentrations (x axis) and measured cytokine concentrations on iQue (y axis) was performed using linear regression through point (X0, Y0). Empty circle = IL-2; solid square = IL-6; solid circle = KC/GRO; empty square = TNFα.
iQue versus MSD (Human Cytokines)
The levels of IL-6, IL-10, TNFα, and IL-12p70 in the supernatants from human MO-DCs treated with rapamycin or vitamin D3 + dexamethasone were analyzed in a 96-well MSD assay and compared with the levels measured in the 384-well human iQue QBeads assay. For the MSD assay, the samples were diluted two times to enable the cytokine concentrations to be within the standard curve limits. Undiluted samples were analyzed in the iQue assay using the miniaturized assay protocol.
The iQue assay showed very good correlation with the MSD assay ( Fig. 1I–L ) with R2 values ranging from 0.91 to 0.97 for the four human cytokines analyzed. The slopes of the regression for IL-6, IL-10, and IL-12p70 were from 0.28 to 0.48, indicating that concentrations determined in the iQue assay for these three human cytokines were two- to threefold increased compared with those obtained in the MSD assay. For TNFα, the slope was 2.29; therefore, the concentrations determined in the iQue assay for TNFα were about twofold reduced compared with those obtained in the MSD assay. Results from the spike recovery experiments by spiking cell culture medium and cell culture supernatants with cytokine standards showed good recovery for IL-6, IL-12p70, and TNFα with 104%–110% recovery in the MSD assay and 90%–99% recovery in the iQue assay. Slightly lower recovery was observed for IL-10, 85%–91% in the MSD assay and 84% in the iQue assay.
iQue versus HTRF or AlphaLISA (Human Cytokines)
The levels of IL-10 and TNFα in the culture supernatants from the THP-1 cell assay measured in a single-plex 384-well format HTRF assay and the level of IL-2 in the culture supernatants from the CD4+ cell assay analyzed with a single-plex AlphaLISA assay were compared with the levels measured in the human multiplex iQue QBeads assay.
The iQue assay showed very good correlation and good quantification agreement with the AlphaLISA ( Fig. 1F ) and HTRF assays ( Fig. 1G,H ) with R2 and slope equal to 0.92 and 1.02 for iQue versus AlphaLisa human IL-2, and 0.96 and 1.5 for iQue versus HTRF human TNFα, respectively. But, the R2 value for iQue versus HTRF human IL-10 was very low, only at 0.36, and the slope was 7.3. This high slope value suggests that concentrations determined in the iQue assay for human IL-10 were substantially lower than those obtained in the HTRF assay.
Treatment of THP-1 cells with increasing concentrations of the SIK inhibitor HG-9-91-01 gave a dose-dependent reduction in TNFα and a bell-shaped increase in IL-10. While samples needed to be diluted six times to enable the TNFα concentrations to be within the standard curve limits in the HTRF assay, the larger detection range of cytokines in the iQue assay allowed the use of either undiluted samples or samples diluted six times and gave very similar IC50 values (IC50 120 nM) for samples diluted six times in both assays. The IC50 measured using undiluted samples in the iQue assay was slightly higher at 215 nM ( Fig. 3 ). The IL-10 concentrations were very low, and no dilutions were necessary for either method. Despite the lower values measured for IL-10 with the iQue assay than the HTRF assay, the peak effect of HG-9-91-01 was between 0.1 and 1 µM in both assays, suggesting that these variations in the absolute cytokine values have no impact on the assay end result.
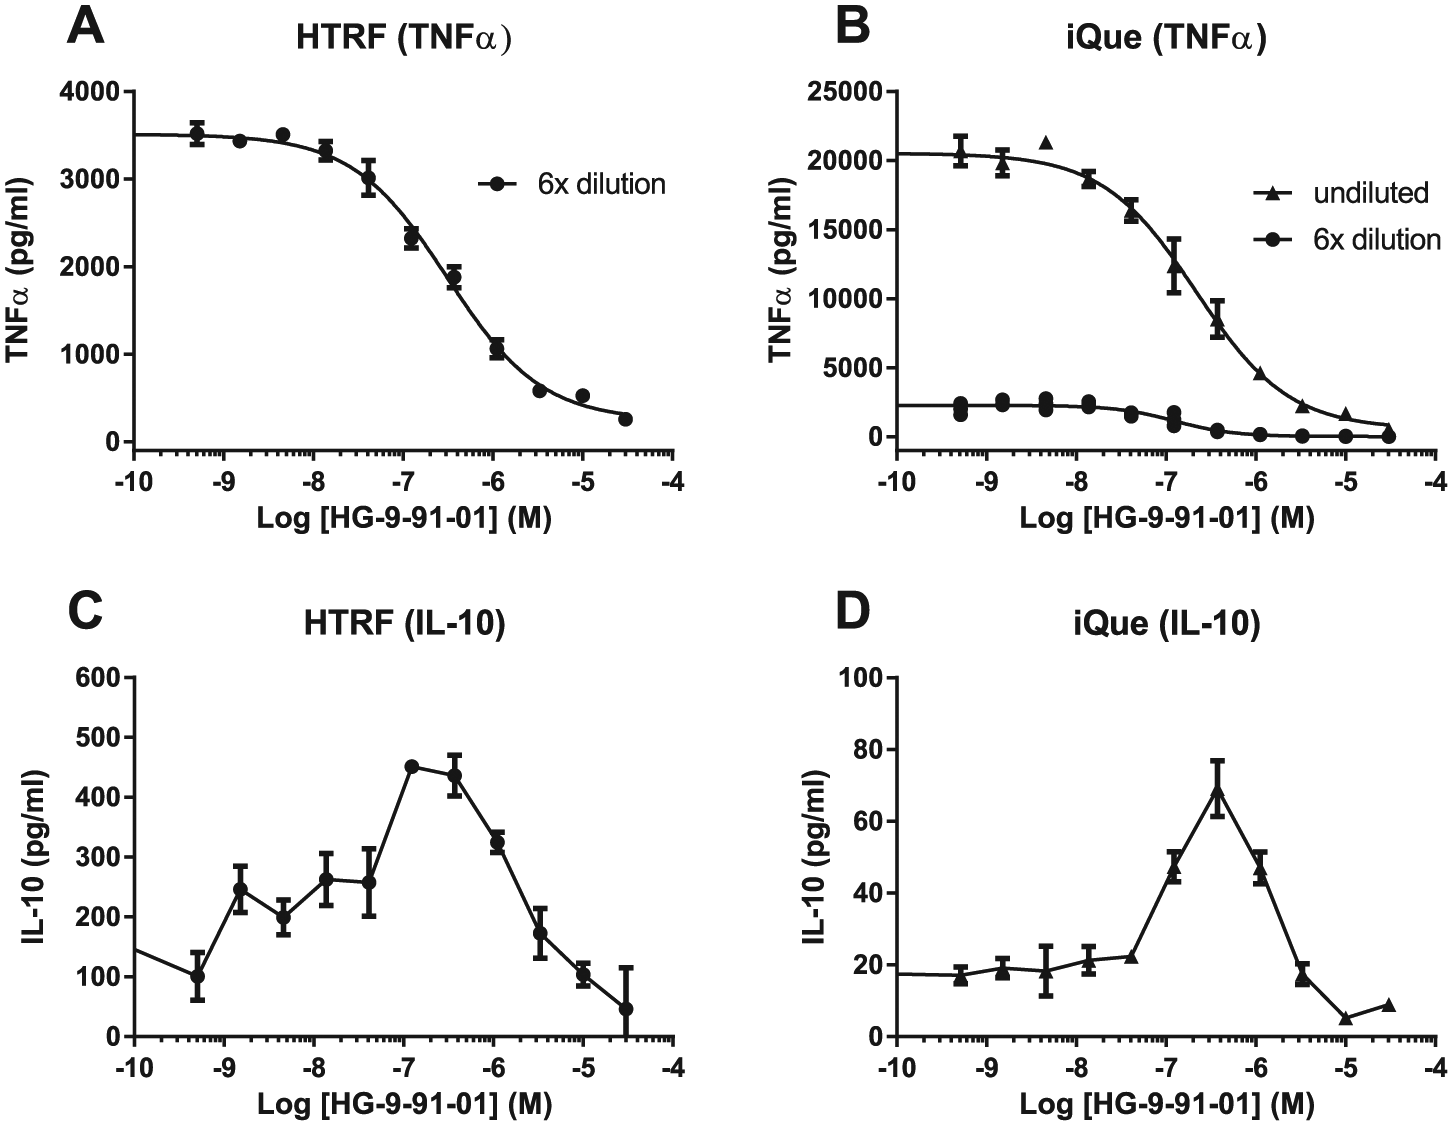
Effect of SIK inhibitor on TNFα and IL-10 levels in PMA-differentiated and LPS-stimulated THP-1 cells. (
iQue Assay Miniaturization
The recommended iQue assay protocol generates 30 µL/well of bead suspensions. However, only 1–1.5 µL/well of bead suspension is required for sample reading on iQue. This property allows iQue assays to be easily miniaturized by using smaller volumes of samples, capture beads, and detection reagent. We evaluated the miniaturized iQue assay using a human IL-2 QBeads assay kit and supernatants from human CD4+ cells treated with two NF-κB pathway inhibitors (compounds A and B). In the miniaturized assays, 2 µL of supernatants or human IL-2 standard, 2 µL of capture beads, and 2 µL of detection reagents were loaded into each well in 384-well plates instead of 10 µL/well of samples and reagents. The IL-2 results generated using the miniaturized human IL-2 QBeads assay protocol were very similar to the results using the standard human IL-2 QBeads assay protocol ( Fig. 4 ), resulting in a similar IC50 of 1.07 µM (miniaturized protocol) versus 1.06 µM (standard protocol) for compound A, and IC50 of 0.82 µM (miniaturized protocol) versus 0.69 µM (standard protocol) for compound B. These results showed that it was feasible to use only 20% of samples and assay reagents, thereby reducing sample consumption and reagent cost while maintaining assay sensitivity, quality, and reproducibility by using a modified miniaturized iQue QBeads assay protocol.
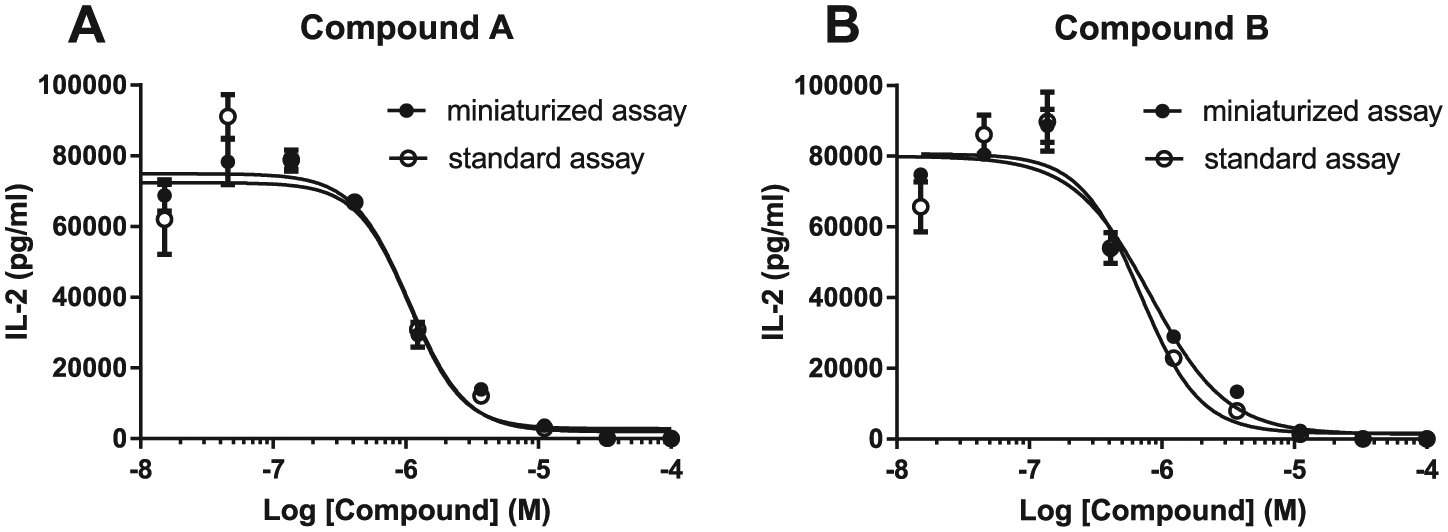
IL-2 levels analyzed in the supernatants from the human CD4+ cell assay using the iQue QBeads miniaturized protocol (solid circle) versus the iQue standard assay protocol (empty circle). (
Discussion
Quantitative measurement of cytokines in biological samples provides very important information for the diagnosis of diseases, clinical drug studies, and drug discovery. The most commonly used technologies for cytokine quantification are immunoassays.1,2 In the present study, a high-throughput flow cytometry iQue QBeads assay was compared with MSD, ELISA, Luminex, HTRF, and AlphaLISA assays for studying the release of mouse or human cytokines from in vivo and in vitro models. The results presented here showed that there were overall good correlations between the iQue assays and the MSD, ELISA, HTRF, and AlphaLISA assays for the cytokines studied. Although an overall good correlation was observed, our results showed variation in cytokine concentrations measured in the compared assays.
Detection Range
The ELISA showed a very narrow detection range with a factor of 60 for mouse RANTES. The iQue assay detection ranges, with a factor of 500 for the majority of the human and mouse cytokines measured in this study, suggest that the iQue assays had a broad detection range. The MSD assays also had broad detection ranges with a factor of 500 for several human cytokines and 2000–4000 for the mouse cytokines. The detection range of the AlphaLISA IL-2 assay was very broad, from 0.13 up to 60,000 pg/mL, corresponding to a factor of more than 450,000. These differences in cytokine detection ranges seem to be technology dependent rather than cytokine dependent. Broad detection ranges enable samples with a high variability in analyte levels to be analyzed in the same assay without the need for differentiated dilutions. For multiplex assays, this is also very important if the concentration levels of one analyte are high, requiring sample dilution, while for another analyte in the panel the levels are low, requiring undiluted samples. In these cases, the samples may need to be analyzed twice with different dilutions, resulting in greater time, resource, and sample requirements.
As an example, the THP-1 analysis required a sixfold sample dilution of the THP-1 supernatants for measuring TNFα in the HTRF assay, and undiluted samples were required for the IL-10 HTRF assay. Due to the greater dynamic range observed, these analytes could be analyzed at the same dilution level using the iQue assay.
Assay Correlation and Absolute Cytokine Values
R2 values greater than 0.9 for a majority of the compared human and mouse cytokine assays suggest very good correlation between the iQue QBeads assays and the corresponding MSD, HTRF, and AlphaLISA assays. We also observed reasonably good correlation between the iQue assays and ELISA mouse RANTES and Luminex mouse IL-2 assays, with R2 values at 0.65–0.7. However, the correlation between iQue and HTRF human IL-10 was poor, with an R2 value at 0.36. One potential factor contributing to this low R2 value could be that IL-10 concentrations in the studied samples were quite low, close to the detection limit. In summary, these assays correlate well on a relative level, meaning that analyte levels in the sample sets will be ranked similarly for the various assay formats.
The obtained slope values at 0.9–1.5 for iQue versus MSD mouse TNFα, HTRF human TNFα, and AlphaLISA human IL-2 indicate that the iQue and these compared assays showed good quantification similarity. However, absolute cytokine values of mouse IL-2, IL-6, and KC/GRO in mouse BALF samples; mouse IL-2, IL-6, and KC/GRO MSD standards; and human IL-10 in THP-1 supernatant in the iQue assays were substantially lower than those obtained in the comparing assays, with slope values at 3–7.9. Moreover, the absolute cytokine values in the MO-DC supernatants determined in the iQue assays were two- to threefold higher for human IL-6, IL-10, and IL-12p70, and twofold lower for human TNFα compared with those obtained in the MSD assays. These discrepancies suggest that absolute values for some cytokines determined in the iQue assays differed significantly from those in the comparing assays, and the difference was cytokine dependent rather than technology dependent. Variation in absolute values of analytes determined in different assay platforms has been reported previously, such as ELISA kits from different suppliers,11,20 Luminex kits from different suppliers, 21 between ELISA and Luminex assays,10,14,22 and between MSD and Luminex assays. 7 The immunoassays compared in this study utilize the reaction between antigen and antibody, demonstrating the importance of antibodies used in immunoassays to generate similar results. The source of antibodies for capture and detection used in the iQue assays might be different from what is used in the other assays, for example, polyclonal versus monoclonal antibodies, recognition of different epitopes of the analyte, and different binding affinity and specificity toward the analyte. These factors can contribute to the observed difference in absolute cytokine values between the compared assays. The lower absolute values of MSD standards of mouse cytokines in the iQue assay and the higher absolute values of iQue standards of mouse cytokines in the MSD assay suggest that the cytokine standards used in these assays may also contribute to the observed difference. For the assays we compared in this study, we have to rely on the antibodies and standards provided with the assay kits for quantification. Therefore, it is not surprising that we observed good assay correlation but different absolute levels of cytokines in different assays in the same sample sets. Furthermore, the supernatant samples in this study contain 10% FBS, and an effect of serum on immunoassays was reported previously.23,24
In drug discovery, immunoassays are commonly used for studying cytokine release by quantifying cytokine levels in samples receiving vehicle versus compound treatment, in samples from pre- versus posttreatment, and in samples from normal versus disease models. Changes in cytokine levels in the studied samples are the most important parameters studied, rather than absolute levels. Despite different absolute cytokine values being obtained for some cytokines in different assays, the present results show similar trends of cytokine-level changes in the studied samples in the MSD, ELISA, Luminex, HTRF, and AlphaLISA assays, suggesting that the iQue QBeads assay is a technology suitable for screening for compound effect on cytokine release in drug discovery. If absolute values of analytes are very important parameters to study, then common analyte standards should be used for calibration of the assays if different assays need to be used. The observation of substantially lower levels of some cytokines using iQue assays highlights a potential assay sensitivity challenge when applying iQue assays on low-concentration analytes.
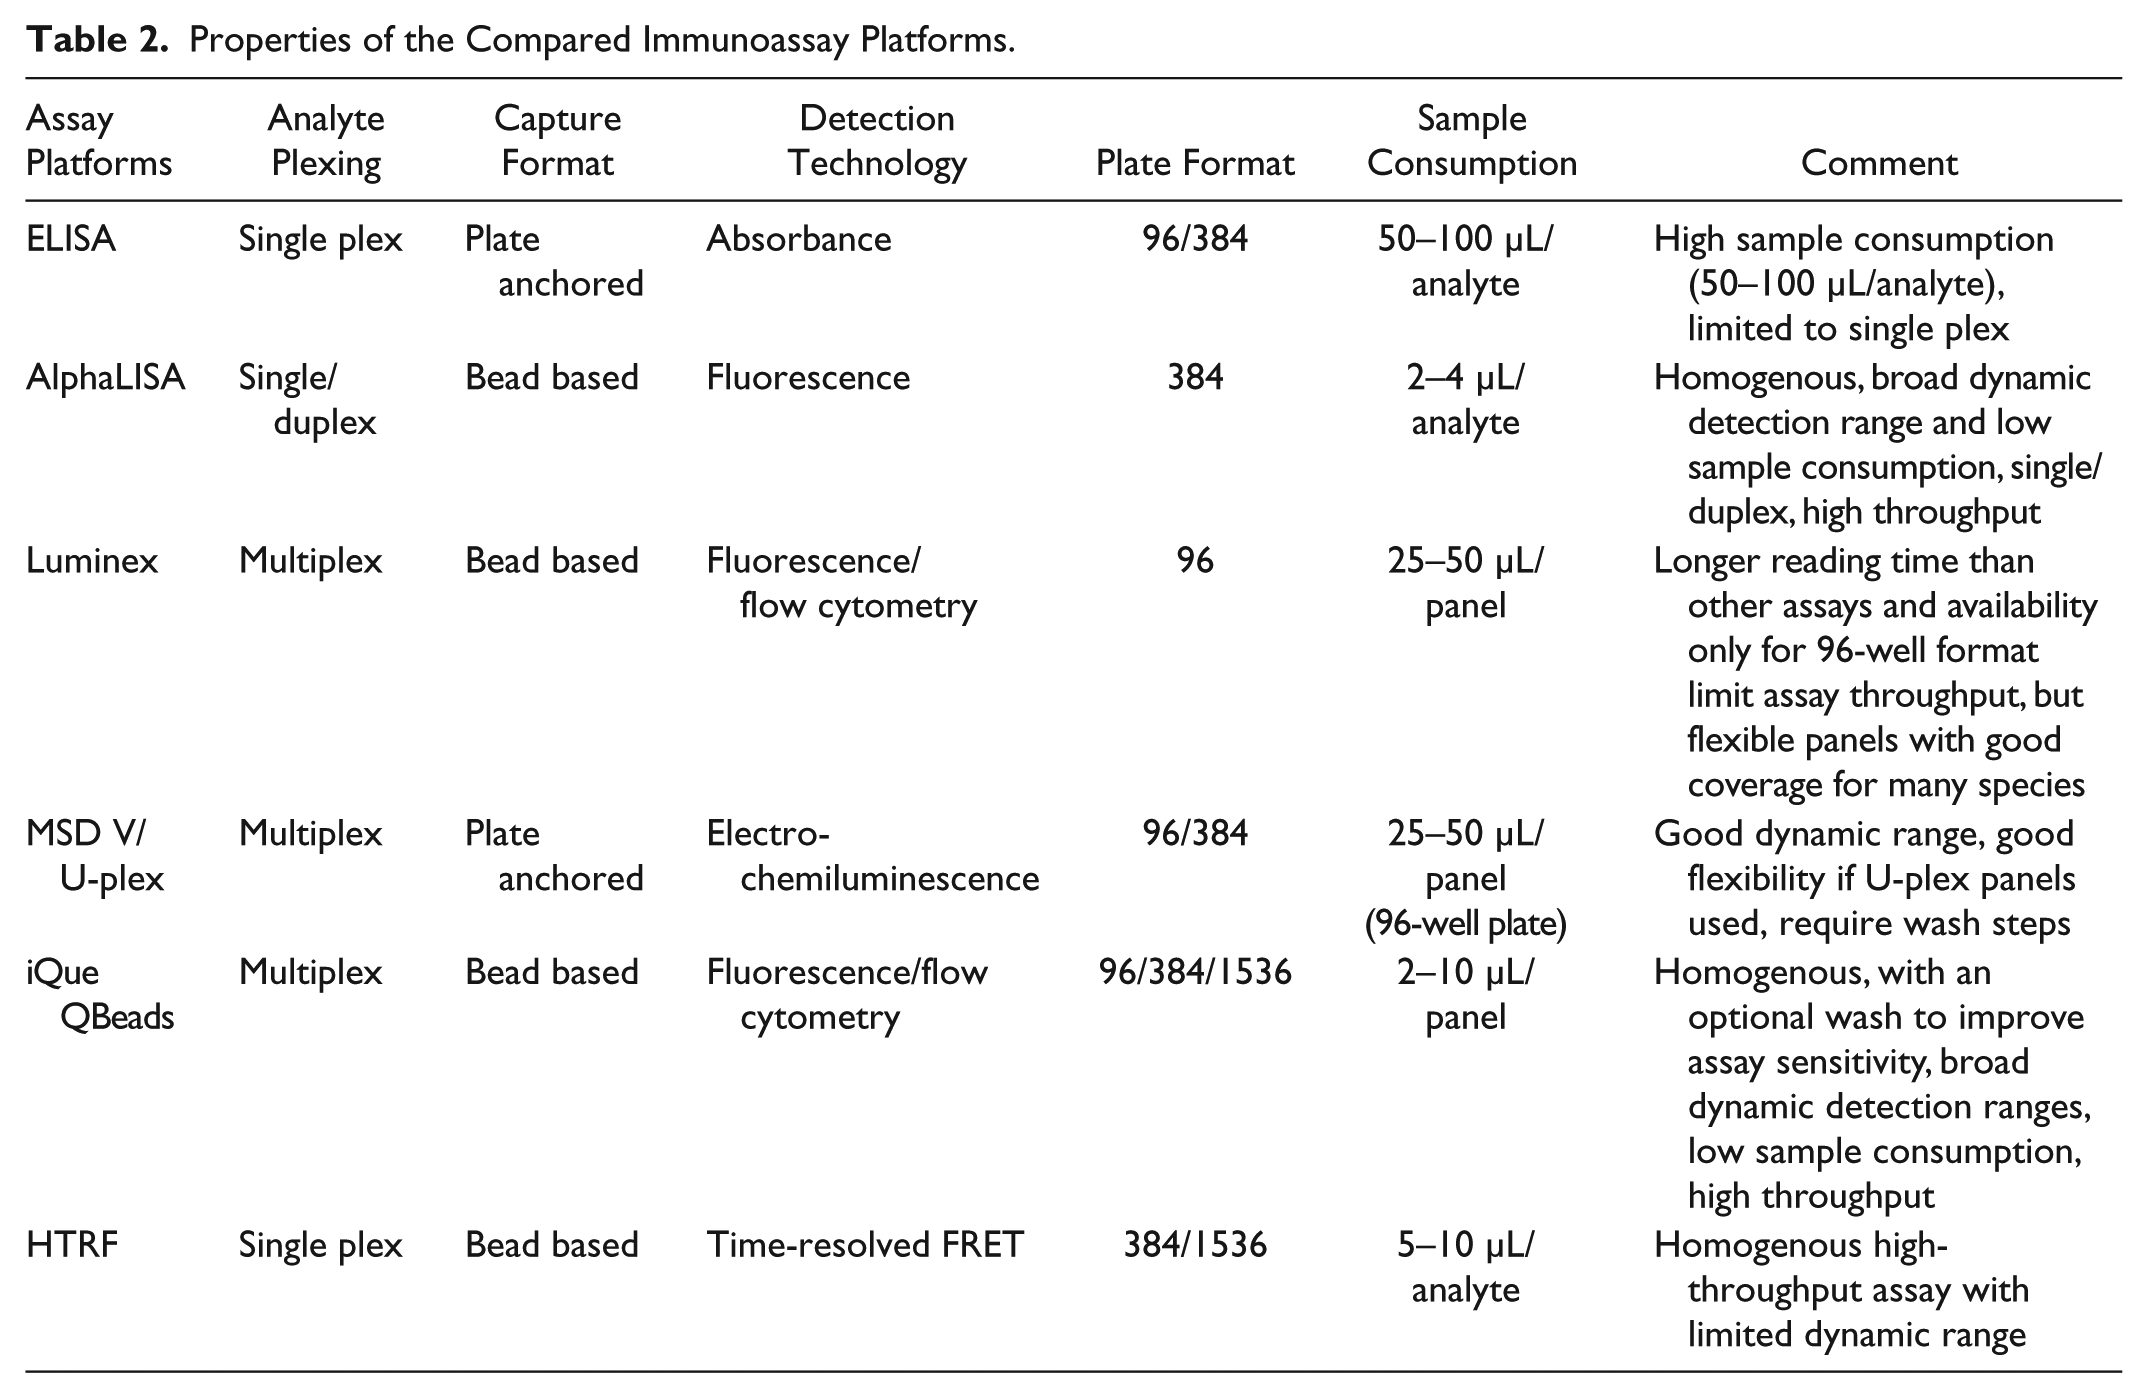
Each assay technology has its own advantages and disadvantages. Table 2 shows a summary of the properties of the compared assays. All these immunoassays have been run in our labs to support early drug discovery projects. The assay properties define where they are best used. ELISA has the advantage of a large selection of assay kits on the market for a wide range of species. However, it is limited to single-plex approaches and low-assay-throughput applications. HTRF and AlphaLISA are also single-plex approaches, although the AlphaPlex enables duplexing. 25 However, both HTRF and AlphaLISA assays are well suited for high-throughput screening of single analytes by being homogeneous no-wash assays and having a wide range of kits for human and mouse analytes. MSD, Luminex, and the new iQue assays offer the great multiplex assay advantage, resulting in savings in time and sample consumption, and have wide detection ranges. Luminex has the advantage of flexible multiplex panels available for most commonly used species, but the long reading time and the use of 96-well plates make it best suited for profiling smaller sample sets. MSD also has analyte kits for several species. The U-plex and R-plex approaches provide a greater panel flexibility. It should be noted that as a higher-throughput option, MSD plates are available in 384-well format, where up to four analytes can be analyzed in multiplex. The iQue assay protocol is simple, with three additions and two incubation steps, followed by sample analysis on an iQue Screener, a high-throughput flow cytometry platform. The flexibility of reading samples on 96-, 384-, and 1536-well plates on iQue Screener platforms enables high-throughput screening of large sample sets. The possibility to miniaturize iQue assays by using 2 µL samples and 2 µL reagents results in significant reduction of reagent cost per cytokine and sample consumption to a level increasing its superiority compared with the other immunoassays we used. The bead-based iQue approach also provides great flexibility in creating customer-desired panels for each analysis. As such, the iQue combines many of the advantages of the other formats regarding time/cost efficiency, throughput, flexibility, and dynamic range. This, in combination with the good correlation with the compared assays, makes the iQue assay a very interesting option for screening multiple analytes of large sample sets in a medium- to high-throughput manner. However, the panel coverage of the assay-ready QBeads PlexScreen reagents, especially for rodent analytes, is still limited, although QBeads DevScreen kits (IntelliCyt) are available for researchers to develop their own QBeads assays to study other proteins of interest. Reagent developments of QBeads PlexScreen assay-ready kits to have good analyte coverage are needed for broader applications of iQue QBeads assays in drug discovery screening.
Properties of the Compared Immunoassay Platforms.
In summary, this study demonstrated good correlation between the compared assays, and the iQue flow cytometry QBeads assays offer benefits regarding dynamic range as well as cost and time efficiency for multiplex screening of large amounts of samples. However, multiple parameters need to be considered when choosing assay technologies to achieve optimal performance for each application.
Footnotes
Acknowledgements
The authors would like to thank Tobias Hedberg for generating the AlphaLISA assay results, Céline Dumont and Corinne Hamblet for critical reading of and comments on the manuscript, and José Sanchez for advising the statistics analysis.
Declaration of Conflicting Interests
The authors declared the following potential conflicts of interest with respect to the research, authorship, and/or publication of this article: All authors are employees of AstraZeneca.
Funding
The authors received no financial support for the research, authorship, and/or publication of this article.