
Abstract
A key step in the therapeutic antibody drug discovery process is early identification of diverse candidate molecules. Information comparing antibody binding epitopes can be used to classify antibodies within a large panel, guiding rational lead molecule selection. We describe a novel epitope binning method utilizing high-throughput flow cytometry (HTFC) that leverages cellular barcoding or spectrally distinct beads to multiplex samples to characterize antibodies raised against cell membrane receptor or soluble protein targets. With no requirement for sample purification or direct labeling, the method is suited for early characterization of antibody candidates. This method generates competitive binding profiles of each antibody against a defined set of known or unknown reference antibodies for binding to epitopes of an antigen. Antibodies with closely related competitive binding profiles indicate similar epitopes and are classified in the same bin. These large, high-throughput, multiplexed experiments can yield epitope bins or clusters for the entire antibody panel, from which a conceptual map of the epitope space for each antibody can be created. Combining this valuable epitope information with other data, such as functional activity, sequence, and selectivity of binding to orthologs and paralogs, enables us to advance the best epitope-diverse candidates for further development.
Introduction
A successful therapeutic antibody drug discovery process requires rigorous molecule selection to ensure that a molecule can be manufactured and is also maximally efficacious in the clinic. This selection process will typically include screens to characterize binding properties, including affinity and selectivity and, whenever possible, a functional screen to assess activity. In addition, epitope information can often complement or even drive the selection strategy, especially in cases such as targeting warheads for drug delivery where there is limited scope for a functional readout during the early discovery phase. The epitope is a characteristic of an antibody’s functional capacity and is an innate property that cannot be engineered, unlike its affinity.1–3
An antibody’s epitope can be defined at the molecular level using techniques such as crystallography to characterize the antibody antigen complex. 4 Alternatively, epitopes can be also assessed using low-resolution but high-throughput techniques. These techniques can be used to profile a panel of antibodies and effectively classify or “bin” the samples relative to each other on epitope diversity and similarities. Antibodies that bind to similar target epitopes often share similar function;5,6 hence, identifying epitope bins with functional activity can provide several sequence-diverse lead candidates to choose from. A panel of antigen-specific antibodies may also contain more than one functional epitope bin. This is also advantageous in the early selection process as diverse functional epitope bins may have different methods of action on the antigen. Identifying pairs of antibodies that can simultaneously bind the antigen (sandwiching antibodies) is also beneficial, as reagents in other assays require this sandwiching interaction.6,7
Antibodies that cluster to diverse nonfunctional epitope bins are useful for lead candidate selections for Bi-Specific T-Cell Engager (BiTE) or antibody drug conjugate (ADC) molecules where a functional antibody epitope is not imperative but defining epitope diversity is important. BiTE molecules can associate T cells and target cells via binding to CD3 and a selected surface target antigen.8,9 In some cases, the binding epitope distance of the antibody to the target cell membrane and the antigen size can determine the potency of the BiTE molecule for T-cell-mediated target cell lysis. 7 In the case of ADC molecules, the binding epitope can dictate the internalization rate of these molecules in cancer cells, an important parameter to consider for ADC development.10,11 These examples highlight the importance of interrogating diverse epitope bins to select the very best lead molecules.
While epitope information can be very useful early in the antibody discovery process, this can be challenging information to generate on large panels of thousands of potential molecules of interest for any given target antigen. Some of the challenges include crude unpurified antibody supernatants, low antibody concentrations, lack of assay throughput and sensitivity, binning on membrane receptor targets on live cells, and rapid analysis time.
Traditional methods of epitope binning, such as enzyme-linked immunosorbent assay (ELISA), can only detect single-pair antibody interactions and are low throughput. More recent epitope binning methods using multiplexing with Luminex beads show more promise in capacity and novel label-free approaches, but many of these assays have cumbersome multistep protocols and are limited to detection of specific species of antibodies. 12
New-generation biolayer interferometry (BLI) platforms, such as Octet by FortéBio (Fremont, CA; a division of Pall Life Sciences), offer added benefits of label-free epitope binning, such as less hands-on time and ease of sample preparation. Carterra Inc. (Salt Lake City, UT) has combined microfluidics technology, surface plasmon resonance (SPR), low sample consumption, enhanced throughput, and sophisticated analysis software tools to enhance epitope binning. 5 Although advantageous over older methods of epitope binning and compatible with unpurified samples, these systems are limited by either high up-front and consumable costs or compatibility issues with membrane receptor targets presented in native states on live cells.
Herein we present a novel epitope binning method applied to two different classes of target antigens. The method generates competitive binding profiles for antibody panels against a large set of reference antibodies derived from within the newly generated panel itself. By determining the degree of correlation of these profiles, we are able to quickly and accurately bin an antibody panel without exhaustive antibody pairing interactions. Throughput is enhanced by leveraging high-throughput flow cytometry (HTFC) platforms and multiplexing using either cellular barcoding for membrane antigens13,14 or spectrally distinct beads for soluble antigens 15 to generate these binding profiles.
This powerful high-throughput multiplexed epitope binning assay is advantageous because it can screen through more antibody–antibody interactions per well simultaneously and is broadly applicable across all host species used for antibody discovery. Using crude or purified samples, this method overcomes common epitope binning obstacles with the ability to bin larger panel sizes of antibodies with low-volume samples, creating competitive binding profiles for unique analysis, rather than individual antibody–antibody interactions. Comparing antibody sequences of each epitope bin identified with each other and other validated platforms further validates the robustness of this method.
Materials and Methods
A schematic representation of the workflow is shown in Figure 1 .
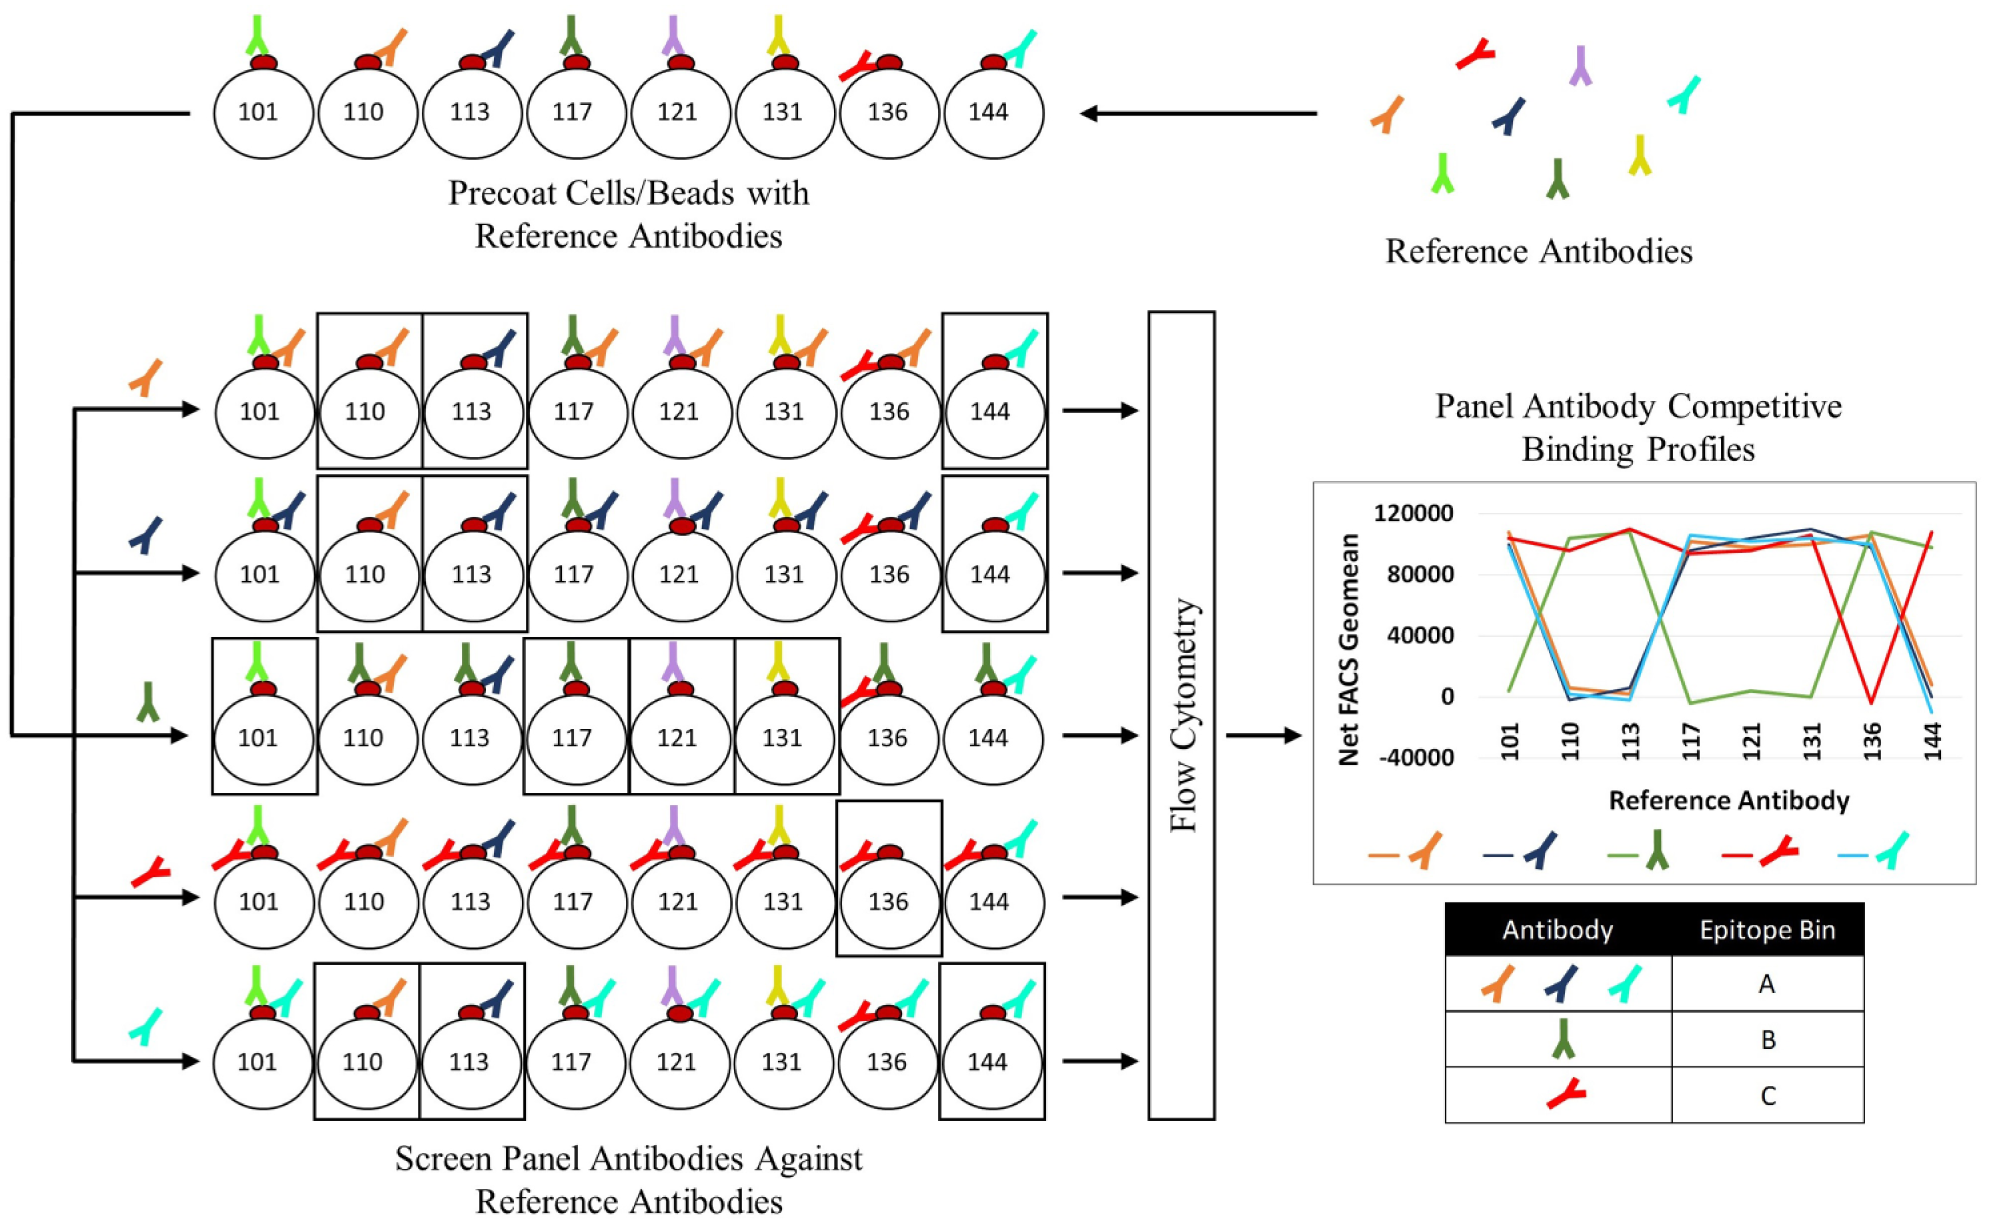
Workflow schematic of epitope binning using competitive binding profiles. Reference antibodies are selected from a panel of antibodies to precoat target protein on either barcoded cells or multiplexable beads—bead IDs 101, 110, 113, 117, 121, 131, 136, and 144 in the schematic. Beads are pooled and then individual panel antibodies are added to the bead mix; competing antibodies to the reference antibodies will be unable to bind, as illustrated in the boxes. The total bound antibodies are then detected with a labeled secondary antibody and read by flow cytometry. The net binding signal of each panel antibody is calculated relative to the reference antibody, generating a series of data points that make up its competitive binding profile. Antibodies with similar binding profiles will cluster to the same epitope bin.
Generation and Production of Monoclonal Antibodies against MFI2 and CHRDL1
Fully human monoclonal antibodies were generated by immunizing IgG2 or IgG4 strains of transgenic mice (Xenomouse).16–18 Human melanotransferrin (MFI2) antibodies were generated from animals immunized with SK-MEL-28 melanoma cells (ATCC, Manassas, VA) expressing endogenous MFI2. Human chordin-like 1 (CHRDL1) antibodies were generated either by immunizing with full-length soluble protein or by genetic immunization via the Helios gene gun system (Biorad, Hercules, CA) to deliver DNA-coated gold particles (reagents generated by Amgen). Hybridomas were then generated using standard techniques 19 and then plated onto 96-well culture plates and cultured for 2 weeks to generate exhausted supernatant (ESN). Animals were housed under specific pathogen-free conditions at the Amgen Laboratory Research Facility and certified by the Canadian Council on Animal Care in strict accordance with associated standards and policies. The protocol was approved by the Animal Care Committee of Amgen British Columbia.
MFI2 Epitope Binning with Cellular Barcoding
Transient Transfection of Cell Line
Human MFI2 was transiently expressed in human embryonic kidney 293T suspension cells by transfection using cDNA vectors, Gibco Opti-MEM media (Gibco, Waltham, MA), and 293Fectin reagent (Invitrogen, Grand Island, NY) following the manufacturers’ protocols. 293T cells were grown and transfected in FreeStyle 293 Expression Medium (Thermo Fisher Scientific, Waltham, MA) with 2% fetal bovine serum (FBS) (Thermo Fisher Scientific), 37 °C, 5% CO2, with shaking at 235 rpm. Cells were harvested 24 h posttransfection and washed 2× with FACS buffer (1× phosphate-buffered saline [PBS] + 2% FBS) by centrifugation for 2 min at 2500 rpm prior to barcode staining. Cell surface expression was confirmed in flow cytometry using MFI2 antibody L49 (Creative Biolabs, Shirley, NY).
Cellular Barcoding
MFI2 cells were barcoded as previously described.13,14 Briefly, cells were transferred into six tubes at 107 cells/tube, cells pelleted, and supernatant decanted. Cells were then resuspended in 10 mL (106 cells/mL) of either (amine-reactive) Oregon Green (Thermo Fisher Scientific) at 16 and 1 µM or 5-carboxytetramethylrhodamine (5-TAMRA) (Thermo Fisher Scientific) at 62, 4, and 0.2 µM in FACS buffer. One tube of cells was left unstained in order to create a total of six populations, each with a distinct fluorescent signature or barcode. Cells were incubated for 10 min at room temperature (RT) in the dark, washed 3× with FACS buffer, and then resuspended to 106 cells/mL. One hundred microliters of each barcoded cell population was pooled, and resolvability of the populations was confirmed via flow cytometry ( Fig. 2A ).
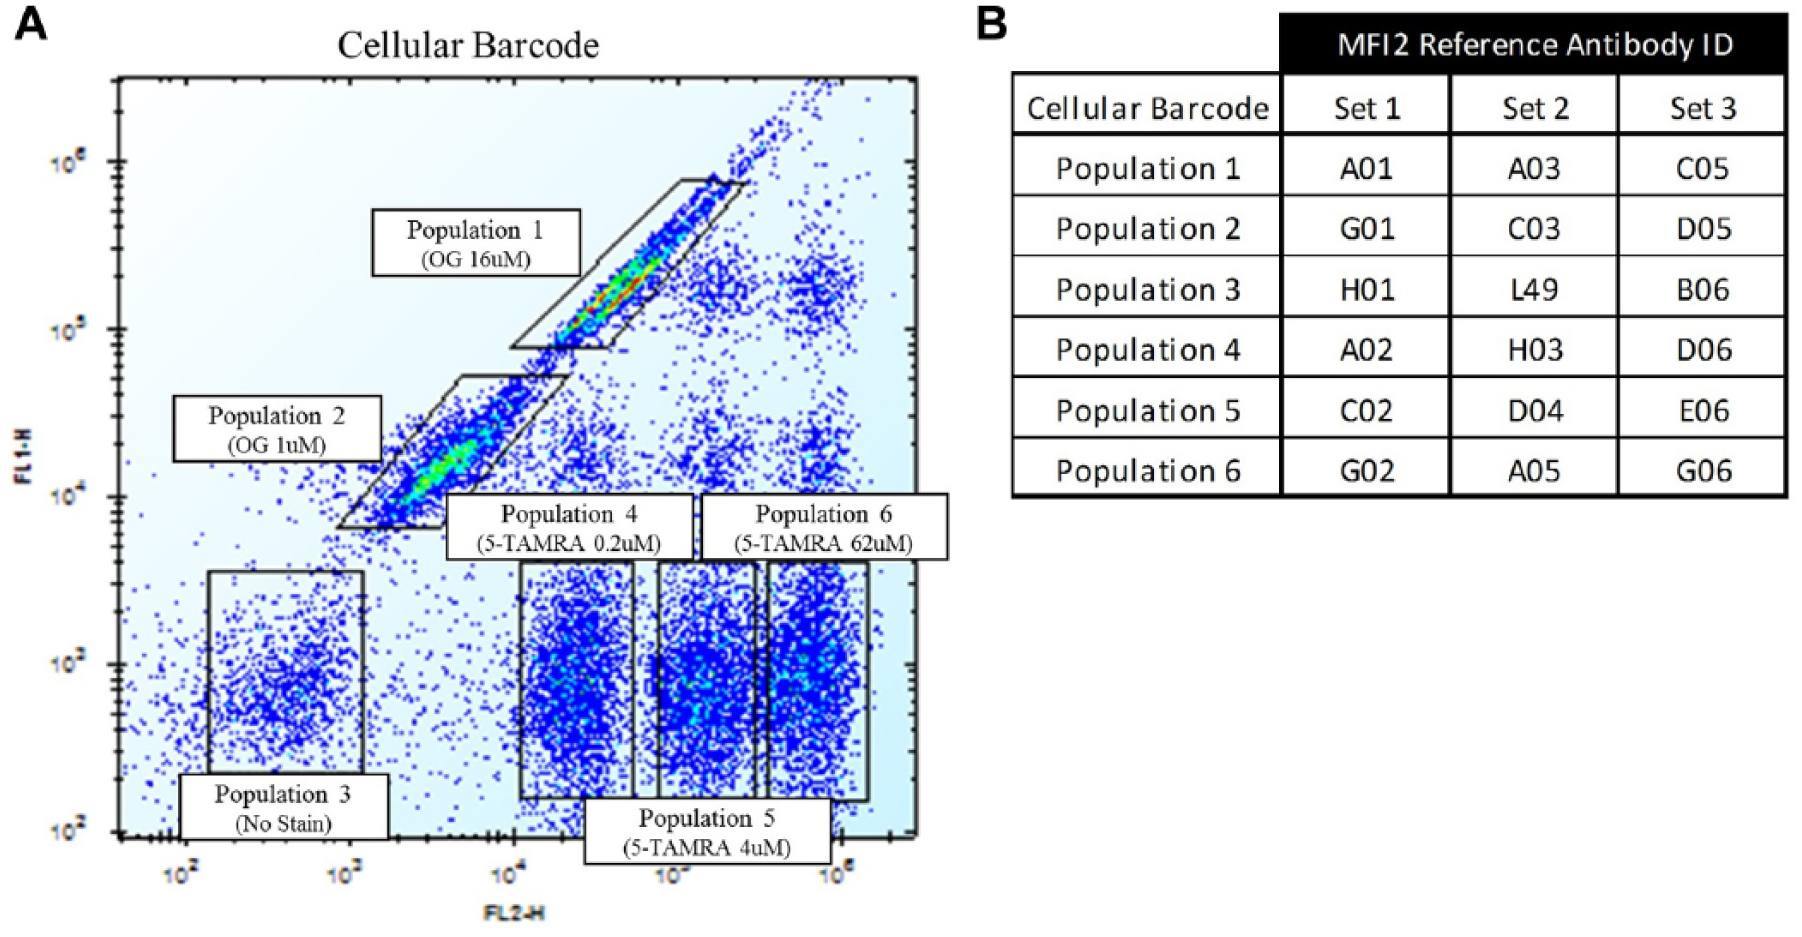
MFI2 cellular barcoding to enable high-throughput generation of antibody competitive binding profiles. (
Epitope Binning Assay with Cellular Barcoding
To create competitive binding profiles of the MFI2 antibody panel, barcoded cells were first precoated individually with reference antibodies consisting of 17 random antibodies selected from the MFI2 binding panel and antibody L49 at 5 µg/mL, 106 cells/mL, 1 h at 4 °C in FACS buffer according to Figure 2 . Cells were then washed 2× with FACS buffer, made to 6 × 10⁶ cells/mL, and pooled to create sets 1, 2, and 3 consisting of six barcoded populations each ( Fig. 2B ). Twenty-five microliters of each set of cells (25,000 cells/population) was then incubated with 25 µL of MFI2 unnormalized ESN (final 1:2 dilution) or L49 (final 5 µg/mL) in 96-well, V-bottom plates for 1 h at 4 °C. Cells were then washed 2× with FACS buffer, and then bound antibodies were detected with Alexa Fluor 647/Fab goat anti-human IgG Fc antibody (Thermo Fisher Scientific) for the MFI2 panel or Alexa Fluor 647/Fab goat anti-mouse IgG Fc antibody (Thermo Fisher Scientific) for L49 at 5 µg/mL final, 50 µL/well, for 30 min at 4 °C. Cells were then washed 1× with FACS buffer, resuspended in 100 µL, and read on an Accuri C6 Cytometer (BD Biosciences, San Jose, CA) with a Hypercyt Autosampler (Intellicyt, Albuquerque, NM). Barcoded sets with reference antibody only were included in the assay to enable calculation of the second antibody over the reference antibodies. Postacquisition population gating and batch analysis was carried out using the Intellicyt Hyperview software.
CHRDL1 Epitope Binning with Multiplexed LumAvidin Beads
Biotinylation of CHRDL1
Human CHRDL1 (R&D Systems, Minneapolis, MN) was biotinylated at a 50:1 molar ratio of photoreactive biotin (Thermo Fisher Scientific) and CHRDL1 in PBS. The mixture was prepared in a clear Eppendorf tube and exposed to UV light for 20 min in a UV Stratalinker system (254 nm UV bulbs, 15 W/bulb) (Stratagene, La Jolla, CA). Free biotin was removed by washing the protein 3× with PBS using a 5 kDa molecular weight cutoff centrifugal filter unit (Millipore, Billerica, MA).
Epitope Binning Benchmark Antibodies by Octet
Seven previously generated CHRDL1 benchmark antibodies from an earlier hybridoma campaign were epitope binned on the Octet and results were compared to the binning assay using competitive binding profiles. Octet epitope binning was completed on an Octet RED384 System (Pall ForteBio, Menlo Park, CA). Briefly, biotin-CHDRL1 was coated onto streptavidin biosensors at 5 µg/mL in 200 µL assay buffer (1× PBS + 1% BSA) at RT for 300 s. Baseline was set at 180 s prior to association of the first antibody at 20 µg/mL for 600 s and then association of the second antibody at 10 µg/mL for an additional 300 s in assay buffer at RT using 200 µL for each step. Data were analyzed by calculating the wavelength shift between the second and first antibody association (the end of the second association minus the beginning of the second association). These seven benchmark antibodies were then used to evaluate epitope diversity of a newly generated CHRDL1 antibody panel.
Coating CHRDL1 on LumAvidin Beads
xMAP LumAvidin microspheres or beads (Luminex Corporation, Austin, TX) are avidin-coupled microparticles that are color coded into 100 different spectrally distinct regions. 15 Although 100 different bead combinations are available and distinguishable on the xMAP instrument, 14 different color-coded LumAvidin beads were chosen here for their resolvability on the Accuri Cytometer ( Fig. 3A ). The 14 bead sets were vortexed for at least 1 min to break up any aggregates prior to use. Biotinylated CHRDL1 was coated onto the beads at 2 µg/mL (2.5 × 10⁶ beads/mL) for 1 h at RT in the dark. The beads were then washed 2× with FACS buffer by centrifugation for 2 min at 3500 rpm, made to 2.5 × 10⁶ beads/mL, and then kept in the dark until use.
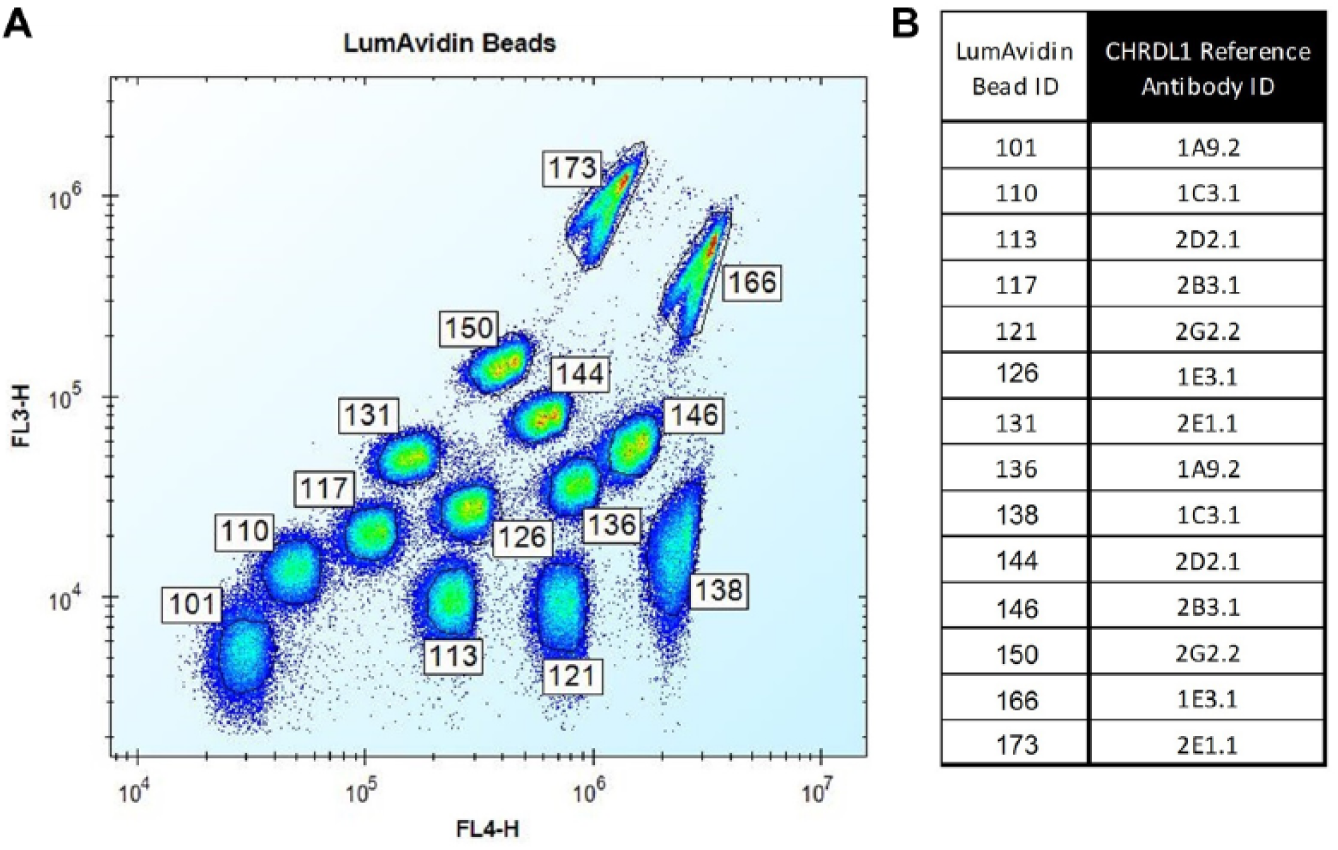
CHRDL1 multiplex using LumAvidin beads to enable high-throughput generation of antibody competitive binding profiles. (
Epitope Binning Assay with LumAvidin Beads
Competitive binding profiles of the CHRDL1 antibody panel were prepared by first precoating the CHRDL1/LumAvidin beads with the seven benchmarks as the reference antibodies, done in duplicate at 5 µg/mL, 1.25 × 10⁶ beads/mL, 45 min at RT ( Fig. 3B ). Beads were then washed 2× with FACS buffer, pooled, and then made to 1.25 × 10⁶ total beads/mL. The CHRDL1 antibody panel and benchmarks were transferred to 96-well, V-bottom plates at 20 µL/well (3.3 µg/mL final), followed by addition of 40 µL of the pooled beads (5000 of each bead/well), and incubated for 45 min at RT. Beads were then washed 2× with FACS buffer, and then bound antibodies were detected with Alexa Fluor 488/Fab goat anti-human IgG Fc antibody (Thermo Fisher Scientific) at 5 µg/mL final, 50 µL/well, for 15 min at RT. Beads were then washed 1× with FACS buffer, resuspended in 50 uL, and read on an Accuri C6 Cytometer with a Hypercyt Autosampler. Pooled beads with reference antibody only were included in the assay to enable calculation of the second antibody over the reference antibodies. Postacquisition population gating and batch analysis was carried out using the Intellicyt Hyperview software.
Competitive Binding Profile Generation, Correlation Analysis, and Bin Assignments
Binding of each antibody relative to the reference antibody was determined by subtracting the reference fluorescence signal from the total fluorescence signal (Net flow cytometry geomean = Panel antibody (Ab) and Reference Ab total geomean – Reference Ab geomean). This series of data points for each antibody creates its competitive binding profile. The degree of similarity between any two binding profiles was quantified by calculating the correlation coefficient (r) in MS Excel or a similar spreadsheet program. An algorithm was created to calculate correlation values across several or even all binding profile combinations to subsequently generate a heat map. The correlation values were then sorted to identify clustering patterns to group antibodies into epitope bins.
Results
MFI2 Epitope Binning with Cellular Barcoding
MFI2 is a 95 kDa sialoglycoprotein member of the transferrin superfamily. This iron binding protein is thought to play a role in cellular proliferation, tumorigenesis, metastasis, and migration, and is tethered to the cell membrane by a glycosylphosphatidylinositol (GPI) anchor. 20 We have previously identified a panel of 28 specific hybridoma clones against recombinant MFI2 on 293T transient cells by flow cytometry. Because downstream assays were not compatible with early functional screening, we employed an alternate selection strategy to narrow down the panel to epitope-diverse leads for further investigation. Rather than carrying out a large 28 × 28 (>8 × 96-well screening plates) sandwiching assay that is more amenable to soluble proteins and requires large amounts of ESN, we developed an epitope binning assay that preserves the native structure of MFI2 on cells and relied on competitive binding profiles against reference antibodies. Utilizing this assay with the multiplexing capacity of cellular barcoding enabled the panel to be epitope binned in less than one full 96-well screening plate.
We hypothesized that by measuring the degree of binding of an antibody relative to a series of reference antibodies, antibodies with similar binding patterns or profiles across these reference antibodies will bin to the same epitope space. Thus, competitive binding profiles can be generated for each antibody in a panel and epitope bins assigned. Furthermore, by comparing binding profiles rather than individual data points, differences due to antibody concentration or affinity would not be mistaken for a different epitope bin as the binding profile would remain similar and just be variable in its binding magnitude. This reliance on a binding profile therefore means that larger series of reference antibodies will yield a more comprehensive binding profile for any given antibody and improve the accuracy of binning assignments.
MFI2-expressing 293T transient cells were barcoded to generate a set of six cellular barcoded populations by staining the cells with titrating concentrations of Oregon Green or 5-TAMRA. Because our goal was to select antibodies to advance that had the greatest degree of epitope diversity, we generated competitive binding profiles using random reference antibodies from within the panel itself. In order to enable more comprehensive binding profiles, three sets of reference antibodies were precoated onto three sets of the barcoded cell populations to allow 18 total reference antibodies to be used ( Fig. 2 ). Included in the panel and as a reference antibody was L49, a commercial mouse monoclonal to MFI2, in order to compare epitope space. Binding of each antibody relative to the reference antibody was determined by subtracting the reference fluorescence signal from the total fluorescence signal. This analysis determines the net binding signals relative to reference antibodies for each antibody and makes up its competitive binding profile across the 18 reference antibodies.
The competitive binding profiles can then be compared together for the entire antibody panel, as shown in Figure 4A . Clusters of similar binding profiles can then be identified that represent antibodies that fall into the same epitope bin. Examples of the binding profile clusters are shown in the left panel of Figure 4B . When visualized in this way, each binding profile is similar but may differ in magnitude of signal at each data point; as noted earlier, this variability is caused by the variation in specific antibody quantity in each sample and varying affinity between antibodies of the same bin. A manual parsing of these data is not feasible for large data sets, and therefore we developed an algorithm to interrogate these data and enable rapid bin assignments. This is done by quantifying the degree of similarity between the binding profiles by calculating the correlation coefficient (r) ( Fig. 4B ). Because this is a measure of the strength of a linear relationship, antibodies with comparable profiles but with less or greater magnitude would give similar correlation values. Correlation values approaching 1 would indicate a strong positive correlation and similar epitope space, and values approaching –1 indicate a negative correlation and more exclusive epitopes. These correlation values were then represented in a heat map and sorted, and epitope bins were assigned ( Fig. 4C ). Within the MFI2 antibody panel, there were seven epitope bins, A–G. The correlation values suggest that bins A, B, and C are similar but not identical in epitope space. However, bin C has some overlap with bin D, while bins A and B do not. Bins F and G are highly related to each other as well. In addition, some potential nonoverlapping epitopes can be observed for bins A and G, as these bins yield correlation values near –1 when compared with each other. This indicates a negative correlation in that a reference antibody that affects an antibody in bin A would have less effect on an antibody in bin G, and one that affects bin G would have little effect on bin A, suggesting more exclusive epitope space. We had also included commercial antibody L49 in our panel to help evaluate our breadth of epitope coverage. L49 fell into bin D, of which we had representation in the panel. Although the actual epitope and the distance between epitopes are unknown, this qualitative information is able to provide a conceptual mapping of the epitope space.
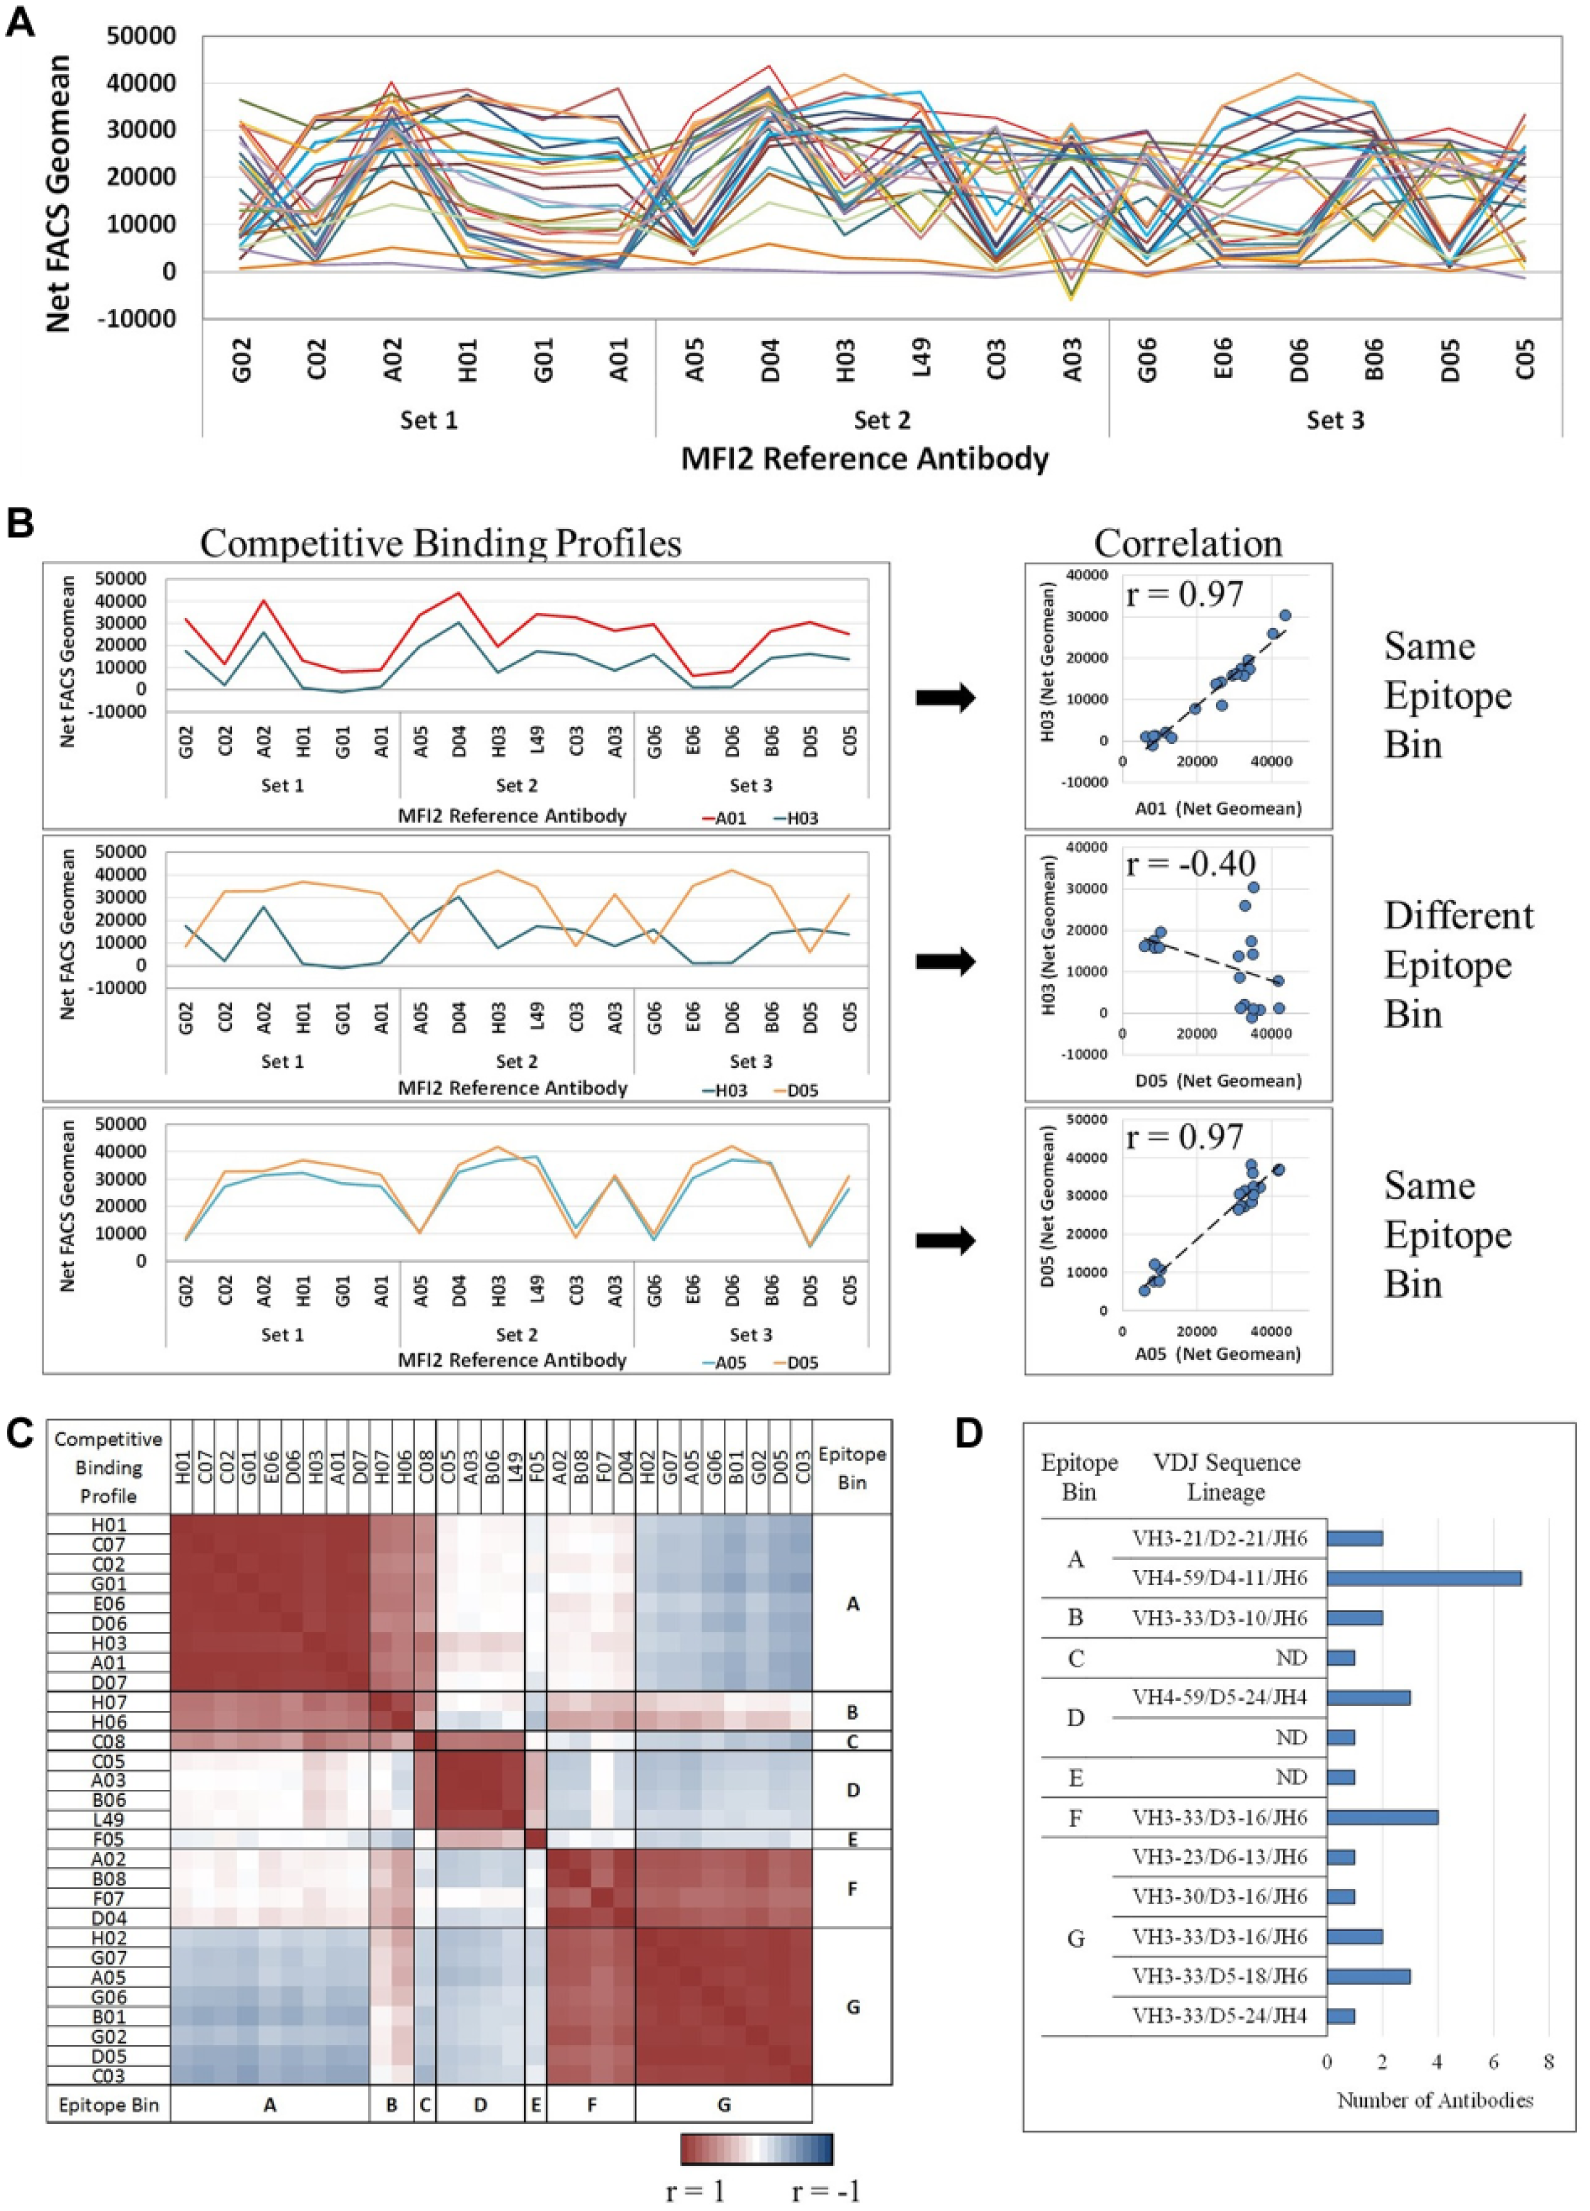
MFI2 antibody epitope binning using competitive binding profiles. (
To support the accuracy of the epitope binning method, we then sequenced each antibody to determine if antibodies of the same sequence lineage were binning together. The sequence lineage is the population of antibody sequences derived from a single naïve B cell that will have the same VDJ (variable [V], diversity [D], and joining [J] genes) recombination event. Antibody lineages were first identified by D segment similarity in the heavy chain, suggesting a common VDJ recombination event. The MFI2 antibody panel contained 9 different lineages consisting of 17 distinct antibodies with either unique complementarity-determining regions (CDRs) or differences in the locations of somatic mutations (data not shown) in the antigen binding site. Identical antibodies and antibodies within a lineage clustered to a particular epitope bin, demonstrating the accuracy of the binning assay ( Fig. 4D ). This was consistent with previous observations that antibodies with conserved sequence lineage cluster to the same bin.12,21 We did observe a few antibodies within the same lineage that fell into overlapping bins, F and G. The particular antibodies in bin G had further mutations in both the heavy and light chain CDR1 and CDR2 compared with those antibodies in bin F. By combining the epitope binning data, sequence information, and relative binding to endogenous MFI2 (data not shown), we were able to select the best antibodies from each epitope bin for evaluation in a series of functional assays.
CHRDL1 Epitope Binning with LumAvidin Microspheres
We then investigated the utility of the epitope binning assay to bin antibodies on soluble proteins. CHRDL1 is a 51 kDa secreted glycoprotein that antagonizes the function of bone morphogenic protein 4 (BMP4), preventing its interaction with receptors. It plays an important role in topographic retinotectal projection and in the regulation of retinal angiogenesis in response to hypoxia. 22 Similar to MFI2, we were unable to utilize a functional assay early in the screening cascade, and thus employed a similar strategy of selecting leads from each epitope bin to interrogate further. We had previously generated a panel of 1500 hybridoma binders to CHRDL1 and 7, more fully characterized antibodies that we considered the benchmark antibodies for comparison purposes.
Using the Octet BLI platform, we had conducted a conventional binning experiment to evaluate the seven benchmark antibodies for subsequent comparison to our binning assay using competitive binding profiles ( Fig. 5A ). Antibody competition was determined by calculating the shifts in wavelength between the ends of the first and second antibody association steps. Having few antibodies allowed us to test these antibodies in all combinations, 7 × 7 (49 sensors), and based on the competition profiles, we were able to identify six epitope bins. Antibodies 1E3.1 and 2E1.1 behaved identically and were placed in the same bin ( Fig. 5B ).
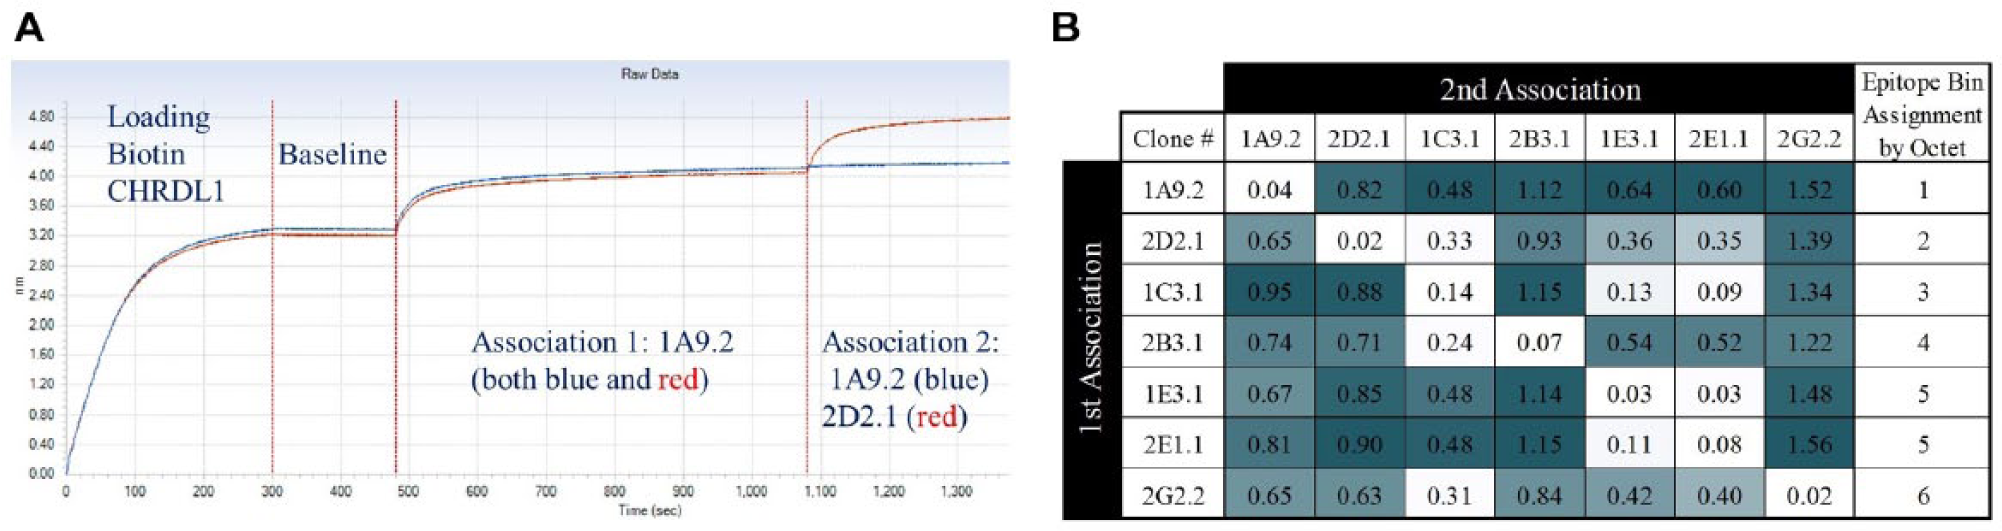
Epitope binning of CHRDL1 benchmark antibodies by Octet. (
These benchmark antibodies were then used in our epitope binning assay as the reference antibodies on CHRDL1-coated LumAvidin beads. Because these multiplexable beads were easily resolvable in flow cytometry, we decided to coat the 7 benchmarks in duplicate so that we could create competitive binding profiles across 14 total reference antibodies in a single well. Competitive binding profiles of the seven benchmark antibodies revealed good diversity, as expected from the Octet data ( Fig. 6A ). The two antibodies that binned together (1E3.1 and 2E1.1) have identical binding profiles but differ in their magnitude, as we have seen in previous examples. When the correlation heat map for the benchmarks was generated and the bins assigned, they matched the Octet bin assignments, demonstrating the accuracy of this binning assay ( Fig. 6B ). These data were obtained in a seven-well screen, unlike the Octet, which required a 49 (7 × 7)-well screen, highlighting the throughput advantage of our epitope binning method. Bins A, B, and C have related epitope space and are likely overlapping, as seen with the similar correlation values. Likewise, bin D and F antibodies appear to occupy similar epitope space, and bin E antibodies 1E3.1 and 2E1.1 have a correlation value of nearly 1, indicating they have identical epitopes, matching what was seen in their competitive binding profiles. The heat map also suggests that bins D/F and E have some exclusivity to each other by the low correlation values between them, but all have correlation to bins A, B, and C. This suggests that bins A, B, and C are between bins D/F and E in the conceptual epitope space map.
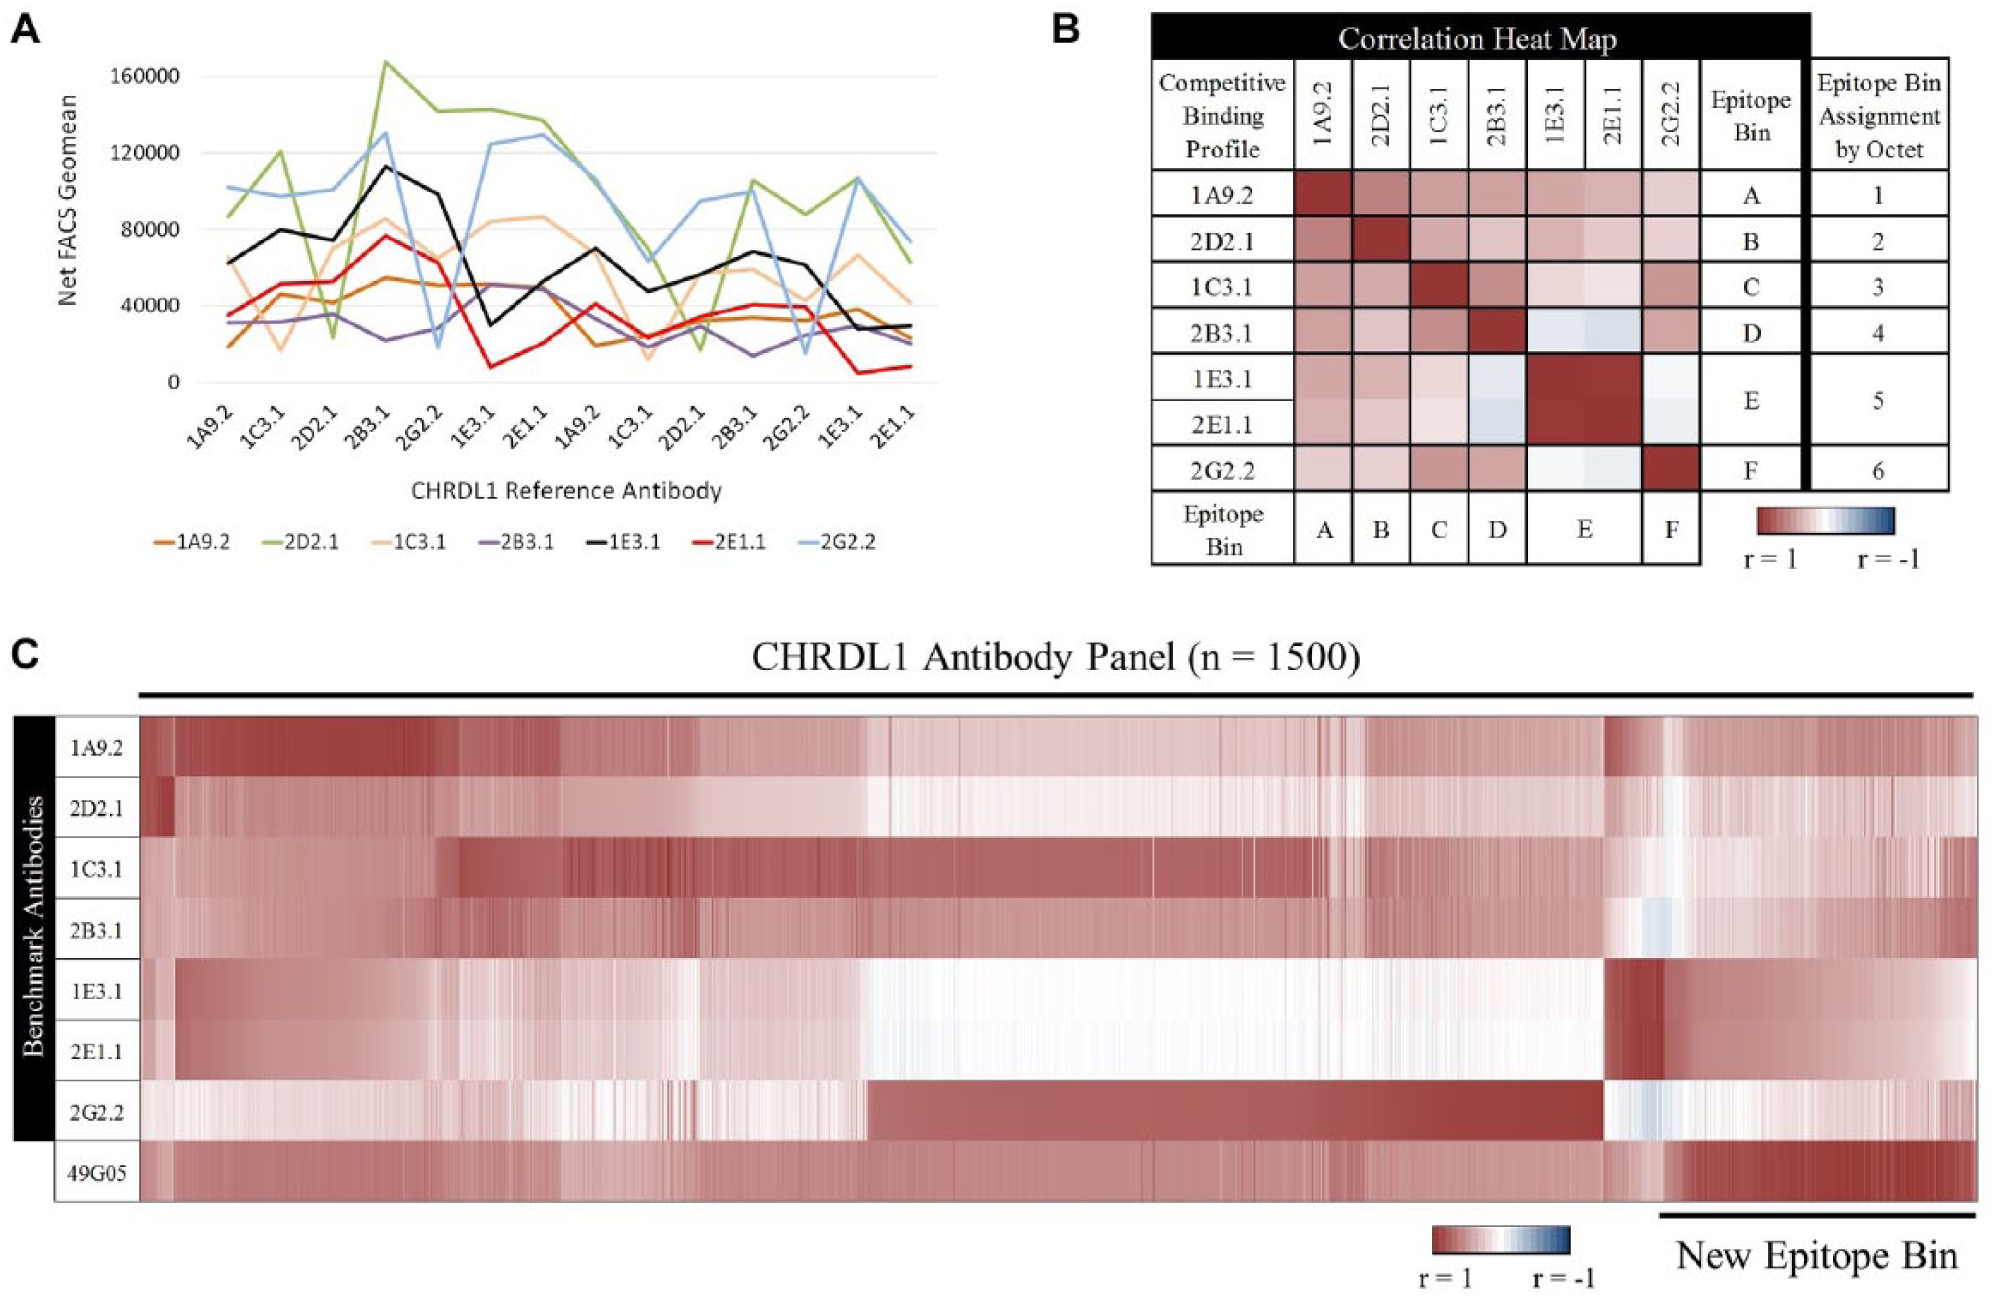
CHRDL1 antibody epitope binning using competitive binding profiles. (
Next, we epitope binned the CHRDL1 hybridoma supernatants. The 1500 competitive binding profiles were generated from the same reference antibody set as described above. Because we were interested in narrowing down the antibody panel on epitope diversity, we first compared all the competitive binding profiles to those of the benchmarks. A large majority of the panel binned with at least one of the benchmark antibodies, as seen by the high correlation values ( Fig. 6C ). Further analysis revealed ~200 unique antibodies that did not bin with the benchmark antibodies even though there was some correlation. Taking one of these profiles (49G05) as an example of this unique bin, we then generated correlation values comparing this profile to those of the panel. This revealed all 200 antibodies binned together and represented a new epitope bin that was not previously represented in the benchmark panel. By using this epitope binning assay, we were able to quickly narrow down a large panel of antibodies on epitope diversity for a variety of functional assays with a focus on this unique epitope bin.
Discussion
Successful therapeutic antibody drug discovery campaigns often involve the screening and characterization of thousands of candidate molecules. Particularly useful in this process are assays that can be applied in a high-throughput manner and require very little sample processing.
In this report, we demonstrated the utility of a novel flow cytometry-based epitope binning assay to rapidly narrow down antibody panels based on epitope diversity, thereby decreasing redundancy for lower-throughput or complex functional assays. In this epitope binning approach, we have integrated common flow cytometry multiplexing techniques, such as cellular barcoding13,14 and spectrally distinct beads, 15 to quickly generate competitive binding profiles. We determined that by comparing an antibody’s competitive binding profile across a series of reference antibodies, and then quantifying the correlation, antibodies can be easily and accurately binned. Epitope binning data generated from this binning strategy compares well with conventional approaches, such as the BLI-based Octet system. Importantly in our analysis, when antibody information is considered, sequence-related lineage information logically clusters with the assigned epitope bins, providing supporting validation to the method.
The degree of accuracy of binning with competitive binding profiles depends on several factors. It is important to consider reference antibody off-rates and the level of binding in order to avoid false binning data. We typically select the best binders as reference antibodies and find that a concentration of 2–5 µg/mL is sufficient to saturate target protein levels on cells or beads. In addition, if there is no epitope diversity within the reference antibodies, all the competitive binding profiles generated will also lack diversity. Conversely, if an epitope-diverse series of reference antibodies are used, they will differentiate antibody panels with finer resolution. In the binning of the MFI2 antibody panel, we had run the assay with three sets of barcoded cells for a total of 18 reference antibodies with unknown epitopes to maximize the reference antibody diversity. If we were to analyze the reference sets separately, we would find three dissimilar competitive binding profiles for each antibody. However, determining the correlation and assigning bins within each reference data set will still cluster the antibodies similar to the other reference sets, but they will differ in the amount of binning resolution. By combining all three reference data sets into one competitive binding profile, we are able to encompass these differences. It is best to employ larger series of reference antibodies if no preliminary discriminating data are available. Furthermore, running a first-pass binning assay, identifying broad epitope bins, and then using representative antibodies as the reference antibodies for a second run will further facilitate finer-resolution epitope binning results. When analyzing very large sets of competitive binding profiles, it can be useful to first determine the correlation of the initial 10–15 antibody profiles against the panel of profiles. In most cases, this strategy will already cluster the majority of the antibodies into major bins. Any profiles that could not be binned initially could then be used to compare with the panel, binned, and then repeated as needed. This stepwise approach to assigning bins facilitates the challenges of working with large panels without the need to determine correlation coefficients in all combinations.
Epitope binning techniques and platforms are continuously evolving. They can range from epitope mapping of an antibody’s binding site to its antigen at high resolution,23,24 to simple ELISA-based competition assays. 25 Techniques such as high-resolution crystallography, which can identify epitopes at the atomic level, and lower-resolution deuterium exchange and alanine/arginine scanning mutagenesis, which can provide information on epitope regions and potential amino acid contacts, 26 are good conventional approaches; however, they come with certain disadvantages, such as being time and labor intensive; require specialized training; and are very low throughput, expensive, and generally reserved for a small number of lead candidates using purified materials. Conversely, newer technologies, such as BLI and SPR platforms, 5 as well as other binning techniques with multiplexed beads, 12 offer broader binning resolution, compatibility with crude antibody samples, and improvements in throughput and capacity. These platforms are still restricted by expensive up-front and consumable costs, are not well-suited for antigen on live cells, and generally evaluate single antibody pair interactions, limiting platform throughput. The epitope binning assay described in this study offers several advantages over other techniques. It is compatible with both membrane and soluble antigens, allowing for examination of antibody binning to antigens in their most native format or to antigens that are difficult to purify as soluble protein. It is also high throughput and more cost-effective because it can easily be multiplexed using commercially available reagents to enhance capacity and takes advantage of HTFC instruments that are less expensive and more commonly accessible in many laboratory settings than other platforms, such as BLI and SPR.
The flow cytometry-based epitope binning assay using competitive binding profiles described herein can be useful in early antibody discovery, especially when discriminating functional assays that are not robust enough to screen large antibody panels. Due to the correlation of an antibody’s function and its epitope,5,6 it can be useful to cluster antibodies by epitope bins and then advance diverse subsets to functional assays. Utility of this binning assay can also be applied to therapeutic modalities, such as ADC or BiTE molecules where a functional epitope is not critical but breadth of epitope diversity is.8–11 By using the relative epitope space information from the correlation values between antibodies, it is possible to strategically identify epitope bins to be tested for synergistic activities 12 and sandwiching antibodies for applications such as receptor occupancy studies 24 and diagnostic tools for many diseases.27,28
Footnotes
Acknowledgements
We thank Judy Shih and Jin Cao for providing the CHRDL1 benchmark antibodies and the Octet epitope binning data, and Arif Jetha and Sophia Peng for technical support.
Declaration of Conflicting Interests
The authors declared the following potential conflicts of interest with respect to the research, authorship, and/or publication of this article: All authors were Amgen employees at the time of study.
Funding
The authors disclosed receipt of the following financial support for the research, authorship, and/or publication of this article: This work was funded by Amgen Inc.