
Abstract
Classical therapeutic regimens are subject to toxicity, low efficacy, and/or the development of drug resistance. Thus, the discovery of synergistic drug combinations would permit treatment with lower, tolerable dosages of each agent and restored sensitivity. We describe the development and use of the SynScreen software application, which allows for visual and mathematical determinations of compound concentrations that produce super-additive effects. This software uses nonlinear regression fits of dose responses to determine synergism by the Bliss independence and Loewe additivity analysis models. We demonstrate the utility of SynScreen with data analysis from in vitro high-throughput flow cytometry (HTFC) combination screens with repurposed drugs and multiplexed synergy analysis of multiple biologic parameters in parallel. The applicability of SynScreen was confirmed by testing open-source data sets used in published drug combination literature. A key benefit of SynScreen for high-throughput drug combination screening is that observed measurements are graphically depicted in comparison with a three-dimensional surface that represents the theoretical responses at which Bliss additivity would occur. These images and summary tables for the calculated drug interactions are automatically exported. This allows for substantial data sets to be visually assessed, expediting the quick identification of efficacious drug combinations and thereby facilitating the design of confirmatory studies and clinical trials.
Introduction
Drug discovery research is progressively moving toward the identification of combinations that interact synergistically by both targeted and unbiased screening approaches. There are multiple motivations for pursuing these efforts. The predominant paradigm is that drug combinations could decrease the incidence of refractory and resistant disease responses to treatment. Off-patent and generic drugs may be repurposed for use in combinations to elicit responses more favorable than their use individually. Recent studies have illustrated the advantages of multitargeted drug combinations that do not have synergistic interactions. 1 However, synergistic drug interactions could potentially reduce the dosages and duration of treatment required for therapeutics with adverse side effects. Furthermore, some hypothesize that the nature of targeted drug interactions may provide an indication of potential crosstalk between biological pathways.2,3 The experimental designs for drug combination studies are fairly straightforward. In these strategies, drugs are tested with concentrations in fixed or nonfixed ratios, and the latter approach may be expanded into matrix or factorial arrays. The analysis of drug combinations used simultaneously or sequentially may provide contradicting outcomes, the results of which could provide insight into the mechanistic nature of the drug interactions.
Drug interactions with respect to synergy are generally determined by the following methods: highest single agent (also referred to as Gaddum noninteraction effect), 4 Bliss independence model, 5 and Loewe additivity model, 6 an application of which is the median effect analysis developed by Chou-Talalay. 7 Additionally, combination data may be compared with single-agent dose responses by isobolograms, combination thresholding, curve shift analyses, or zero-interaction potency.8,9 There are both benefits and disadvantages for each model, and therefore it is practical to use multiple analyses to reliably determine synergism. For in-depth descriptions of these models, their advantages, and constraints, see the review by Foucquier and Guedj. 8
While technology has allowed for high-throughput flow cytometry (HTFC) screening of vast, multiple drug combination testing, there are few resources that facilitate the assessment of high-throughput (HT) results, thus creating a bottleneck for the validation of drug interaction data toward preclinical studies. There is currently a myriad of free (Combenefit, 10 CompuSyn, 11 and MixLow 12 ) and commercial (CalcuSyn, Chalice, and Genendata Screener) software available for drug combination analysis. Refer to Table 1 in Di Veroli et al. 10 Fortunately, most such applications provide analyses by multiple means. However, one limitation of evaluating HT drug combination data is the means by which the data are displayed, typically in tables or two-dimensional graphs.13,14 The visualizations of such drug combination analyses are unintuitive and require thoughtful assessment prior to the determination of specific compounds and concentrations that will be pursued in confirmatory assays. This is especially problematic for drug combinations tested in matrices, wherein some of the breadth of the results can be lost with two-dimensional representations. Consequently, response surface approaches have proven useful to display results of matrix combination testing. 9 Nonetheless, many of these common methods require that the user view single-agent or predicted noninteraction responses separately from observed drug interaction data.
Synergistic Effects of the Repurposed Compound, Clioquinol, Combined with a Conventional Cytotoxic Drug, Cytarabine.
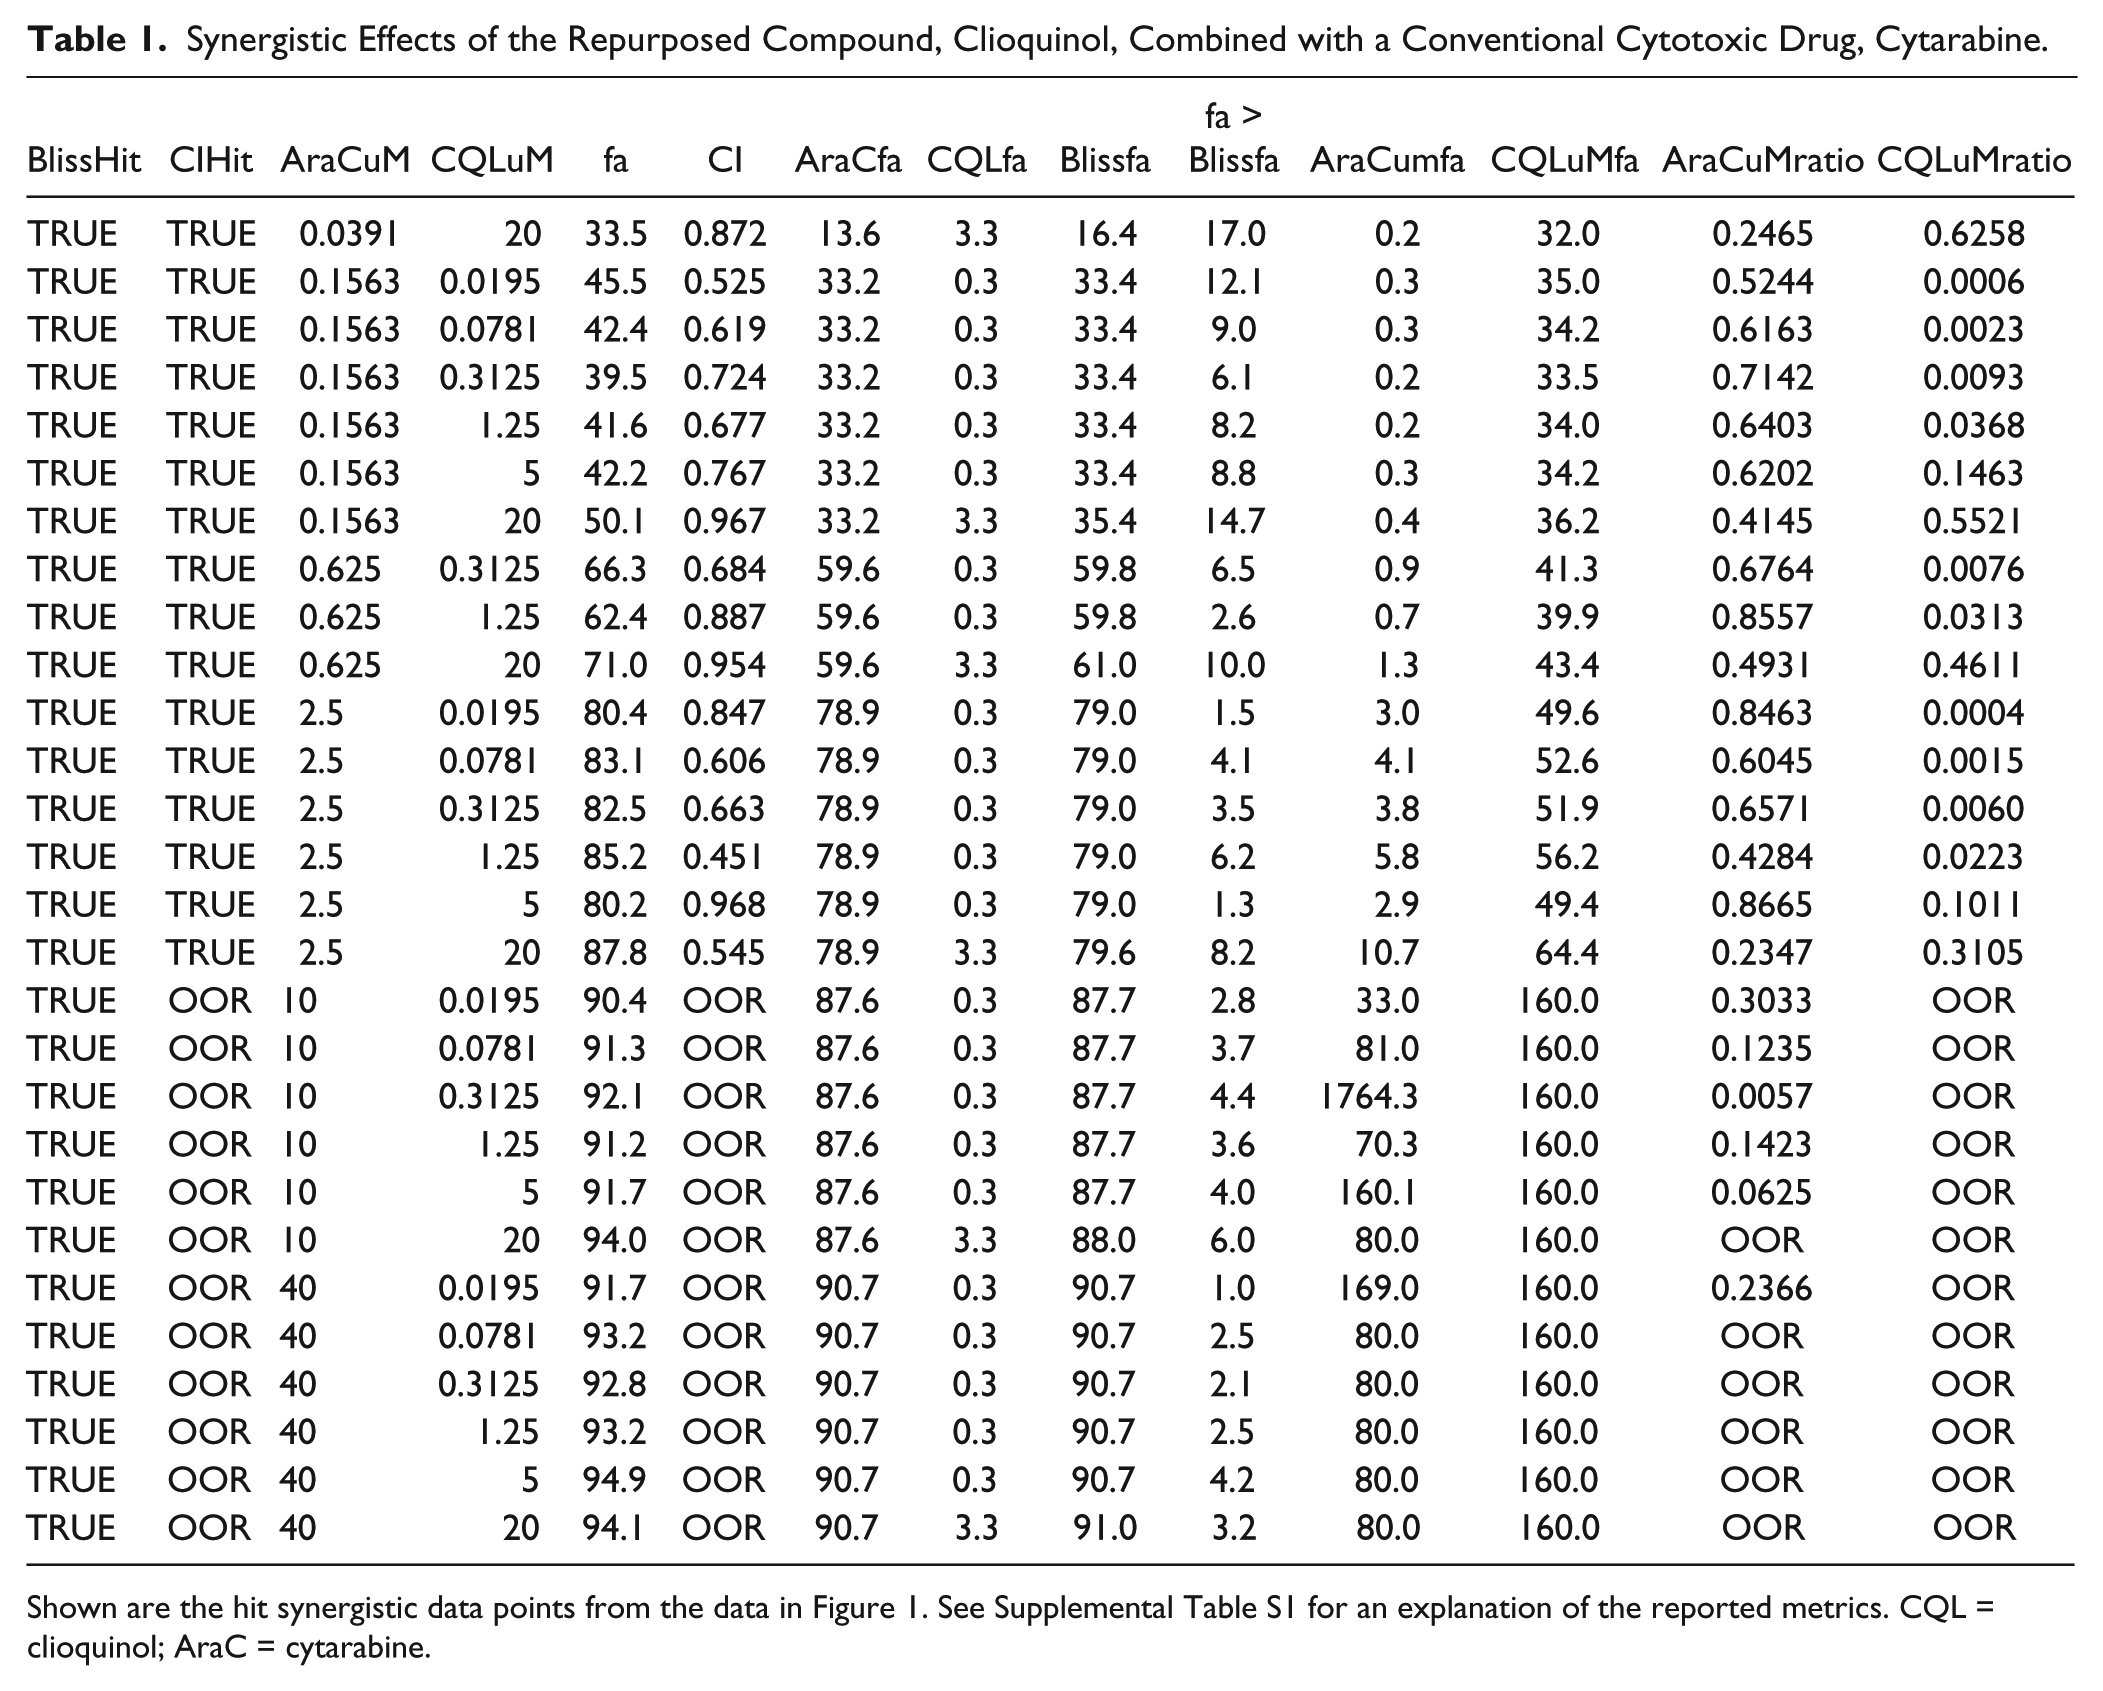
Shown are the hit synergistic data points from the data in Figure 1. See Supplemental Table S1 for an explanation of the reported metrics. CQL = clioquinol; AraC = cytarabine.
SynScreen facilitates the assessment of drug combination effects from an HTFC screen. U937 acute myeloid leukemia cells were screened in 384-well plates with five repurposed drugs
15
paired with five known chemotherapeutics in 64-well arrays, totaling 25 drug pairs. After 48 h incubation, cell viability was assessed with an HTFC PI assay.
16
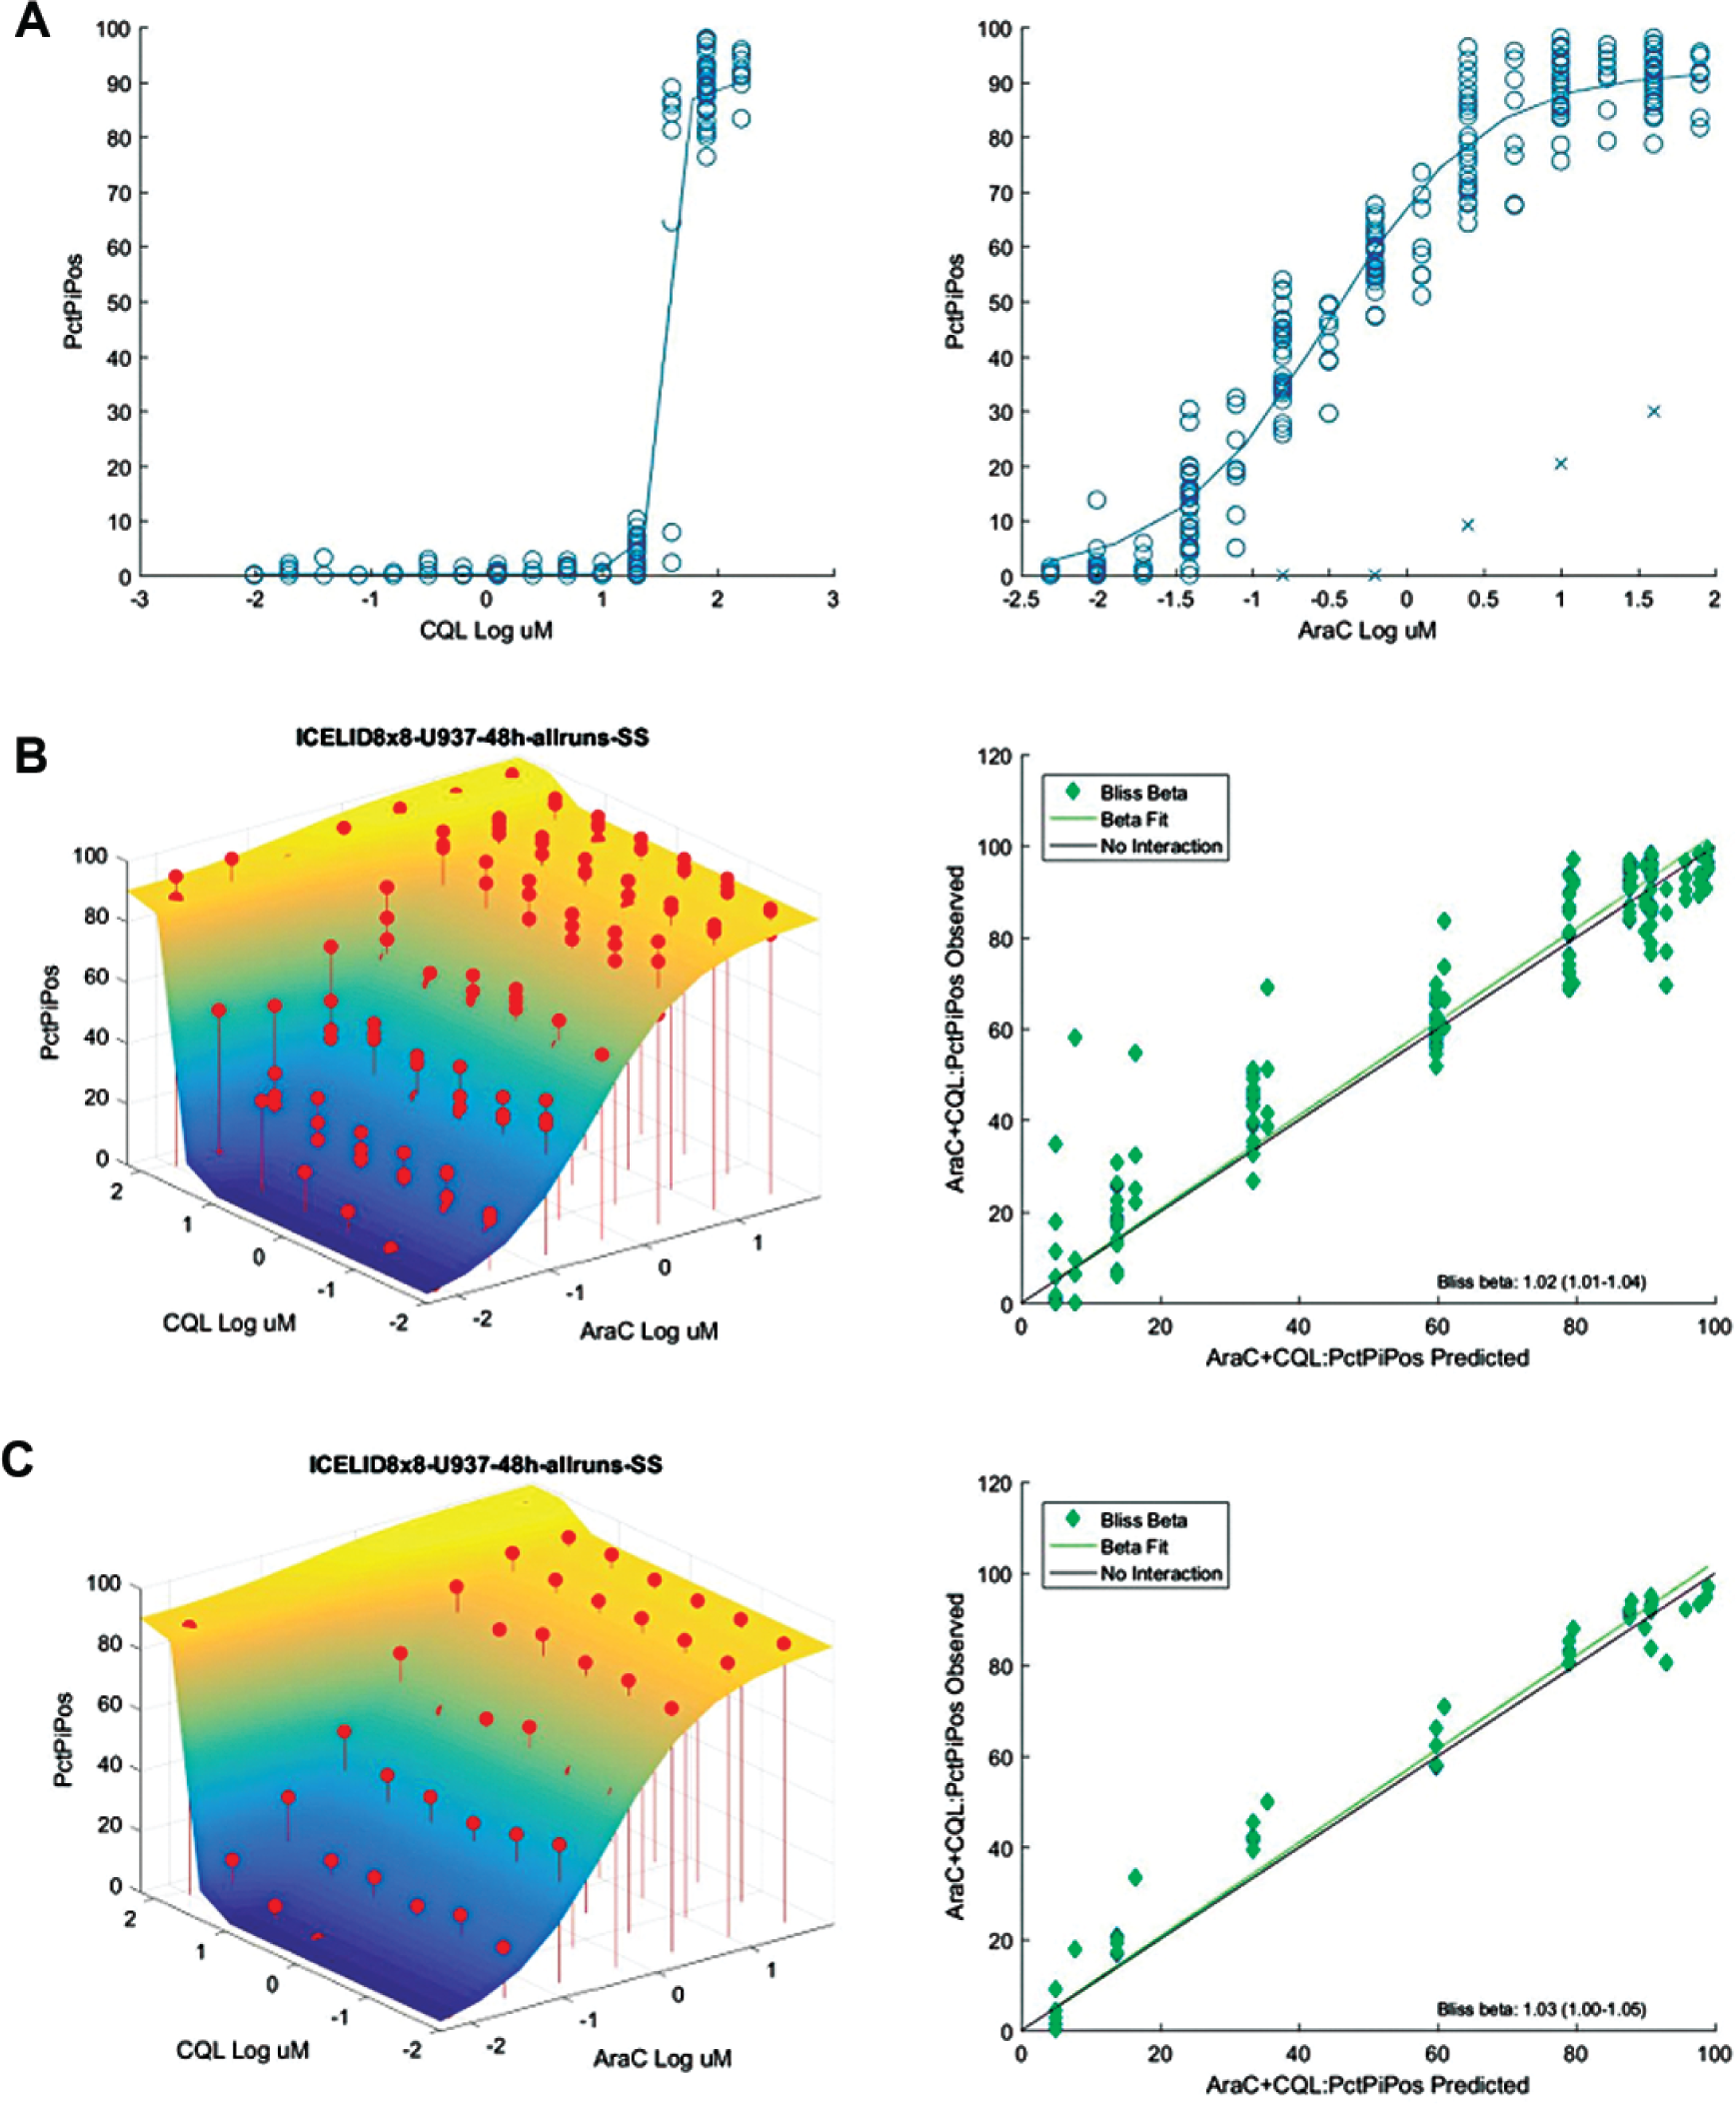
The .fcs data were analyzed with HyperView software and the normalized percent PI-positive data from four independent experiments were imported into SynScreen. Shown is an example of one drug pair tested, clioquinol (CQL) and cytarabine (AraC). (
Here, we introduce a novel application for drug combination analysis that is especially useful for the implementation of HTFC data, SynScreen (https://github.com/bestwards/FlowProg). An unlimited amount of normalized assay data from single or multiple screening runs can be imported and analyzed by multiple drug interaction models. The results are plotted in real time and provide three-dimensional simultaneous visualizations of both observed single and combination drug responses in comparison with a response surface that corresponds to a theoretical threshold of additivity. These graphics are automatically exported and can be collated to allow for the quick assessment of synergy, thus expediting the process of triaging hit drug combinations for further confirmatory assays.
Materials and Methods
Development of the SynScreen Application
SynScreen was implemented as a graphical user interface (GUI) package to be used within MATLAB software (Mathworks, Natick, MA). The software is available for download at https://github.com/bestwards/FlowProg.
Data Normalization and Curve Fitting
Two models were used to evaluate the possibility that a combination of two compounds resulted in a response that was additive, greater than additive (synergistic), or less than additive (antagonistic). Both models rely on nonlinear curve fits to dose–response data produced by single compounds.
First, response data were normalized to controls such that the negative control produced the minimum response (e.g., 0% cytotoxicity in the presence of DMSO-containing diluent alone) and the positive control represented the expected maximal response (e.g., 100% cytotoxicity):
in which DRUGXfa, ncntrlfa, and pcntrlfa are the fractional responses observed in the wells containing test compound, negative controls, and positive controls, respectively. Note that SynScreen assumes that the data will be normalized such that responses will increase with increasing compound concentration. If compounds are expected to inhibit the assay response, then
Normalized responses < 0 were recoded as 0 prior to curve fitting.
Curves were fitted with MATLAB software using nonlinear least squares regression in a sigmoidal dose–response model, the four-parameter logistic equation, in which the top, bottom, and slope of the fitted curve were allowed to vary.
Bliss Independence Model Calculations
The Bliss independence model assumes that the effects of compounds are probabilistic processes in which the activity of each compound is independent of the other, but each contributes to a common result. The additive effects of two compounds are thus predicted by the equation
in which DRUG1fa and DRUG2fa are the normalized fractional responses produced by compounds 1 and 2 acting as single agents (determined from curve fit equations) and Blissfa is the observed fractional response resulting from the two in combination. MATLAB software was used to create a three-dimensional surface representing the response predicted for each combination as if it were additive according to the Bliss independence model. Responses to individual combinations projecting above the surface were considered greater than additive (potential synergy) and below the surface less than additive (potential antagonism). A global combination response parameter, the Bliss beta coefficient, was also calculated as the slope of a linear least squares fit to the predicted (x axis) versus observed (y axis) responses for all combinations. Data normalized as described above (response increasing with increasing compound concentration) will result in a beta coefficient > 1 indicative of synergy, < 1 indicative of antagonism, and equal to 1 indicative of additive effects. Curve fit statistics were also used to estimate a 95% confidence interval for the Bliss beta coefficient.
Loewe Additivity Model
The Loewe additivity model assumes the dose equivalence principle in which, for a given response produced by a dose of compound 1, there is a dose of compound 2 that can produce the equivalent response. The model predicts the following relationship if the effects of two compounds are additive:
in which DRUG1uM and DRUG2uM are the actual doses (uM) of compounds 1 and 2 used in combination, and DRUG1uMfa and DRUG2uMfa are the doses of compounds 1 and 2, when applied as single agents, that are required to attain the response produced by the combination. The latter two dose parameters are calculated using coefficients from the single-agent dose–response curve fits. The sum of the two dose ratios is referred to as the combination index (CI). A CI < 1 is indicative of synergy and CI > 1 of antagonism. CI = 1 is considered additive.
The Loewe additivity model is best applied to compounds that produce dose–response curves with parallel slopes and equal individual response maxima. However, it is often the case that there will be a regime of combinations in which the response produced by the combination cannot be reproduced by the compounds when applied as single agents (e.g., when response maxima of either or both of the compounds are limiting). In such a case, a CI cannot be calculated and is designated as out of range (OOR). SynScreen displays the CI, as well as components of the CI calculation, in the results table, including doses used (DRUG1uM, DRUG2uM), single-agent doses required to produce the observed combination response (DRUG1uMfa, DRUG2uMfa), and the dose ratio of each compound (DRUG1uMratio = DRUG1uM/DRUG1uMfa, DRUG2uMratio = DRUG2uM/DRUG2uMfa) (
HTFC Assays and Data Collection
Unless otherwise noted, the compounds and reagents were purchased from Sigma-Aldrich (St. Louis, MO). The leukemia cell lines U937 and RS4;11 were acquired from ATCC (Manassas, VA). These cell lines were cultured in RPMI-1640 medium supplemented with 2 mM
Preparation of Data for SynScreen Analysis
The preparation of data files for import into SynScreen is similar to methods used by most HTFC laboratories. After an HTFC assay, the data are exported in Flow Cytometry Standard (fcs) format and analyzed on the basis of air gap-dependent interruptions in the temporal flow of cells to identify the wells from which the cells were sampled.
17
Once the data are annotated for the contents and concentrations in each well, the observed response values are then normalized in comparison with responses recorded from cells in control wells. We generally normalize our data such that the mean percent viability of cells in wells containing diluent alone (e.g., DMSO) for each assay plate equals 100% viability for the compound-treated samples. The normalized data are organized in a Microsoft Excel spreadsheet containing four columns that describe the nature of the drugs and concentrations tested: (1) agent/combo IDs, (2) concentrations tested for DRUG1, (3) concentrations tested for DRUG2, and (4) response (
SynScreen Software Determination of Drug–Drug Interactions in HTFC Data
SynScreen analysis begins with entering the range of data within the spreadsheet file that is then imported into the software (
For each drug combination, a three-dimensional surface is generated based on the Bliss prediction of additivity from the single-agent dose responses ( Fig. 1B , C left). Observed data for a combination are plotted, and either the average from repeated measures or all points from each run may be displayed. The three-dimensional graphs may be rotated within the application interface to allow for better viewing of the observed data. This is especially helpful for the visualization of data with efficacies below the Bliss surface. Moreover, SynScreen mathematically determines a global combination response parameter, the Bliss beta coefficient, calculated as the slope of a linear least squares fit to the predicted (x axis) versus observed (y axis) responses for all combinations ( Fig. 1B , C right). A Bliss beta coefficient > 1 is indicative of synergy, < 1 indicative of antagonism, and equal to 1 ( Fig. 1B , C black line) indicative of additive effects. Curve fit statistics were also used to estimate a 95% confidence interval for the Bliss beta coefficient ( Fig. 1B , C right). Data points for single drugs and drug combinations can be reversibly excluded from the analysis in real time to evaluate, for example, the effects of removing statistical outliers.
The analyzed data are automatically saved and exported by SynScreen. The images for each combination’s three-dimensional response data and Bliss/noninteraction threshold evaluations are exported as individual files. A summary .docx file is generated that contains statistics for all screened drug combinations contained in the imported data file, providing a basic overview of the number of synergistic data points determined by Bliss independence and CI analyses ( Suppl. Table S3 ). Supplemental Table S3 provides an overview of all combinations analyzed in a data set and facilitates the identification and ranking of drug pairs and their resultant interactions from a screen. Furthermore, for each drug combination, SynScreen tabulates metrics for all potentially synergistic data points, and it annotates (1) the method(s) by which synergism was determined (Bliss and/or CI), (2) the doses of each agent that interacted synergistically, (3) the differences between the observed effects and theoretical values for Bliss additivity, (4) the ratio of the concentration used in a combination relative to the single-agent concentration that elicited the same response, and (5) indications of combinations for which the Loewe additivity model CI is not applicable due to combination responses OOR relative to single-agent dose–response curve fits (see Materials and Methods, Table 1 , Suppl. Table S4 ). For each drug pair, SynScreen automatically creates .docx files containing the data response graph and a table with the aforementioned metrics for each data point tested, as well as .jpg files of the three-dimensional and Bliss threshold plots.
Validation of Synscreen and Application to Other Screening Platforms
Normalized dose–response and combination data were obtained from the drug combination study published by Borisy et al. 18 There, compounds were tested in 10 × 10 matrices in 384-well plates and analyzed for inhibition of cell proliferation. For integration into SynScreen, the data were organized into a Microsoft Excel spreadsheet with columns (see above, Suppl. Fig. S1 ).
Results and Discussion
Validation of SynScreen Analysis for HTFC Assays
We previously identified a set of repurposed drugs with activity against leukemia cells.
15
To progress the research forward, we elected to test these drugs pairwise with known leukemia therapeutics. Hence, we adapted an HTFC viability assay
16
to quantify the effects of the 25 drug pairs tested in 64-well matrix arrays. The normalized data from four independent experiments were combined and imported into SynScreen for analysis. Data from one drug combination, clioquinol and cytarabine, are shown in
Figure 1
. The dose–response data for the individual drugs were fit by nonlinear regression, and outliers were removed to improve the fits (
Fig. 1A
). Furthermore, the reproducibility of the data from multiple biological replicates was evaluated by the proximity of observed responses to one another (
The utility of SynScreen for the analysis for multiplex HTFC drug combination assays was also tested with data from an assay wherein drug pairs were tested in fixed-concentration-ratio dose responses to identify the outset and order of cell death responses induced by the compound interaction. SynScreen analysis was able to determine synergism between the repurposed agents cryptotanshinone and vardenafil within the four apoptosis endpoints collected by flow cytometry data ( Fig. 2 ). Hence, the use of SynScreen for the evaluation of drug combinations tested via HTFC by multiple assay approaches (fixed ratio, matrix, and multiplex) was validated. The results allowed for an effective visual assessment of the tested combinations and the identification of efficacious drug pairs and concentrations. This feat would not have been easily accomplished through analysis by other software applications, which would have required considerable reformatting of HTFC data prior to analyses. While we report here the use of SynScreen for phenotypic flow cytometry assays, the analysis capabilities should be applicable for functional assays as well.
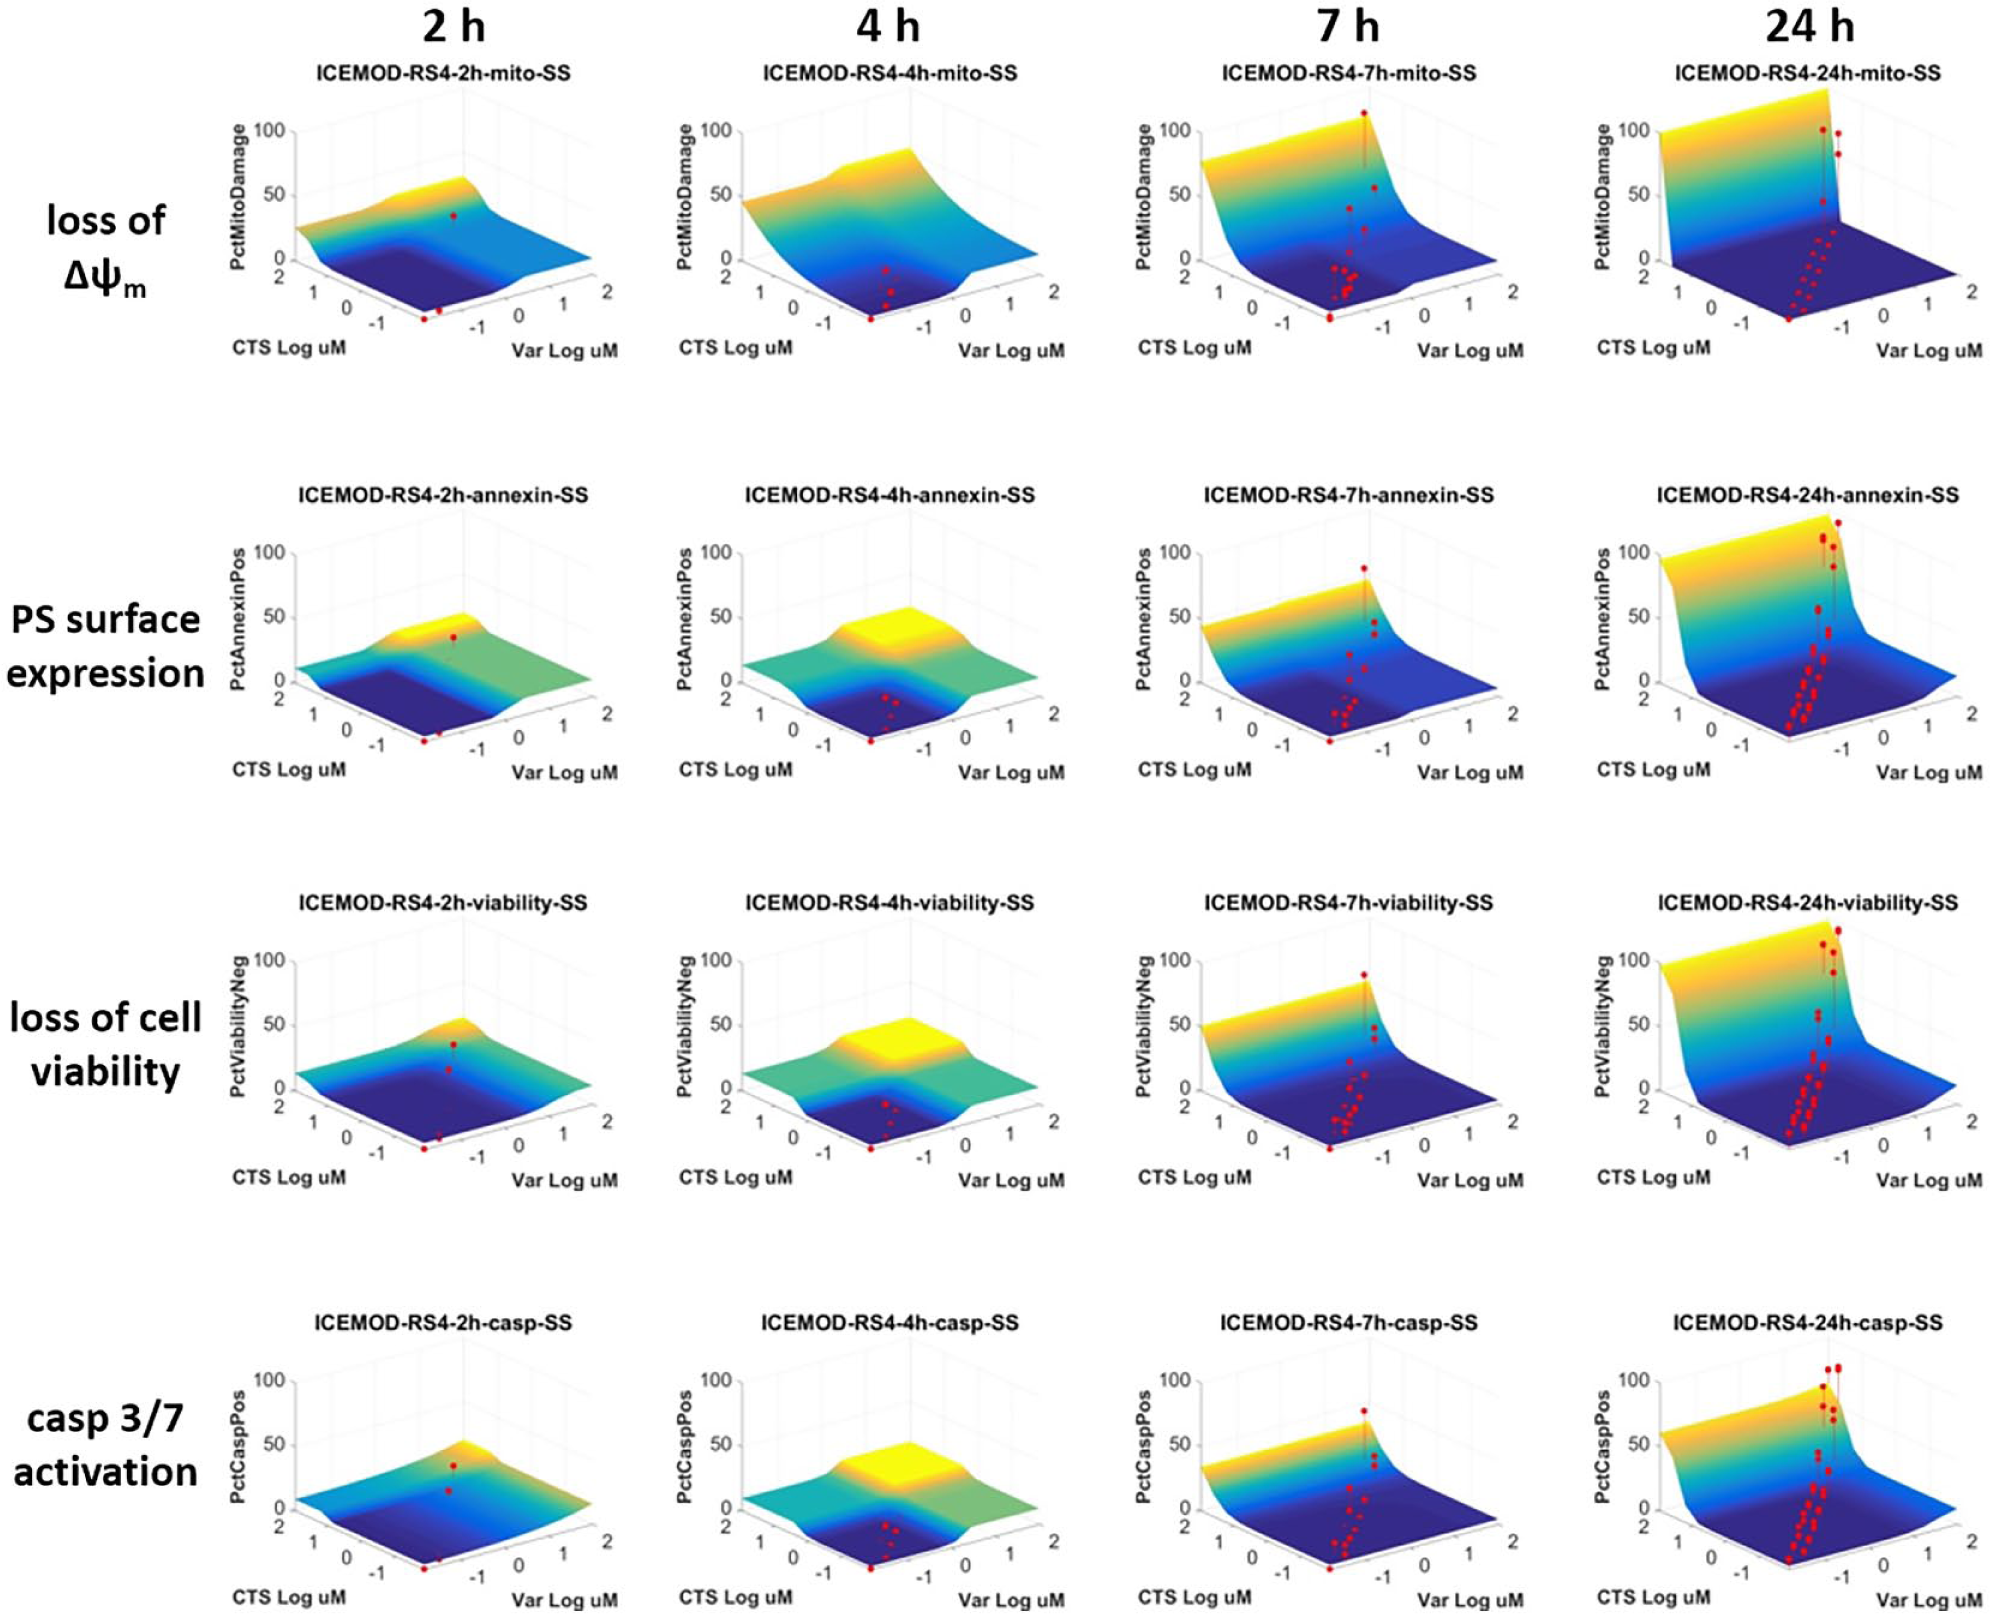
An example of SynScreen analysis of multiplex HTFC drug combination data. RS4;11 cells were screened in 384-well plates with the drug pair cryptotanshinone (CTS) + vardenafil (Var) tested in duplicate with 1:1 and 1:2 fixed ratios and incubated for multiple time points before conducting the MultiCyt 4-Plex Apoptosis assay. The .fcs data were analyzed with HyperView software. The multicolor surfaces represent the theoretical effects at which Bliss additivity would occur. The red dots indicate the observed experimental data. The assay determined changes in the apoptotic endpoints’ mitochondrial depolarization (loss of Δψm), annexin-V binding to phosphytidylserine expression on the cell membrane (PS surface expression), caspase 3/7 activation, and cell membrane damage (loss of cell viability) to provide an indication of the order and timing of cell death events induced by the drug combination. The z axes range from 0% to 100% positive responses for each endpoint. Data points visible above the three-dimensional surface approximate the degree of synergy evident for each concentration pair.
Application of SynScreen Analysis to Other Screening Platforms
The utility of the SynScreen application was further evaluated by analyzing a published set of drug combination data wherein synergistic interactions were identified. Data published from a screen for antiproliferative drug combinations by Borisy et al.
18
were imported into SynScreen and analyzed to determine synergistic interactions. We additionally analyzed the data set with Combenefit.
10
The original publication identified 63 responses over Bliss additivism, whereas SynScreen identified 56 points and Combenefit identified 59 points. The sum of the differences between the responses and the predicted thresholds determined by Borisy et al.
18
was 801, and the totals from SynScreen and Combenefit were 522 and 577, respectively. The results of the analyses are shown in
Supplemental Figure S2
. These variations in data between applications are most likely due to the fact that some of the observed response data (percent inhibition) were negative values, and SynScreen converts negative response values to zero prior to analyses. Although SynScreen analysis did not produce results identical to those published, it identified the same drug combination regions in which responses exceeded Bliss additivity (compare
Fig. 3
here to
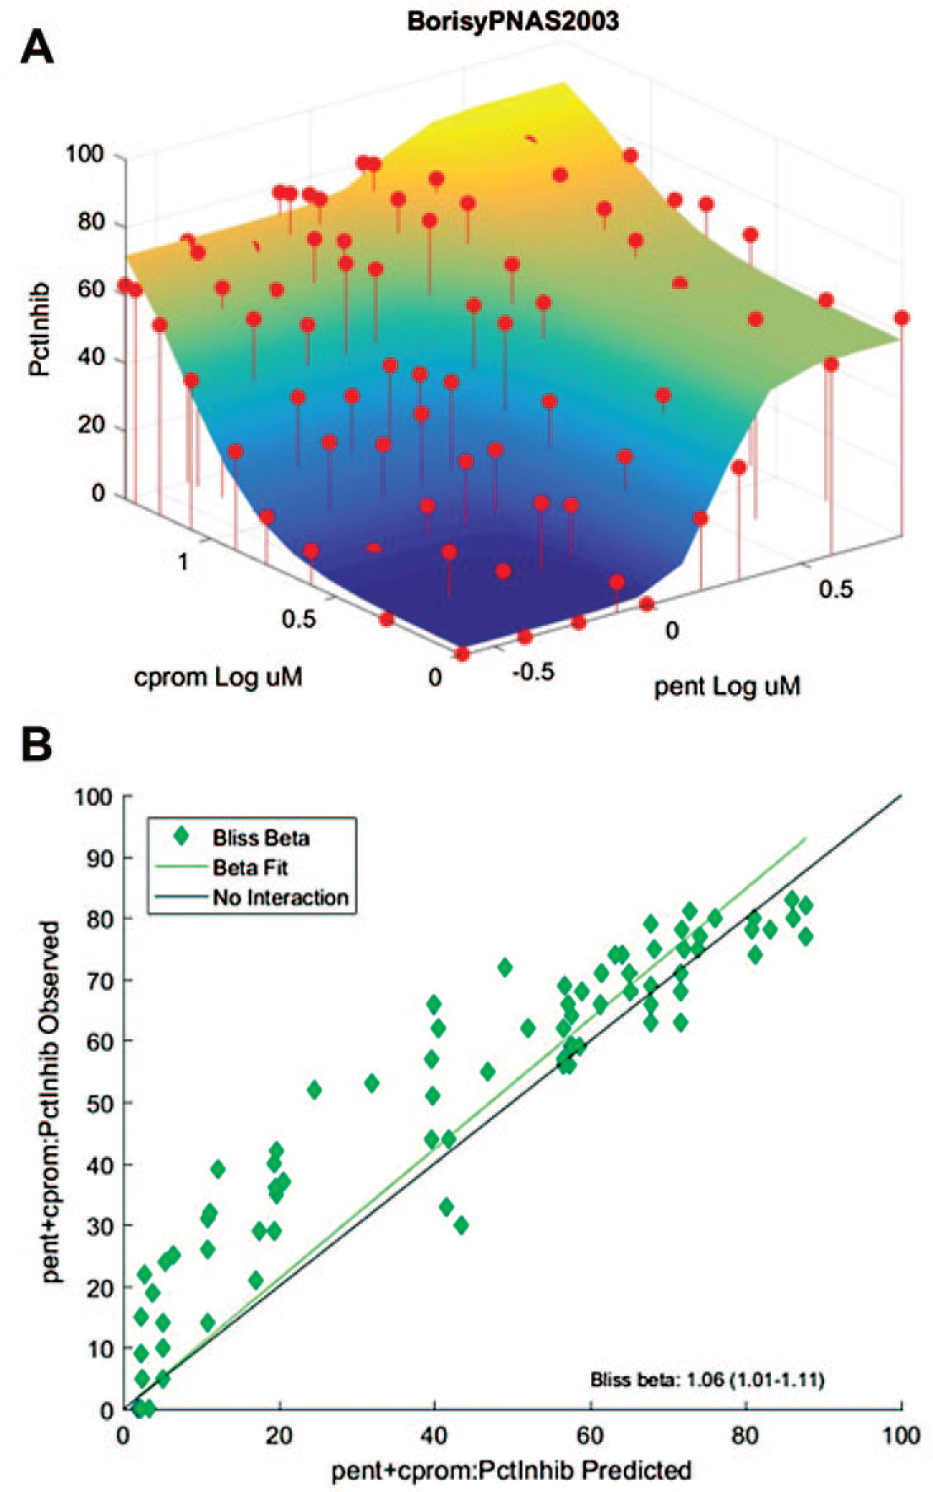
Validation of SynScreen analysis of drug combination effects and the determination of synergy. Single-agent and drug combination data from a published drug combination data set from Borisy et al.
18
were imported into SynScreen for analysis. The resulting graph and software-derived metrics recapitulate the results for synergistic data points that were reported by the original authors. (
SynScreen Facilitates Drug Combination Analysis
A considerable benefit of HTFC is the ability to concurrently assess multiple parameters. Therefore, it is vital that software applications for HTFC data analysis be compatible with data from a variety of assay types and formats. Unfortunately, few adequate applications are amenable for HTFC drug combination data, which must be processed to isolate specific populations and responses for each parameter measured. The annotated data are typically tabulated in list formats, which are not readily suitable for drug combination software packages specifying that data be arrayed in matrices, 10 with responses from each drug positioned in rows and columns. The need to reorganize HTFC drug combination data to use such applications would limit the throughput of data generated from HTFC experiments. Additionally, some drug combination analysis programs stipulate that only data from fixed-concentration ratios be entered. 12 This restricts the breadth of data that can be collected from robust methods such as HTFC. Furthermore, results from drug combination analyses are often presented in two-dimensional diagrams, such as heatmaps, dose–response x,y graphs for each concentration ratio tested, or tables of synergy statistics,13,18 and therefore quick interpretation of the data may not be straightforward.
Using the open-source combination analysis software Combenefit 10 and CompuSyn, 11 we analyzed a selection of our HTFC data from a cytotoxicity assay. The use of both applications required extensive reformatting of the HTFC data. CompuSyn has no limits on the numbers of data points entered for each drug and combination but requires that the response data be converted into fractional form 0-1 before each data point was entered into the software manually. CompuSyn uses linear fits in the median effect plots for individual dose responses, which are not amenable to data with various slopes without the deletion of several data points. Conversely to SynScreen, where normalized data from negative controls are set to the minimum response (e.g., 0%), Combenefit requires that normalized negative control values equal the maximum response (e.g., 100%). The application also necessitates that data be positioned in matrices and is ideal for use with plate reader-based data. Because HTFC data often exist in columns and data from specific drug combinations do not necessarily appear sequentially, it took a considerable effort to reconfigure the data into such matrices. Furthermore, the data from each combination and replicate had to be saved into separate .xls files prior to import into Combenefit. Because synergy analyses rely heavily on comparison of combination versus single-agent data, we collected robust dose responses (more doses and smaller dilution factors) for single agents, in replicate, in our screen. We were unable to enter the replicate data or values from the extended dose–response ranges of the single agents in our data, as the Combenefit software constrains data from individual drugs to match the tested concentrations used in combinations. Neither CompuSyn nor Combenefit allowed for real-time editing of data through their interfaces.
The utility of SynScreen overcomes some of the aforementioned limitations encountered by some drug combination analysis software packages. There is no limitation on the quantity of data imported for analysis, and data from multiple replicates can be incorporated into a single analysis. Furthermore, HTFC data are compatible with a columnar output configuration that can be directly loaded into Excel files to facilitate SynScreen analysis. To expedite data processing, the application interface was developed to enable all aspects of drug combination analyses to be visualized in real time. Because synergism can only reliably be determined by comparison of combination responses to those of each compound alone, it is imperative that researchers use dependable dose–response curves for single-agent responses. Therefore, SynScreen automatically displays single-agent dose responses and nonlinear regression curve fits so that aberrant data points can be excluded to improve the fit of the data ( Fig. 1A ). The application produces visualizations of the data in three dimensions to allow for simultaneous assessment of the combination responses in relation to the individual drug responses and the theoretical threshold of additive interactions ( Fig. 1B , C ). The combination data are analyzed by the Bliss independence and Loewe additivity CI models to validate data points that produce synergy. These metrics, as well as graphical representations of the data, are automatically output into common file formats and can easily be adapted for further data processing and prioritization.
Limitations of the SynScreen Software Application
Like many drug combination analysis applications, SynScreen is currently designed for the analysis of drug pair interactions. The annotated drug concentrations are required to be in micromolar units. Likewise, the imported normalized response data should be recorded in values from 0% to 100% (or 0–1 in fractional form), in which the normalized response increases with drug concentration. Due to this normalization, single-agent dose responses must be tested with enough data points to provide robust curves. The software does allow for data with normalized responses of less than 0% to be present in the source file, although these values are automatically set to equal zero, and thus some dose responses may appear with reduced efficacy ranges. Moreover, the artificial weighting of all negative values to zero may mask noise in these data. One additional limitation of both SynScreen and other commonly used drug combination analysis platforms that determine synergy by classical models is that they do not readily incorporate the influence of potential adverse effects between drugs, and thus the identification of synergistic interactions may not reflect realistic therapeutic windows. 19 However, it should be noted that incorporating these effects also requires extensive testing and validation of reference samples. For the purposes of HT screening, the pragmatic approach would be to identify potential hit drug combinations and ranges and parse these with confirmatory secondary assays.
SynScreen Is an Optimal Application for HTFC Drug Combination Analysis
Here, we have described the development of a novel application for drug combination analysis that is especially useful for HTFC screening data. SynScreen is particularly useful for HTFC drug combination studies because it is amenable to facile analysis of data sets of almost unlimited size. The properties of the drug concentration ratios tested and the quantity of tested wells are unrestricted, permitting that there are sufficient data from the single compounds to produce reliable dose–response curves and fits. A minimum response threshold can be set to filter hits with specific activities. The application generates summary tables that provide an overview of the imported dose–response combination data. These serve to simplify the collation of multiple experimental runs and conditions for comparison analyses. Furthermore, the capacity to import files with screening data from multiple runs allows for a qualitative assessment of assay reproducibility ( Fig. 1 ). Additionally, the drug combination graphs generated by SynScreen also provide a visual approximation of the regions where synergistic drug interactions have occurred. Most data points visible above the surface of the theoretical additivity threshold are mathematically identified as synergistic by Bliss and/or CI models. Hence, HTFC drug combination data may be rapidly evaluated, thus expediting the triage process for screening campaigns.
Supplementary Material
Supplementary Material, Perez_supplemental_Material_final – High-Throughput Flow Cytometry Drug Combination Discovery with Novel Synergy Analysis Software, SynScreen
Supplementary Material, Perez_supplemental_Material_final for High-Throughput Flow Cytometry Drug Combination Discovery with Novel Synergy Analysis Software, SynScreen by Dominique R. Perez, Bruce S. Edwards, Larry A. Sklar, and Alexandre Chigaev in SLAS Discovery
Footnotes
Acknowledgements
The authors would like to thank Anna Waller (University of New Mexico) for help with the data analysis and fruitful discussions.
Supplemental material is available online with this article.
Declaration of Conflicting Interests
The authors declared the following potential conflicts of interest with respect to the research, authorship, and/or publication of this article: B.S.E. and L.A.S. are coinventors of HyperCyt and cofounders of IntelliCyt. D.R.P. and A.C. declare no conflicts of interest.
Funding
The authors disclosed receipt of the following financial support for the research, authorship, and/or publication of this article: This work was supported by funding from NIH Minority Institutional Research Training Program Award No. T32 HL007736 (D.R.P.) and NIH Cancer Center Support Grant CCSG P30 CA118100.
References
Supplementary Material
Please find the following supplemental material available below.
For Open Access articles published under a Creative Commons License, all supplemental material carries the same license as the article it is associated with.
For non-Open Access articles published, all supplemental material carries a non-exclusive license, and permission requests for re-use of supplemental material or any part of supplemental material shall be sent directly to the copyright owner as specified in the copyright notice associated with the article.